Assessment of Sediment Impact on the Risk of River Diversion during Dam Construction: A Simulation-Based Project Study on the Jing River, China


Abstract
:1. Introduction
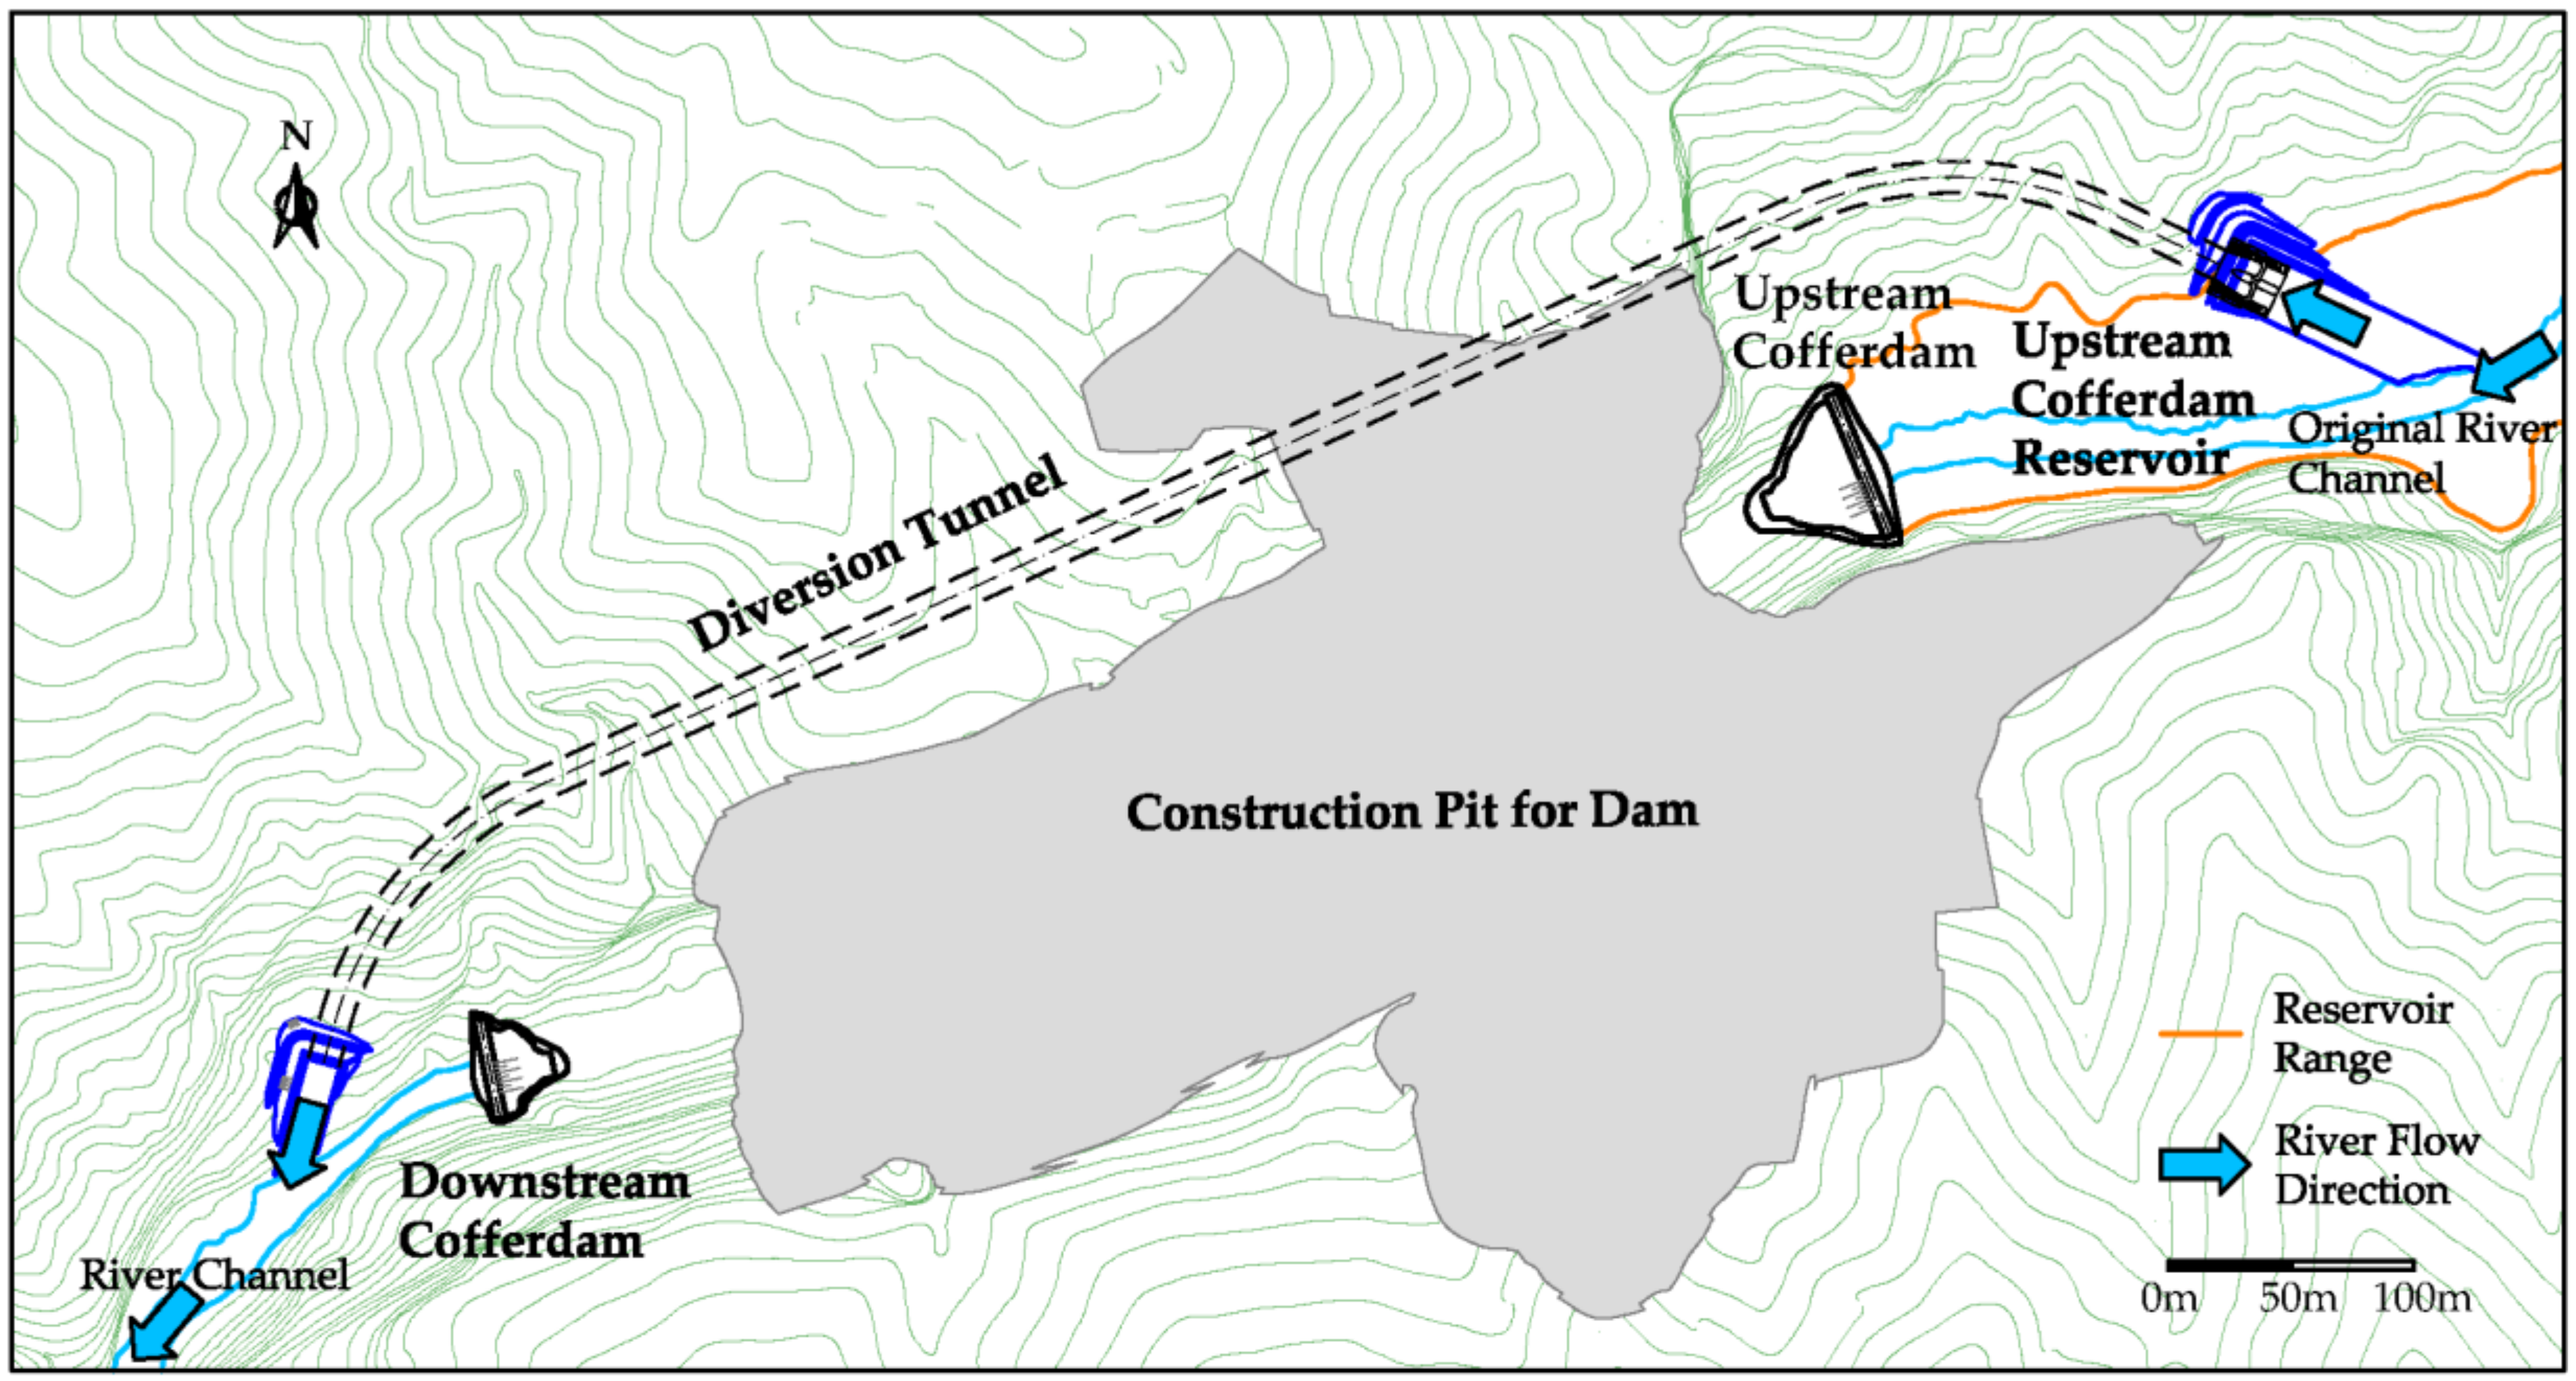
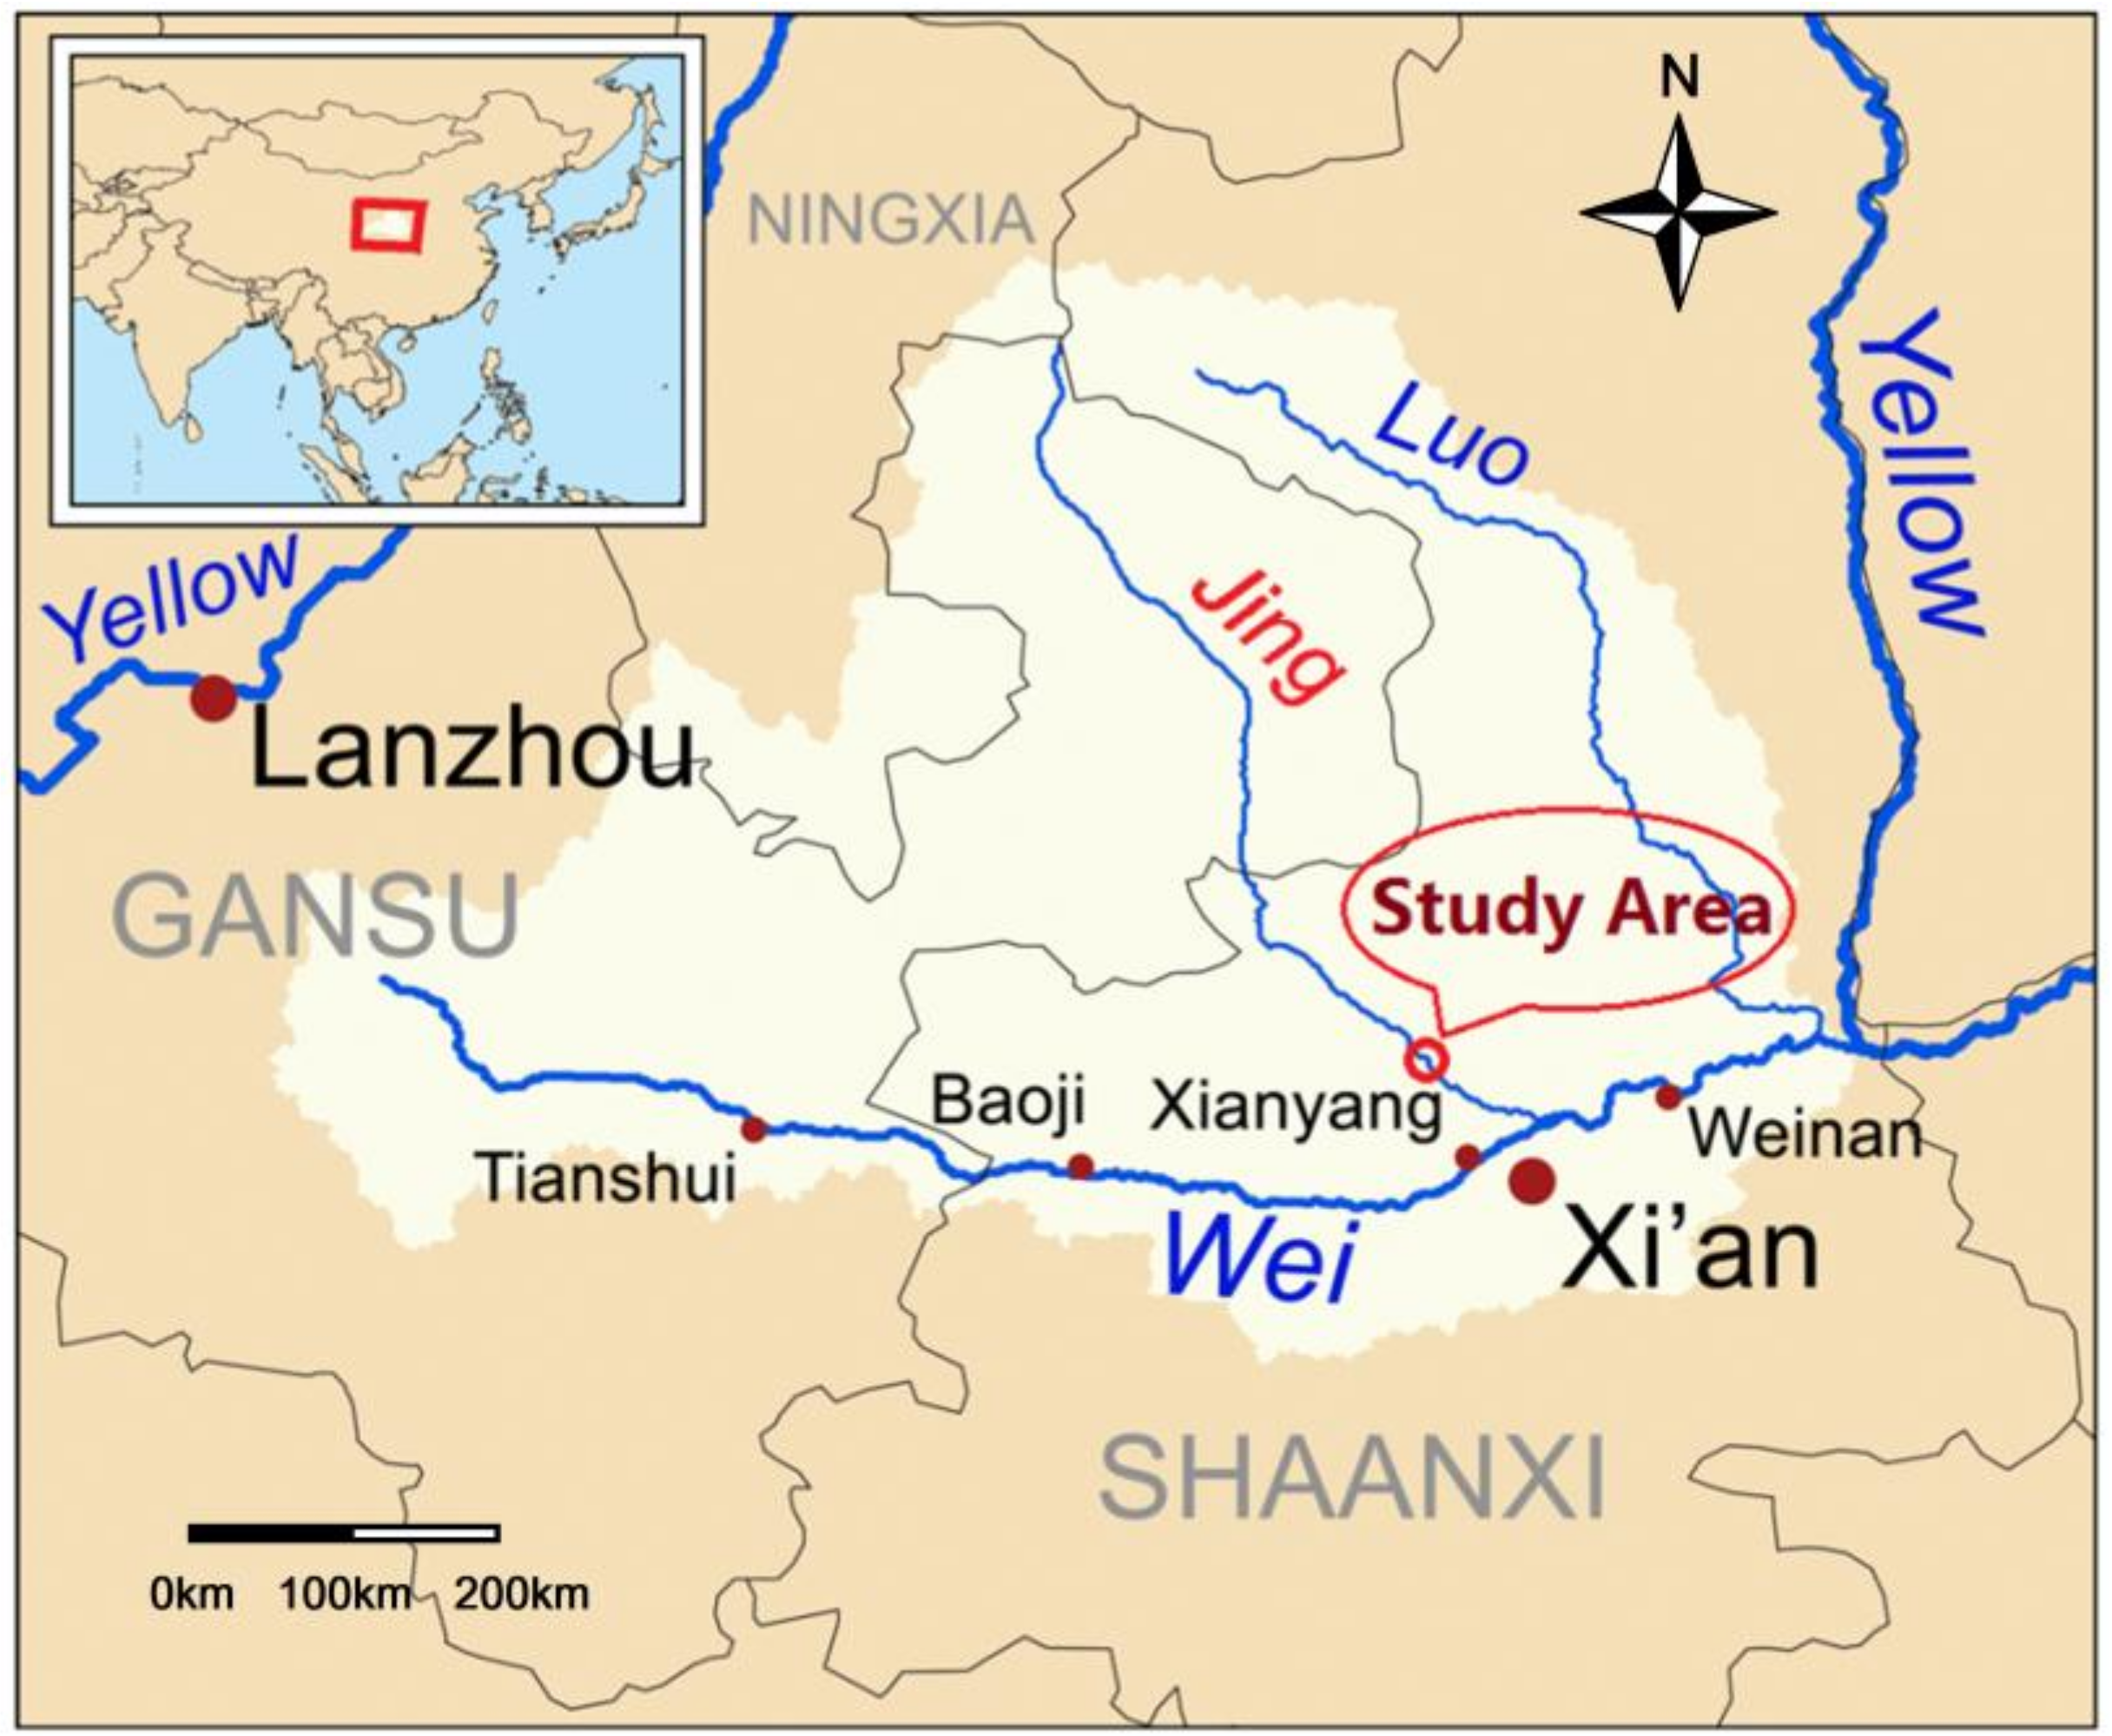
2. Study Area
3. Diversion Uncertainties
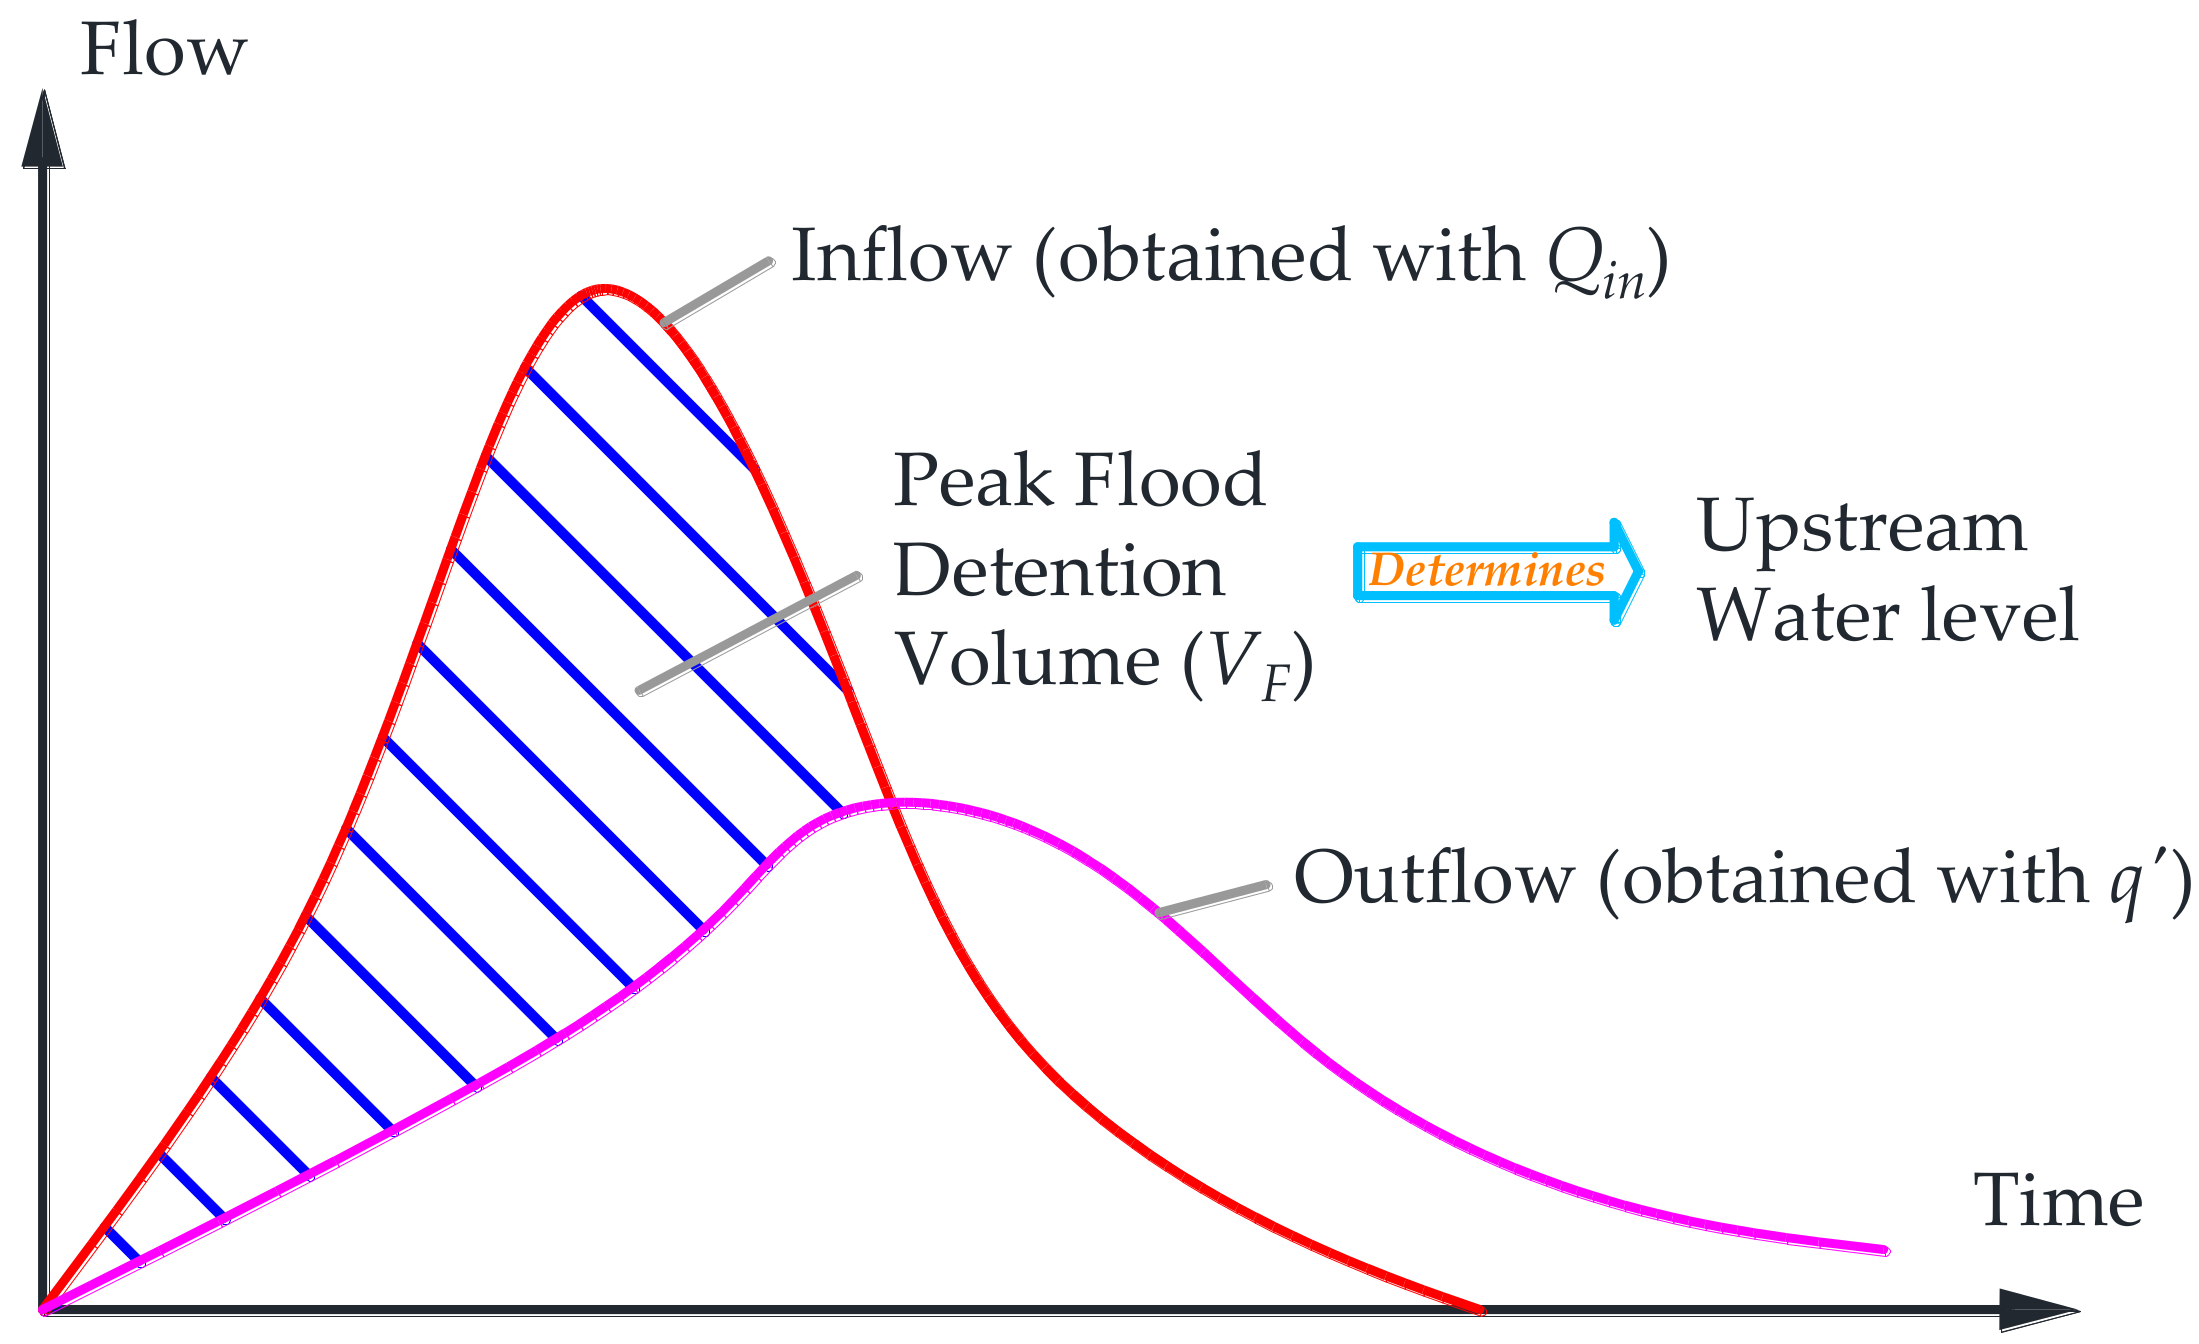
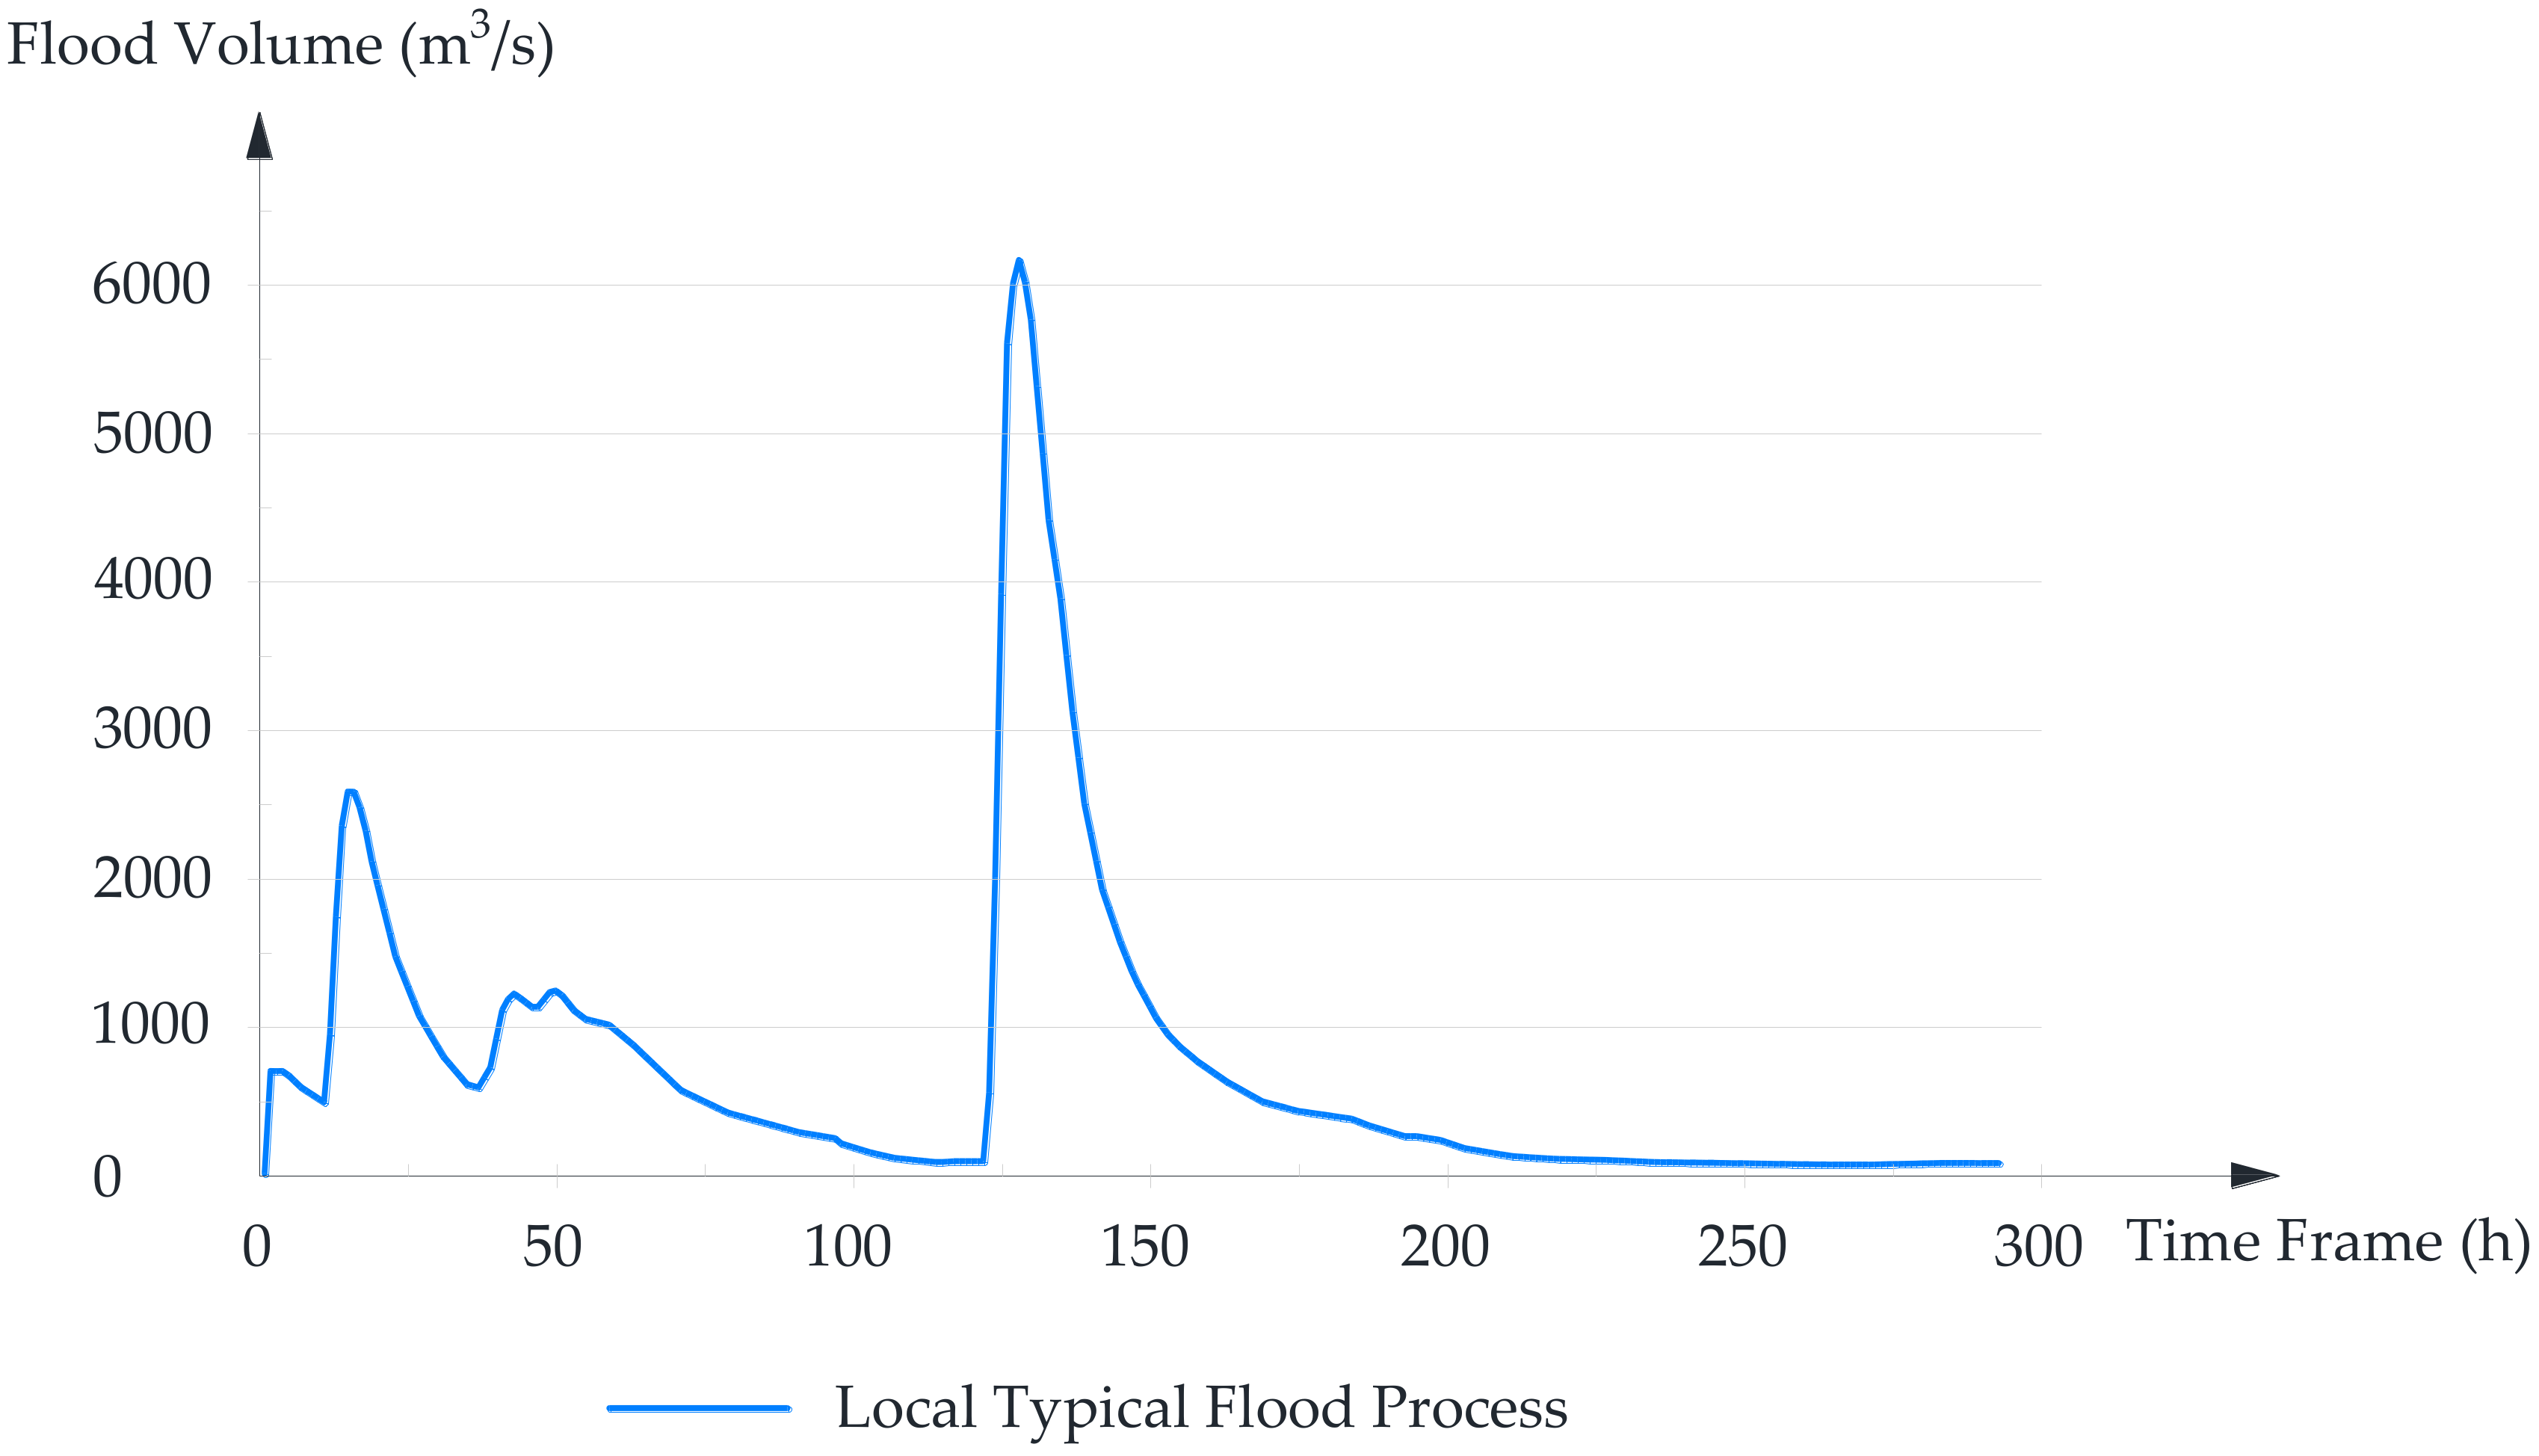
3.1. Flood Uncertainty
3.2. Diversion System Discharge Uncertainty
3.3. Sediment Uncertainty
3.4. Sediment Impact on Diversion System
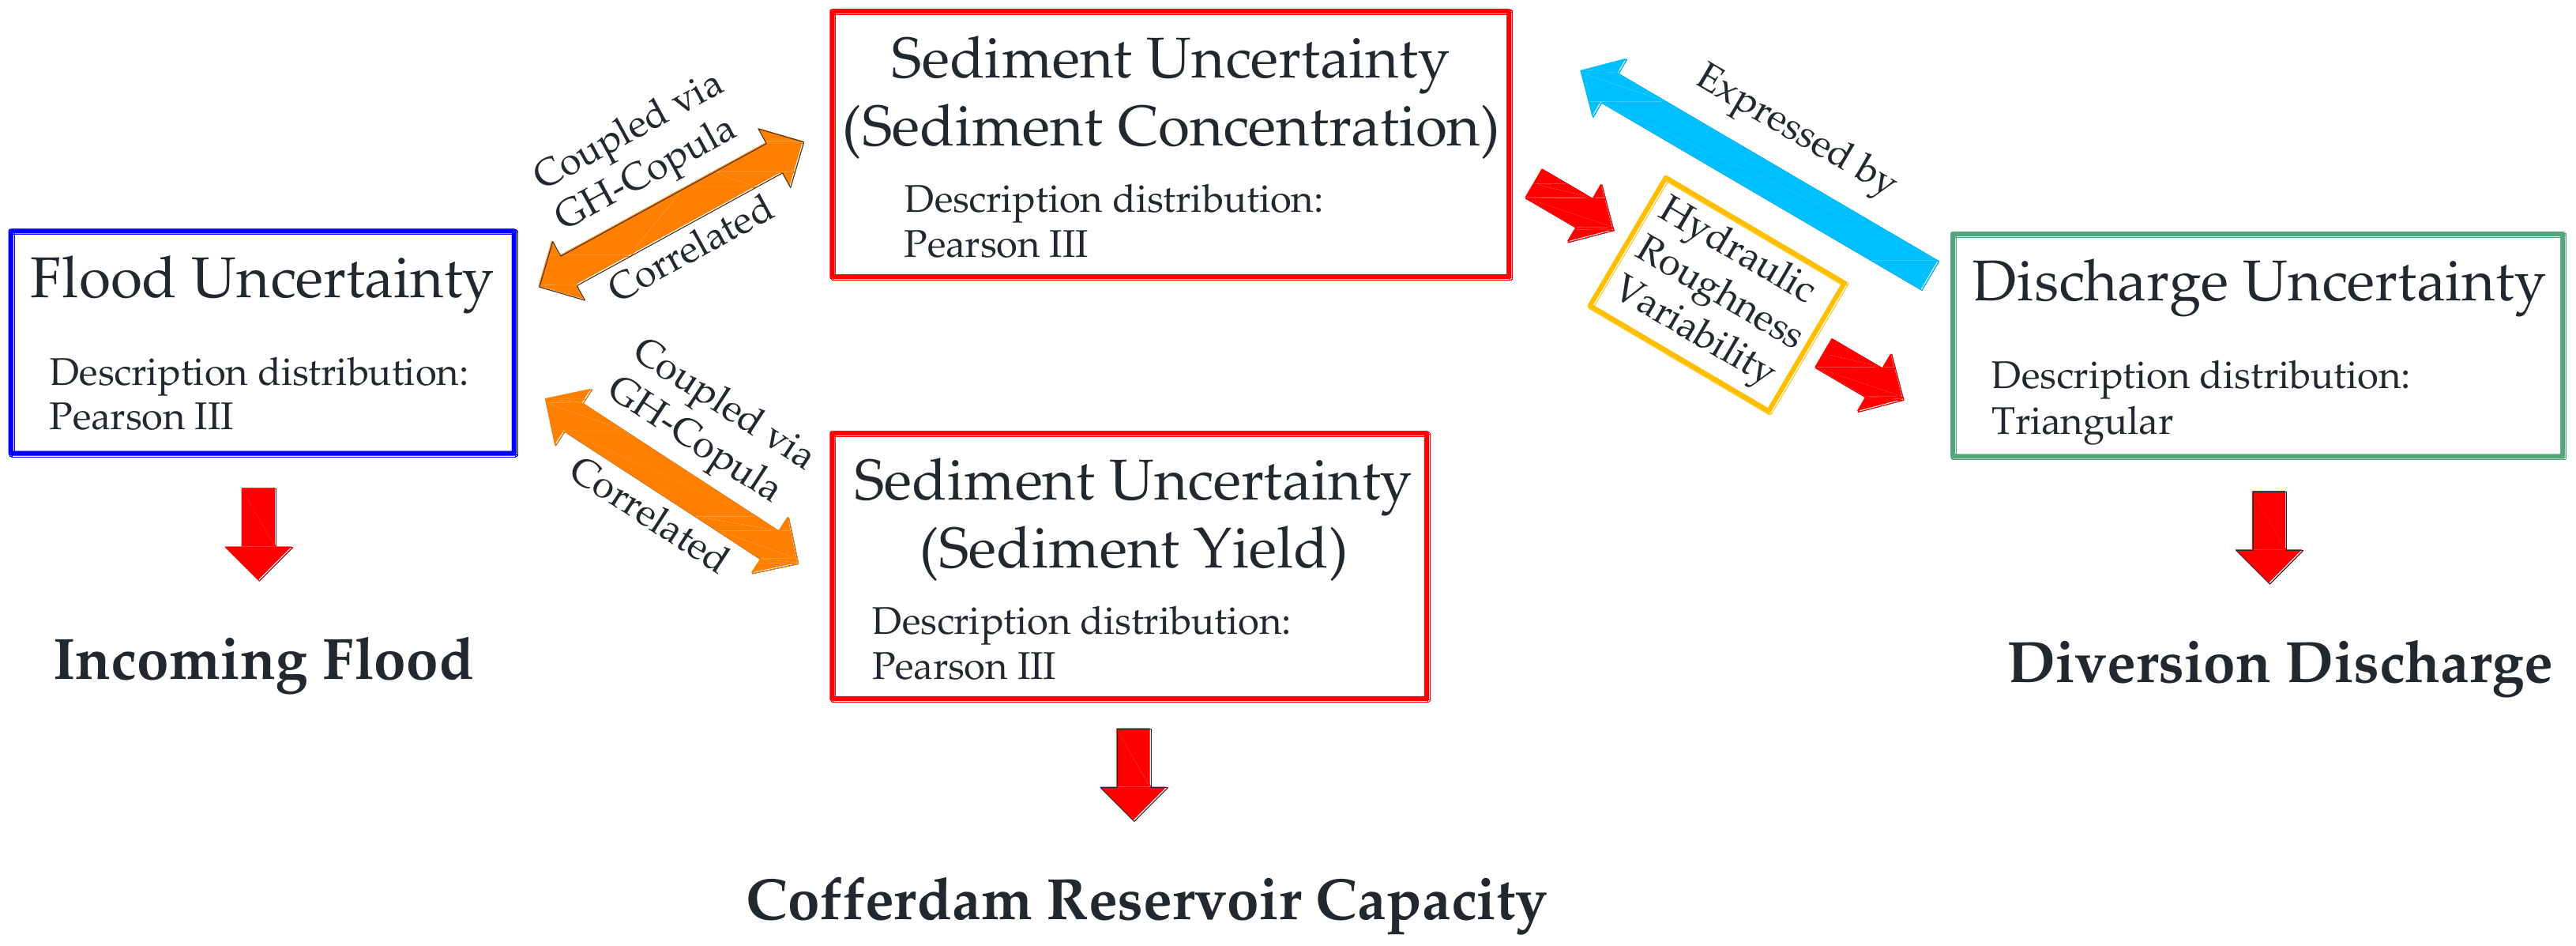
3.5. Coupling of Flood and Sediment Uncertainties
4. Methodology
4.1. Risk Definition of Dam Construction Diversion
4.2. Simulation Method Selection
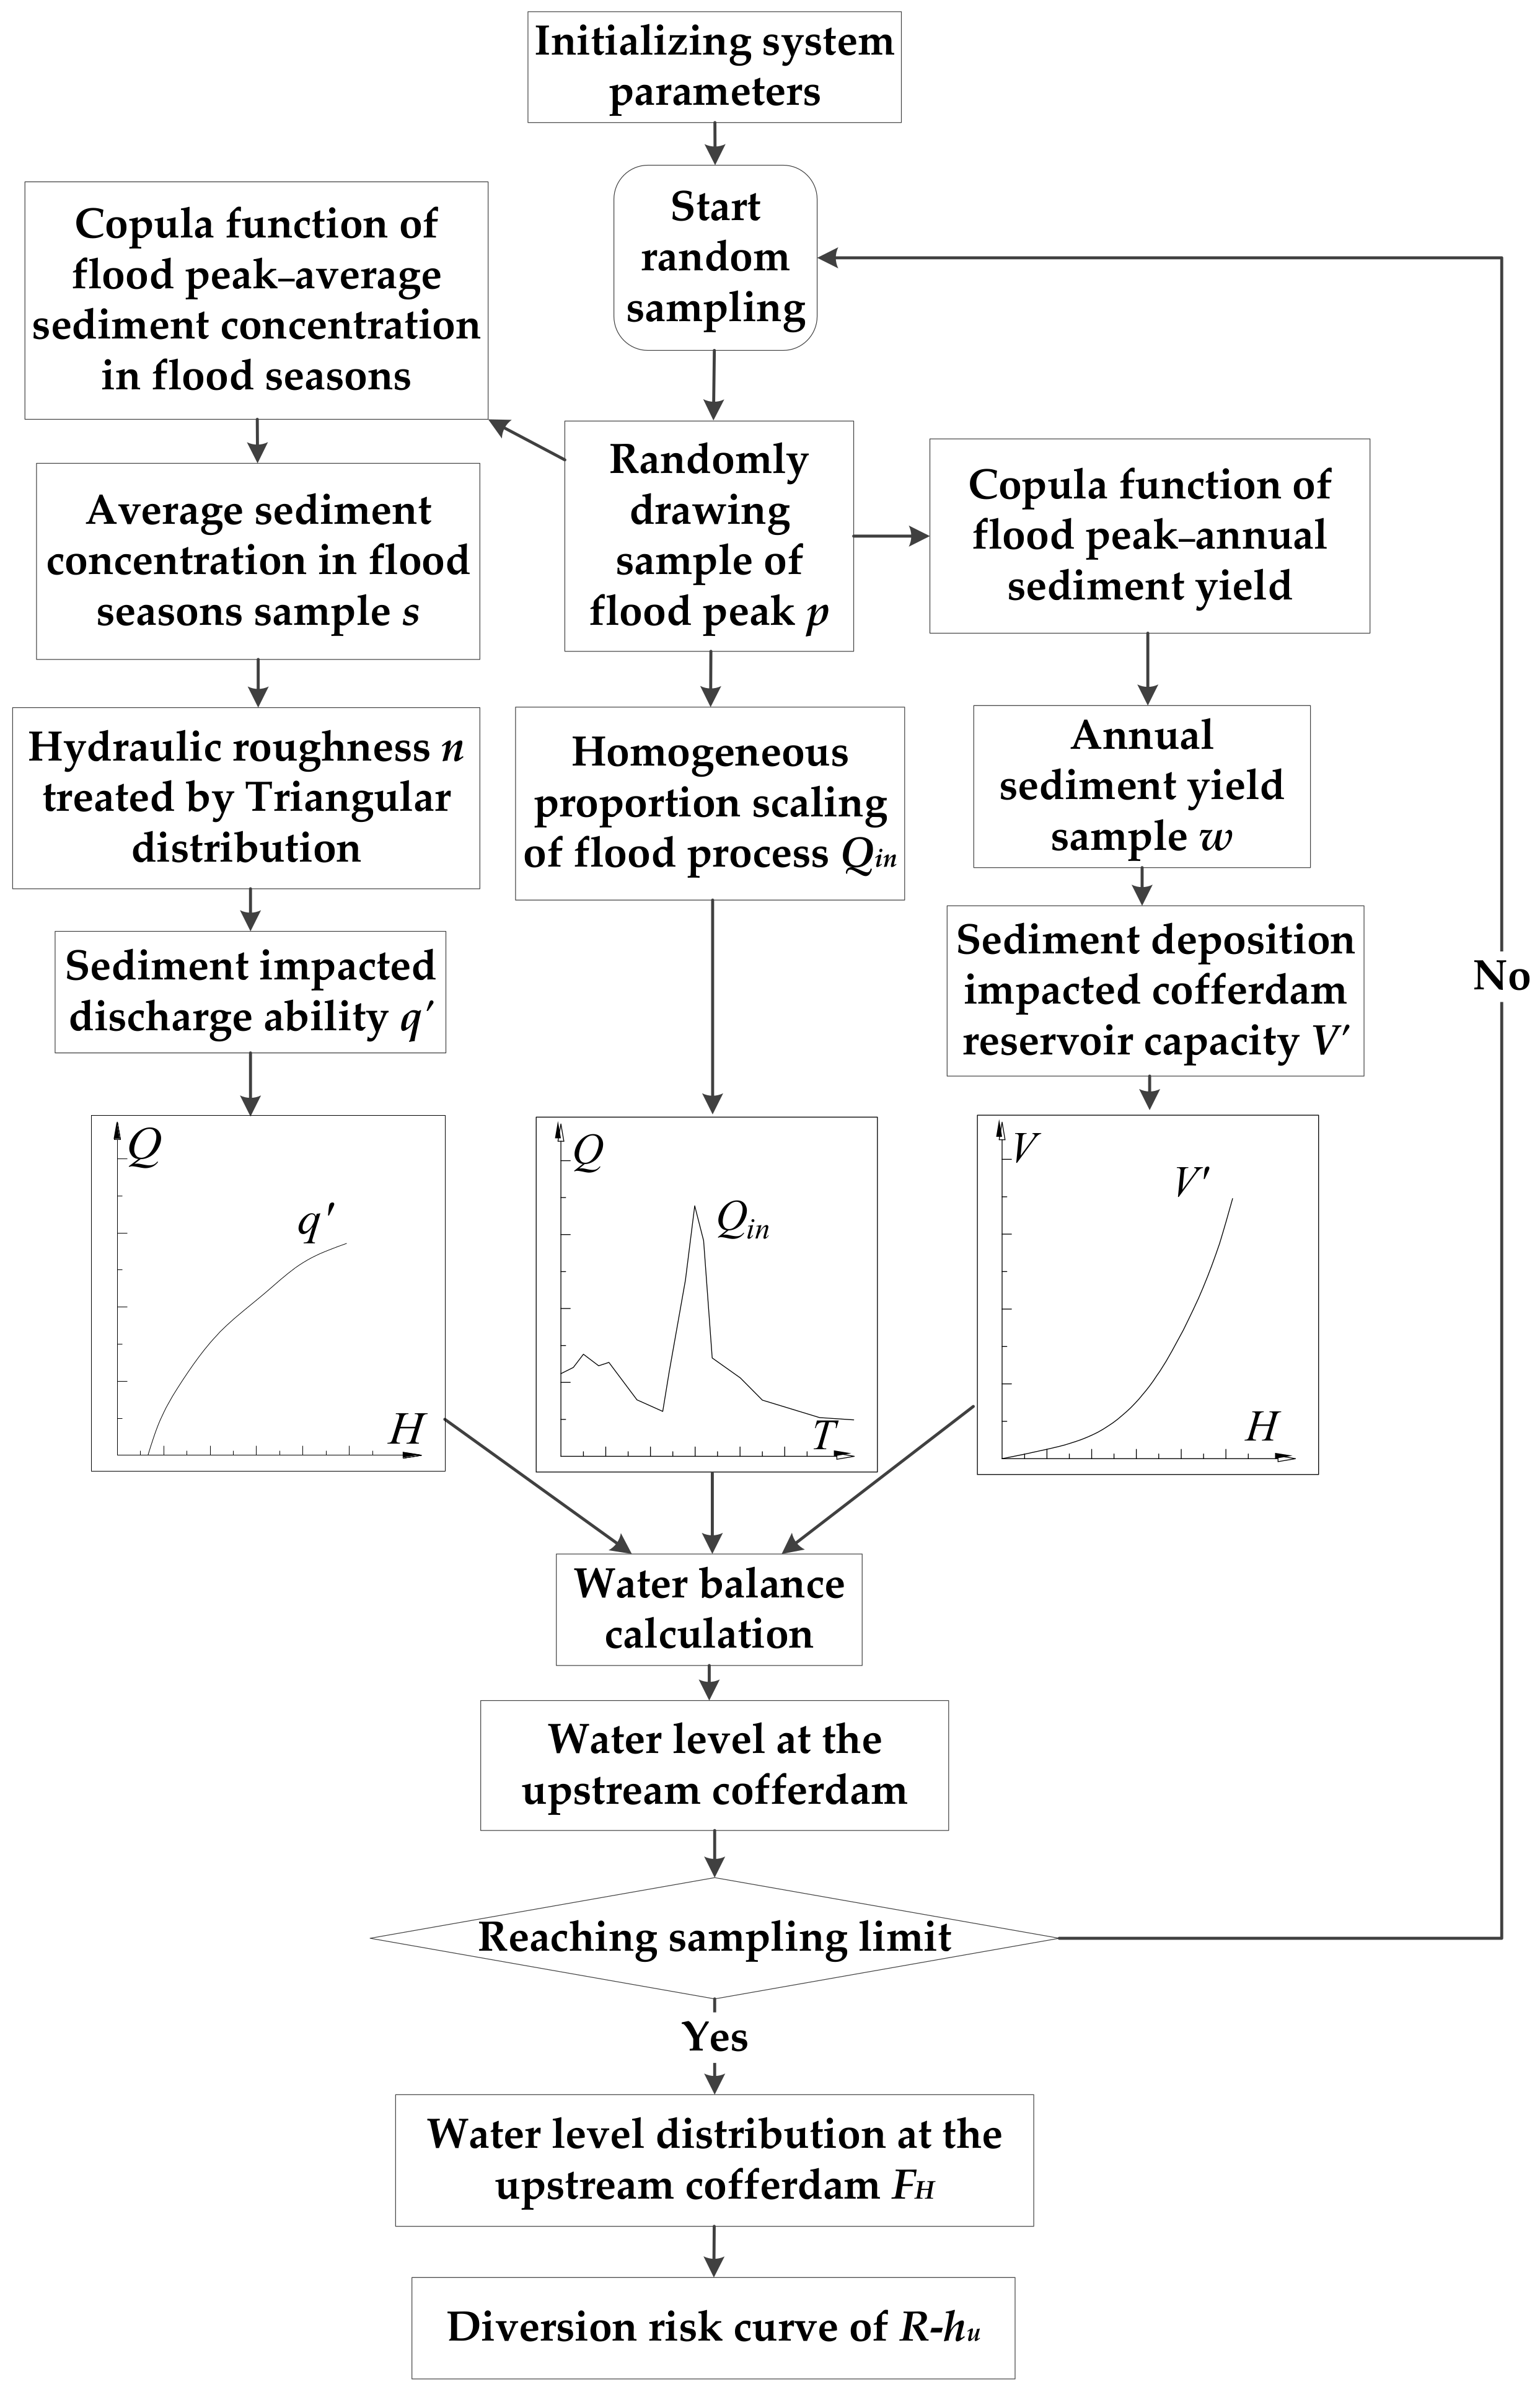
4.3. MCS-Based Dam Construction Diversion Risk Assessment
5. Results and Analysis
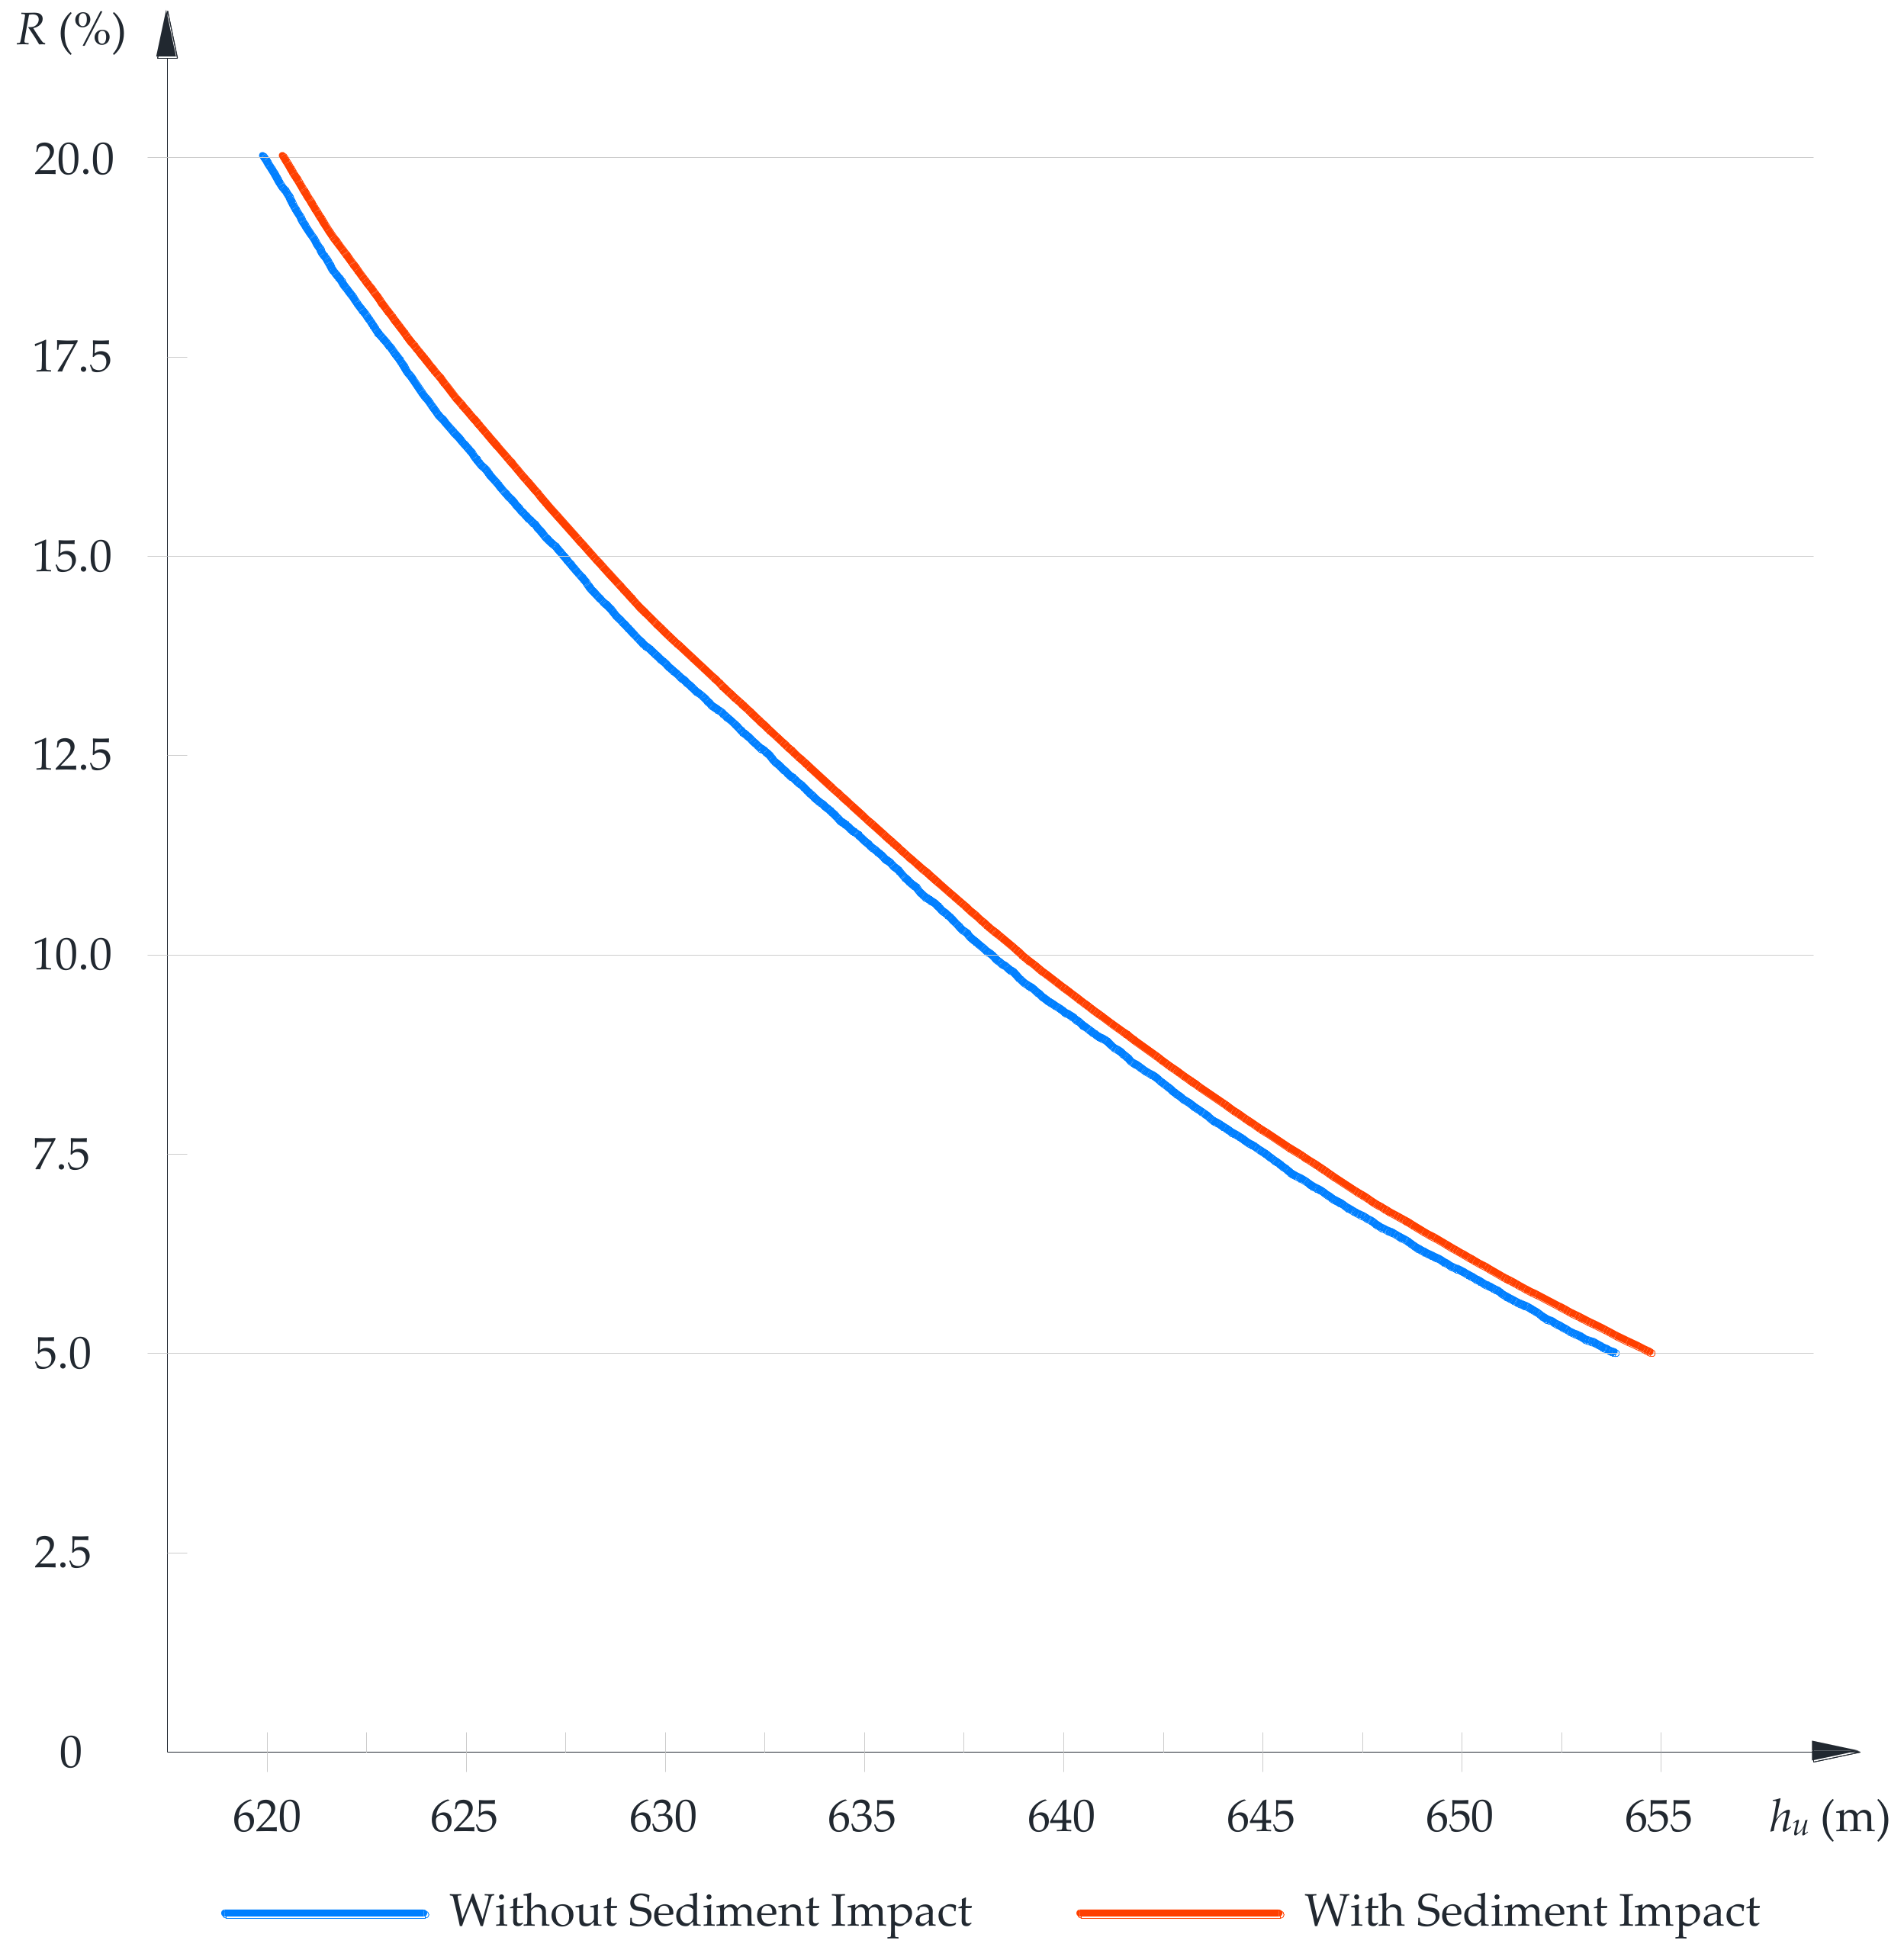
5.1. Risk Assessment Results of Dam Construction Diversion on the Jing River
5.2. Analysis of Project Case Results
6. Conclusions
Supplementary Materials
Acknowledgments
Author Contributions
Conflicts of Interest
Appendix A

| Year | Annual Precipitation (108 m3) | Annual Sedimen Yield (104 t) | Year | Annual Precipitation (108 m3) | Annual Sediment Yield (104 t) |
|---|---|---|---|---|---|
| 1965 | 14.12 | 5644 | 1977 | 17.60 | 42,800 |
| 1966 | 31.65 | 63,557 | 1978 | 17.00 | 25,200 |
| 1967 | 21.33 | 13,293 | 1979 | 11.90 | 16,200 |
| 1968 | 26.56 | 32,760 | 1980 | 13.60 | 16,700 |
| 1969 | 15.97 | 21,700 | 1981 | 21.90 | 23,500 |
| 1970 | 24.15 | 41,900 | 1982 | 13.10 | 12,800 |
| 1971 | 12.99 | 15,900 | 1983 | 22.90 | 11,700 |
| 1972 | 8.47 | 4150 | 1984 | 23.00 | 27,000 |
| 1973 | 21.06 | 52,600 | 1985 | 18.50 | 19,200 |
| 1974 | 13.25 | 15,300 | 1986 | 11.60 | 10,500 |
| 1975 | 26.05 | 25,600 | 1987 | 9.32 | 9190 |
| 1976 | 21.93 | 19,900 | 1988 | 22.20 | 43,000 |
| Year | Flood Peak Volume (m3/s) | Average Sediment Concentration in Flood Seasons (kg/m3) | Year | Flood Peak Volume (m3/s) | Average Sediment Concentration in Flood Seasons (kg/m3) |
|---|---|---|---|---|---|
| 1965 | 507 | 191 | 1977 | 1870 | 242 |
| 1966 | 7520 | 192 | 1978 | 1520 | 178 |
| 1967 | 950 | 209 | 1979 | 1060 | 200 |
| 1968 | 1480 | 230 | 1980 | 1100 | 194 |
| 1969 | 1110 | 199 | 1981 | 1630 | 242 |
| 1970 | 2700 | 224 | 1982 | 927 | 195 |
| 1971 | 1410 | 222 | 1983 | 833 | 168 |
| 1972 | 398 | 192 | 1984 | 1350 | 205 |
| 1973 | 6160 | 214 | 1985 | 610 | 203 |
| 1974 | 866 | 215 | 1986 | 1760 | 212 |
| 1975 | 2390 | 160 | 1987 | 662 | 213 |
| 1976 | 1180 | 196 | 1988 | 1960 | 193 |
| Water Level (m) | Origin Reservoir Capacity (104 m3) | Water Level (m) | Origin Reservoir Capacity (104 m3) | Water Level (m) | Origin Reservoir Capacity (104 m3) |
|---|---|---|---|---|---|
| 586.69 | 0 | 612 | 158 | 638 | 2354 |
| 588 | 0.1 | 614 | 204 | 640 | 2712 |
| 590 | 1 | 616 | 262 | 642 | 3113 |
| 592 | 2 | 618 | 344 | 644 | 3550 |
| 594 | 3 | 620 | 440 | 646 | 4026 |
| 596 | 5 | 622 | 555 | 648 | 4545 |
| 598 | 10 | 624 | 696 | 650 | 5111 |
| 600 | 17 | 626 | 857 | 652 | 5717 |
| 602 | 26 | 628 | 1040 | 654 | 6357 |
| 604 | 42 | 630 | 1246 | 656 | 7032 |
| 606 | 64 | 632 | 1477 | 658 | 7747 |
| 608 | 89 | 634 | 1740 | 660 | 8521 |
| 610 | 119 | 636 | 2032 |
| Water Level Hd (m) | Runoff Volume Qd (m3/s) | Water Level Hd (m) | Runoff Volume Qd (m3/s) | Water Level Hd (m) | Runoff Volume Qd (m3/s) |
|---|---|---|---|---|---|
| 586.59 | 0 | 605.88 | 2600 | 616.12 | 6200 |
| 587.45 | 25 | 606.66 | 2800 | 616.96 | 6600 |
| 588.26 | 50 | 607.39 | 3000 | 617.77 | 7000 |
| 589.21 | 100 | 608.09 | 3200 | 618.56 | 7400 |
| 590.77 | 200 | 608.79 | 3400 | 619.32 | 7800 |
| 592.16 | 300 | 609.47 | 3600 | 620.06 | 8200 |
| 594.27 | 500 | 610.13 | 3800 | 620.77 | 8600 |
| 596.00 | 700 | 610.77 | 4000 | 621.46 | 9000 |
| 598.15 | 1000 | 611.38 | 4200 | 622.28 | 9500 |
| 599.60 | 1250 | 611.96 | 4400 | 623.06 | 10,000 |
| 601.46 | 1600 | 612.51 | 4600 | 626.08 | 12,000 |
| 602.44 | 1800 | 613.03 | 4800 | 627.56 | 13,000 |
| 603.35 | 2000 | 613.50 | 5000 | 629.03 | 14,000 |
| 604.22 | 2200 | 614.40 | 5400 | 630.45 | 15,000 |
| 605.06 | 2400 | 615.27 | 5800 | 637.38 | 20,000 |
Notation List
| A | cross-section area of the discharge tunnel |
| α, β, | distribution parameters of the Pearson III distribution |
| Chézy coefficient | |
| coefficient of deviation | |
| coefficient of variation | |
| combinatorial number of 2 variables with a length of k | |
| e | Napier constant |
| distribution of water levels at the upstream cofferdam | |
| marginal distribution functions of flood peak | |
| marginal distribution functions of average sediment concentration in flood seasons | |
| marginal distribution functions of annual sediment yield | |
| marginal distribution function of flood peak variable y | |
| marginal distribution function of sediment variables z | |
| homogeneous proportion scaling function with p as the variable. | |
| g | gravitational acceleration |
| H | set of all possible values of river water levels at the upstream cofferdam |
| Hd | river channel’s water level |
| upstream cofferdam reservoir water level | |
| upstream waterhead | |
| difference of downstream water level and the downstream diversion tunnel exit elevation | |
| crest elevation of the upstream cofferdam | |
| i | gradient of the diversion tunnel |
| side wall protrude height of the diversion tunnel | |
| L | length of the diversion tunnel |
| m | total sampling count of MCS |
| n | synthesis roughness coefficient of the diversion tunnel |
| n* | value of calculated roughness that only considers sediment influence |
| p | sample value of flood peak volume |
| Qd | river runoff volume |
| Qin | flood process |
| q | capacity of diversion discharge flow |
| q′ | sediment impacted discharge ability of the diversion tunnel |
| diversion risk assessment result | |
| hydraulic radius of the diversion tunnel | |
| rs | dry bulk density of silt |
| flow average sediment concentration in flood seasons | |
| volume sediment concentration, | |
| s | sample value of the average sediment concentration in flood seasons S |
| sign function | |
| T | duration of deposition (in years) |
| Tri() | Triangular distribution treatment function |
| V | origin upstream cofferdam reservoir capacity |
| V′ | sediment deposition impacted upstream cofferdam reservoir capacity |
| VF | max flood detention volume |
| Vs | reservoir sediment deposition volume |
| W | annual sediment yield |
| water balance calculation function with Qin, V′, q′ as variables | |
| w | sample value of annual sediment yield W |
| x | value of random variables that obey Pearson III distribution |
| mean value of random variables that obey Pearson III distribution | |
| (, ) | sample data of flood peak and sediment variables |
| (α) | Gamma function of the Pearson III distribution parameter α |
| deposit rate determined based on regional hydrology and sediment data | |
| η | ratio of the bed load among the suspended load |
| θ | parameter of GH-copula function |
| Karman constant | |
| μ | discharge coefficient of the diversion tunnel |
| Kendall correlation coefficient | |
| sediment porosity | |
| correction coefficient for Formula (8) | |
| sum of waterhead loss of the diversion tunnel |
References
- International Commission on Large Dams. WORLD REGISTER OF DAMS/General Synthesis. Available online: http://www.icold-cigb.org/GB/world_register/general_synthesis.asp (accessed on 19 November 2017).
- Hong, X.; Guo, S.; Wang, L.; Yang, G.; Liu, D.; Guo, H.; Wang, J. Evaluating water supply risk in the middle and lower reaches of Hanjiang River Basin based on an integrated optimal water resources allocation model. Water 2016, 8, 364. [Google Scholar] [CrossRef]
- Farfan, J.; Breyer, C. Structural changes of global power generation capacity towards sustainability and the risk of stranded investments supported by a sustainability indicator. J. Clean. Prod. 2017, 141, 370–384. [Google Scholar] [CrossRef]
- Bartle, A. Hydropower potential and development activities. Energy Policy 2002, 30, 1231–1239. [Google Scholar] [CrossRef]
- Chang, X.L.; Liu, X.; Zhou, W. Hydropower in China at present and its further development. Energy 2010, 35, 4400–4406. [Google Scholar] [CrossRef]
- Biemans, H.; Haddeland, I.; Kabat, P.; Ludwig, F.; Hutjes, R.W.A.; Heinke, J.; Von Bloh, W.; Gerten, D. Impact of reservoirs on river discharge and irrigation water supply during the 20th century. Water Resour. Res. 2011, 47, 1–15. [Google Scholar] [CrossRef]
- Zarfl, C.; Lumsdon, A.E.; Berlekamp, J.; Tydecks, L.; Tockner, K. A global boom in hydropower dam construction. Aquat. Sci. 2014, 77, 161–170. [Google Scholar] [CrossRef]
- Silveira, A. Some considerations on the durability of dams. Water Power Dam Constr. 1990, 42, 19–24. [Google Scholar]
- Rasekh, A.; Afshar, A.; Afshar, M.H. Risk-cost optimization of hydraulic structures: Methodology and case study. Water Resour. Manag. 2010, 24, 2833–2851. [Google Scholar] [CrossRef]
- Marengo, H.; Arreguin, F.I.; Aldama, A.A.; Morales, V. Case study: Risk analysis by overtopping of diversion works during dam construction: The La Yesca hydroelectric project, Mexico. Struct. Saf. 2013, 42, 26–34. [Google Scholar] [CrossRef]
- Parker, T.C.; Froste, B.; McConnell, M.J. Mrica hydroelectric project civil engineering construction. Proc. Inst. Civ. Eng.-Water Marit. Energy 1993, 101, 157–172. [Google Scholar] [CrossRef]
- Afshar, A.; Barkhordary, A.; Marino, M.A. Optimizing river diversion under hydraulic and hydrologic uncertainties. J. Water Resour. Plan. Manag. 1994, 120, 36–47. [Google Scholar] [CrossRef]
- Dai, H.; Cao, G.; Su, H. Management and construction of the Three Gorges project. J. Constr. Eng. Manag. 2006, 132, 615–619. [Google Scholar] [CrossRef]
- Sedighizadeh, S.; Mansoori, A.; Pirestani, M.R.; Sedighizadeh, D. A new model for economic optimization of water diversion system during dam construction using PSO algorithm. World Acad. Sci. Eng. Technol. 2011, 5, 35–41. [Google Scholar]
- Karamouz, M.; Doroudi, S.; Ahmadi, A.; Moridi, A. Optimal design of water diversion system: A case study. In Proceedings of the World Environmental and Water Resources Congress 2009—World Environmental and Water Resources Congress 2009: Great Rivers, Kansas City, MO, USA, 17–21 May 2009. [Google Scholar]
- Marengo, H. Case study: Dam safety during construction, lessons of the overtopping diversion works at Aguamilpa Dam. J. Hydraul. Eng. 2006, 132, 1121–1127. [Google Scholar] [CrossRef]
- Afshar, A.; Rasekh, A.; Afshar, M.H. Risk-based optimization of large flood-diversion systems using genetic algorithms. Eng. Optim. 2009, 41, 259–273. [Google Scholar] [CrossRef]
- Hu, Z.G.; Fan, X.E.; Liu, Q.; Huang, H. Design of integrated risk distribution mechanism of construction diversion system. J. Hydraul. Eng. 2006, 37, 1270–1277. [Google Scholar] [CrossRef]
- Liu, Q.; Hu, Z.; Qi, Z.; Min, R. Risk feature analysis of river diversion for dam reconstruction on the original site. Adv. Eng. Sci. 2007, 49, 35–41. [Google Scholar] [CrossRef]
- Bai, Y.; Xu, H. Hydrodynamic instability of hyperconcentrated flows of the Yellow River. J. Hydraul. Res. 2010, 48, 742–753. [Google Scholar] [CrossRef]
- Shrestha, B.; Cochrane, T.A.; Caruso, B.S.; Arias, M.E.; Piman, T. Uncertainty in flow and sediment projections due to future climate scenarios for the 3S Rivers in the Mekong Basin. J. Hydrol. 2016, 540, 1088–1104. [Google Scholar] [CrossRef]
- Oh, J.; Tsai, C.W.; Choi, S.-U. Quantifying the uncertainty associated with estimating sediment concentrations in open channel flows using the stochastic particle tracking method. J. Hydraul. Eng. 2015, 141. [Google Scholar] [CrossRef]
- Rosen, T.; Xu, Y.J. A hydrograph-based sediment availability assessment: Implications for Mississippi River sediment diversion. Water 2014, 6, 564–583. [Google Scholar] [CrossRef]
- Schmelter, M.L.; Erwin, S.O.; Wilcock, P.R. Accounting for uncertainty in cumulative sediment transport using Bayesian statistics. Geomorphology 2012, 175, 1–13. [Google Scholar] [CrossRef]
- He, L.; Duan, J.G.; Wang, G.; Fu, X. Numerical simulation of unsteady hyperconcentrated sediment-laden flow in the Yellow River. J. Hydraul. Eng. 2012, 138, 958–969. [Google Scholar] [CrossRef]
- Billi, P.; El Badri Ali, O. Sediment transport of the Blue Nile at Khartoum. Quat. Int. 2010, 226, 12–22. [Google Scholar] [CrossRef]
- United States Department of the Interior Bureau of Reclamation. Design of Small Dams, 3rd ed.; Water Resources Technical Publications: Washington, DC, USA, 1987; ISBN -10:016003373X.
- Kmusser. The Jing Flows into the Wei Near Xi’an. Available online: https://en.wikipedia.org/wiki/Jing_River#/media/File:Weirivermap.png (accessed on 19 November 2017).
- Tung, Y.K.; Yen, B.C.; Melching, C.S. Hydrosystems Engineering Reliability Assessment and Risk Analysis; McGraw-Hill: New York, NY, USA, 2006; ISBN 0-07-145158-7. [Google Scholar]
- Bobée, B.; Rasmussen, P.F. Recent advances in flood frequency analysis. Rev. Geophys. 1995, 33, 1111–1116. [Google Scholar] [CrossRef]
- Vogel, R.W.; McMartin, D.E. Probability plot goodness-of-fit and skewness estimation procedures for the Pearson type 3 distribution. Water Resour. Res. 1991, 27, 3149–3158. [Google Scholar] [CrossRef]
- Ministry of Water Resources of the People’s Republic of China. SL 303-2017 Specifications for Construction Planning of Water Resources and Hydropower Projects; Water & Power Press: Beijing, China, 2017; ISBN 155170318. (In Chinese)
- Wang, C.; Wang, Z. Uncertainty Analysis and Application of Construction Diversion Tunnel Discharge Capacity. In Proceedings of the 2014 International Conference on Mechatronics, Electronic, Industrial and Control Engineering (MEIC), Shenyang, China, 15–17 November 2014. [Google Scholar]
- Nakhaei, N.; Etemad-Shahidi, A. Applying Monte Carlo and classification tree sensitivity analysis to the Zayandehrood River. J. Hydroinform. 2012, 14, 236. [Google Scholar] [CrossRef]
- Lee, H.-Y.; Lin, Y.-T.; Yunyou, J.; Wenwang, H. On three-dimensional continuous saltating process of sediment particles near the channel bed. J. Hydraul. Res. 2006, 44, 374–389. [Google Scholar] [CrossRef]
- Li, X.; Wei, X. Analysis of the relationship between soil erosion risk and surplus floodwater during flood season. J. Hydrol. Eng. 2014, 19, 1294–1311. [Google Scholar] [CrossRef]
- Jin, X.; Hao, Z.; Zhang, J. Study on the relation of frequency between flood and sediment in the Middle Yellow River. J. Sediment. Res. 2006, 3, 6–13. [Google Scholar] [CrossRef]
- Radice, A.; Longoni, L.; Papini, M.; Brambilla, D.; Ivanov, V.I. Generation of a design flood-event scenario for a mountain river with intense sediment transport. Water 2016, 8. [Google Scholar] [CrossRef]
- Peng, Y.; Ji, C.; Gu, R. A multi-objective optimization model for coordinated regulation of flow and sediment in cascade reservoirs. Water Resour. Manag. 2014, 28, 4019–4033. [Google Scholar] [CrossRef]
- Schleiss, A.J.; Franca, M.J.; Juez, C.; De Cesare, G. Reservoir sedimentation. J. Hydraul. Res. 2016, 54, 595–614. [Google Scholar] [CrossRef]
- Meyer-Peter, E.; Müller, R. Formulas for Bed-Load Transport. In Proceedings of the IAHSR 2nd Meeting, Stockholm, Sweden, 7–9 June 1948; pp. 39–64. [Google Scholar]
- Yang, C.T.; Wan, S. Comparisons of selected bed-material load formulas. J. Hydraul. Eng. 1991, 117, 973–989. [Google Scholar] [CrossRef]
- Van den Berg, J.H.; van Gelder, A. Prediction of suspended bed material transport in flows over silt and very fine sand. Water Resour. Res. 1993, 29, 1393–1404. [Google Scholar] [CrossRef]
- Papalaskaris, T.; Dimitriadou, P.; Hrissanthou, V. Comparison between computations and measurements of bed load transport rate in Nestos River, Greece. Procedia Eng. 2016, 162, 172–180. [Google Scholar] [CrossRef]
- Gic-Grusza, G.; Dudkowska, A. Numerical modeling of hydrodynamics and sediment transport—An integrated approach. Ocean Dyn. 2017, 67, 1283–1292. [Google Scholar] [CrossRef]
- Dysarz, T.; Szalkiewicz, E.; Wicher-Dysarz, J. Long-term impact of sediment deposition and erosion on water surface profiles in the Ner River. Water 2017, 9. [Google Scholar] [CrossRef]
- Luo, W.S.; Song, X.Y. Engineering Hydrology and Hydraulic Calculation, 2nd ed.; Water&Power Press: Beijing, China, 2010; (In Chinese). ISBN 9787508474458. [Google Scholar]
- Ministry of Water Resources of the People’s Republic of China. SL 623-2013 Design Code for Construction Diversion of Water Resources and Hydropower Engineering; Water&Power Press: Beijing, China, 2013; (In Chinese). ISBN 155170.
- Manning, R. On the Flow of Water in Open Channels and Pipes. Trans. Inst. Civ. Eng. Irel. 1891, 20, 161–207. [Google Scholar]
- Shu, A.; Liu, Q.; Fei, X. Unified laws of velocity distribution for sediment laden flow with high and low concentration. J. Hydraul. Eng. 2006, 37, 1175–1180. [Google Scholar] [CrossRef]
- Deng, A. Study on Key Technical Problems in Modeling of Hyper-Concentrated Flows. Master’s Thesis, China Institute of Water Resources and Hydropower Research, Beijing, China, April 2007. (In Chinese). [Google Scholar]
- Zhang, H. Vertical distribution of velocity in sediment-laden flow. J. Sediment. Res. 1995, 2, 1–10. [Google Scholar] [CrossRef]
- Xiao, Y.; Guo, S.L.; Xiong, L.H.; Liu, P.; Fang, B. A new Random Simulation method for constructing synthetic flood hydrographs. J. Sichuan Univ. (Eng. Sci. Ed.) 2007, 39, 55–60. [Google Scholar] [CrossRef]
- Guo, A.; Chang, J.; Wang, Y.; Huang, Q. Variations in the runoff-sediment relationship of the Weihe River Basin based on the Copula function. Water 2016, 8. [Google Scholar] [CrossRef]
- Xu, Y.; Huang, G.; Fan, Y. Multivariate flood risk analysis for Wei River. Stoch. Environ. Res. Risk Assess. 2017, 31, 225–242. [Google Scholar] [CrossRef]
- Nelsen, R.B. An Introduction to Copulas, 2nd ed.; Springer: New York, NY, USA, 2006; ISBN 978-0-387-28659-4. [Google Scholar]
- International Organization for Standardization (ISO). ISO 31000:2009 Risk Management—Principles and Guidelines; ISO: Geneva, Switzerland, 2009; ISBN 0733792898. [Google Scholar]
- Elbarkouky, M.M.G.; Fayek, A.R.; Siraj, N.B.; Sadeghi, N. Fuzzy arithmetic risk analysis approach to determine construction project contingency. J. Constr. Eng. Manag. 2016, 142, 4016070. [Google Scholar] [CrossRef]
- Chang, C.; Ko, J. New approach to estimating the standard deviations of lognormal cost variables in the Monte Carlo analysis of construction risks. J. Constr. Eng. Manag. 2016, 1–7. [Google Scholar] [CrossRef]
- Adarsh, S.; Reddy, M.J. Reliability analysis of composite channels using first order approximation and Monte Carlo simulations. Stoch. Environ. Res. Risk Assess. 2013, 27, 477–487. [Google Scholar] [CrossRef]
- Ganji, A.; Jowkarshorijeh, L. Advance first order second moment (AFOSM) method for single reservoir operation reliability analysis: A case study. Stoch. Environ. Res. Risk Assess. 2012, 26, 33–42. [Google Scholar] [CrossRef]
- Mishra, S. Uncertainty and sensitivity analysis techniques for hydrologic modeling. J. Hydroinform. 2009, 11, 282. [Google Scholar] [CrossRef]
- Sadeghi, N.; Fayek, A.R.; Pedrycz, W. Fuzzy Monte Carlo simulation and risk assessment in construction. Comput. Civ. Infrastruct. Eng. 2010, 25, 238–252. [Google Scholar] [CrossRef]
- Rohaninejad, M.; Bagherpour, M. Application of risk analysis within value management: A case study in dam engineering. J. Civ. Eng. Manag. 2013, 19, 364–374. [Google Scholar] [CrossRef]
- Chow, V.T.; Maidment, D.R.; Mays, L.W. Applied Hydrology; McGraw-Hill: Singapore, 1988; ISBN 9780071001748. [Google Scholar]
- Li, B.; Liang, Z.; Zhang, J.; Chen, X.; Jiang, X.; Wang, J.; Hu, Y. Risk analysis of reservoir flood routing calculation based on inflow forecast uncertainty. Water 2016, 8, 486. [Google Scholar] [CrossRef]


| Series | |||
|---|---|---|---|
| Flood peak volume (m3/s) | 2330 | 1.15 | 3.00 |
| Annual sediment yield (104 t) | 23753 | 0.67 | 2.36 |
| Average sediment concentration in flood seasons (kg/m3) | 212 | 0.16 | 11.25 |
| Series of Joint Distribution | Parameters of Copula Function | |
|---|---|---|
| τ | θ | |
| Flood peak–Annual sediment yield | 0.703 | 3.37 |
| Flood peak–Average sediment concentration in flood seasons | 0.167 | 1.2 |
| Profile Dimension (m) | Long (m) L | Area (m3) A | Hydraulic Radius | Gradient i | Sum Head Loss |
|---|---|---|---|---|---|
| 17 × 19 | 912.44 | 298.74 | 4.544 | 0.0035 | 0.9876 |
| Jing River Case | Contrast Clear Water Case | Crest Difference Considering Sediment Impact (m) | ||
|---|---|---|---|---|
| Risk Value R (%) | Corresponding Safety Crest of Cofferdam (m) | Risk Value R (%) | Corresponding Safety Crest of Cofferdam (m) | |
| 5 | 654.72 | 5 | 653.86 | +0.86 |
| 10 | 638.94 | 10 | 638.15 | +0.79 |
| 15 | 628.14 | 15 | 627.44 | +0.70 |
| 20 | 620.34 | 20 | 619.92 | +0.42 |
© 2018 by the authors. Licensee MDPI, Basel, Switzerland. This article is an open access article distributed under the terms and conditions of the Creative Commons Attribution (CC BY) license (http://creativecommons.org/licenses/by/4.0/).
Share and Cite
Song, Z.; Liu, Q.; Hu, Z.; Li, H.; Xiong, J. Assessment of Sediment Impact on the Risk of River Diversion during Dam Construction: A Simulation-Based Project Study on the Jing River, China. Water 2018, 10, 217. https://doi.org/10.3390/w10020217
Song Z, Liu Q, Hu Z, Li H, Xiong J. Assessment of Sediment Impact on the Risk of River Diversion during Dam Construction: A Simulation-Based Project Study on the Jing River, China. Water. 2018; 10(2):217. https://doi.org/10.3390/w10020217
Chicago/Turabian StyleSong, Zida, Quan Liu, Zhigen Hu, Huian Li, and Jianqing Xiong. 2018. "Assessment of Sediment Impact on the Risk of River Diversion during Dam Construction: A Simulation-Based Project Study on the Jing River, China" Water 10, no. 2: 217. https://doi.org/10.3390/w10020217
APA StyleSong, Z., Liu, Q., Hu, Z., Li, H., & Xiong, J. (2018). Assessment of Sediment Impact on the Risk of River Diversion during Dam Construction: A Simulation-Based Project Study on the Jing River, China. Water, 10(2), 217. https://doi.org/10.3390/w10020217