1. Introduction
In order to be able to efficiently address problems caused by municipal wastewater discharge, it is important to adopt an integrated approach that includes control of contamination at source, followed by treatment and reuse, or responsible discharge of the final effluent. These ‘cleaner production’ principles have been successfully applied in the industrial sector and now these concepts are being applied to integrated water resources management. In this context, the conceptual model of the three-step strategic approach (3-SSA) was developed, consisting of (1) minimization and prevention, (2) treatment for reuse and (3) stimulated natural self-purification [
1,
2].
The minimization and prevention concept refers to the reduction of residues, emissions and discharges of any production process through measures that make it possible to decrease, to economically and technically feasible levels, the amounts of contaminants generated which require treatment or final disposal [
3]. However, the approach should go beyond only reducing emissions, by also looking at ways to reduce the use of raw materials (e.g., drinking water in this case) [
4]. Since the amount of personal human waste (urine and faecal matter) will remain the same, by using less water more concentrated wastewater is produced, which lends itself better for treatment in the direction of reuse. The minimization proposals can be classified in three main actions [
3,
5]: (a) reduction at source, which includes a change in consumption habits and application of low water consumption devices; (b) in situ recycling techniques; and (c) rainwater harvesting. The first action proposes a shift to low consumption devices, such as water-saving toilets, showers and aired faucets that generate a decrease in the consumption of water, allowing for the possibility of supplying more users, without the need for new water sources and treatment capacity. The second and third actions, in situ recycling techniques, recognize new alternative water sources, such as rainwater harvesting and grey water. Lastly, the use of treated grey water is feasible for toilet flushing, plant watering, and the washing of floors and outdoor areas [
1,
6,
7], as well as golf courses, agriculture and groundwater recharge [
8].
Water reuse refers to utilization of water previously used one or more times in some activities to satisfy the needs of other uses, including the original. Reuse requires the processing of municipal wastewater to achieve specific quality criteria suitable for subsequent (re-)use [
9,
10]. Treated wastewater may be used beneficially in activities such as crop irrigation, industrial processes, cleaning or washing activities, protection of water resources, prevention of pollution, recovery of water and nutrients for agriculture, savings in freshwater use and wastewater treatment costs, etc. [
11]. Besides this, wastewater reuse as an additional source of water represents dual environmental benefits due to the decrease in the amount of water used for sensitive ecosystem, recreational activities and a decrease in wastewater discharges, leading to a reduction/prevention of water resource contamination [
12]. To meet current and future reclamation requirements and regulations, the selection of technologies for water reuse will involve careful consideration and evaluation of numerous factors. On selecting technologies for water reuse, consideration has to be given as to whether existing facilities are to be modified or upgraded, or an entirely new facility is to be constructed. In general, both physical and operational factors will have to be considered [
9]. The process can start with a pre-selection where technologies considered should ensure the production of an effluent that meets (1) the quality requirements for the type of reuse considered, or (2) local discharge criteria. Based on this, it will be necessary to choose the most appropriate wastewater treatment alternative, considering the technical, social, environmental and economic issues.
Discharges that are not avoided via prevention/minimization (Step 1) and reuse of treated effluents (Step 2) will be discharged to water bodies. At this stage, the 3-SSA proposes to consider interventions that maximize the self-purification (natural or stimulated) capacity of receiving water bodies (Step 3). When a river is polluted, the water quality deteriorates, limiting water use and ecosystem functions [
13]. However, the self-purification capacity of a river allows it to restore (partially or fully) its quality through re-aeration and natural processes of biodegradation [
14]. The mechanisms of self-purification can be in the form of dilution of polluted water with an influx of surface or groundwater or through certain complex hydrological, micro-biological and chemical processes [
15,
16]. Under step three, measures can be introduced that stimulate the ‘self-purification’ capacity of a water resource, for instance by introducing eco-hydrology interventions. Since anoxic water bodies generally have lower self-purification capacity, dissolved oxygen (DO) concentration is a primary measure of a stream’s health; it responds to the biochemical oxygen demand (BOD) load [
17]. This is why oxygen demand (DO) has been traditionally used to assess the pollution degree and self-purification capacity of water bodies. DO can be easily measured; however, the complex mechanisms involved in DO must be studied by mathematical modelling [
14]. Streeter and Phelps [
18] developed the first models in 1925. They developed a balance between the dissolved oxygen supply rate from re-aeration and the dissolved oxygen consumption rate from stabilization of an organic waste in which the biochemical oxygen demand (BOD) de-oxygenation rate was expressed as an empirical first order reaction, producing the classic dissolved oxygen (DO) sag model. This model is usually studied through mathematical modelling, either for steady state or for dynamic conditions. The selection of the model will depend on the objectives of the study, the specific characteristics of the study site and the availability of information [
18].
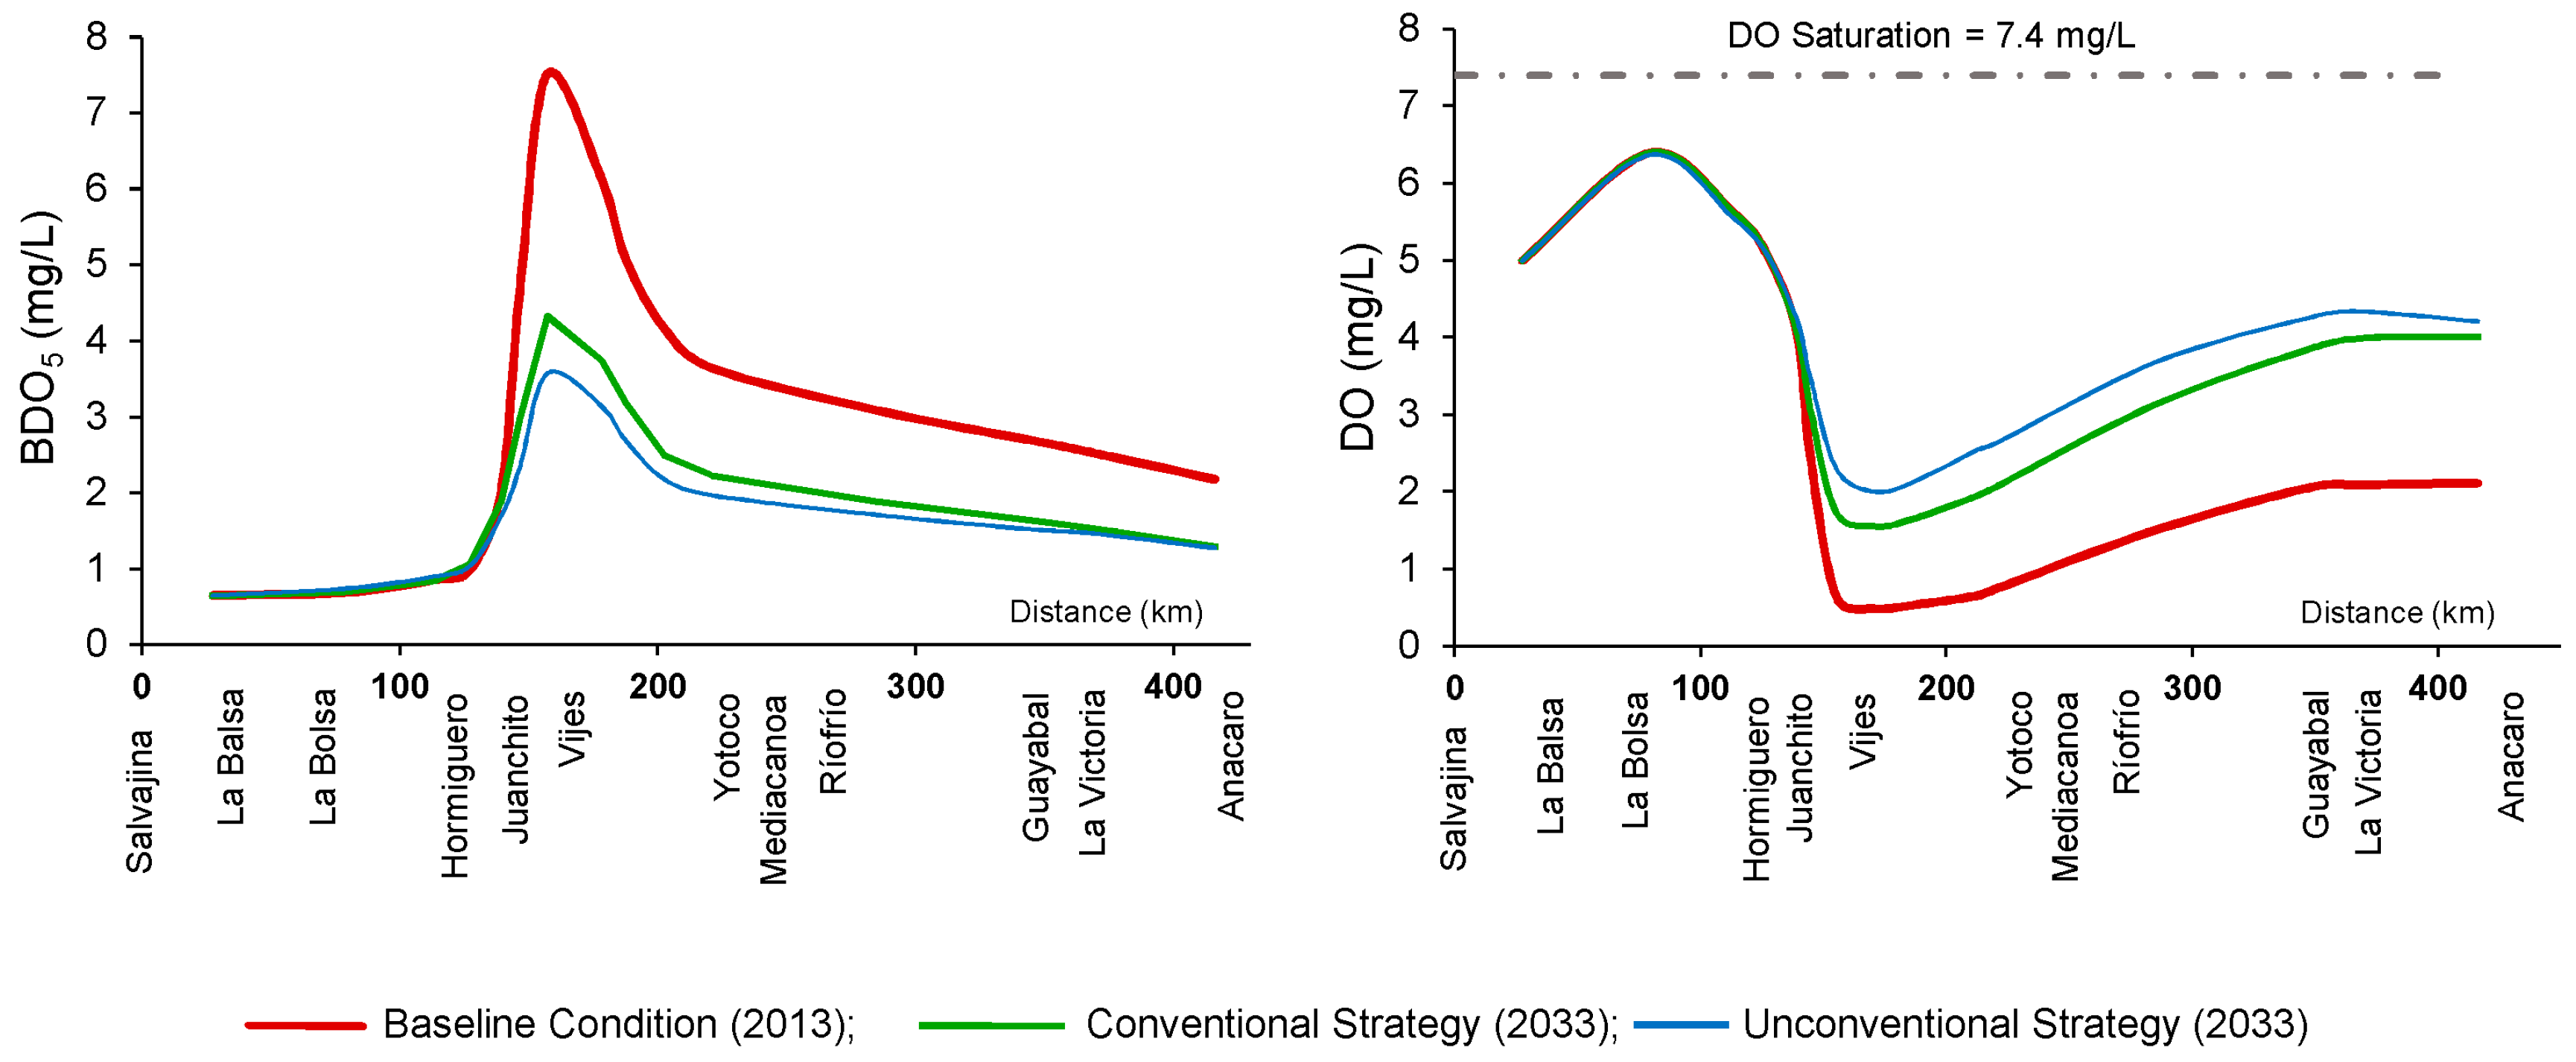
In this study, the 3-SSA (non-conventional strategy) was validated by applying it to the Upper Cauca river basin in Colombia and comparing it to a conventional strategy, which considers a ‘business as usual scenario’ of high water use, end-of-pipe wastewater treatment and conventional water supply providing drinking water quality for all uses. The Cauca River is the second most important fluvial artery of Colombia and the main hydric source of the Colombian southwest. Although actions aimed at pollution control in the Upper Cauca river basin date back over 40 years, the river water quality in the study area continues to deteriorate. This situation persists despite the fact that 19 of the 41 municipalities have installed WWTPs, the other 22 municipalities discharge raw sewage into the river system, directly or via tributaries. In this research, the unconventional strategy includes reduction in water consumption and reuse of treated wastewater in households and for sugarcane crop irrigation. It also considers prioritization of investments to maximize impact in improving the water quality of the Cauca River in the study area, targeting interventions in watersheds and municipalities with the highest pollutant load and located upstream of the river segments with the lowest DO. This study defines a baseline (2013, dry season condition) and scenarios for conventional and unconventional strategies towards 2033. The MIKE 11 model was used to study BOD
5 and DO behavior in the Cauca River for each strategy. Additionally, the strategies were compared using cost benefit analysis (CBA). This study uses the incremental cost-benefit analysis and it does not consider the common costs and benefits to compare the strategies [
19].
2. Materials and Methods
2.1. Study Area
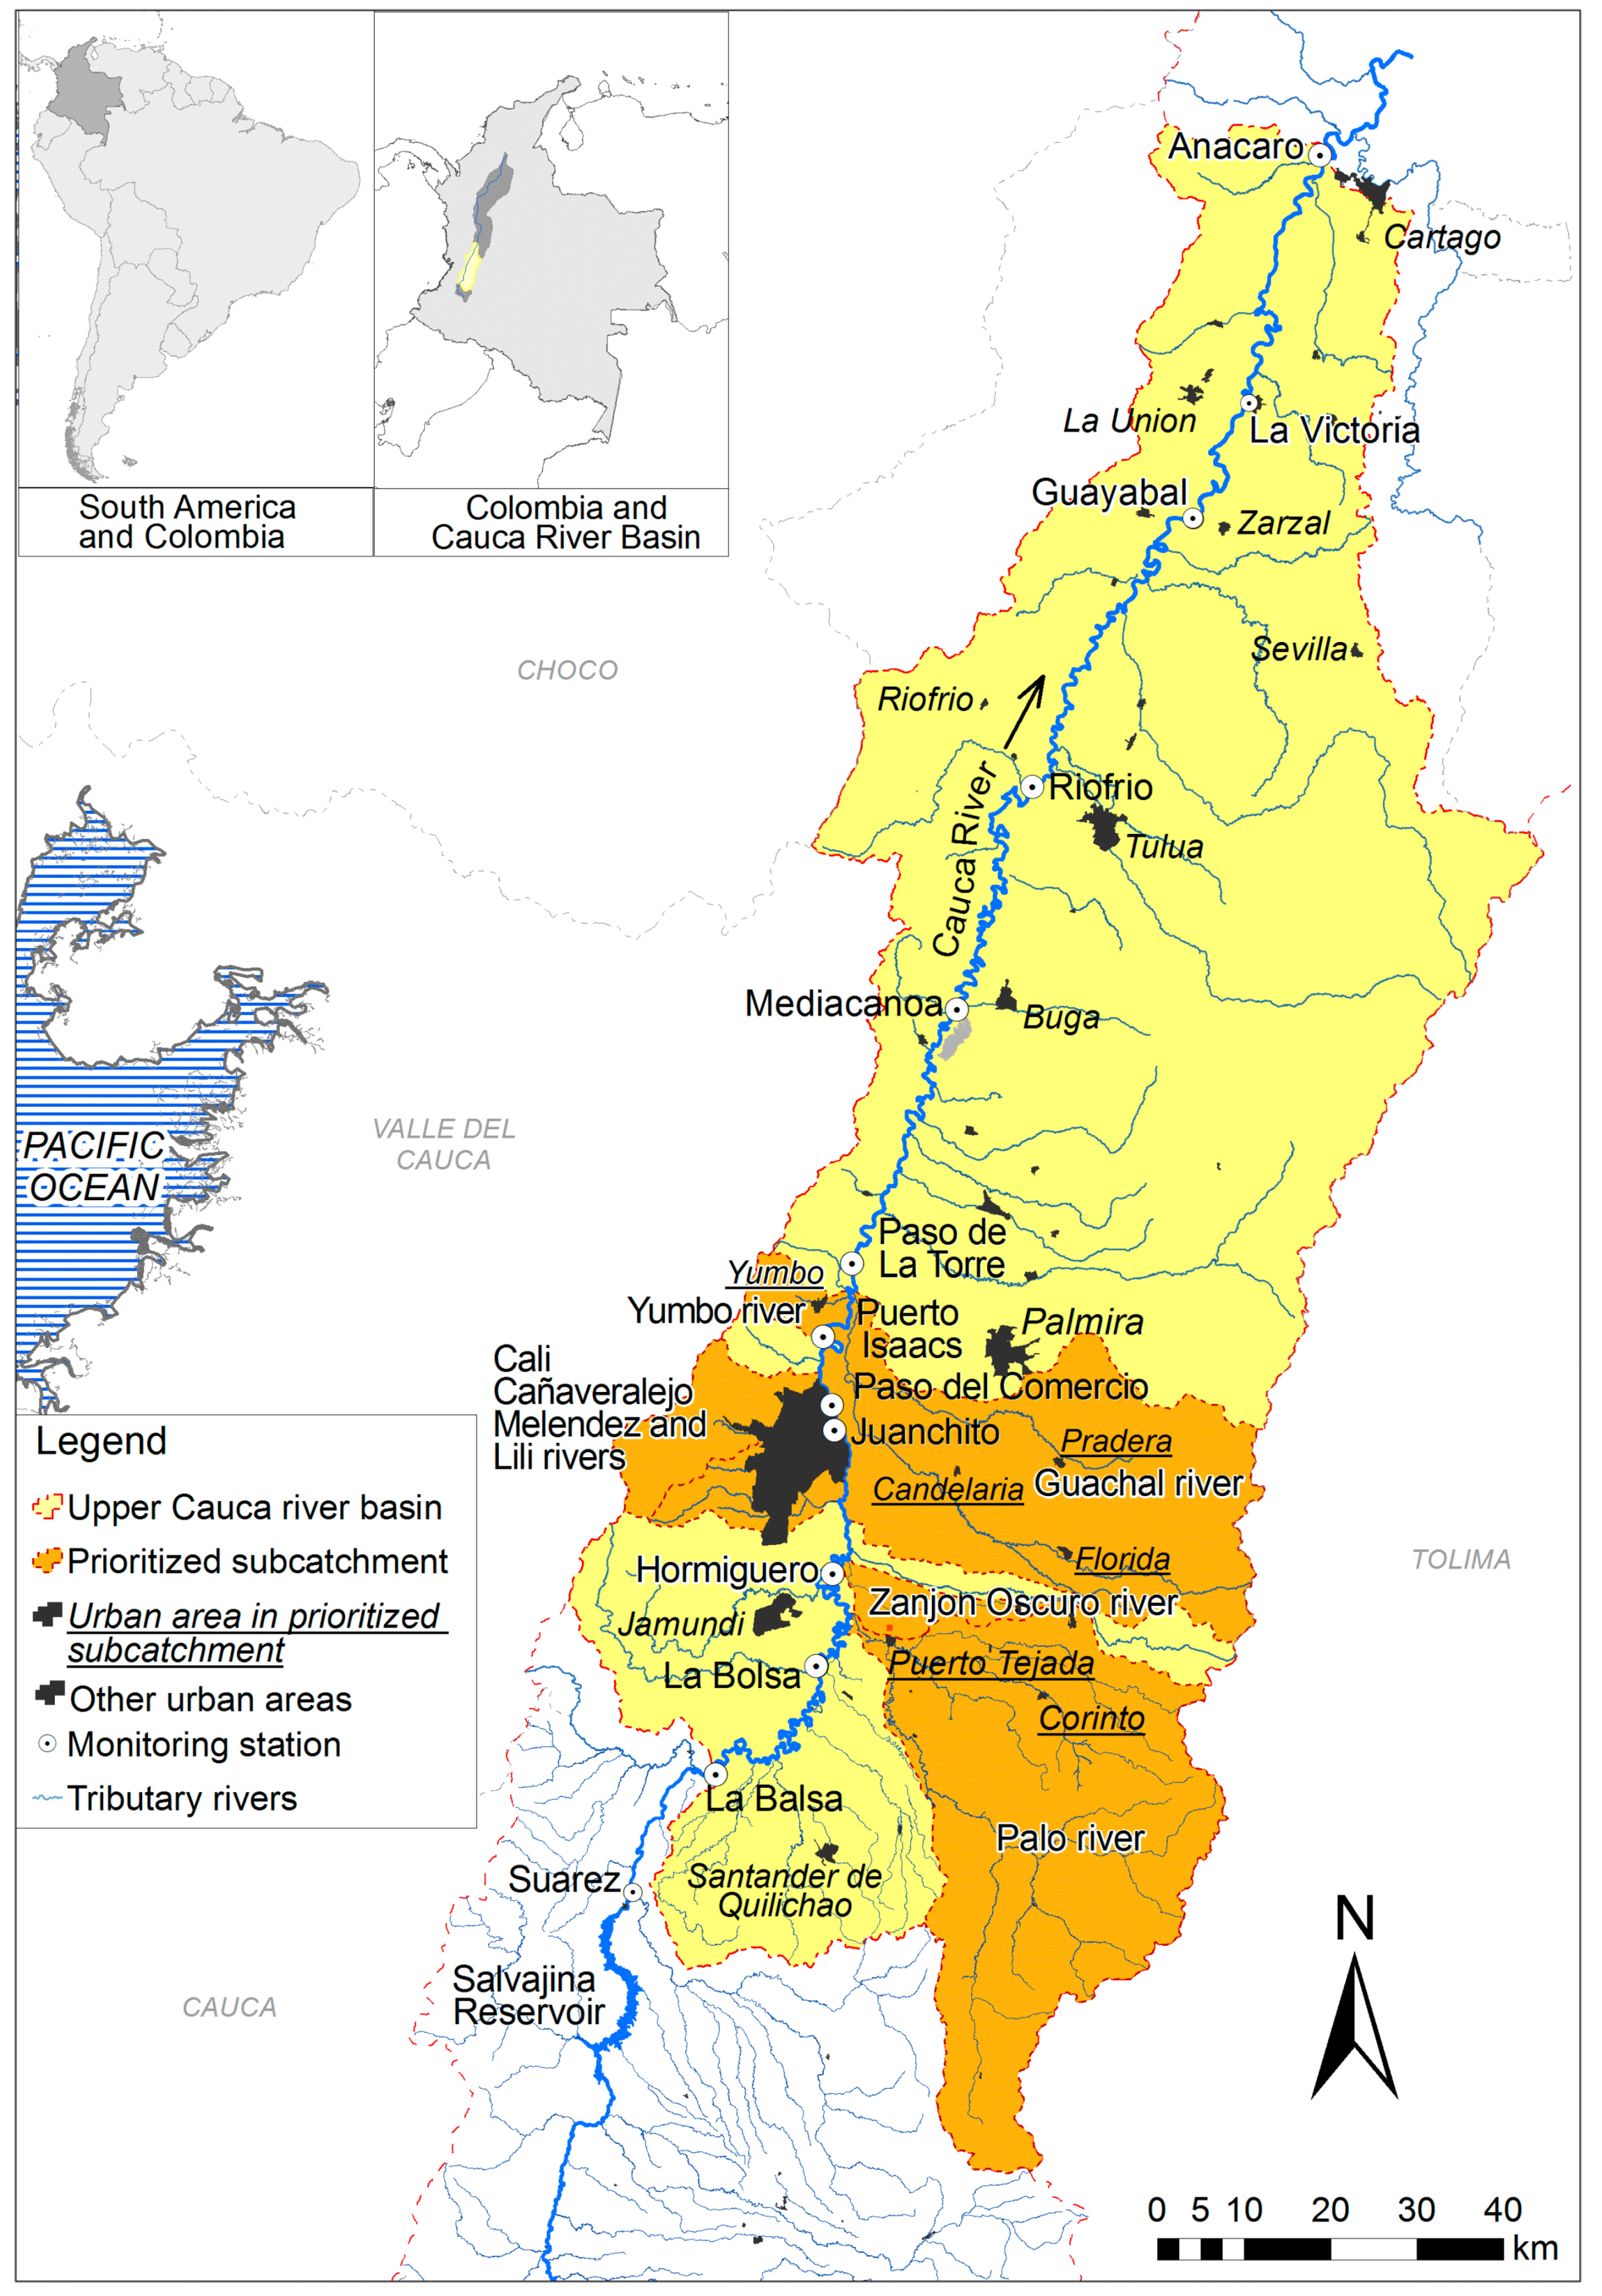
The study area is the Upper Cauca river basin (
Figure 1), in particular the stretch from La Balsa km 27.4 (980.52 meters above sea level m a.s.l.) to Anacaro km 416.1 (895.56 m a.s.l.). The Cauca River is the main water resource of the Colombian southwest. It has a total longitude of 1204 km with a tributary area of 59,074 km
2. The La Balsa–Anacaro stretch has an average width of 105 m and the depth varies between 3.5 m and 8.0 m. The longitudinal profile of the river shows a concave shape with a hydraulic slope, which oscillates between 1.5 × 10
−4 m/m and 7 × 10
−4 m/m [
20]. The average annual rainfall varies between 938 mm (the central sector) and 1882 mm (southern sector). There are two dry season periods: December–February and June–September. Rainy days per year vary between 100 days (central sector) and 133 days (northern sector) [
21]. The sugar cane crops and the Colombian sugar industry are located in the flat area along the Upper Cauca river basin. In the mountain area, there are coffee crops and associated industry. The Cauca River is used for fishing, recreation, power generation, riverbed matter extraction, irrigation, industry, and as a main source for drinking water supply. The Salvajina reservoir began operations in 1985 and is part of the regulation project of the Cauca River, implemented for flood control, improving water quality and power generation. The reservoir operates with a minimum flow discharge of 60 m
3/s and average daily flow rate of 143 m
3/s in the Juanchito station [
22]. The Cauca River is also used as a receiving source for solid waste and dumping of industrial and domestic wastewater, which is contributing to the decline in water quality.
2.2. Baseline Conditions—2013
The baseline conditions correspond to the dry season of 2013. In that year, the study area had 3.8 million inhabitants. For these conditions, the Cauca River received approximately 140 T/d of BOD
5 in the La Balsa–Anacaro stretch. The municipality of Cali (rivers and urban area) and four other prioritized sub-catchments), located upstream of the minimum DO station, represent 70.3% of the total pollutant load (BOD
5) discharged throughout the study stretch from pollution point sources (see
Figure 1 and
Table 1). The main characteristics of the baseline condition are described below.
Most of the wastewater discharges of Cali city originate in the urban sub-catchments of Cali, the Lili, Melendez and Cañaveralejo rivers. These three rivers flow into the Cali sewerage system via the South Channel (982 L/s, BOD5: 2.4 T/d), while the effluent of the WWTP of Cali city (6720 L/s, BOD5: 61.4 T/d) discharges to the Cauca River. Another part of the wastewater of the urban area of Cali is discharged directly to the Cauca River via two pumping stations: Floralia (212 L/s; BOD5: 3.5 T/d) and Puerto Mallarino (842 L/s; BOD5: 4.9 T/d).
In the 31 sub-catchments of the study area there are 38 municipalities. For the baseline condition, 19 municipalities had WWTP, four of which were out of operation (municipalities: Villa Rica, Pradera, Yumbo and Cerrito). The WWTP technologies for baseline conditions were: (1) preliminary treatment + up-flow anaerobic sludge blanket (UASB) + trickling filter + secondary settler (two municipalities, flow: 30–300 L/s); (2) preliminary treatment + anaerobic pond + facultative pond (six municipalities, flow: 30–80 L/s); (3) preliminary treatment + high rate anaerobic pond + facultative pond (municipality of Cerrito: 90 L/s); (4) preliminary treatment + high rate trickling filter + secondary clarifier (municipality of Tulua: 330 L/s); (5) septic tank + upflow anaerobic filter (six municipalities, flow: 2–50 L/s); (6) preliminary treatment + anaerobic pond + aerobic filter (two municipalities, flow: 15–25 L/s); (7) preliminary treatment + dissolved air flotation unit (DAF) (municipality of Yumbo: 60 L/s). Sludge drying beds are used in most cases for sludge handling, this include treatment and final disposal, but the reuse of this sludge was not considered.
The infrastructure corresponding to the baseline (2013) of the WWTP of Yumbo was completely disregarded, because the system was not in operation. On the other hand, the Villa Rica WWTP needs to be optimized and 4 WWTPs (municipalities: Guachené, Miranda, El Cerrito and La Union) need to be expanded to ensure the required treatment level. In the Upper Cauca river basin, there are three municipalities, each with discharges to two different sub-catchments: Puerto Tejada (Palo and Zanjon Oscuro rivers); El Cerrito (Cerrito and Zabaletas rivers) and Ginebra (Zabaletas and Guabas rivers). For each of these municipalities two WWTPs were considered.
In larger municipalities, especially in Cali city, industries with direct discharges to the municipal sewer system were included. This load was estimated at 6.7 T/d BOD5. However, in the study area (Upper Cauca river basin) there were, for baseline conditions, over 100 industries, most of them with treatment plants whose effluent was discharged into the Cauca River directly or through its tributaries. These discharges accounted for approximately 25 T/d BOD5. 80% of this load corresponded to only 12 industries, which had relatively high BOD5 discharges despite the fact that these industries had wastewater treatment plants.
2.3. Formulating Strategies: Conventional (‘Business as Usual Scenario’) and Unconventional (3-SSA)
Two types of strategies projected to 2033 were defined in the context of the Upper Cauca river basin, La Balsa–Anacaro stretch: (1) the conventional strategy, which considers a ‘business as usual scenario’ of high water use, end-of-pipe wastewater treatment and conventional water supply providing drinking water quality for all uses; and (2) the unconventional strategy, applying the 3-SSA.
For the two strategies, industrial discharges to the Cauca River (directly or via tributaries) remain constant over the horizon of the analysis. The projection of pollutant loads was performed to the projection horizon (2033). The construction of the infrastructure was completed in 2016. For the baseline conditions (2013), the consolidated area of Cali city had 1.85 million inhabitants, distributed over 74% single family housing units and 26% multifamily housing blocks [
23]. In this research, the existing urban area for the baseline conditions is considered to be a ‘consolidated area’. It is assumed that the population of the ‘consolidated area’ remains constant until 2033. The future population growth will be accommodated in the expansion area of Cali (607,696 inhabitants in 2033) with a distribution of 85% single family housing and 15% in multifamily housing. For the other municipalities only single-family homes will be scheduled.
Available information in the Public Services Unified Information System of the Republic of Colombia (SUI) and the National Administrative Department of Statistics of Colombia Republic (DANE) was used for the construction of the baseline conditions (2013). Information provided by the environmental authorities in the region (CVC and CRC), Research Centre of Sugarcane Cenicaña [
24], municipalities, consultant companies and service providers were used to characterize the hydrology, the hydraulics and the water quality for the Cauca River (main channel), tributaries and sub-catchments. Some of this information has been systematized and analysed in previous reports [
25,
26,
27]. The projection of population growth was made based on DANE [
28]. For the Cali city case, the average flow of wastewater was estimated as 80% of the water supply and the maximum hourly wastewater flow factor (FM) was obtained from the expression FM = 2.3(Qm)
−0.062, where Qm is average flow [
29]. For both the conventional and unconventional strategies, it was assumed that the flow rates and BOD
5 loads from the industrial sectors, located outside of the urban areas, remain constant and equal to the baseline values, for the entire projection horizon (2033). The same assumption was made for the wastewater produced by the scattered settlements.
2.3.1. Conventional Strategy
For the conventional strategy, in 2016 (i.e., 3 years after the baseline year) all municipalities were assumed to have a WWTP that ensures compliance with existing national regulations, reaching 80% removal of BOD5 and TSS planning horizon. This involves optimizing/extension of existing WWTPs (baseline conditions) and building new WWTPs for all the municipalities in the study area that still had no WWTP. With regard to Cali, it is assumed that the future population will settle in the expansion area and a second WWTP will be built there. For the technology selection of these new plants, information of existing plants was compiled and cost models for major technological schemes were developed.
For the conventional strategy, most of Cali’s wastewater discharges reach the existing treatment plant (WWTP-C) and is treated at advanced primary level for baseline conditions. An activated sludge step-feed system was selected, according to Hazen and Sawyer’s design for Cali city, with the following characteristics: flow 7396 L/s, BOD5 influent: 110.8 T/d; BOD5 effluent: 22.2 T/d. Cali city will have an additional treatment plant, which will receive wastewater from the expansion area and South Channel illegal connections. The selected technological scheme includes: primary treatment + UASB + maturation pond, flow: 1075 L/s; BOD5 influent: 27.6 T/d and BOD5 effluent: 5.5 T/d. In addition to these two new plants for Cali, 24 WWTPs for other municipalities are required. These plants were distributed as follows: 19 in municipalities that do not have WWTPs and according to their topographic features require only one treatment plant; two municipalities (Cerrito and Ginebra) requiring each an additional treatment plant to the one already existing, and the municipality of Puerto Tejada which requires two treatment plants. Additionally, there is the WWTP of Yumbo whose existing infrastructure was completely disregarded for this analysis. The technologies for these 24 WWTPs for the conventional strategy were:
Scheme 1: Advanced primary (existing) + activated sludge step feed (Cali, WWTP-C)
Scheme 2: Preliminary + UASB + maturation pond (Cali, expansion area)
Scheme 3: Preliminary + UASB + trickling filter + secondary settler (municipalities: Santander de Quilichao, Sevilla, Zarzal)
Scheme 4: Preliminary + anaerobic pond + facultative pond (municipalities: Puerto Tejada, discharge to Zanjon Oscuro River, Candelaria, Yotoco, El Cerrito, San Pedro, Andalucía, Vijes, Bugalagrande, Ansermanuevo, La Victoria, Obando)
Scheme 5: Preliminary + high rate trickling filter + secondary clarifier (municipalities: Jamundí, Yumbo, Palmira)
Scheme 6: Septic tank + anaerobic upflow filter (municipalities: Puerto Tejada, discharge to Palo River, Ginebra, Trujillo)
Scheme 7: Preliminary + UASB + facultative pond (Buga)
Scheme 8: Preliminary + anaerobic pond + aerobic filter (Bolivar)
Scheme 9: Preliminary + high rate anaerobic pond + facultative pond (Florida)
With regard to sludge handling, the following technologies were used: for Scheme 1, thermal and for Scheme 5, sludge thickener + primary sludge digester + secondary sludge digester. For other schemes drying beds were selected.
It is important to take account of the fact that, in this research, conventional or non-conventional does not refer to the technology of WWTPs, but the strategy. The technology indicated here was based on existing WWTPs and technologies that have been considered in preliminary studies and designs by consultants for the municipalities.
Table 2 shows the BOD
5 discharged to the Cauca River for the Conventional Strategy, projected to 2033.
2.3.2. Unconventional Strategy
For the unconventional strategy, the 3-SSA was applied in prioritized sub-catchments and municipalities from 2016 onwards prioritised sub-catchments, assuming required infrastructure and operational measures were fully in place by 2016. However, in Step 1 (prevention and minimization), low consumption devices, rainwater harvesting and grey water reuse were applied, along the project horizon, in major urban centres, with different criteria for existing households and new households. Step 2 (treatment for reuse) includes the reuse of WWTP effluent for agricultural irrigation. Step 3 (stimulate natural self-purification) identifies the sub-catchments with the highest contribution of pollutant load (BOD
5) and prioritizing interventions of steps 1 and 2 upstream of the Paso de La Torre Station (
Figure 1), where the minimum DO occur (baseline conditions).
Step 1: Prevention and Minimization
This includes reduction in water consumption, by changing habits, use of low consumption devices, grey water reuse and rainwater harvesting [
2]. With the implementation of Step 1, the average consumption was reduced with different criteria for multifamily households and single-family households. For new multifamily dwellings (in Cali city only) a small reduction of BOD
5 and TSS loads via the grey water reuse was assumed. The unit consumption for the Baseline Conditions (2013) were: Cali consolidated area, including drainage area of WWTP-C: 250 L/p/d and expansion area: 150 L/p/d (proposed for the conventional strategy), while consumption in the prioritized municipalities varied between 114 and 184 L/s. As a result of the strategies for minimizing these consumptions, they were reduced to 95.3 L/s for Cali consolidate area, 69.3 L/s for the expansion area of Cali and 93 L/s for the other prioritized municipalities. The greatest reduction in consumption for the expansion area of Cali was because in new multifamily households, besides the change of habits and implementing low consumption devices, reuse of treated greywater and rainwater harvesting were included. In this case the pollutant load reduction was small (1.1 T/d BOD
5), because the prevention measures implemented in the multifamily housing in the expansion area of Cali were marginal, so only 5% of BOD
5 prevention was achieved. However, the sewage was more concentrated due to lower water consumption. Among the largest cities in Colombia, Cali is the one with the highest water consumption. The defined value here is 11.3 m
3/household/month for single households and 11.8 m
3/household/month for multifamily housing. However, for the expansion area of Cali, the change of habits, low consumption devices, combined with grey water reuse and rainwater harvesting reduces consumption to 7.9 m
3/household/month in multifamily households. With these approaches applied to all the prioritized municipalities, a total reduction in consumption of 5098 L/s is achieved, which also leads to reduction in wastewater flows. This represents benefits by the following avoided costs: water and sewer tariffs, tax for water use in the water supply system, tax for wastewater discharges directly to water bodies and smaller infrastructure of water supply systems (water supply network and drinking water treatment plant (DWTP)) and WWTP.
Step 2: Treatment for Reuse
This step includes the reuse of treated wastewater in the irrigation of sugarcane crops and prioritization of investments to maximize impact in improving the water quality of the Cauca River in the study area, targeting interventions in municipalities and sub-catchments with the highest pollutant load. These crops occupy more than 80% of the geographical valley (flat area) of the Cauca River (La Balsa–Anacaro stretch). This large area of sugarcane cultivation, makes that sufficient space is available for reuse. In 2016, to ensure compliance with national regulations (removal of BOD and TSS), the prioritized municipalities had to guarantee the quality of WWTP effluent for irrigation of existing sugar cane crops. Technology was selected involving public health criteria [
30] and agrological quality for agriculture irrigation [
31]. This involved the optimization of existing plants and building new WWTPs in prioritized municipalities. To analyse the reuse feasibility, it was necessary to study the aquifer vulnerability [
32] and to calculate the required irrigation area via cartographic analysis using ArcGIS 9.3. To complete this analysis, it was also necessary to develop the agricultural plan to verify the projected sugar cane crops water demand, developing a simplified water balance [
33], including the calculation of: effective precipitation [
34], current evapotranspiration using the Food and Agriculture Organization FAO methodology combined [
35] and Cenicaña [
36]. Water balances and irrigation requirements were made for each case, considering that the distribution of rain in the basin varies in space and time. Irrigation is by furrows with efficiency of about 40% [
37]. This means that of every 100 L that are used in the irrigation of crops, only 40 L are actually used by the crop. The effluent from the WWTP is discharged into the Cauca River, directly or through its tributary rivers, when the soil is saturated (rainy season).
With the minimizing of consumption, influent flow to WWTP-C is reduced from 7396 to 4167 L/s, while the BOD
5 load (T/d) remains the same as for the conventional strategy. Approximately 80% (3326 L/s) of the total flow of WWTP effluent was used to irrigate sugar cane crops located on the right bank of the Cauca River. The remaining flow (841 L/s) was discharged directly to the Cauca River, considering that the removal of 80% in BOD
5 (T/d) and TSS (T/d) was achieved (Colombian regulations in 2013), without the need to build another treatment plant for this flow. The technology used to guarantee water quality for irrigation consisted of the following processes: advanced primary treatment (baseline conditions) + UASB + maturation pond + maturation pond. For the expansion area of Cali, prevention and minimization strategies reduced the influent flow to the WWTP to 576 L/s and to ensure the quality of the effluent for agricultural reuse, a maturation pond was added. According to the irrigation area characteristics and the agricultural plan, it was possible to irrigate 3080 ha during 334 days per year with the effluent of WWTP-C and to irrigate 2276 ha of sugar cane crops during 62 days per year with the effluent of the WWTP of the expansion area. During agricultural irrigation days with treated wastewater, two direct wastewater discharges into the Cauca River were avoided: 10.9 T/d from WWTP-C and 0.6 T/d BOD
5 from the WWTP of the expansion area. In the cases of Puerto Tejada WWTP (discharging effluent into the Zanjón Oscuro River) and Candelaria WWTP, selected technology in the Conventional Strategy guaranteed the water quality of effluent for reuse, so for this case the implementation of any additional process was not required. For the municipality of Florida, reuse of WWTP effluent was not feasible due to the vulnerability of the aquifers. The local environmental authority, based on Foster and Skinner [
32] has defined this vulnerability. It is a function of depth water table, net recharge, aquifer media, media soil, topography, impact of vadose zone, hydraulic conductivity, ground water occurrence and fertilization with nitrogen. The other prioritized municipalities (Corinto, Puerto Tejada, Yumbo, Candelaria, Pradera and Palmira) corresponded to 705 L/s of wastewater for reuse in sugar cane crops, in 2033. To ensure water quality for reuse, it was necessary, in each municipality, to add a maturation pond to the selected technological scheme of the Conventional Strategy, to meet the standards of pathogen removal, where helminth eggs is a critical parameter. According to the irrigated area characteristics and results of the agricultural plan, it was possible to irrigate 937 ha during 304 days in the municipality of Yumbo. For the remaining municipalities, considered together, it was possible to irrigate 3332 ha during 62 days per year.
In summary, for the unconventional strategy, Steps 1 and 2 were implemented only for Cali and municipalities of greater contribution of pollutant load in the prioritized sub-catchments: the Palo River (municipalities: Corinto and Puerto Tejada); the Zanjon Oscuro River (municipality: Puerto Tejada); the Yumbo River (municipality: Yumbo); the Guachal River (municipalities: Candelaria, Palmira and Pradera).
Table 2 shows the BOD
5 discharged to the Cauca River for the unconventional strategy (3-SSA), projected to 2033.
Self-Purification Capacity
In this research, the stimulation of the self-purification capacity of the waterbody was associated with the prioritization of the investments in Steps 1 and 2, upstream of the station with the minimum DO. This increases this minimum value and avoids the Cauca River to reach anaerobic conditions, which would limit the natural self-purification process.
Table 2 shows the BOD
5 discharges for each strategy. For the Conventional Strategy in 2033 the total load discharged to the Cauca River was 75 T/d BOD
5, which is a reduction of 46.4% compared to the baseline conditions (2013) total discharge, while for the unconventional strategy the discharge was 70.5 T/d BOD
5 which means a reduction of 50%.
2.3.3. Mathematical Modelling to Assess the Impact of Strategies on Water Quality of the Cauca River
The hydrodynamic and water quality model of the Cauca River was implemented in the MIKE 11 model. The Cauca River has 15 monitoring stations in the La Balsa–Anacaro stretch (
Figure 1). The calibration and validation of the quantity (roughness) and quality (BOD, DO) components to apply the MIKE 11 model were based on [
26]. The model consists of 387 cross sections, 2 external boundaries: La Balsa (km 27.4) and Anacaro (km 416.1), 95 internal boundaries which include 34 rivers and streams, municipal wastewater discharges, 24 industrial wastewater discharges and 36 water extraction sites [
18]. Two monitoring campaigns were used: calibration (2005) and validation (2003). The quality component of the MIKE 11 model at Level 1 and the Churchill equation for the re-aeration calculation were selected. Then the values resulting from the calibration-validation process are presented: Strickler roughness (m
1/3 s
−1); BOD
5 degradation constant (d
−1) and Benthic Oxygen Demand (g O
2/m
2/d). The values are presented in this order for each monitoring station on the Cauca River, the La Balsa–Anacaro stretch: La Balsa (40; 0.15; 1.5); La Bolsa (20; 0.15; 2) Hormiguero (40; 0.3; 3); Juanchito (33; 0.4; 5); Puerto Isaacs (60; 0.35; 5); Paso de la Torre (60; 0.33; 3); Mediacanoa (34; 0.2; 2); Guayabal (30; 0.17; 1); La Victoria (33; 0.17; 1) and Anacaro (32; 0.17; 1).
2.3.4. Cost Benefit Analysis (CBA)
Environmental and economic benefits were calculated. Common benefits, such as health benefits, were not included, and only the incremental costs and incremental benefits were considered. ‘Incremental’ means that common benefits and common costs were not considered. Additionally, it means that there are differentiated costs and benefits only where the relative values between the two strategies were considered. For example, for prioritized municipalities of the unconventional strategy, additional costs were included for additional treatment processes to ensure the wastewater quality of the effluent of WWTP to irrigate sugar cane crops.
For costing, constant prices were used without inflation [
38] Infrastructure investments were projected to 20 years and a project horizon for the cost-benefit evaluation of 20 years was adopted. A social discount rate of 11.75% was applied [
39]. For the conventional strategy, the following was calculated: initial investment cost of the new WWTPs and optimization cost of existing WWTPs and operation and maintenance (O&M) of new and existing WWTPs. On the benefits side, reduction in tax for wastewater discharged to water bodies was calculated.
Initial investment and O&M cost associated with the unconventional strategy included the use of low consumption devices, rainwater harvesting, grey water reuse, optimization of WWTPs for reuse of the effluent, agricultural irrigation network and the pumping of the effluent of the Cali wastewater treatment (WWTP-C), to bring treated wastewater from the left bank to the right bank of the Cauca River, to reach sugarcane farms. The incremental benefits were corresponding to avoided cost due to implementation of 3-SSA. These benefits (avoided costs) have been classified into four groups: (1) initial investment and O&M of the drinking water distribution network, the WWTP and infrastructure (wells and pumping stations) for irrigation of sugar cane crops using groundwater; (2) reduction in water supply tariff and sewer tariff; (3) saving from reduced use of fertilizers and reduction in payment of fee for water use; (4) reduction in tax for wastewater discharge directly to water bodies. Information from local institutions and cost models obtained with information about the region [
40] were used to obtain the initial investment and O&M costs of the WWTP. This same method was used to estimate the costs associated with the water supply infrastructure and wells and pumping stations for irrigation of sugarcane crops [
41]. The cost of power consumption was estimated as 0.13 Euros/kW-h.
In the CBA, Year 1 corresponds to baseline conditions (2013) and major infrastructure investments was proposed to be made in Year 3 (2016). Investments in grey water reuse and rainwater harvesting are done gradually between 2016 and 2033. The costs and benefits associated with O&M, taxes and fees were considered each year from Year 4 (2017) until Year 20 (2033). Costs were obtained in Colombian pesos and a conversion rate of 1 Euro = 2500 Colombian pesos was used. Based on information specific to sugar cane crops in the Valle del Cauca [
42]. The following prices for fertilizers were used: NPK = 0.53 Euros/kg and urea = 0.58 Euros/kg. For taxes, fees and tariffs specific values were applied to each prioritized municipality. The information was obtained from the local and regional environmental authorities [
43,
44]. The ranges corresponding to the baseline conditions were: water supply tariffs: 0.27 to 0.42 Euros/m
3/month; sewerage tariffs: 0.16 to 0.49 Euros/m
3/month; tax for surface water for domestic use: from 0.0003 to 0.0009 Euros/m
3; tax for groundwater for agricultural irrigation use: 0.0003 to 0.001 Euros/m
3; tax for wastewater discharges directly to water bodies: 0.020 Euros/kg SST and 0.047 Euros/kg BOD
5.
4. Discussion
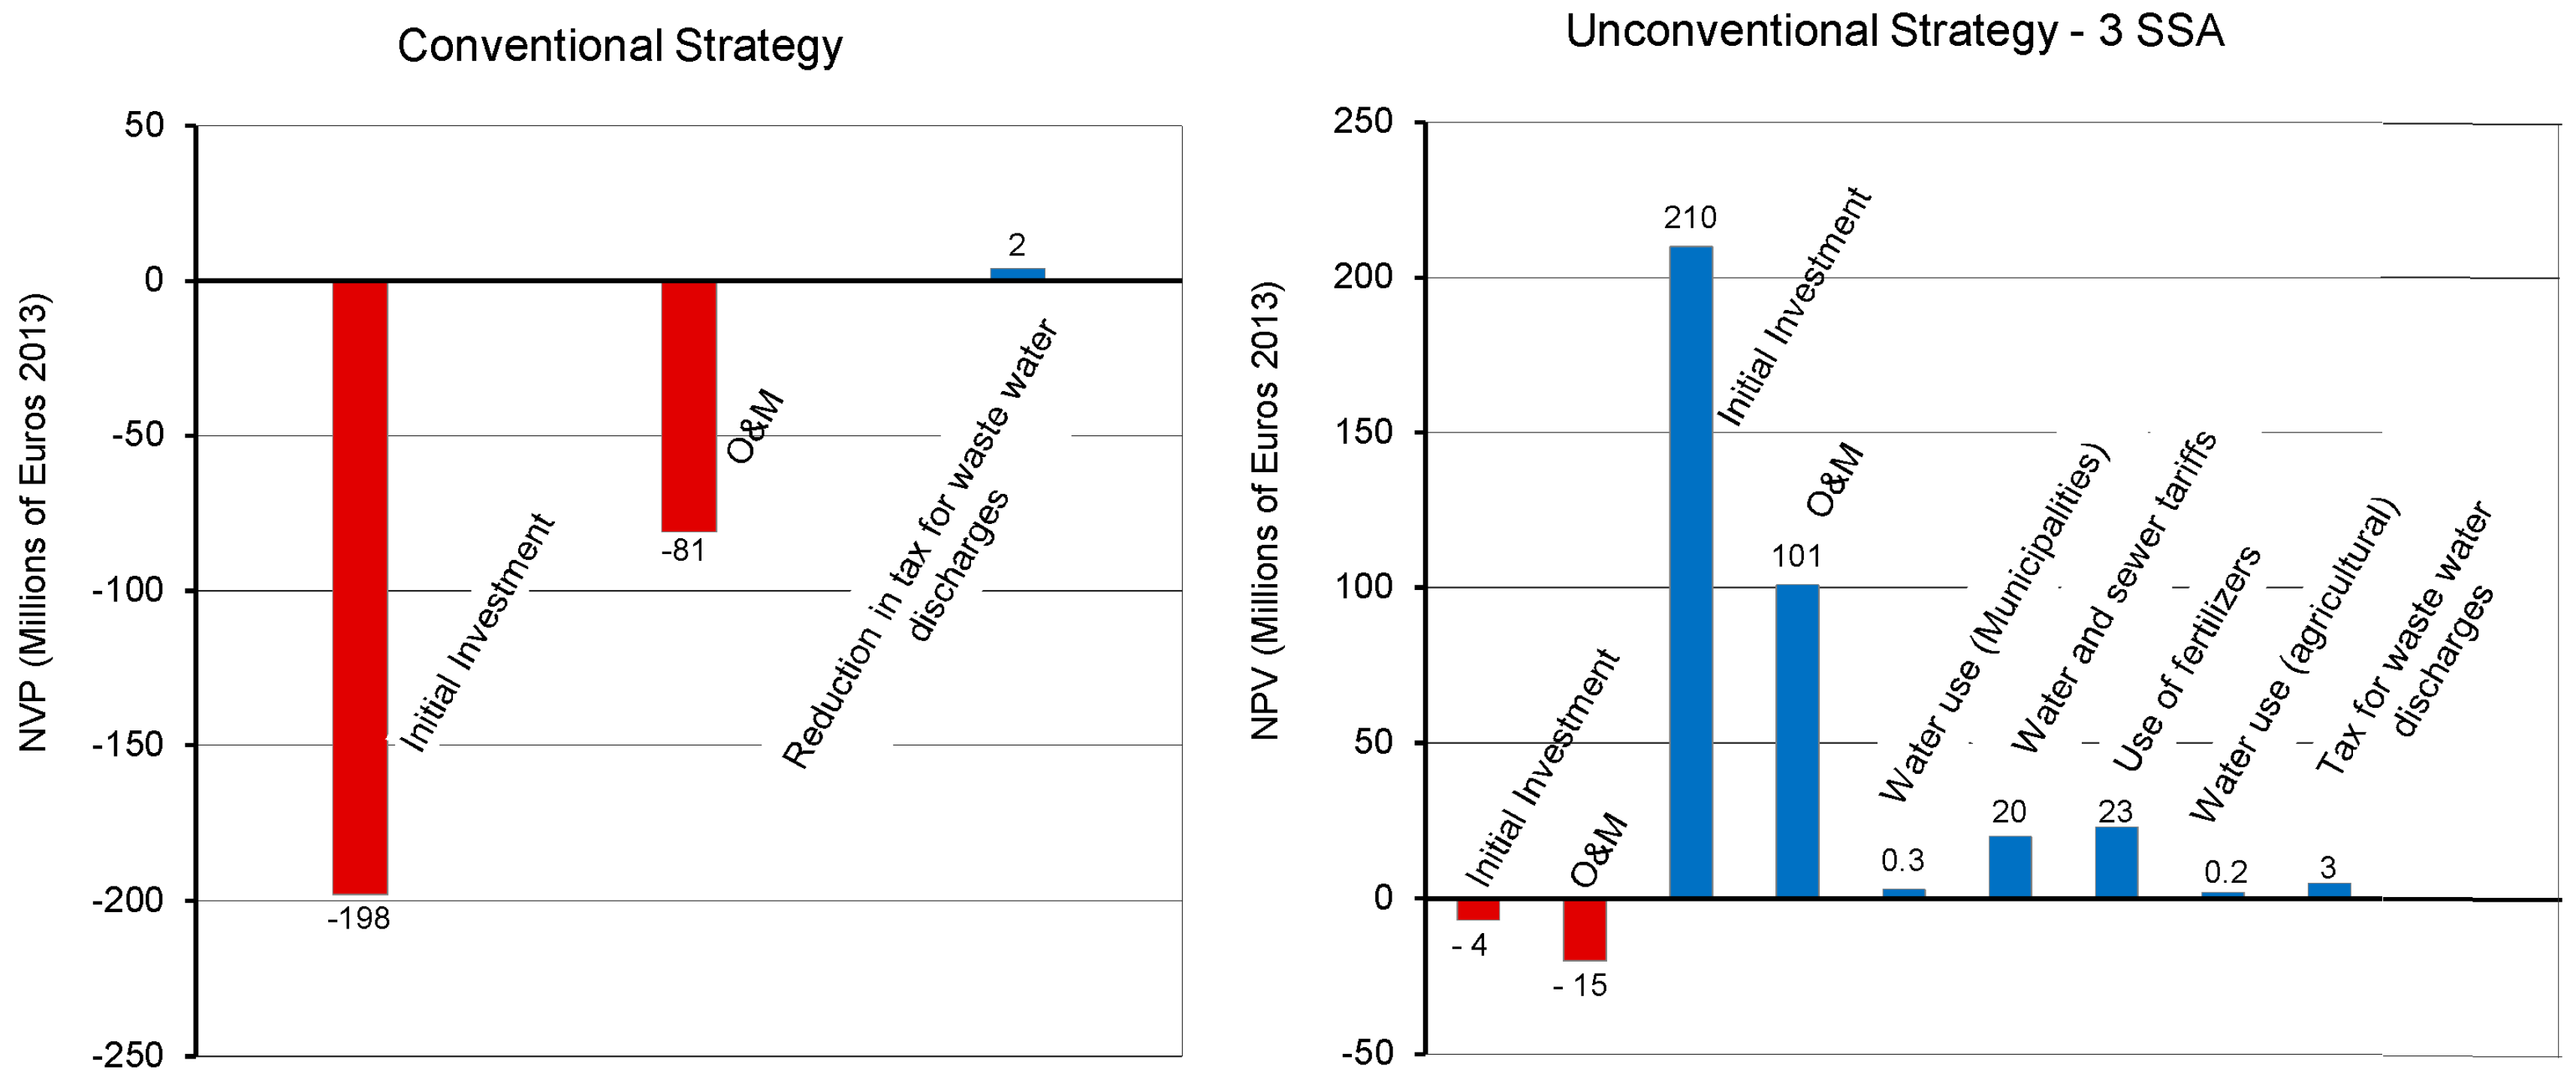
The results of this study show that the unconventional strategy (3-SSA) has a superior performance compared to the conventional strategy with respect to cost effectiveness of treatment and water quality management.
Figure 3 shows for the Upper Cauca river basin case the factors that have a relatively large impact on this positive result. Among these main factors are the higher initial investment and O&M costs of the WWTPs for the conventional strategy compared with the unconventional strategy. Moreover, infrastructure of wastewater treatment was much smaller for the unconventional strategy. This reduction was due mainly to the joint effects of the prevention/minimization measures (Step 1 of 3-SSA): the change of habits, introduction of low consumption devices, combined with grey water reuse and rainwater harvesting. For the Unconventional Strategy, initial investment and operation and maintenance O&M costs of the WWTPs represent approximately 77% of incremental benefits, of which 68% was associated with Cali city and 9% with other municipalities in the study area. For Step 1 the two factors contributing most to the CBA results are water and sewer tariffs, respectively. They correspond to 6.4% of incremental benefits.
As for Step 2 (treatment for reuse), the most important factor is the avoided cost by use of fertilizer. Avoided costs by taxes for water use and taxes for wastewater discharges directly to water bodies are negligible, since these unit costs are extremely low. For example, taxes for agricultural irrigation are about 300 times lower, as a percentage of minimum wages, compared with raw water prices in Europe and the United States. Despite this, sugarcane farmers report that irrigation represents between 30% and 60% of total costs of cultivation [
24]. Due to rapidly growing water demands from municipal, agricultural and industrial uses, and consequent water scarcity, farmers have recently started to introduce efficient irrigation management practices. They are looking to change the irrigation by furrows, with efficiencies of approximately 40% [
37], to sprinkler irrigation systems with efficiencies between 80% and 85% and drip irrigation which can achieve efficiencies of 90%. Colombia is among the countries with the highest use of raw wastewater in agricultural irrigation [
45], while irrigation with treated wastewater is virtually non-existent [
46]. Recently the Government of Colombia introduced new regulations for the use of treated wastewater [
47] through which it aims to encourage reuse in both agricultural irrigation and other types of use. The use of treated wastewater must simultaneously ensure that discharge of toxic compounds by households (e.g., metals, chemicals) and industries is substantially reduced, to eliminate potential public health risks.
Step 3 relates to the stimulation of self-purification aimed at speeding up the recovery process of water resources after an organic pollution episode. In this process, organic compounds are diluted and progressively transformed by microbial decomposition. In the rivers, the self-purification capacity depends mainly on: (a) the flow, which will dilute the discharged pollution and will facilitate its subsequent degradation to reduce its negative impact on water quality; (b) water turbulence, which provides oxygen to the water favouring microbial activity, (c) biological activity, in particular from algae and aquatic plants which introduce oxygen into the water column during daytime, (d) river morphology (flood plains provide shallow areas with increased capacity for self-purification), and (e) the nature and amount and time distribution of the discharges. Although there are limitations to its implementation in the case of the Cauca River, these last two strategies could be the most effective. For the stretch of the Cauca River considered in this study, self-purification capacity was heavily affected by abrupt changes in its dilution ability and by the type, size and spatial distribution of the received pollution. For the Cauca River, most of the self-purification capacity was lost in the last 60 years. For instance, a wetland area of 300 km
2 in the 1950s was reduced in 1986 by 90% [
48].
In this research, the self-purification capacity was associated with the prioritization of investments to maximize impact in improving the water quality of the Cauca River, considering the upper river basin as the unit of analysis. With this approach, the interventions in watersheds and municipalities with the highest pollutant load and located upstream of the minimum DO (Puerto Isaacs Station) were prioritized. This strategy arises taking into account the limitations of the Salvajina Dam, located 139 km upstream of the Juanchito Station, to stimulate the self-purification capacity of the Cauca River [
18]. The options for re-aeration by turbulence are limited because the Cauca River slope is reduced from 7 × 10
−4 m/m on the Salvajina–La Balsa stretch to 1.5 × 10
−4 m/m on the La Balsa–Mediacanoa stretch [
20]. This low slope coincides with the stretch where the river receives 70% of its pollution load (
Figure 1 and
Table 1).
The strength of 3-SSA (unconventional strategy) was the joint and systematic application of the three steps in the context of the basin. In the Cauca River case, the advantages in comparison to the conventional strategy are very clear. The unconventional strategy achieved lower BOD5 discharges, higher minimum DO value and a better CBA. The increases of minimum DO (0.4 mg/L) could be equivalent to the additional investment requirement in the ‘end of pipe solutions’ (WWTPs) in the conventional strategy to achieve the same concentration of DO at the critical point reached with the unconventional strategy (3-SSA). This implies that the CBA would be even more favourable for the 3-SSA.
The present study was developed considering only point source pollution and basic parameters such as BOD and DO for dry season conditions. In addition, the water quality modelling was conducted for steady flow conditions in the Cauca River and its tributaries. Further studies will be required to assess the benefits of the 3-SSA considering conditions of unsteady flow conditions and the combined impact of wastewater and urban and rural (agricultural) runoff [
18]. Under these conditions, the use of sustainable urban drainage systems (SUDS) as part of the 3-SSA could be considered. Other strategies to consider are: real-time control (automation) of urban drainage and implementation of early warning systems [
49], and the impact of optimising eco-hydrolical flows in river-associated wetlands to increase self-purification (Step 3).
For efficient water management in the study basin it is necessary to assign real values to raw water, especially to that used in agriculture. If this decision is implemented, Step 1 (minimization and prevention) and Step 2 (treatment for reuse) will increase their viability (CBA).
5. Conclusions
Although actions aimed at pollution control in the Upper Cauca river basin date back over 40 years, the river water quality in the study area continues to decline. This situation persists despite the fact that 19 of the 41 municipalities have WWTPs. In spite of substantial investment in WWTP infrastructure and its O&M costs, the water quality of the Cauca River does not meet the requirements of its uses, including water supply for 76% of the population of Cali city. This approach is limited because it is focused on ‘end of pipe solutions’ and it does not consider the basin as the unit of analysis and the investments are not executed taking into account their priority and their true impact on the quality of water resources.
The difference between the NPV of incremental benefits and NPV of incremental costs was +338,266 × 103 Euros for the unconventional strategy (3-SSA) and −276,318 × 103 Euros for the conventional strategy. These results show a clear advantage of the 3-SSA. The CBA mainly reflected the impact of prevention and minimization (Step 1) and the reuse of treated wastewater (Step 2).
Using WWTP effluent for irrigation prevented discharge of residual pollutants into the river, especially upstream of the Paso La Torre Station, and also created economic benefits. The Unconventional Strategy, based on the 3-SSA, resulted in a larger increase of the minimum DO to 2.0 mg/L (Paso de La Torre Station, km 171) for 2033, obtained with the smallest load discharged into the Cauca River. The minimum DO for the Baseline (2013) was 0.6 mg/L (Puerto Isaacs Station, km 155) and for Conventional Strategy (2033) it was 1.6 mg/L (Paso de La Torre Station, km 171).
For the Upper Cauca river basin, CBA results also clearly favored the 3-SSA (unconventional strategy). This result is mainly due to the large differences in initial investment and O&M costs of WWTP in municipalities for the two strategies. For the unconventional strategy, the WWTPs are smaller due the application of the prevention and minimization approaches and treatment for reuse. The impact of the designed treatment system for Cali is very important, considering the population size and costs of activated sludge technology selected for secondary treatment in the conventional strategy.
The application of the 3-SSA resulted in avoided costs for initial investments and O&M, especially for groundwater wells and associated pumps for sugar cane irrigation. Furthermore, costs were avoided by optimization of WWTPs, tariffs and finally by replacement of fertilizers. Avoided costs by taxes for water use and taxes for wastewater discharges directly to water bodies are negligible, since these unit costs were extremely low in Colombia.
The study showed overall positive effects of the 3-SSA on wastewater management in the Cauca basin, primarily through its prevention measures and reuse of the treated wastewater.


