Next Article in Journal
Spatial and Seasonal Variations of Water and Salt Movement in the Vadose Zone at Salt-Impacted Sites
Next Article in Special Issue
The Effect of Pervious Concrete on Water Quality Parameters: A Case Study
Previous Article in Journal
Water Environment Variation in the Three Gorges Tributary and Its Influencing Factors on Different Scales
Previous Article in Special Issue
Multi-Criteria Evaluation for China Low-Impact Development Based on Principal Component Analysis
 
 
Correction published on 6 March 2019, see Water 2019, 11(3), 474.
Article

Assessing the Feasibility of Soil Infiltration Trenches for Highway Runoff Control on the Island of Oahu, Hawaii

1
Faculty of Civil Engineering, Czech Technical University in Prague, 166 29 Prague, Czech Republic
2
Swedish Meteorological and Hydrological Institute, Norrköping, 601 76, Sweden
3
Water Resources Research Center, University of Hawaii, Honolulu, HI 968 22, USA
4
Nebraska Water Center, University of Nebraska-Lincoln, Lincoln, NE 685 88, USA
*
Author to whom correspondence should be addressed.
Water 2018, 10(12), 1832; https://doi.org/10.3390/w10121832
Submission received: 13 November 2018 / Revised: 6 December 2018 / Accepted: 8 December 2018 / Published: 12 December 2018

Abstract

:
The coastal waters of Hawaii are extremely important for recreation as well as for the health of the marine environment. Non-point source pollution from storm runoff poses a great threat to surface water quality in Hawaii. The State of Hawaii Department of Transportation (HDOT) includes infiltration trenches as a best management practice (BMP) option to reduce pollution caused by stormwater runoff. HDOT guidelines state that the implementation of BMPs is needed to reduce sediment and pollutant loads to streams and the ocean. In this study, the suitability of soils adjacent to highways on Oahu for the siting of infiltration trenches was examined. In addition to field surveys and in-situ tests, laboratory investigations on soil properties, infiltration experiments on undisturbed soil columns, and mathematical modeling of hydraulic functioning of the infiltration trench were conducted. Dissolved metal concentrations in highway stormwater runoff were observed to exceed the groundwater environmental action levels for all heavy metals tested, but the soils had high sorption capacity for these metals. The results of the simulations indicated that all the sampled Oahu soils, with one exception, would require less than two hours to drain a filled hypothetical trench. Therefore, these soils are suitable for construction of infiltration trenches as a possible BMP, even when clogging of soil is considered in the simulation.

1. Introduction

The coastal waters of tropical islands such as those in Hawaii have great economic value to local economies. The quality of the coastal waters is important for recreational users. In many parts of the United States, non-point source pollution from storm runoff is found to impact the quality of surface water [1,2,3]. Urban runoff and runoff from the construction and operation of highways can be a source of pollution to coastal waters and the contaminants present in the runoff can have an adverse impact to humans and the marine environment [4,5]. Sediments, oil and grease, animal fecal matter, and metals are commonly found in highway runoff [6] and their introduction to coastal recreational waters can have negative environmental, aesthetic, and economic impacts. A number of studies have pointed out the occurrence, partitioning, and concentrations of heavy metals, polyaromatic hydrocarbons, and other contaminants in storm water [7,8,9,10,11,12,13,14,15,16,17]. As expected, the first flush is always found to carry contaminants in highest concentrations [18,19].
In Hawaii, the H3 Freeway was built in the 1990s to connect the Marine Corps Base at Kaneohe on the windward side of Oahu to the Pearl Harbor Naval Shipyard on the leeward side of the island. This 16 mile (25 km) long freeway was built through some of the most pristine rainforests on Oahu. Limited water quality monitoring data for storm runoff from the construction and operation of H3 on Oahu are available [20,21,22,23,24]. The Clean Water Branch of the Hawaii Department of Health (HDOH) is trying to develop and implement total maximum daily loads (TMDL) for various streams on Oahu, but lacks sufficient data. The current research, focused on pollution from the highways, was undertaken to obtain additional data on storm runoff water quality and potential mitigation options.
Unlike the continental United States, storm water best management practices (BMP)—such as detention ponds, grassed waterways, wetlands, etc.—are not feasible in Hawaii (particularly on Oahu) due to land limitations as these methods require large footprints. The State of Hawaii Department of Transportation (HDOT) has included infiltration trenches as a BMP option to reduce pollution caused by stormwater runoff. HDOT guidelines state that the implementation of BMPs is needed to reduce sediment and associated pollutant loads to streams and the ocean [25,26]. In the standard infiltration trench design, highway runoff first passes through swales or buffer strips where most coarse materials and some contaminants are removed. This water then enters the trench and infiltrates through the trench bottom and sides into the surrounding subsurface. While passing through the soil surrounding the trench, sediments, and other pollutants (such as heavy metals, oil and grease, bacteria, and nutrients) are removed.
Mikkelsen et al. [27] point out there is no evidence of groundwater contamination resulting from stormwater infiltration practices; however, they suggested conducting modeling studies to examine various scenarios of operation. Sansalone and Buchberger [3] also showed that infiltration methods such as trenches and porous pavements are suitable to remove heavy metals from stormwater. Maimone et al. [28] examined potential impacts of stormwater infiltration in Philadelphia through modeling and concluded that under heavy rains rising of the water table can cause significant mounding beneath the trench. They cautioned that these trenches should be sited some distance from houses with basements to reduce potential flooding. Freni et al. [29] conducted a conceptual (analytical) modeling of stormwater infiltration trenches and included clogging effects in their model. Chahar et al. [30] developed an analytical expression to simulate infiltration of stormwater through a trapezoidal gravel-filled trench. They pointed out that the surface hydrology of the catchment determines the necessary size of the trench, but the hydraulic conductivity of the ‘aquifer’ governs emptying times. They developed solutions for steady saturated seepage, which can be used to determine trench size and emptying times.
BMP manuals and handbooks differ from state to state, so individual states have different criteria for infiltration trenches. The Stormwater Permanent Best Management Practices Manual for Hawaii [31] set out the criteria for infiltration trenches which include the porosity of the trench material, site area, runoff coefficient, location, and position of water table. The performance criteria of the infiltration trenches specified in the HDOT BMPs stipulate that they should be fully drained within 48 h.
The main goal of this study was to evaluate planned infiltration trench to reduce pollution from the roadside soils on the island of Oahu, Hawaii. This was achieved by (i) monitoring the characteristics of highway runoff over a period of time to detect the presence of key contaminants, (ii) evaluating the presence of heavy metals in soils along highways, (iii) conducting tests to assess hydraulic properties of soils in situ, (iv) evaluating hydraulic conductivity reduction of the trench soils over extended periods of runoff water infiltration through laboratory studies, and (v) estimating water infiltration through trenches installed adjacent to highways. The results of this study will be useful for Hawaii DOT in the siting of infiltration trenches.

2. Materials and Methods

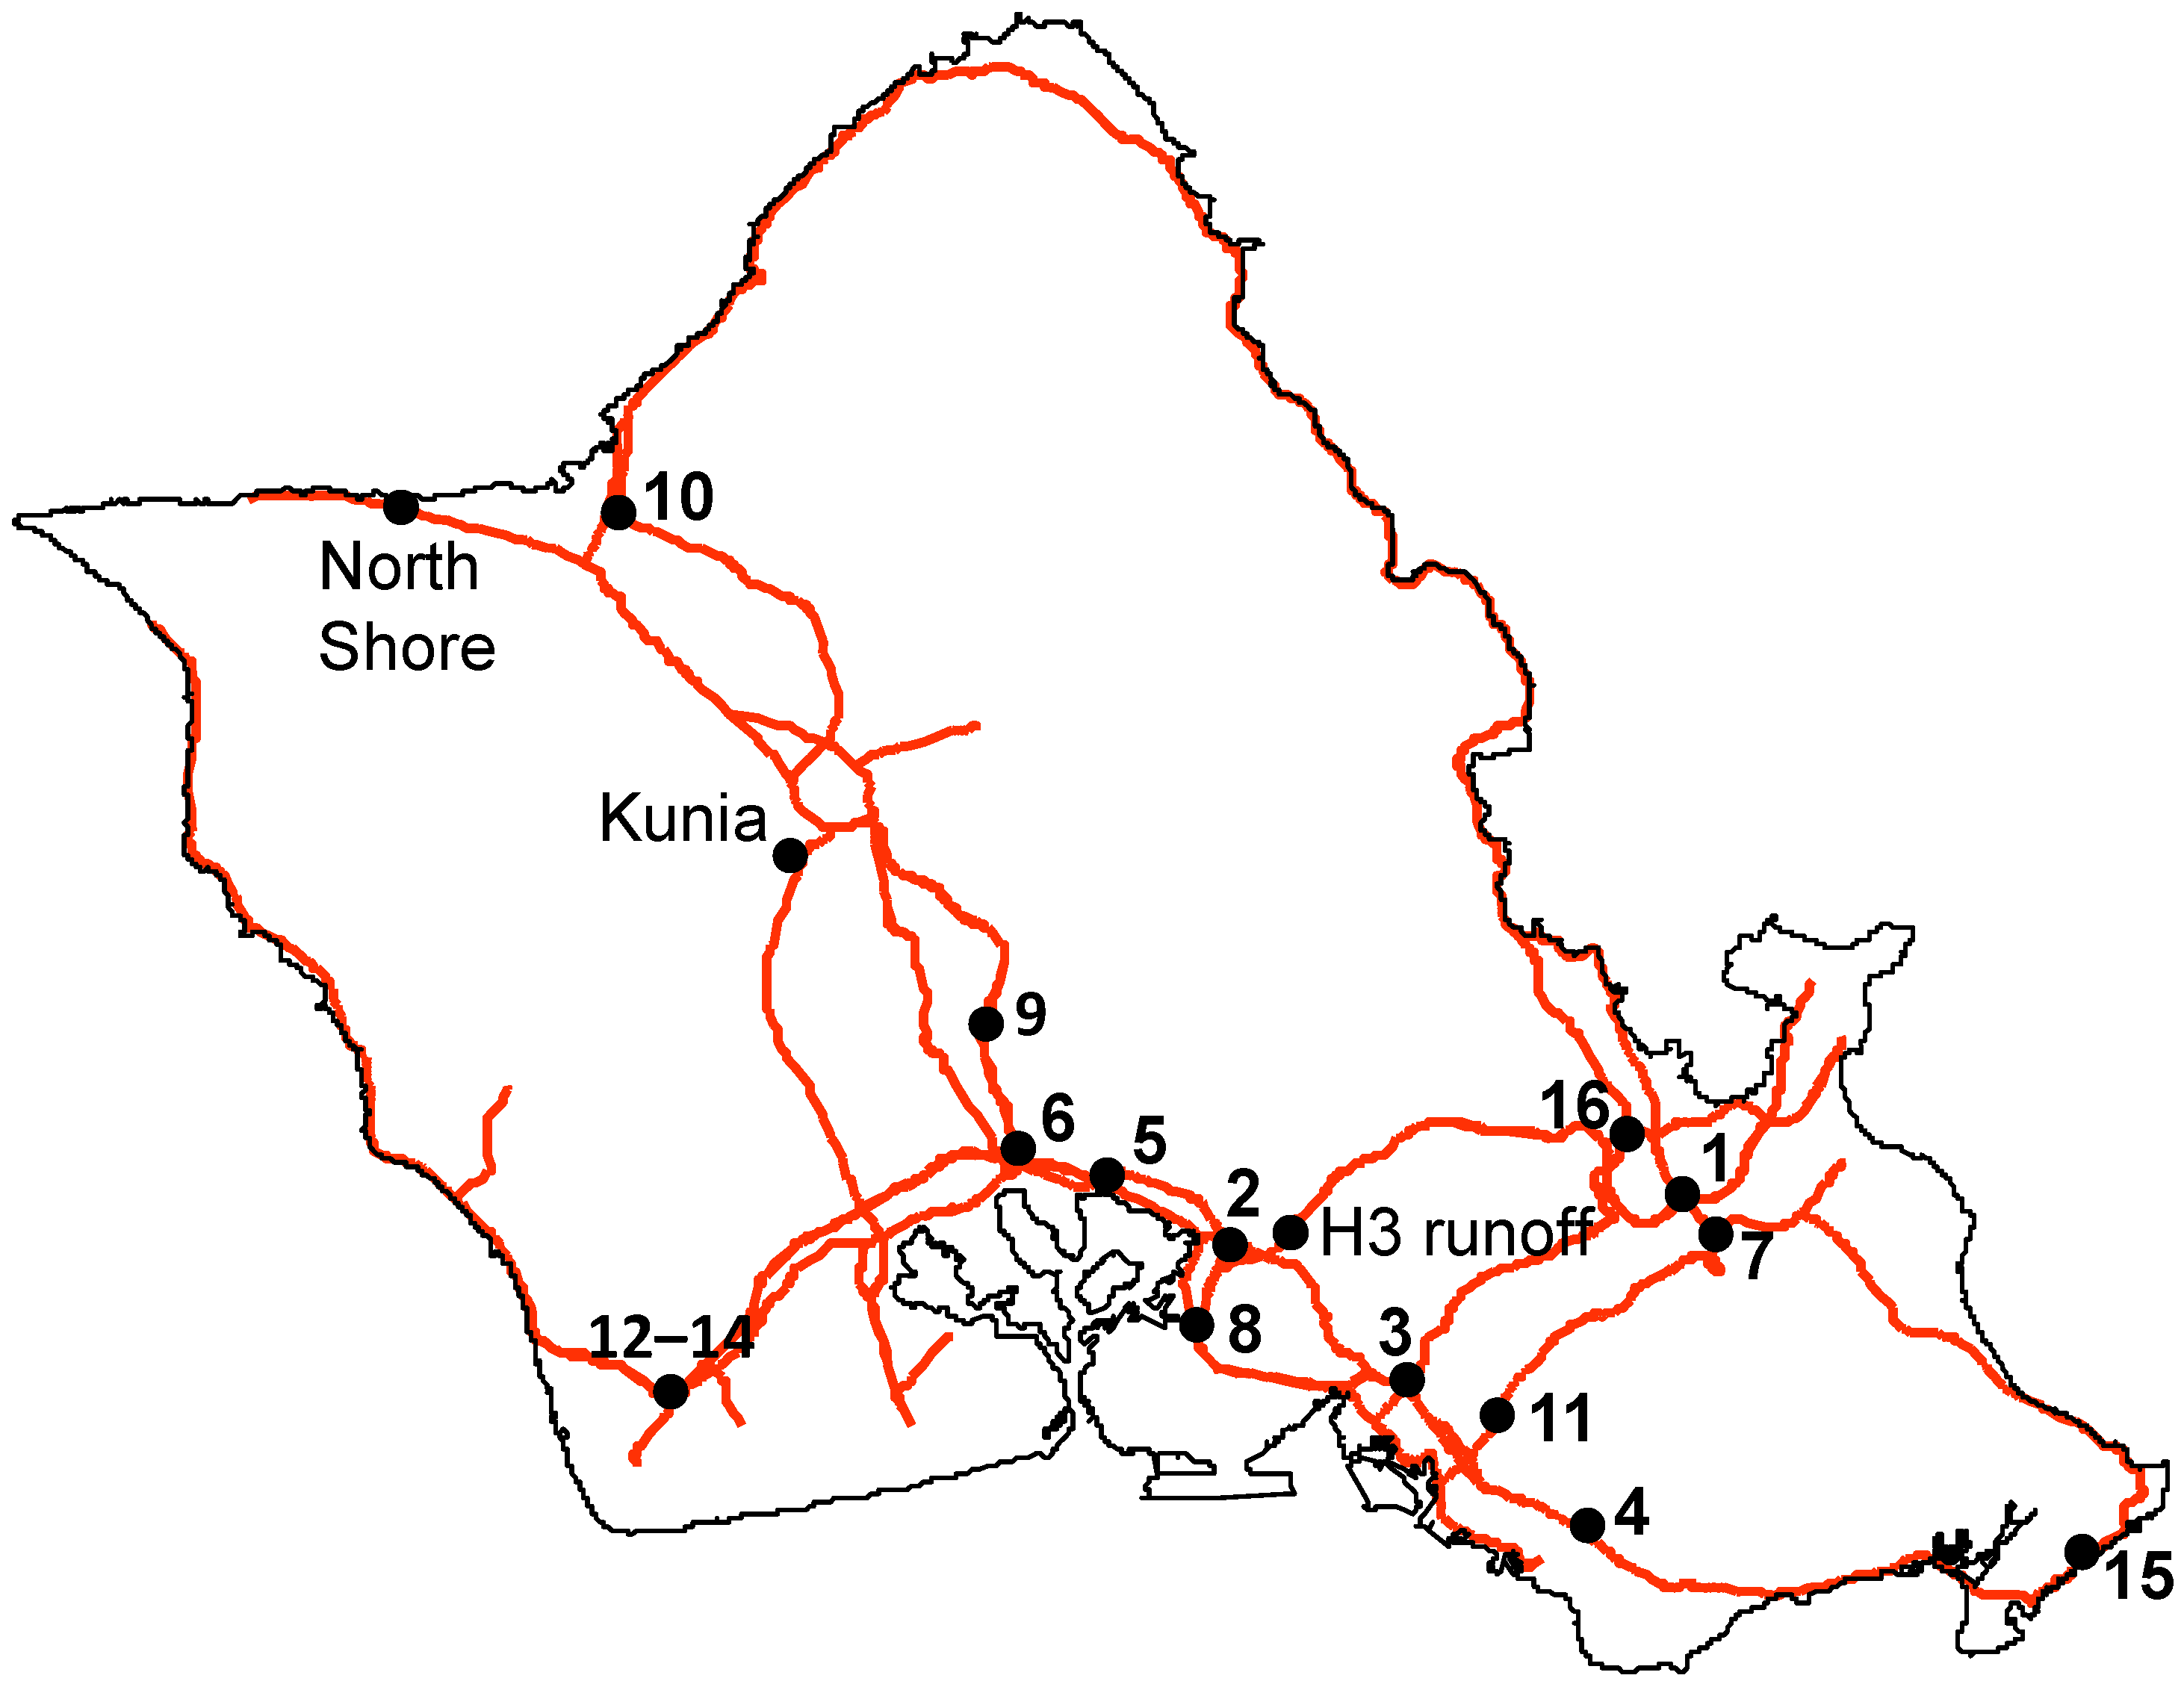
2.1. Site Location and Soil Characterization

There are three major freeways on Oahu (H1, H2, and H3) with a total length of 54.9 route miles (88.4 km). Additionally, the state highway system on Oahu has 280.4 route miles (451.2 km). Based on land area availability determined from satellite image data a total of 64 sites were initially considered suitable for placing infiltration trenches. However, a detailed drive-through survey as well as an assessment of soil survey data [32] determined that a majority of those sites would not be suitable for siting trenches due to lack of sufficient right of way, stone or fill soil, being in constructed coastal areas filled with gravel, coral stones, debris, etc. Sixteen sites were eventually selected for final evaluation. Figure 1 is a highway map of Oahu showing these locations. Two soil factors: (a) infiltration capacity and (b) adsorption capacity are considered to be key to the success of infiltration trenches.
At each site, the soil profile was excavated to examine soil texture for comparison against the mapped soil information [32]. Undisturbed soil cores were taken to the laboratory for the development of soil water retention curves. Disturbed soil samples were collected from the sites using a hand auger for conducting infiltration-outflow experiments on repacked columns and batch tests to evaluate sorption characteristics. Subsoil samples (30–50 cm depth) were taken at each site.

2.2. Soil Physical Properties

2.2.1. In Situ Measurement of Infiltration and Soil Sampling

Direct evaluation of soil hydraulic conductivity was determined in situ using a disk tension infiltrometer [33]. Pressure heads ranging from h = −10 cm to −1 cm were maintained successively on the top of the soil surface and the corresponding infiltration rates were measured. Tension infiltration experiments are usually conducted to measure near-saturated and saturated hydraulic conductivity [34,35]. The values of unsaturated hydraulic conductivity were estimated from the infiltrometer data using standard procedures [36]. The value of saturated hydraulic conductivity (Ks) was evaluated using data of both soil water retention and unsaturated hydraulic conductivities by the parameter optimization program RETC [37].
After removing the vegetation cover, saturated hydraulic conductivity was determined at several depths (down to 0.9 m). In addition, disturbed and undisturbed soil samples were taken from the excavated holes for laboratory experiments using either an auger or a core sampler. The actual depth of infiltration measurements at each site varied depending on the hardness of the soil, the ease of (manual) excavation, and the presence of clean soil (i.e., no gravel or boulders that might alter infiltration rates). Bulk density was measured by determining the water content, volume, and dry weights of undisturbed cores (two samples from each location, 60 mm long and 57 mm in diameter).

2.2.2. Soil Water Retention Measurements

Sets of undisturbed soil core samples (each 100 cm3, one or two per depth) were collected for the purpose of measuring soil water retention characteristics. Standard methods for measuring retention curves were followed [38]. First, the soil samples were fully saturated and then the samples were drained with applied pressures from −60 to −600 cm. Standard pressure chambers (Soil Moisture Equipment Corp., Santa Barbara, CA, USA) were used. Soil hydraulic parameters were derived from the retention data using the parameter optimization program RETC [37]. The relationship between soil water pressure head and soil water content was described using the Van Genuchten model [39].

2.3. Runoff Collection and Analyses

Stormwater highway runoff was collected at one location on the H3 freeway (at the field office of DOT contractor Parsons Brinkerhoff in Halawa Valley, 99-1070 Halawa Valley St. Aiea, HI 96701, USA) for both Kaneohe and Honolulu bound traffic. The water quality data was measured for both traffic directions and the average value was determined. The estimated annual average daily traffic at Halawa for 2010 was about 47,000 vehicles/day. The collection site, located below an elevated freeway bridge, made it possible to sample stormwater runoff originating from the freeway and not mixed with local soils. Any soil found in the collected sediments must have originated from muddy sediments or dust deposited on the concrete highway surface. In total, fourteen samples were collected during seven storm events between April 2008 and May 2009. The runoff was used in column experiments and batch sorption tests to determine the adsorption capacities of soils for highway contaminants. The runoff was analyzed for pH, dissolved organic carbon (DOC), zeta potential [40] (ASTM Standard, 1985), heavy metals (Cd, Co, Cr, Cu, Ni, Pb, As, Zn, and Se), total dissolved solids (TDS), total suspended solids (TSS), ions, cations, particle size distribution of sediment [41], oil and grease, and total petroleum hydrocarbons (TPH) [42]. Colloidal particles can facilitate the transport of metals when the metals bind to them. We analyzed particle size distribution (PSD) of pollutants in runoff in the size ranging from 1 to 1000 nm. Particles were divided into colloidal (1–1000 nm) and non-colloidal form (1–1000 µm).
Concentrations of heavy metals observed in stormwater highway runoff were compared with the environmental action levels (EALs) of the Hawaii Department of Health [43]. The EALs are defined as concentrations of contaminants in soil, soil vapor, and groundwater above which the contaminants could pose a potential threat to human health and the environment.

2.4. Heavy Metals in Soils

Excavated soil samples were used to determine concentrations of heavy metals in soils along highways on Oahu. These samples were retrieved from the same depths as the samples for which water retention curves were developed (from 15 to 65 cm below the surface). The sediment sample (depth of 0–5 cm) around the H3 drain outlet, at the location where the stormwater highway runoff was sampled, were also taken for analysis. Samples were analyzed using an inductively coupled plasma mass spectrophotometer. Concentrations of heavy metals observed in these soils were compared with EALs [43].

2.5. Batch Sorption Tests for Heavy Metals

The soils’ capacity to retain heavy metals was tested using the batch equilibration method [44]. Batch sorption tests were carried out for Cd, Co, Cr (total), Ni, and Pb, which were the heavy metals commonly found in highway runoff water collected. Three solutions containing one filtered stormwater runoff, one concentrated standard, and one blank were prepared for the test for each metal. No sorption tests were conducted for the five metals individually, thus competitive sorption effects cannot be discounted. The tests were carried out by placing 0.5 g of sieved soil into a plastic bottle containing 100 mL of each heavy metal solution and shaken for 24 h. After shaking and allowing the mixtures to settle, approximately 30 mL of the solutions were placed in centrifuge bottles and centrifuged at 7500 rpm for 20 min to produce a clear supernatant. About 10 mL of each solution were extracted and acidified with nitric acid to a pH less than 2. The solutions were then analyzed for the heavy metals using inductively coupled plasma-mass spectrometry. The detection limits ranged from 0.01 to 1 ng/mL. The equilibrated concentrations and amount adsorbed per mass of soil were plotted and fitted to the linear sorption isotherm model. The sorption distribution coefficient Kd (L/kg) was determined from the slope of the fitted line. These batch sorption experiments determined the heavy metals retention capacity for the soils under examination.

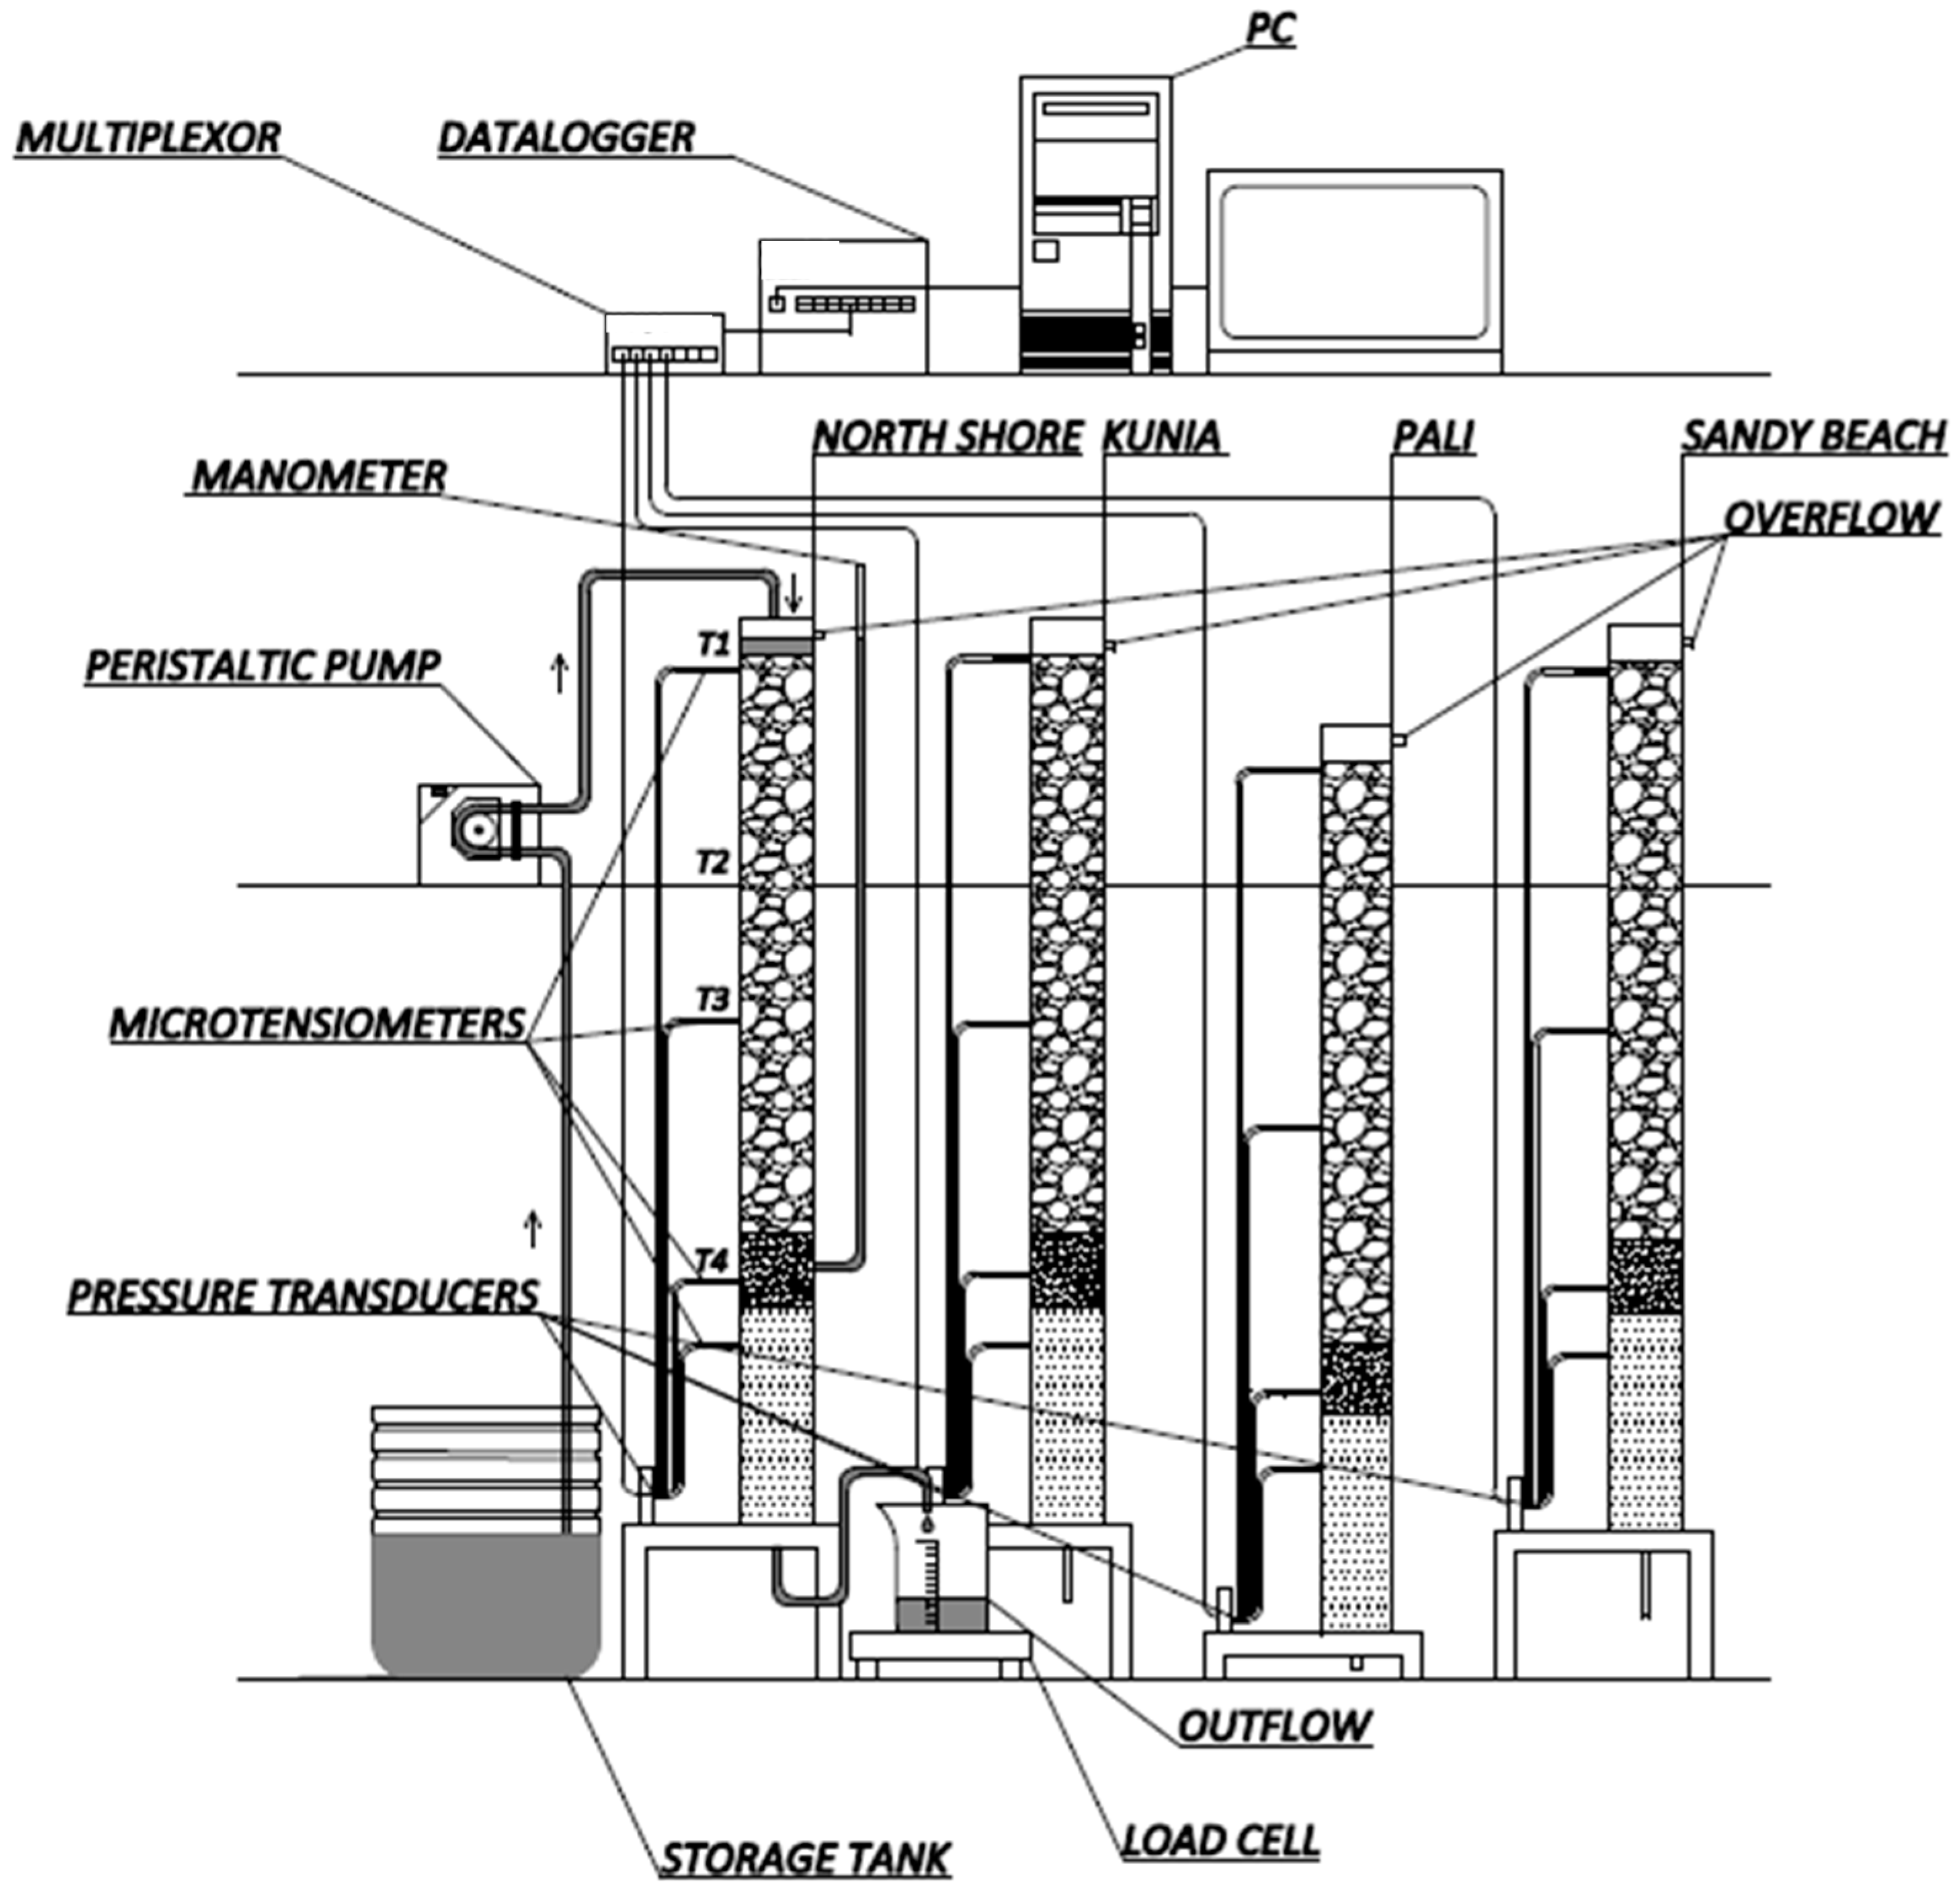
2.6. Laboratory Infiltration-Outflow Experiments

Two different types of infiltration-outflow experiments were conducted in the laboratory. First, long-term experiments were designed to study the effect of clogging under continuously saturated conditions in an infiltration trench. Secondly, intermittent infiltration-outflow experiments were used to simulate intermittent rainfall events with continuous saturation of the soil, imitating cyclic operation of the infiltration trench. This situation could be expected to arise in areas of Oahu where the soil does not drain rapidly and there are frequent rainfall events. Both types of experiments were performed on undisturbed soil columns (25 cm high, inner diameter 10 cm).
The instrumentation included microtensiometers consisting of stainless steel cups (316L stainless steel, series 6500, Mott Corporation, Farmington, CT, USA) inserted into the gravel, sand, and soil at various levels to monitor soil water pressure heads in the composite columns. All of the tensiometers were connected to pressure transducers (236PC 15GW, Honeywell Microswitch, Columbus, OH, USA) and connected via multiplexor (AM 416 Relay Multiplexor, Campbell Scientific, Logan, UT, USA) to a data logger (CR10X, Campbell Scientific, Logan, UT, USA). The outflow was measured using buckets placed on load cells (GP 20K, A&D Weighing, Ann Arbor, MI, USA). The effluent was collected to monitor chemical parameters. The columns included overflow drains at the top to allow excess water to flow out thus maintaining a constant head at the top.

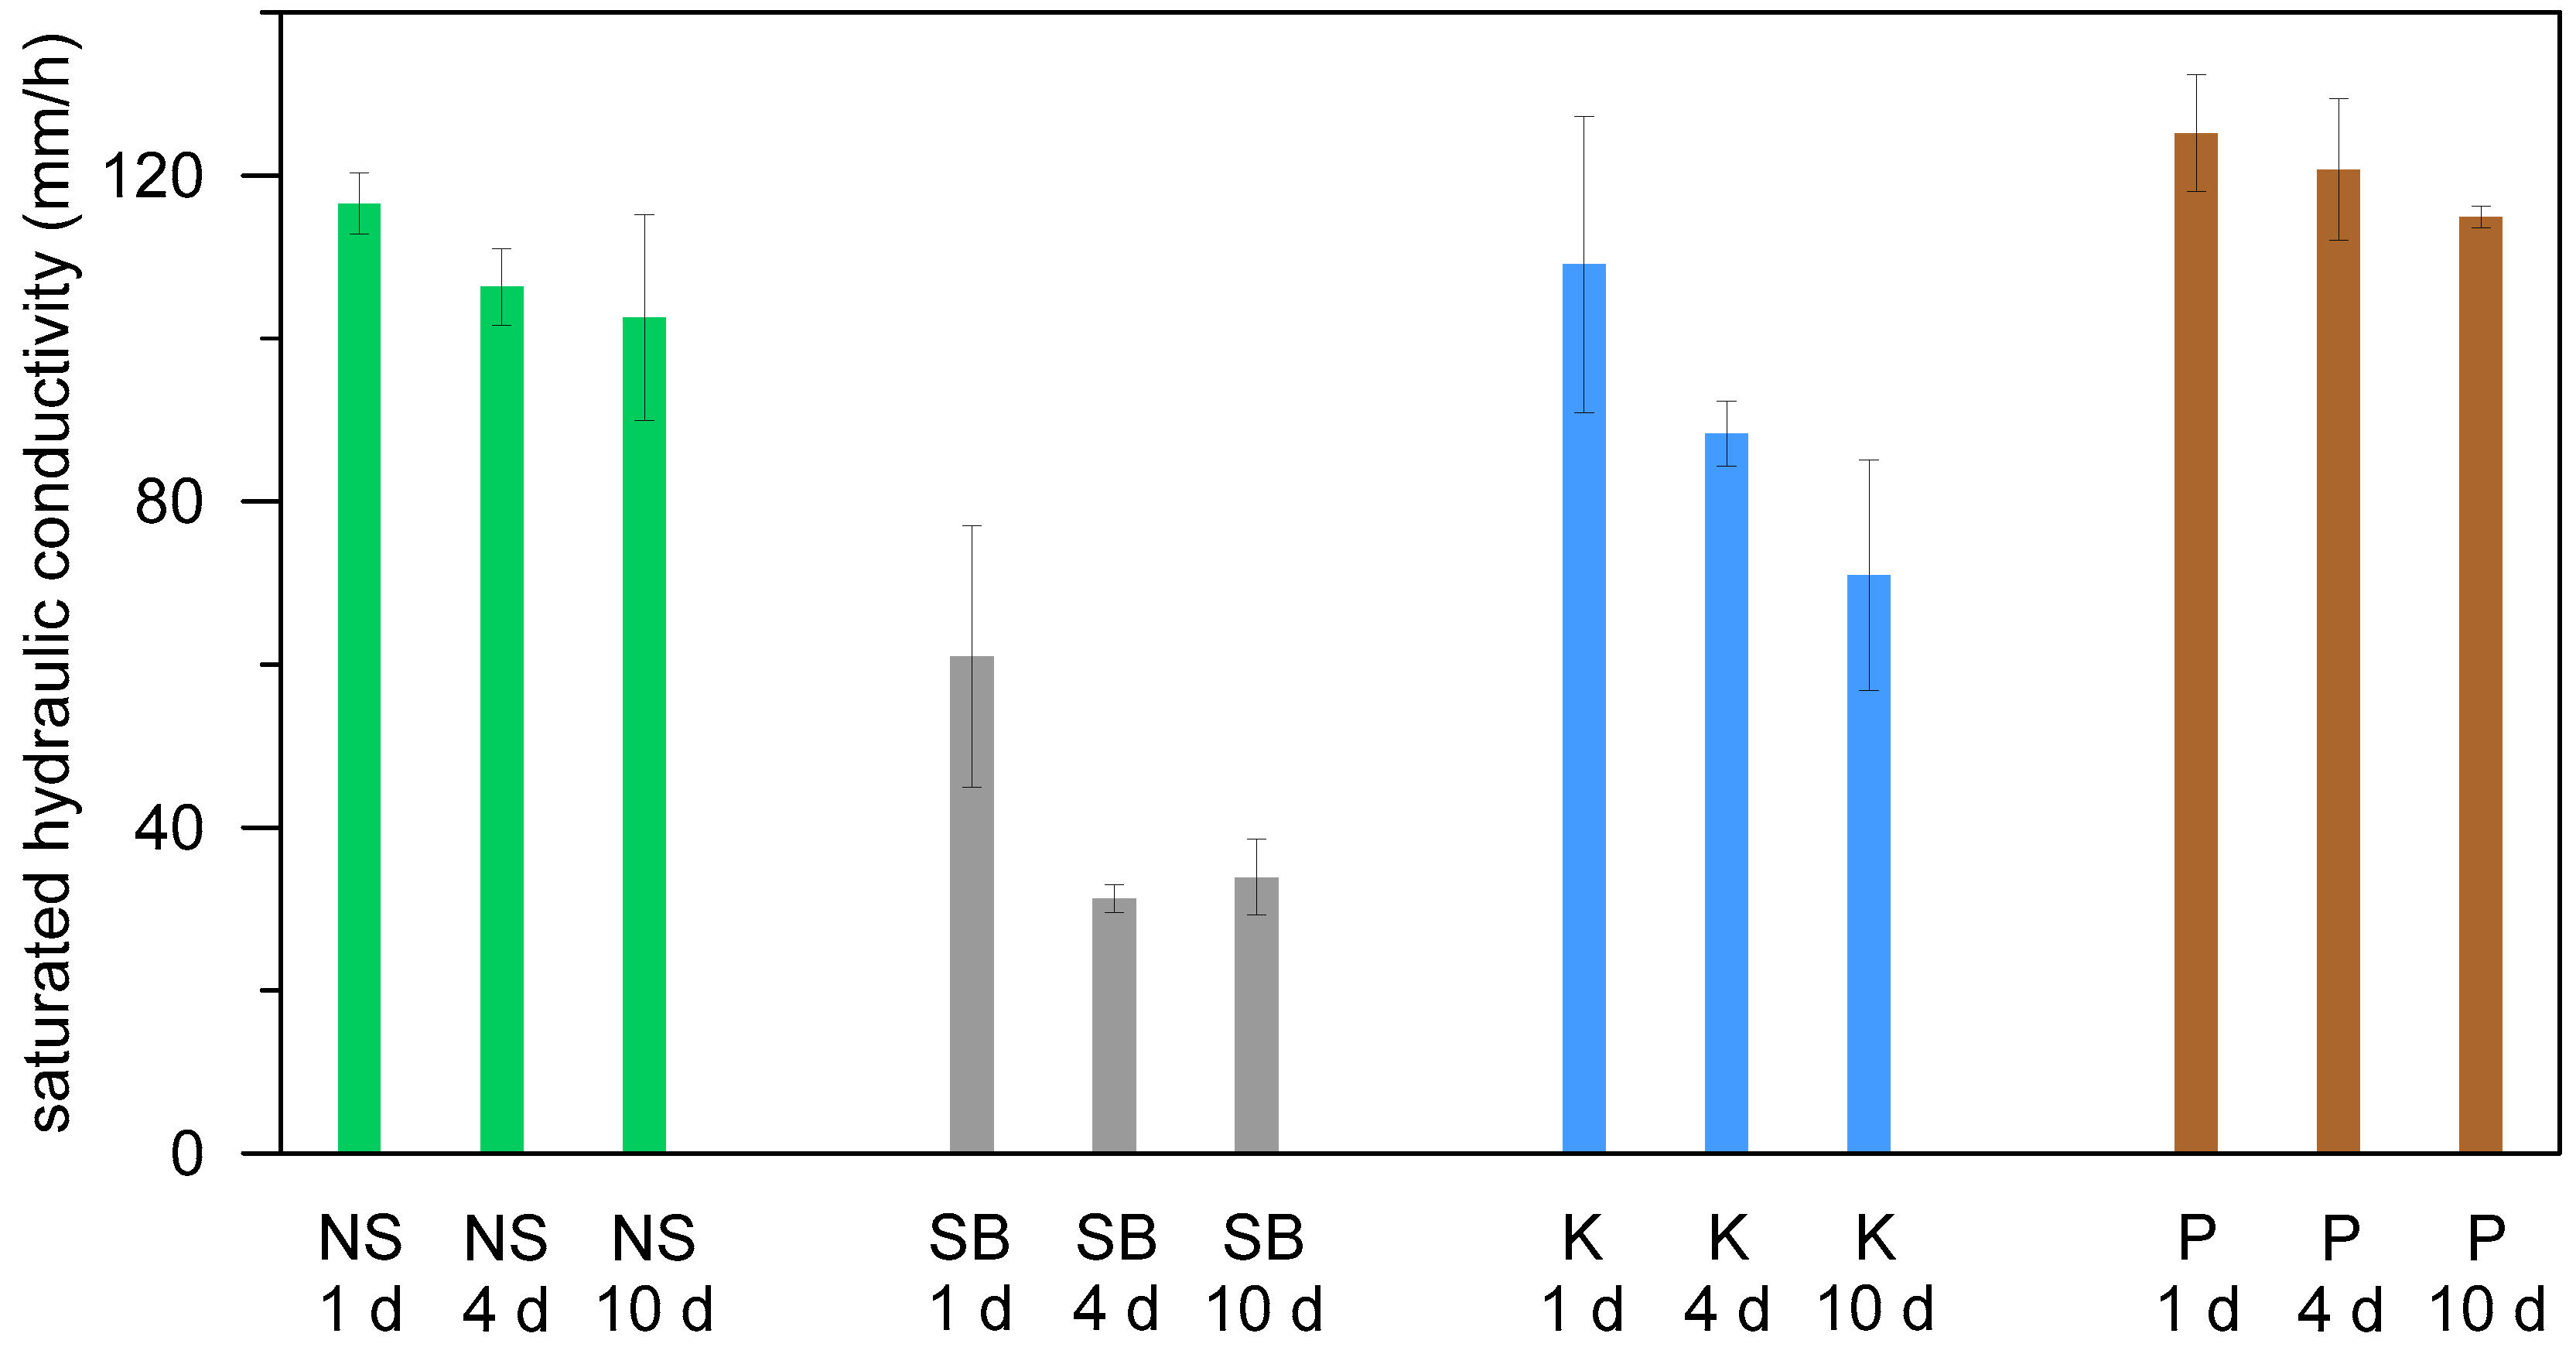
2.6.1. Long-Term Clogging Experiments

The infiltration-outflow column experiment (Run 1) and repeated infiltration-outflow experiment (Run 2) were conducted on one undisturbed soil sample from the Sandy Beach location (site no. 15, Figure 1) over several months to examine the effect of long-term stormwater loading on infiltration through the trenches. The second run (Run 2) was done after removing sediment-caked gravel from the gravel layer to simulate typical maintenance for trenches. Because of the time constraints for running this experiment, only one soil was selected for this long-term study. The Sandy Beach location was selected because the sampling location has low saturated hydraulic conductivity and low effective porosity (see Table 1).
The experimental setup consisted of an undisturbed soil column (25 cm high) covered by a 0.97-m gravel layer to simulate conditions comparable to those in infiltration trenches. Microtensiometers were installed to allow monitoring of hydraulic head loss due to clogging. A constant water level was maintained by means of an overflow drain located near the top of the column. Input water consisting of highway runoff was continuously stirred in order to maintain homogenous concentrations of particulates and other contaminants. Duration of the first run was 25 days.
At the conclusion of Run 1, the inflow of water was temporarily stopped, a 27 cm layer of gravel was removed from the top in three discrete (each nine cm) layers and the sediment that had collected on each layer was removed and analyzed. Then, the old gravel was replaced with new gravel. Run 2 was a repeat experiment on the same soil column as used for Run 1 for another 48 days. The flow rate was calculated by weighing the outflow. Each experiment was terminated when the rate of change outflow asymptotically approached zero. A complete characterization of influent and effluent quality parameters, including pH, turbidity, PSD, TDS, DOC, TOC, anions, and cations was performed. However, TSS was deemed to be the main parameter affecting clogging since the TSS capture mechanisms in infiltration trenches is important for making design and maintenance recommendations. TSS is usually the target pollutant for stormwater BMPs [45,46].

2.6.2. Intermittent Experiment

The intermittent infiltration-outflow experiments were conducted to simulate gravel-filled infiltration trenches subject to intermittent rains as observed on some locations on the islands of Hawaii. Due to time constraints, not all of the 16 soil samples (fourteen locations for retention curves and the Kunia and North Shore sites for laboratory column studies) on Oahu were subjected to the intermittent experiment. Only soils from four locations (Kunia, Sandy Beach (site no. 15), North Shore (site no. 10), and Pali (site no. 11), see Figure 1) were selected to represent different soil conditions in the central, east, and north areas of Oahu.
The intermittent infiltration-outflow experiments were done in long PVC columns (125 cm high, 10 cm in diameter) which contained undisturbed soil cores of 25 cm at the bottom. Above the soil, thirteen cm of coarse sand (~0.7 mm mean diameter) was placed to reduce cake formation on the soil surface and to allow the water to flow uniformly to the soil surface. It was observed in the earlier long-term experiment, that there was migration of fines to the soil surface and therefore it was thought that placing a small sand layer would reduce the entry of fine particles to the soil surface thereby preventing premature clogging of the columns. Above the coarse sand, a layer of 80 cm of pea gravel (2–4 cm diameter) (see Figure 2) was placed. There was a bypass drain five cm above the gravel layer to maintain a constant head.
The columns were periodically wetted and drained using the collected stormwater to imitate intermittent rainfall events. The columns were initially filled with highway stormwater runoff and the drainage was initiated by opening effluent valves at the bottoms of the columns. Loss of hydraulic head as a function of time was monitored as the water drained out of the four columns. A peristaltic pump introduced runoff water at the top of the columns. This process was repeated three times: on day 1, day 4, and day 10 for a full 24 h giving two and five day resting periods. Initially the flow rate to the column was 50 mL/min. The saturated hydraulic conductivity of the columns was calculated using Darcy’s law. The reason for designing this experiment with three different flow rates (50, 100, and 125 mL/min) was to examine the effect of more rapid filling of the trenches on clogging.

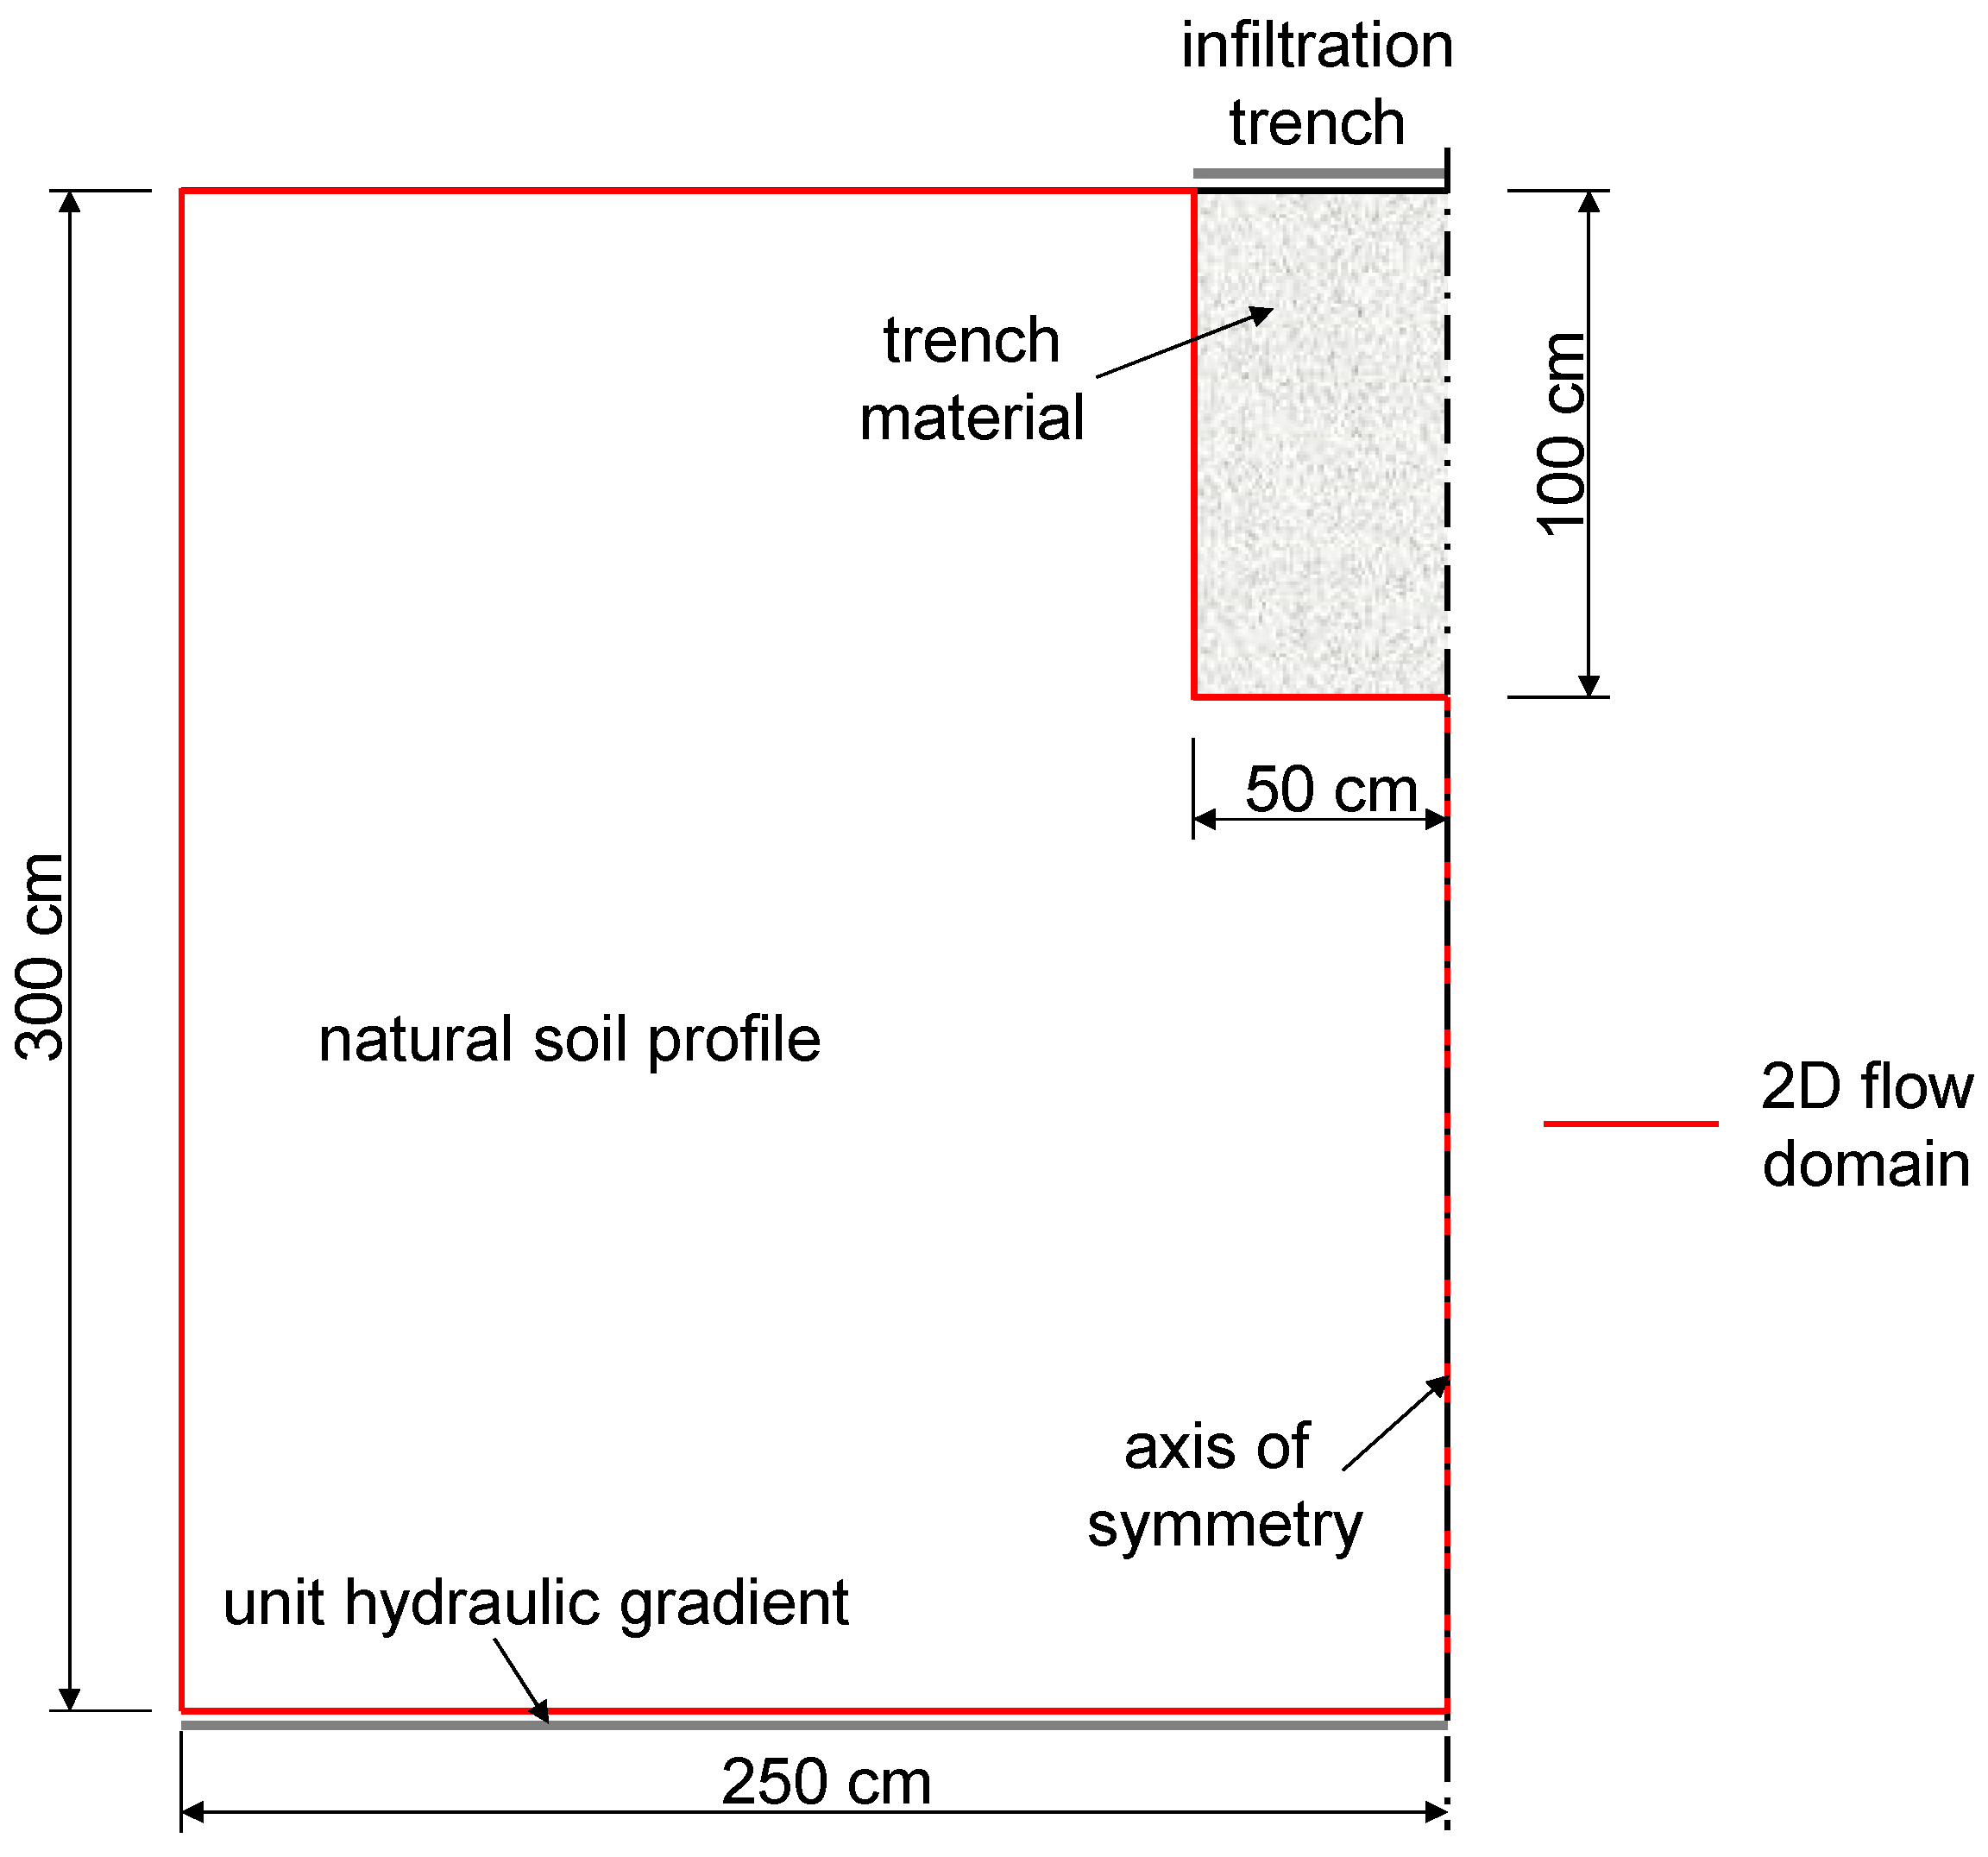
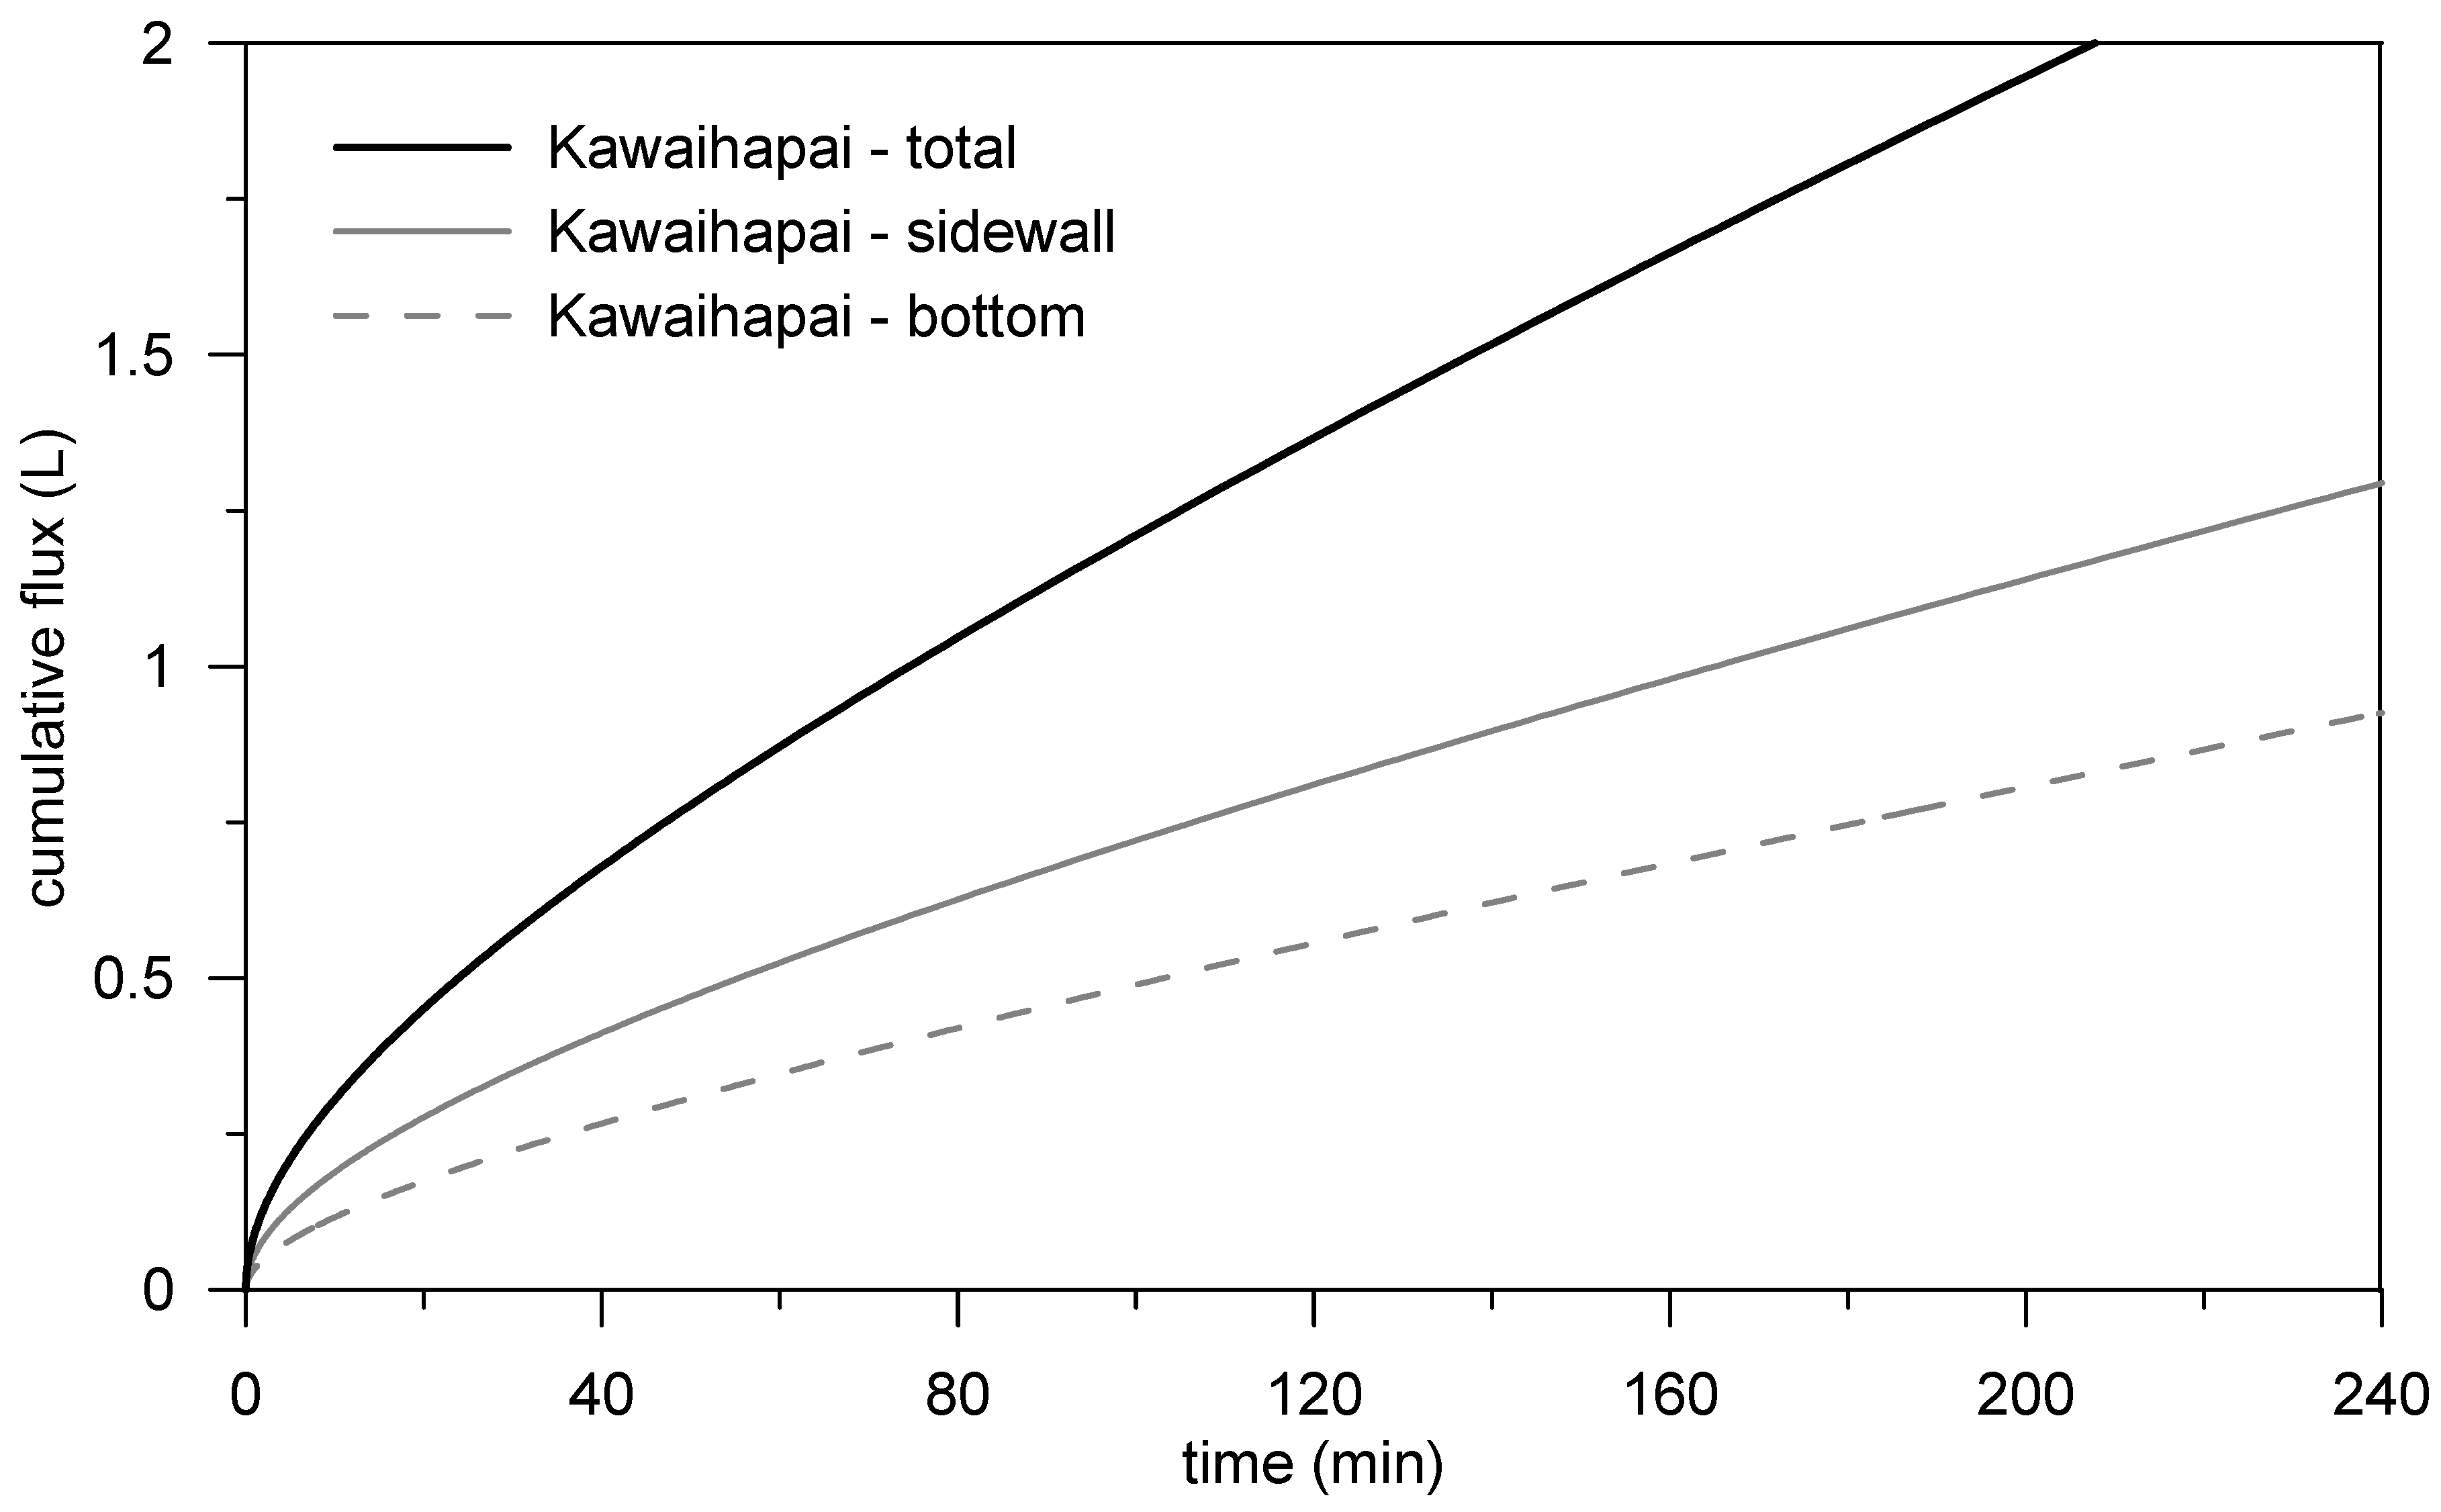
2.7. Modeling of Water Movement from a Potential Trench Site along Oahu’s Highways

To evaluate infiltration capacity of trench sites, the two-dimensional model HYDRUS [47] was used. HYDRUS model was previously applied for evaluation of the water flow regime in wastewater trench systems [48,49]. This process-oriented model is based on a numerical solution of Richards’ equation for soil water flow. In this study, we assumed a hypothetical gravel-filled linear trench 100 cm deep and 100 cm wide. Only half of the trench was considered in the numerical modeling since the center line of the trench is an axis of symmetry shortening the time needed to run the simulation. The domain was divided into 23,501 triangular finite elements. All two-dimensional simulations were based on unit length of the trench. The depth and width of the 2D simulated flow domain (the soil surrounding the trench) were 300 and 250 cm, respectively (Figure 3), representing a one cm thick vertical slice through the system. The dimensions of the flow domain were chosen to be large enough to meet the requirement that the lower and outer vertical boundaries do not affect the infiltration rate in the vicinity of the trench. Since the trenches are linear structures, a two-dimensional model can approximate the flow phenomenon adequately (a three-dimensional model is not required). In reality, the infiltration trench length can vary depending on site-specific conditions.
We assumed homogeneous soil profiles surrounding the trench, derived from the field subsoil hydraulic characteristics (Table 1). Soil hydraulic functions (retention curve and hydraulic conductivity) were described using a modified Van Genuchten model [50,51]. In agreement with the elevations of the sampling locations (Figure 1), the water table was located far below the trench, not affecting the infiltration rates. Hence, the initial pressure in soil was set to −150 cm in the whole computational domain, representing medium saturation conditions. An important assumption for the simulations is the water level in the infiltration trench. In reality, the level of water in the trench is not fixed but fluctuates in response to runoff events. For the sake of simplicity, we assumed the trench to be running full of water, i.e., 100 cm deep. For the infiltration trench (side and bottom), the hydrostatic pressure boundary condition changing from 0 cm at the top to 100 cm on the bottom of the trench was used. Free drainage condition was used for the lower boundary of the simulated domain (Figure 3). Top surface and vertical boundaries (excluding the side of the trench) were treated as no-flow boundaries. It is important to note that the setting of the boundary conditions for the trench is a simplification of a real system. However, this numerical analysis was performed to illustrate the dynamics of drainage process of the infiltration trenches including the soil around and beneath the trench.
The fill material of infiltration trenches, usually consisting of coarse gravel, becomes rapidly filled during storm events since it has high saturated hydraulic conductivity. Water storage capacity of a fully saturated infiltration trench of this size, assuming 40% total porosity, is equal to 2 L of water (considering the symmetry of the domain and a unit length of 1 cm of the trench).
According to HDOT guidelines [25], trenches are required to fully de-water their entire water volume within 48 h after a storm event. Emptying time is primarily influenced by the properties of the surrounding soil, not by the gravel material of the trench itself. Thus, the time required to drain the trench of 2 L water was determined for the selected soils from Oahu using a 2D model.
The main function of the trenches is to retain stormwater in land areas and reduce their outflow to the ocean. However, the gradual physical clogging caused by sediment accumulation inside the trenches severely impairs their hydrodynamic functioning [29,52,53]. Clogging of the infiltration trench was taken into account in our modeling analysis by reducing the Ks value on the bottom and vertical sidewalls of the trench. This analysis was performed for the sandy beach soil, used in the long-term column experiments which evaluated clogging. A reduced value of Ks, estimated from the long-term column experiment, was specified in the model for a 5 mm thick layer of the natural soil in the vicinity of the infiltration trench.

3. Results and Discussion

3.1. Soil Water Retention Characteristics

A list of locations investigated, together with the estimated soil hydraulic parameters, are shown in Table 1. The values of saturated hydraulic conductivities ranged between 15 and 889 mm/h for 16 soils at selected sites on Oahu. Saturated water content (ranging from 43 to 65%) and bulk density (1.06–1.52 g/cm3) were determined from small undisturbed soil samples. Low values of Van Genuchten n parameter result in relatively high water holding capacity estimates even for smaller values of pressure heads (h ~ −500 cm). Nevertheless, the soils are also characterized by significant reduction of hydraulic conductivity with decreasing pressure heads. The values of bulk density and saturated hydraulic conductivity reported in Table 1 matched fairly well the soil data presented in earlier studies [54,55].

3.2. Runoff Quality Variations

In Table 2, heavy metal concentrations observed in runoff collected from H3 are reported. The observed concentration values are compared with data from California [56] and EALs. EALs values were compiled for screening of contaminated groundwater that could discharge to surface water [43]. The median concentrations of heavy metals we found in H3 runoff are greater than values reported from California for the period from 2000 to 2003. This may be explained by the duration of sampling period and high intensity storms in Hawaii, which effectively flush and carry dissolved pollutants from highways. The values of standard deviations also document a substantial variability of concentrations in time, often associated with flushing. As expected, the observed concentrations in highway runoff exceeded the values of groundwater EAL.

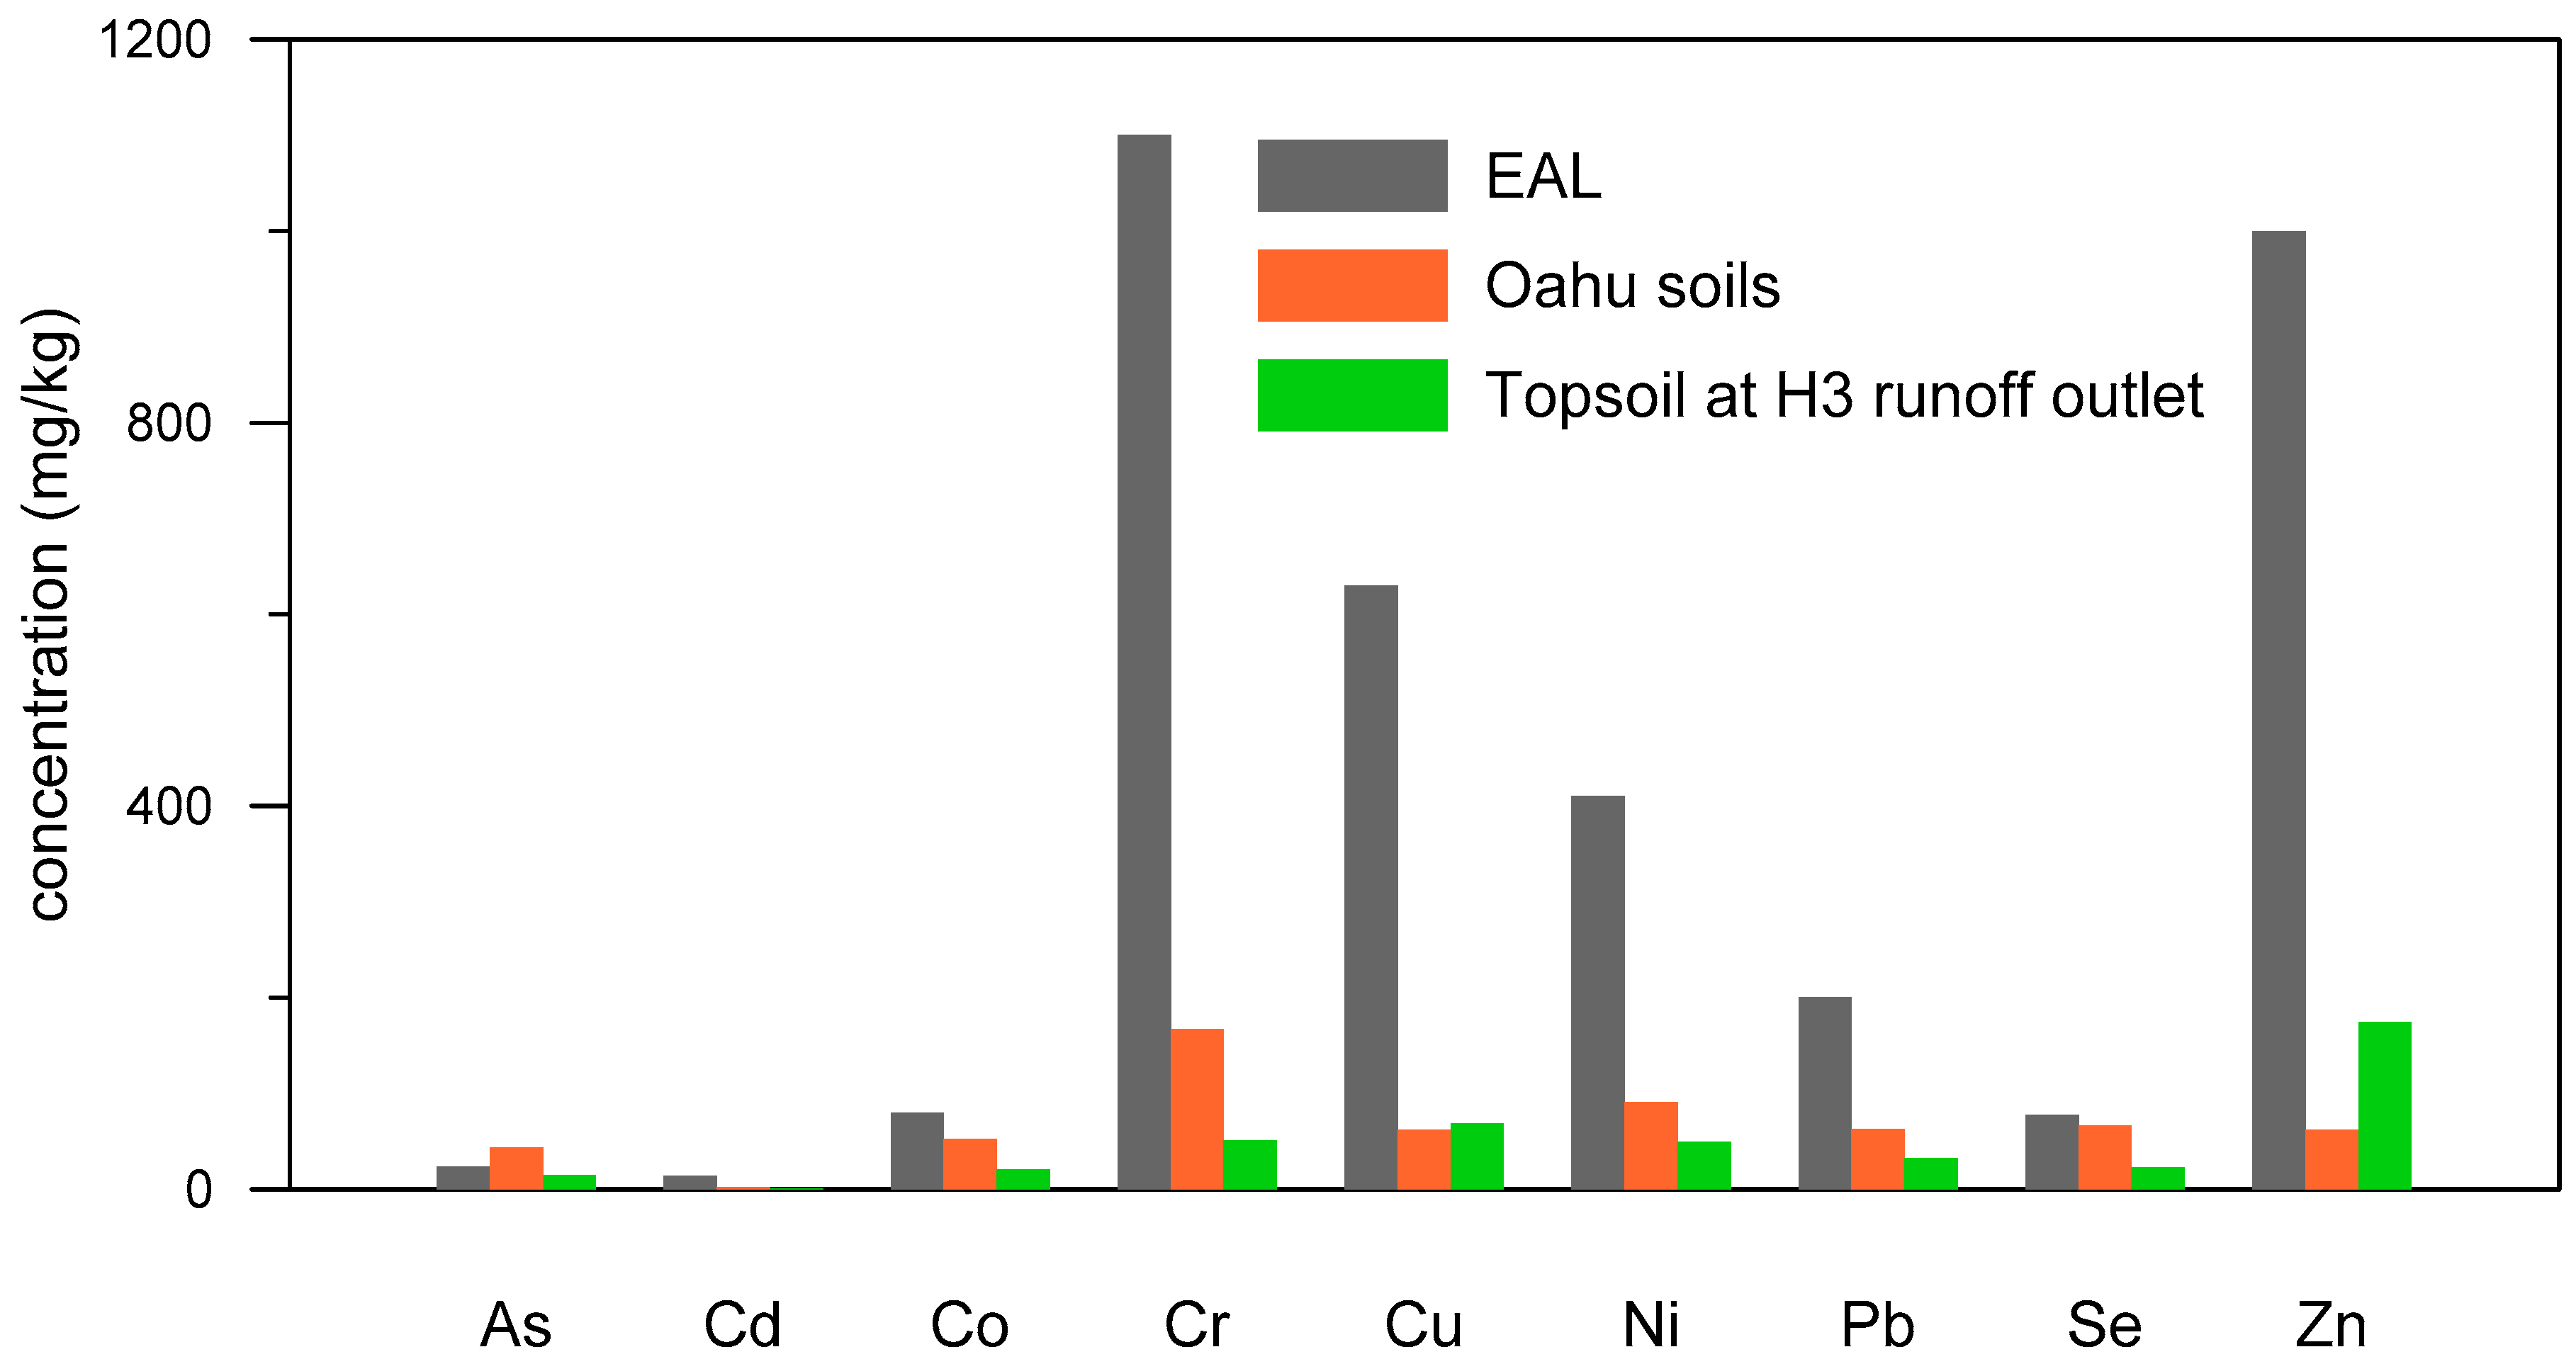
3.3. Concentration of Heavy Metals in Soils

The results of our analysis of soil from sixteen selected sites show that all the soils contained As, Cd, Cr, Co, Cu, Ni, Pb, Se, and Zn at detectable concentrations (Figure 4). The elevated concentrations most likely resulted from accumulated road pollution. The concentration of Pb in the soil from the Pali—Kamehameha Hwy. (site no. 7) and the concentration of Cr and Ni in soil from the Kamehameha—Waialua IC (site no. 10) exceeded the Hawaii soil EALs. The median concentration of As in soils sampled along Oahu highways exceeded the soil EAL [43]. In Hawaii, low levels of arsenic are found naturally in native soils. The use of arsenic-based herbicides/pesticides on sugarcane fields took place in the past. It remains unclear if this historic use led to elevated soil concentrations of As along the highways. The topsoil sample from the H3 runoff outlet had a high concentration of Zn. Brakes, tires, and frames of vehicles are the main sources of Zn in urban runoff [57].

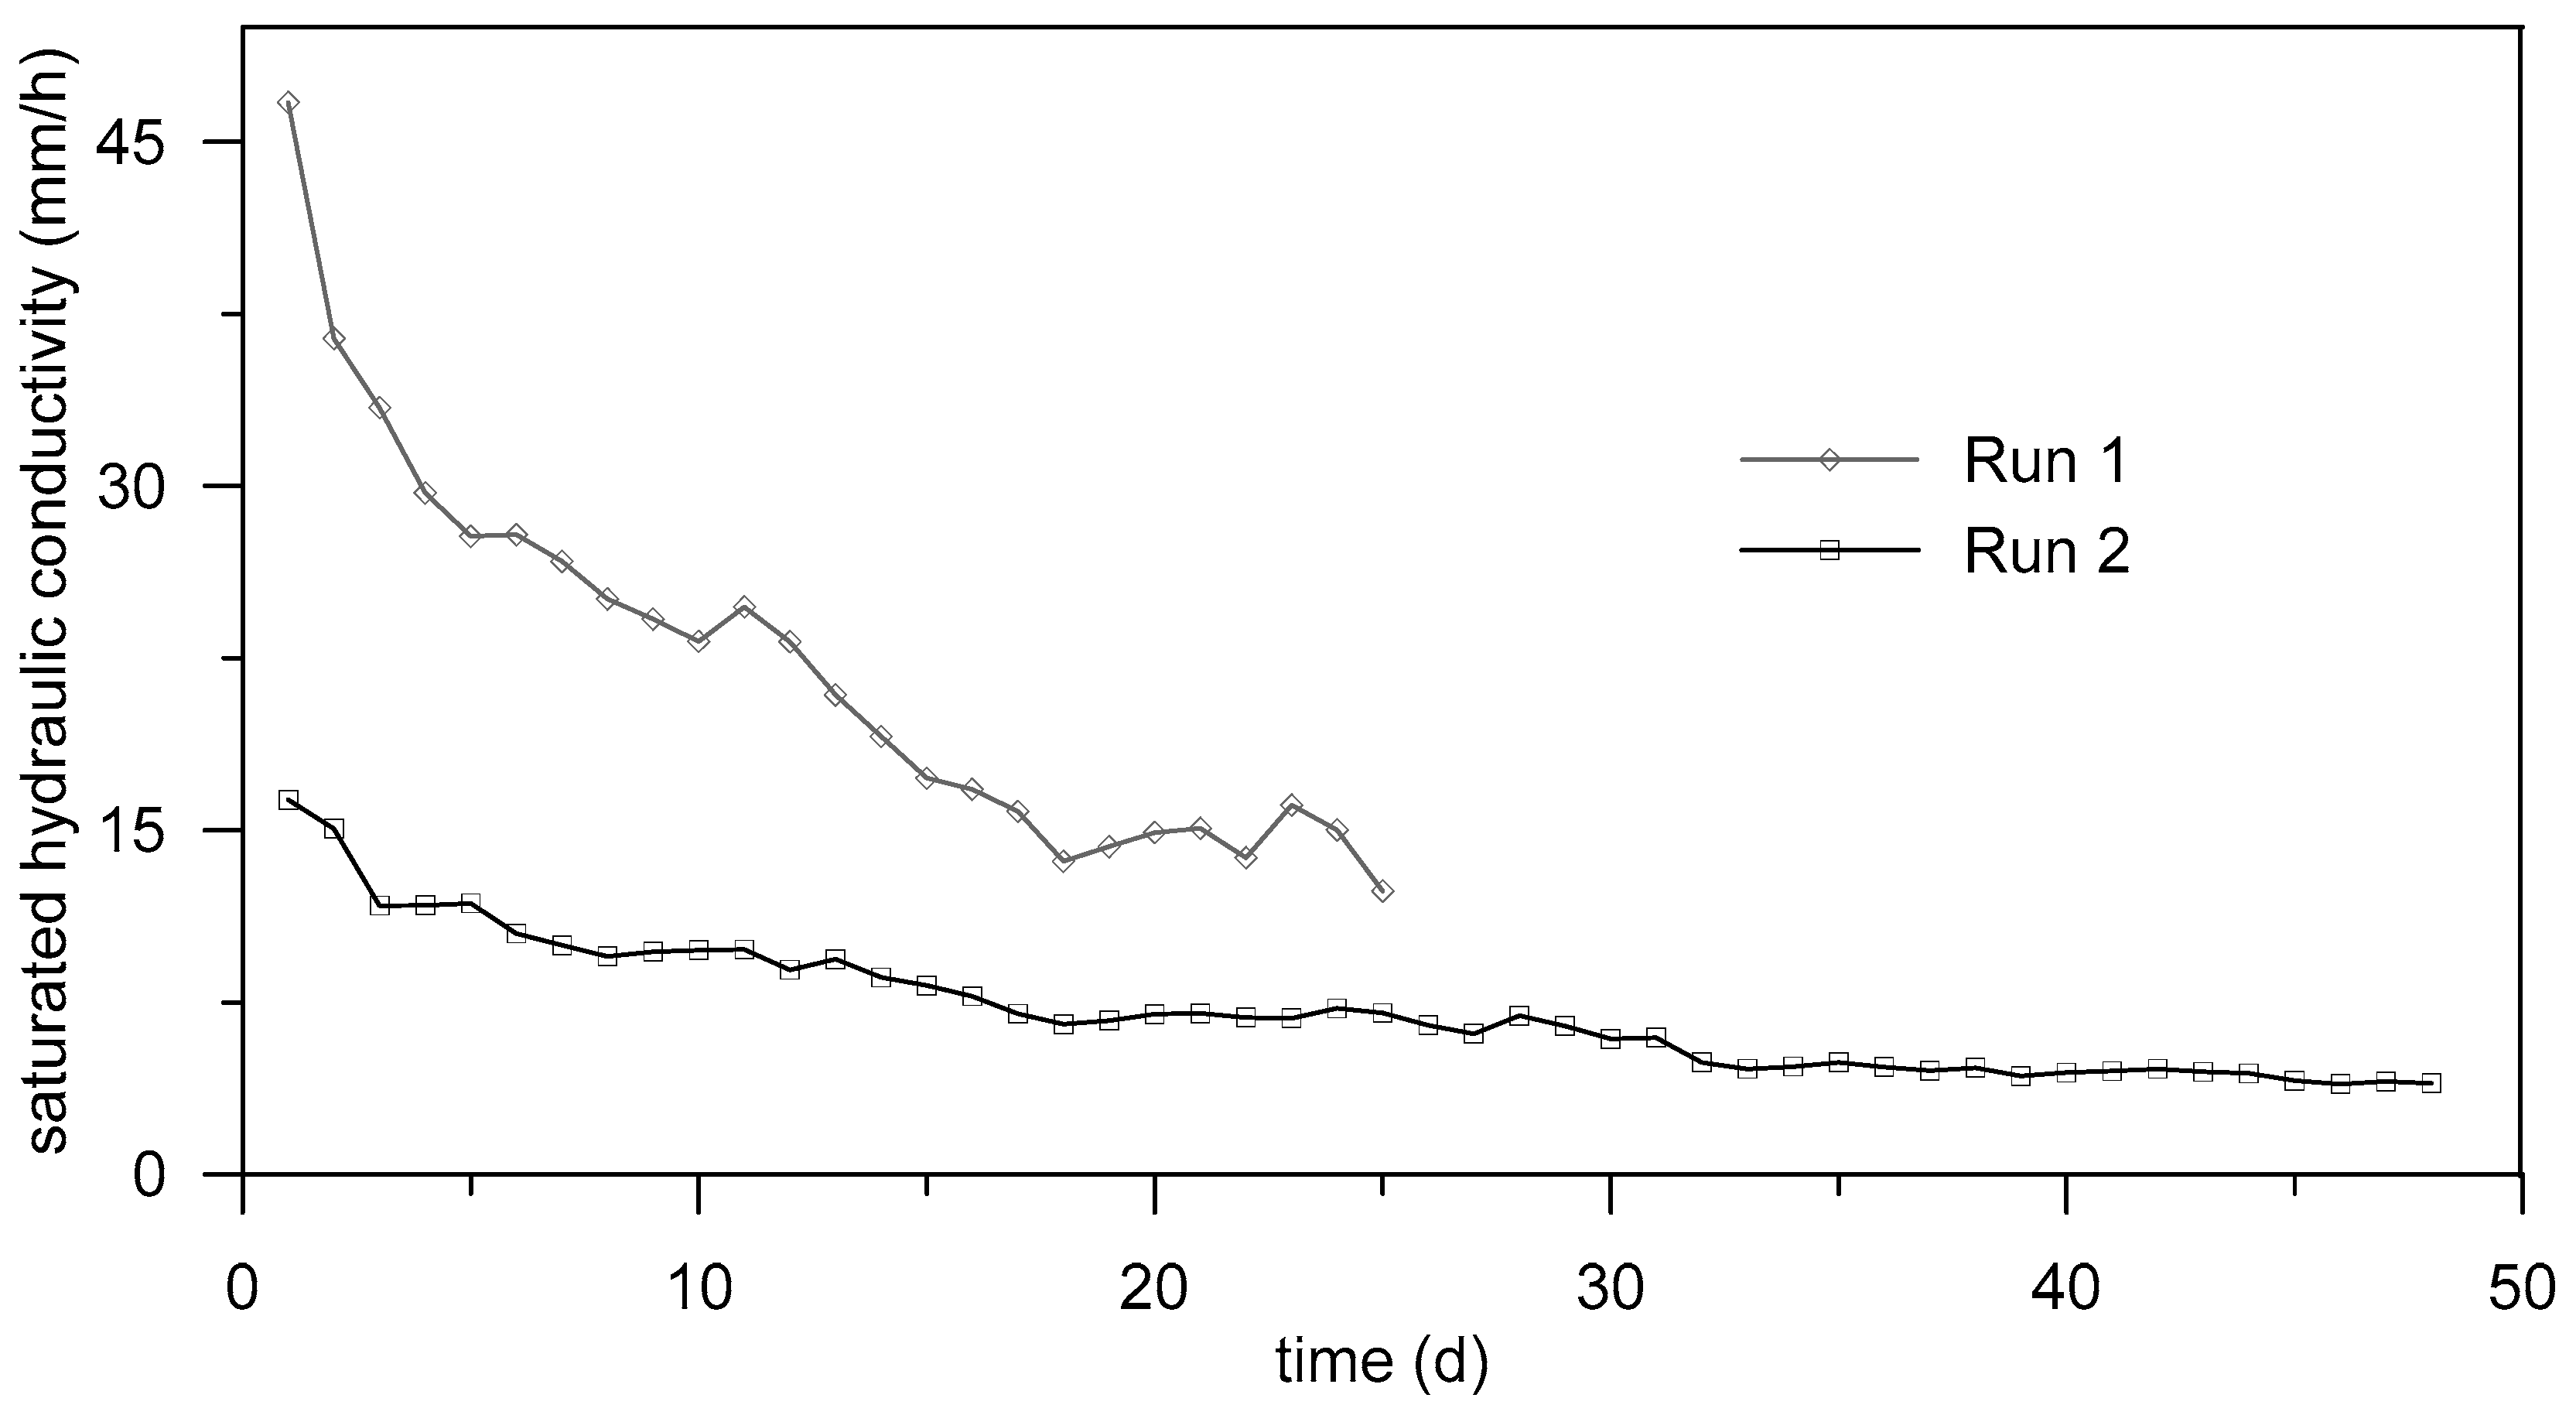
3.4. Long-Term Experiment

Figure 5 shows the saturated hydraulic conductivity during Run 1 and Run 2 of the long-term infiltration-outflow experiments for the Sandy Beach soil. The saturated hydraulic conductivity decreased during both runs (conducted over 25 and 48 days, respectively). The saturated hydraulic conductivity was reduced by 56% within 25 days during Run 1. The saturated hydraulic conductivity of the core during Run 2 slightly increased after the replacement of the gravel before starting this experiment. However, Ks declined again in a few days approximately within the passage of five pore volumes. During the 48 days of Run 2, 53 pore volumes passed through and a 75% reduction of Ks occurred.
At the end of the first experimental run, the top 27 cm of the gravel layer containing the trapped sediment was analyzed. From the analyses (Table 3), it was found that 60% of the removed sediment was trapped in the top layer of column (within a depth of 9 cm), and only 7% of the total sediment settled at a depth greater than 15 cm. The total 27 cm of gravel contained 58.6 g of particles (dry mass), which originated from applied highway stormwater runoff.

3.5. Intermittent Experiment

The soil always remained saturated during the intermittent infiltration-outflow experiment. This experiment was designed to simulate the situation where a trench receives intermittent pulses of stormwater but the soil surrounding the trench remains essentially saturated.
Two different phenomena were observed when the columns were subjected to flow/no flow cycles. During the flow phases, following a two-day pause, the microtensiometer data indicated that the deposited particles had been drawn down to the gravel-sand or sand-soil interfaces based on the locations of these microtensiometers. Flux data indicated that clogging occurred in the column. The Sandy Beach soil (Koko soil) is derived from volcanic ash, dominated by fine particles (68% silt and 20% clay), and the suspended solids in natural stormwater are predominantly particles of similar sizes. Because of this, self-filtration due to deposition of these similarly sized particles may have caused clogging in this column. While the Sandy Beach column clogged the most, the least clogging occurred in the Pali column (Figure 6). Kunia soils are highly weathered and have high clay and metal oxide content. It is expected that these soils will clog rapidly, which was confirmed in this study. It has been shown that clogging occurs in soils rich in clay minerals due to the deposition and leaching of fine particles [58,59,60,61]. There was visible cake formation at the top of the gravel layer due to the accumulation of particulates and sediment from the stormwater influent, indicative of physical clogging. The Sandy Beach and Kunia cores showed the greatest reductions in saturated hydraulic conductivity (Figure 6).

3.6. Batch Sorption Tests

The results of batch sorption tests showed large variability of Kd values among the 16 soils as well as between the 5 heavy metals considered in this analysis (Table 4). It was found that the values of Kd followed the order: Pb > Cr >> Cd > Co > Ni. Christensen et al. [62] showed Kd values for Cd and Ni within the same orders of magnitude as obtained in our study. Similar orders of magnitude of Kd as in the present study were reported for Cd, Co, and Ni by Anderson and Christensen [63]. Our estimated Kd values for Cr were greater than those found in the literature [64,65]. Similarly for Pb, Oahu soils seem to have higher adsorption capacity than soils reported in the literature [66,67]. High sorption capacity is associated with the high content of amorphous aluminosilicates and iron oxides found in many soils derived from volcanic ash in Hawaii [68]. The pH, net charge of the soil, and cation exchange capacity could be other contributing factors.
Relatively large Kd values indicate low mobility of the selected heavy metals in natural soils of Oahu, suggesting that the majority of the heavy metals would remain adsorbed to the soil phase of the soil matrix in the vicinity of infiltration trenches.

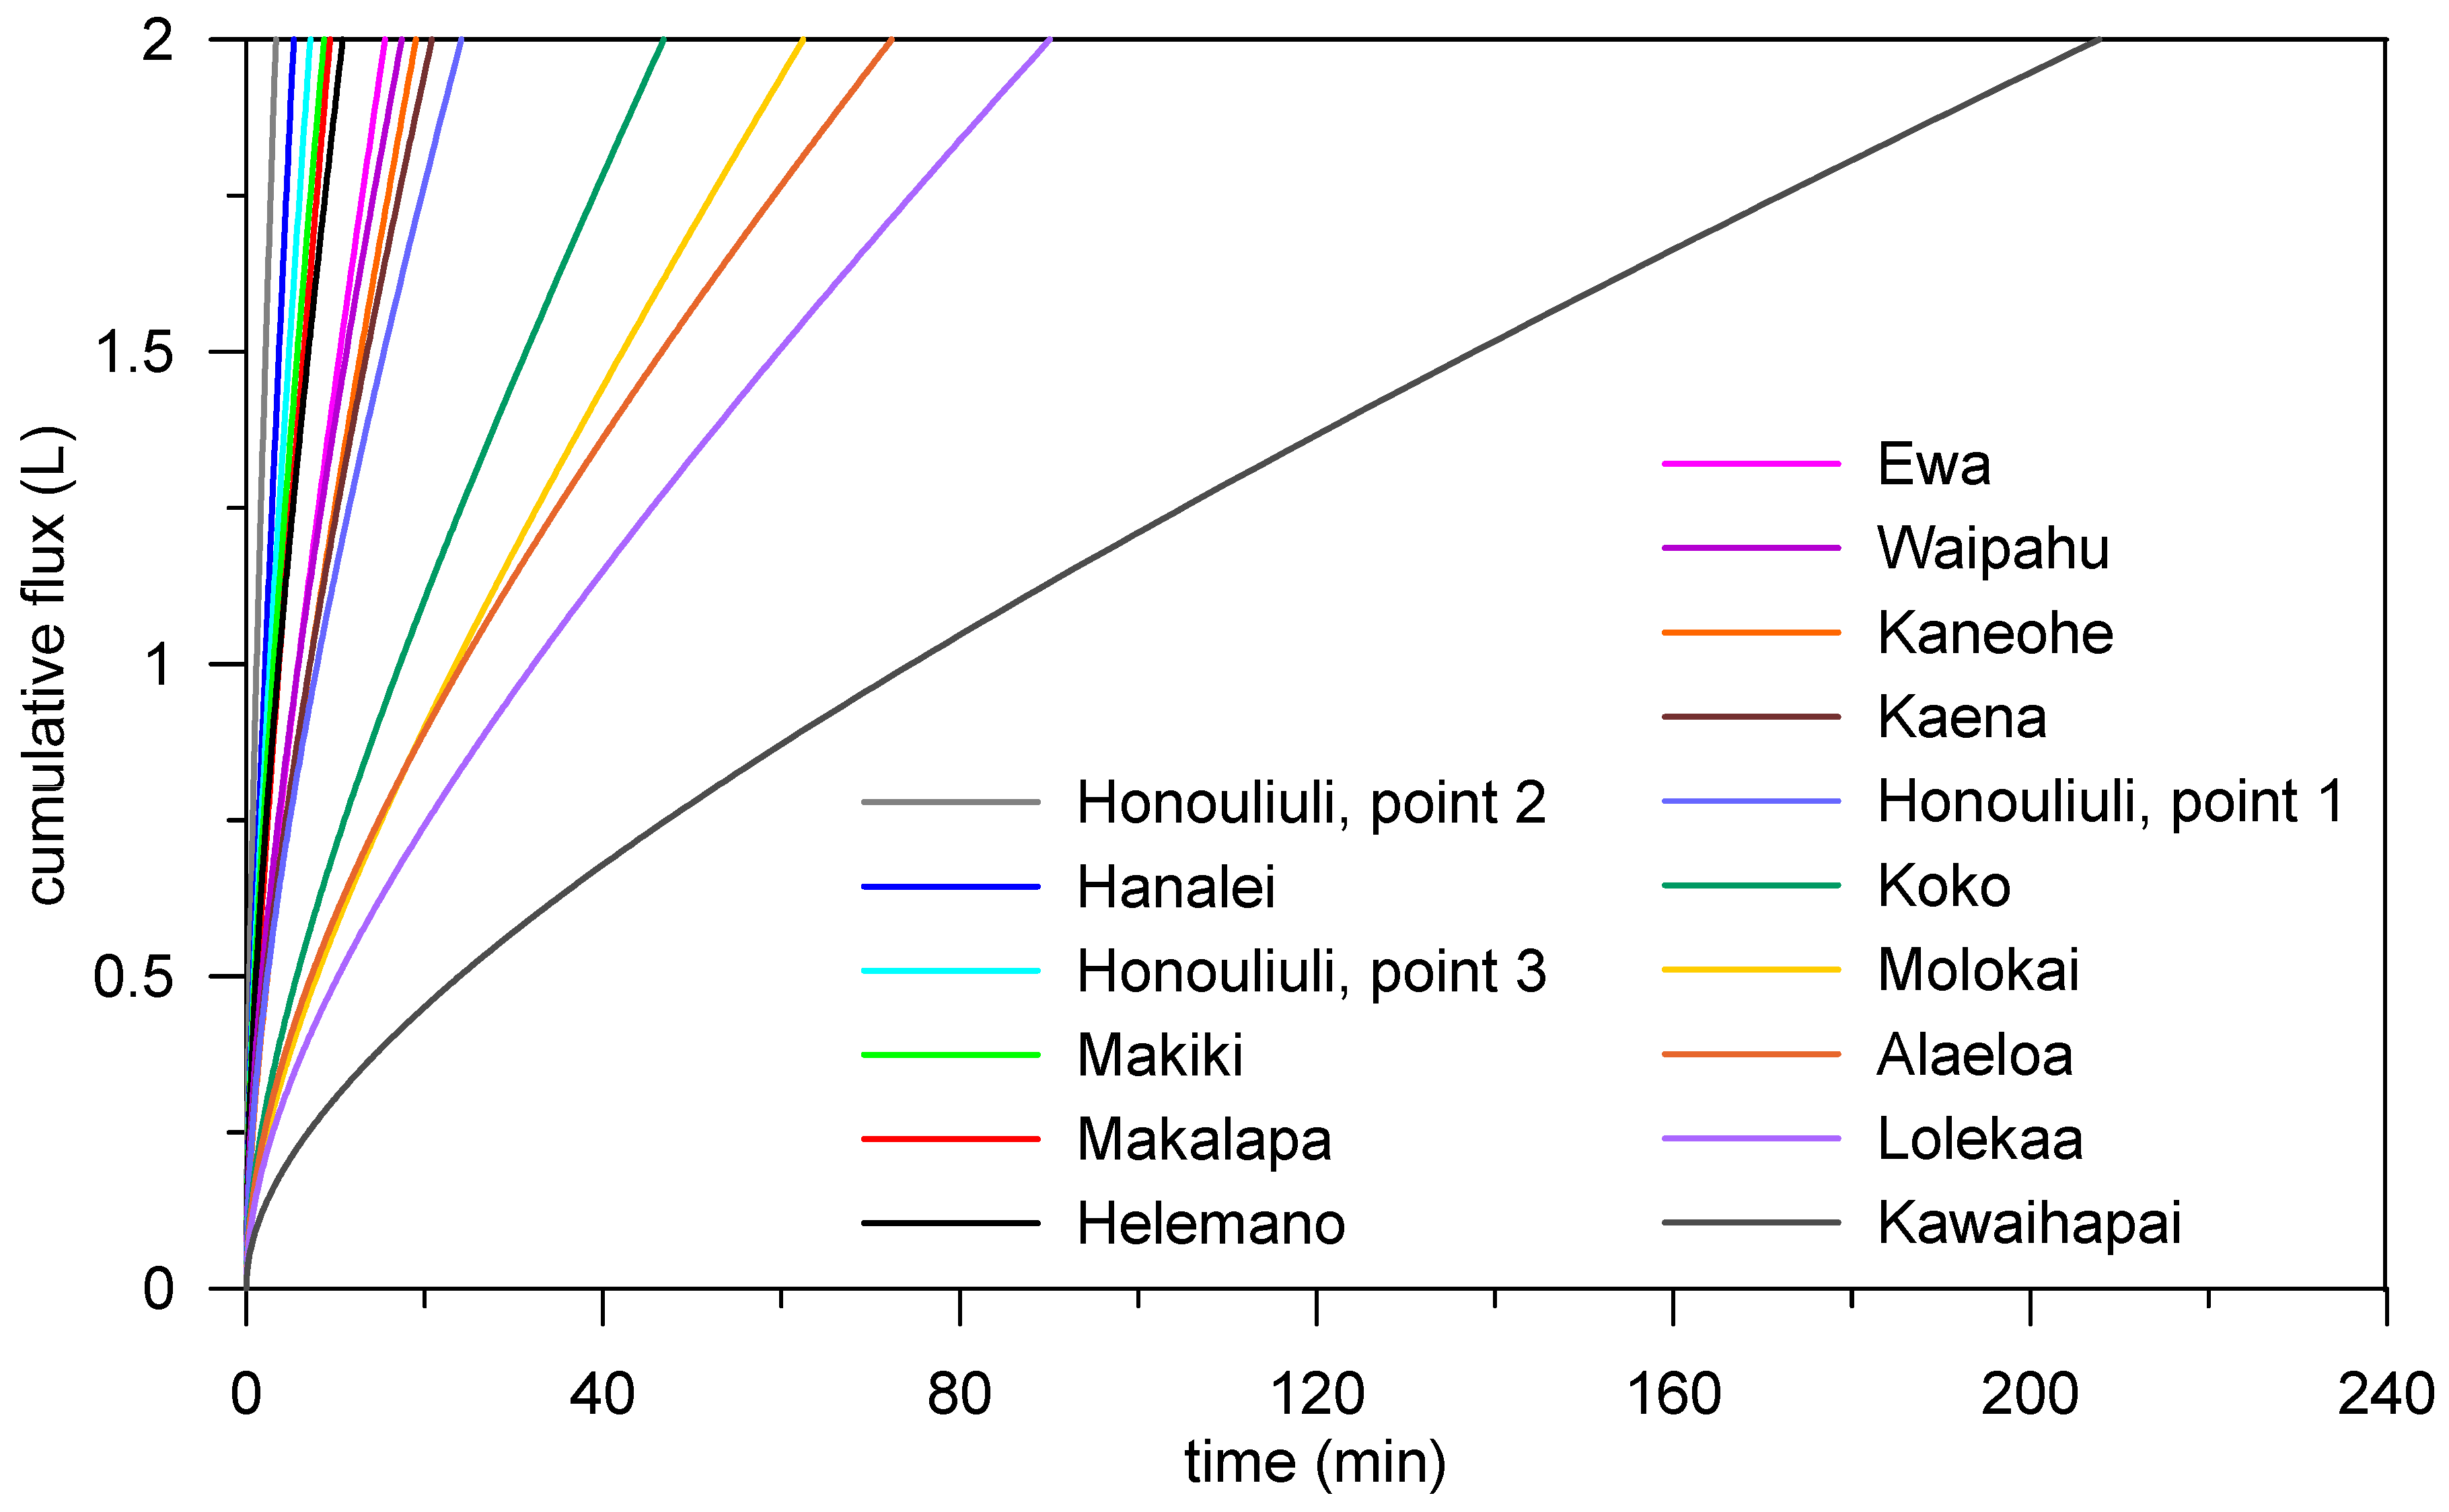
3.7. Modeling of Water Flow from Trenches

Table 5 shows simulated infiltration times required for emptying our model trench (dimensions of 1 m by 1 m) initially full of stormwater. The simplified selection of the boundary condition for the trench leads to shorter simulated times than would be seen in reality, i.e., the assumption of a completely full trench during the simulations would be fulfilled only in large runoff events. All soils, except for the Kawaihapai soil at the H3–H1 interchange (site no. 2) which had the least saturated hydraulic conductivity, showed infiltration times less than two hours (Table 5). HDOT guidelines [26], recommend that soils should have infiltration rates higher than 0.52 inch/h (13 mm/h) to be suitable for the siting of infiltration trenches. The Kawaihapai soil with a Ks value of 15 mm/h is close to this limit (Table 1). The shortest simulated infiltration time was seen for Honouliuli soil at H1—Kalaeloa Blvd., point 2—the time was as short as three minutes. The difference in infiltration times between Honouliuli soil at point 2 and Kawaihapai soil is primarily attributable to the difference in the saturated hydraulic conductivity (Ks) of the two soils.
Table 5 is further supplemented by Figure 7, where total cumulative flux (bottom and sidewall contributions) through the infiltration trench for all simulated soils is shown. This figure shows the periods needed to empty the trench of given size (1 m by 1 m) and volume of 2 L. The bottom and sidewall contributions to total cumulative flux from such a hypothetical infiltration trench in Kawaihapai soil is depicted in Figure 8. The vertical sidewalls of the trench are shown to drain a larger volume of stormwater runoff than the bottom of the trench. However, this is due to the greater effective length of vertical sidewall compared with the trench bottom. Due to greater pressure head on the bottom considered in the simulations (h = 100 cm), unit length of the trench bottom showed larger contribution as compared with vertical sidewall.
Our simulation indicated that for all the sampled Oahu soils, except Kawaihapai, less than two hours would be required to drain our hypothetical trench filled with stormwater. Therefore, these soils are potential candidates for construction of infiltration trenches as a possible BMP. Note that this conclusion is based on soil hydraulic characteristics obtained from the field sampling and does not include uncertainties associated with soil spatial variability and measurement methods.
A value of Ks equal to 5 mm/h, estimated from the long-term experiment lasting 48 days (Run 2 in Figure 6), was used for a thin soil layer along the infiltration trench to imitate clogging. When soil clogging was considered, only a negligible delay in the infiltration time for 2 L was obtained compared to the time calculated under a no clogging scenario (Table 5). This is in agreement with studies by Warnaars et al. [69], Dechesne et al. [70], and Toran and Jedrzejczyk [71] who recognized clogging as an insignificant factor. Warnaars et al. [69] concluded that clogging was less important than the lack of knowledge about soil permeability after evaluating 2.75 years of operation of stormwater infiltration trenches in central Copenhagen. On the contrary, some studies focused on continuous long-term monitoring of stormwater infiltration systems suggest that physical clogging takes place progressively [52,72,73] and therefore is of considerable importance in evaluating a soil for suitability for trench siting.
The rate of decline of Ks value of underlying soil during long-term operation of infiltration trenches is likely to depend on the particle size distribution of stormwater highway runoff [74]. In addition, the thickness of the deposition layer with reduced Ks is assumed to expand with time [75]. Higher water fluxes within the gravel material in the trench tend to deposit particles at the interface and in the underlying soil. This will more quickly reduce the hydraulic conductivity of the underlying soil during the operational lifespan of the infiltration trenches. Siriwardene et al. [76] showed in a laboratory study that a clogging layer mainly forms at the interface between the gravel material and underlying soil; clogging was caused by sediment particles less than 6 μm in diameter. Particle size distribution of stormwater highway runoff, used for the clogging experiments in our study, showed 80% of particles larger than 10 μm in diameter. Where land is not the limiting factor, on-site measures such as grassed swales can be provided to reduce clogging of the trenches [77].
Due to the high values of sorption distribution coefficients Kd estimated from our batch tests, transport simulations of heavy metals were not pursued in this study. The mobility of heavy metals is expected to be limited based on the short time frame of trench operation considered in our simulations of trench emptying. However, transport of heavy metals is of great importance when considering long-term operation of infiltration trenches.
In this study, highway stormwater runoff was collected at one location, where the influence of runoff containing soil sediment from surrounding area was eliminated. Because of diverse land use in the vicinity of highways, stormwater pollutant concentration can vary significantly [78]. Thus, more collection locations near the highways are proposed to take into account such conditions. The intermittent infiltration-outflow experiments were carried out to simulate intermittent rainfall events with continuous saturation of the soil. The long-term infiltration-outflow experiments were designed to study the effect of clogging under continuously saturated conditions in the infiltration trench such as over a prolonged period of rain. Under field conditions, the infiltration trenches are exposed to both types of effects studied in the two separate laboratory experiments. An improved design of the laboratory experiment may be helpful in analyzing long-term operation of the infiltration trenches under more realistic conditions.

4. Conclusions

Soils at all of the sites considered in this study contain heavy metals at detectable concentrations, but not exceeding EAL values for soil. Dissolved metal concentrations in H3 runoff exceeded the groundwater EALs for all heavy metals.
A one-dimensional experiment to imitate water flowing through an infiltration trench was carried out for four undisturbed soil samples. Collected stormwater runoff, rather than metal-spiked water was used for the column experiments to determine the adsorption capacities of the soils for highway contaminants. Different experimental procedures included long-term ponded infiltration and flow/no flow cycling to evaluate decreases in saturated hydraulic conductivity. A cake layer formed on top of the gravel surface that was placed atop the soil cores, which resulted in a decline of the outflow rate. Decreasing saturated hydraulic conductivity values were observed during the flow/no flow cycles and the long-term experiment. Gravel has great potential to remove or retain sediment particles, which was demonstrated by the analysis of the total suspended solids.
A two-dimensional numerical model was used to analyze water regime and predict functioning of the infiltration trenches. The results of the simulations showed that all sixteen sampled Oahu soils, with one exception, would require less than two hours to drain our hypothetical trench filled with stormwater. These soils are thus potential candidates for construction of infiltration trenches as a possible BMP, even when clogging of soil was considered in the simulation. In respect to clogging of the infiltration trench, the simulation did not represent the worst-case scenario, as stormwater highway runoff (used for the laboratory experiments) was sampled from an elevated road and thus did not contain soil sediment, which would increase the likelihood of clogging.

Author Contributions

M.S. carried out the laboratory experiments and participated in the writing. J.D. carried out numerical simulations, laboratory batch tests, and participated in the writing. G.A. and L.S. collected the field data, carried out the laboratory analyses, and analyzed the data. C.R. was responsible for the study conceptualization, writing and editing, and supervision. All five authors reviewed and contributed to the final manuscript.

Funding

This project was funded by the Hawaii Department of Transportation and the Federal Highway Administration (HWY-L-2.6237). Additional support was provided by the Czech Science Foundation (under project no. 17-21011S).

Acknowledgments

The authors wish to thank Michelle Teng (University of Hawaii), who provided a helpful assistance during the course of the project.

Conflicts of Interest

The authors declare no conflict of interest.

References

  1. Novotny, V. Integrating diffuse/nonpoint pollution control and water body restoration into watershed management. J. Am. Water Resour. Assoc. 1999, 35, 717–727. [Google Scholar]
  2. Kim, L.-H.; Kayhanian, M.; Zoh, K.-D.; Stenstrom, M.K. Modeling of highway stormwater runoff. Sci. Total Environ. 2005, 348, 1–18. [Google Scholar] [CrossRef] [PubMed]
  3. Sansalone, J.J.; Buchberger, S.G. An infiltration device as a best management practice for immobilizing heavy metals in urban highway runoff. Water Sci. Technol. 1995, 32, 119–125. [Google Scholar] [CrossRef]
  4. Mallin, M.A.; Williams, K.E.; Esham, E.C.; Lowe, R.P. Effect of human development on bacteriological water quality in coastal watersheds. Ecol. Appl. 2000, 10, 1047–1056. [Google Scholar] [CrossRef]
  5. Gaffield, S.J.; Goo, R.L.; Richards, L.A.; Jackson, R.J. Public health effects of inadequately managed stormwater runoff. Am. J. Public Health 2003, 93, 1527–1533. [Google Scholar] [CrossRef] [PubMed]
  6. Barbosa, A.E.; Hvitved-Jacobsen, T. Highway runoff and potential for removal of heavy metals in an infiltration pond in Portugal. Sci. Total Environ. 1999, 235, 151–159. [Google Scholar] [CrossRef]
  7. Huffman, E.J.; Mills, G.L.; Latimer, J.S.; Quinn, J.G. Urban runoff as a source of polycyclic aromatic hydrocarbons to coastal waters. Environ. Sci. Technol. 1984, 18, 580–587. [Google Scholar] [CrossRef] [PubMed]
  8. Sansalone, J.J.; Buchberger, S.G.; Al-Abed, S.R. Fractionation of heavy metals in pavement runoff. Sci. Total Environ. 1996, 189–190, 371–378. [Google Scholar] [CrossRef]
  9. Krein, A.; Schorer, M. Road runoff pollution by polycyclic aromatic hydrocarbons and its contribution to river sediments. Water Res. 2000, 34, 4110–4115. [Google Scholar] [CrossRef]
  10. Ngabe, B.; Bidleman, T.F.; Scott, G.I. Polyaromatic hydrocarbons in storm runoff from urban and coastal South Carolina. Sci. Total Environ. 2000, 255, 1–9. [Google Scholar] [CrossRef]
  11. Hatt, B.E.; Fletcher, T.D.; Deletic, A. Hydraulic and pollutant removal performance of fine media stormwater filtration systems. Environ. Sci. Technol. 2008, 42, 2535–2541. [Google Scholar] [CrossRef] [PubMed]
  12. Revitt, D.M.; Lundy, L.; Coulon, F.; Fairley, M. The sources, impact, and management of car park runoff pollution: A review. J. Environ. Manag. 2014, 146, 552–567. [Google Scholar] [CrossRef] [PubMed]
  13. Davis, B.; Birch, G. Comparison of heavy metal loads in stormwater runoff from major and minor urban roads using pollutant yield rating curves. Environ. Pollut. 2010, 158, 2541–2545. [Google Scholar] [CrossRef] [PubMed]
  14. Huber, M.; Welker, A.; Helmreich, B. Critical review of heavy metal pollution of traffic area runoff: Occurrence, influencing factors, and partitioning. Sci. Total Environ. 2016, 541, 895–919. [Google Scholar] [CrossRef] [PubMed]
  15. Djukić, A.; Lekić, B.; Rajaković-Ognjanović, V.; Veljović, D.; Vulić, T.; Djolić, M.; Nanovic, Z.; Despotović, J.; Prodanović, D. Further insight into the mechanism of heavy metals partitioning in stormwater runoff. J. Environ. Manag. 2016, 168, 104–110. [Google Scholar] [CrossRef]
  16. Borris, M.; Osterlund, H.; Marsalek, J.; Viklander, M. Contribution of coarse particles from road surfaces to dissolved and particle-bound heavy metal loads in runoff: A laboratory leaching study with synthetic stormwater. Sci. Total Environ. 2016, 573, 212–221. [Google Scholar] [CrossRef]
  17. Botsou, F.; Sungur, A.; Kelepertzis, E.; Soylak, M. Insights into the chemical partitioning of trace metals in roadside and off-road agricultural soils along two major highways in Attica’s region, Greece. Ecotoxicol. Environ. Saf. 2016, 132, 101–110. [Google Scholar] [CrossRef]
  18. Lee, J.H.; Bang, K.W.; Ketchum, L.H., Jr.; Choe, J.S.; Yu, M.J. First flush analysis of urban storm runoff. Sci. Total Environ. 2002, 293, 163–175. [Google Scholar] [CrossRef]
  19. Gikas, G.D.; Tsihrintzis, V.A. Assessment of water quality of first-flush roof runoff and harvested rainwater. J. Hydrol. 2012, 466, 115–126. [Google Scholar] [CrossRef]
  20. Wong, M.F. Water Quality in the Halawa, Haiku, and Kaneohe Drainage Basins before, during, and after H-3 Highway Construction, Oahu, Hawaii, 1983–1999; U.S. Geological Survey Scientific Investigations Report 2004-5002; U.S. Geological Survey: Reston, VA, USA, 2005; p. 45.
  21. Presley, T.K. Rainfall, Streamflow and Water-Quality Data During Stormwater Monitoring, Halawa Stream Drainage Basin, Oahu, Hawaii, July 1, 2000 to June 30, 2001; USGS Open-File Report 01-256; Prepared by USGS & HDOT; Geological Survey (U.S.): Reston, VA, USA, 2001.
  22. Presley, T.K. Rainfall, Streamflow and Water-Quality Data During Stormwater Monitoring, Halawa Stream Drainage Basin, Oahu, Hawaii, July 1, 2001 to June 30, 2002; USGS Open-File Report 02-319; Prepared by USGS & HDOT; Geological Survey (U.S.): Reston, VA, USA, 2002.
  23. Young, S.T.M.; Ball, M.T.J. Rainfall, Streamflow and Water-Quality Data During Stormwater Monitoring, Halawa Stream Drainage Basin, Oahu, Hawaii, July 1, 2003 to June 30, 2004; USGS Open-File Report 2004-1275; Prepared by USGS & HDOT; Geological Survey (U.S.): Reston, VA, USA, 2004.
  24. Young, S.T.M.; Ball, M.T.J. Rainfall, Streamflow and Water-Quality Data During Stormwater Monitoring, Halawa Stream Drainage Basin, Oahu, Hawaii, July 1, 2004 to June 30, 2005; USGS Open-File Report 2005-1280; Prepared by USGS & HDOT; Geological Survey (U.S.): Reston, VA, USA, 2005.
  25. State of Hawaii, Department of Transportation, Highways Division. Post-Construction Storm Water Management in New Development and Redevelopment. Available online: https://hidot.hawaii.gov/harbors/files/2018/10/2014-Post-Construction-SW-Manual_Final.pdf (accessed on 3 July 2013).
  26. State of Hawaii, Department of Transportation, Highways Division. Storm Water Permanent Best Management Practices Manual. Available online: http://hidot.hawaii.gov/wp-content/uploads/2015/05/Appx-E.1-Permanent-BMP-Manual-Feb-2007.pdf (accessed on 3 July 2013).
  27. Mikkelsen, P.S.; Häfliger, M.; Ochs, M.; Tjell, J.C.; Jacobsen, P.; Boller, M. Experimental assessment of soil and groundwater contamination from two old infiltration systems for road run-off in Switzerland. Sci. Total Environ. 1996, 189, 341–347. [Google Scholar] [CrossRef]
  28. Maimone, M.; O’Rourke, D.E.; Knighton, J.O.; Thomas, C.P. Potential impacts of extensive stormwater infiltration in Philadelphia. Environ. Eng. Appl. Res. Pract. 2011, 14, 2–12. [Google Scholar]
  29. Freni, G.; Mannina, G.; Viviani, G. Stormwater infiltration trenches: A conceptual modelling approach. Water Sci. Technol. 2009, 60, 185–199. [Google Scholar] [CrossRef] [PubMed]
  30. Chahar, B.G.; Graillot, D.; Gaur, S. Storm-water management through infiltration trenches. J. Irrig. Drain. Eng. 2011, 138, 274–281. [Google Scholar] [CrossRef]
  31. Department of Transportation (DOH). Storm Water Permanent BMP Manual; Infiltration Trench; Highways Division: Honolulu, HI, USA, 2007.
  32. Foote, D.E.; Hill, S.N.; Stephens, F. Soil Survey of The Islands of Kauai, Oahu, Maui, Molokai and Lanai, State of Hawaii; USDA-Soil Conservation Service & The University of Hawaii-Agricultural Experiment Station: Washington, DC, USA, 1972; p. 232.
  33. Perroux, K.M.; White, I. Designs for disk permeameters. Soil Sci. Soc. Am. J. 1988, 52, 1205–1215. [Google Scholar] [CrossRef]
  34. Reynolds, W.D.; Elrick, D.E. Determination of Hydraulic Conductivity Using a Tension Infiltrometer. Soil Sci. Soc. Am. J. 1991, 55, 633–639. [Google Scholar] [CrossRef]
  35. Clothier, B.E.; Kirkham, M.B.; McLean, J.E. In situ measurement of the effective transport volume for solute moving through soil. Soil Sci. Soc. Am. J. 1992, 56, 733–736. [Google Scholar] [CrossRef]
  36. Reynolds, W.D.; Bowman, B.T.; Brunke, R.R.; Drury, C.F.; Tan, C.S. Comparison of tension infiltrometer, pressure infiltrometer, and soil core estimates of saturated hydraulic conductivity. Soil Sci. Soc. Am. J. 2000, 64, 478–484. [Google Scholar] [CrossRef]
  37. Van Genuchten, M.T.; Leij, F.J.; Yates, S.R. The RETC Code for Quantifying the Hydraulic Functions of Unsaturated Soils; U.S. EPA Report 600/2-91/065; Environmental Protection Agency: Washington, DC, USA, 1991; p. 85.
  38. Klute, A. (Ed.) Water Retention: Laboratory Methods. In Methods of Soil Analysis, Part 1 Physical and Mineralogical Methods; American Society of Agronomy-Soil Science Society of America: Madison, WI, USA, 1986; pp. 635–662. [Google Scholar]
  39. Van Genuchten, M.T. A closed-form equation for predicting the hydraulic conductivity of unsaturated soils. Soil Sci. Soc. Am. J. 1980, 44, 892–898. [Google Scholar] [CrossRef]
  40. ASTM Standard. Zeta Potential of Colloids in Water and Waste Water; ASTM Standard D 4187-82; American Society for Testing and Materials: West Conshohocken, PA, USA, 1985. [Google Scholar]
  41. Monnier, J.-P.; Hoff, K.C.; Ratsimba, B. Particle size determination by laser reflection: Methodology and problems. Part. Part. Syst. Charact. 1996, 13, 10–17. [Google Scholar] [CrossRef]
  42. United States Environmental Protection Agency (US EPA). Method 1664 Revision A: N-Hexane Extractable Material (HEM; Oil and Grease) and Silica Gel Treated N-Hexane Extractable Material (SGT-HEM; Non-polar Material) by Extraction and Gravimetry; EPA821-R-98-002; United States Environmental Protection Agency, Office of Water: Washington, DC, USA, 1999.
  43. Hawaii Department of Health (HDOH). Evaluation of Environmental Hazards at Sites with Contaminated Soil and Groundwater (Fall 2017); Hawaii Department of Health, Hazard Evaluation and Emergency Response: Honolulu, HI, USA, 2017.
  44. Organisation for Economic Co-operation and Development (OECD). Test No. 106: Adsorption—Desorption Using a Batch Equilibrium Method. In OECD Guidelines for the Testing of Chemicals, Section 1; OECD Publishing: Paris, France, 2000. [Google Scholar]
  45. Shammaa, Y.; Zhu, D.Z. Techniques for controlling total suspended solids in stormwater runoff. Can. Water Resour. J. 2001, 26, 359–375. [Google Scholar] [CrossRef]
  46. Emerson, C.H.; Wadzuk, B.M.; Traver, R.G. Hydraulic evolution and total suspended solids capture of an infiltration trench. Hydrol. Process. 2010, 24, 1008–1014. [Google Scholar] [CrossRef]
  47. Šimůnek, J.; Van Genuchten, M.T.; Šejna, M. The HYDRUS Software Package for Simulating Two-and Three-Dimensional Movement of Water, Heat, and Multiple Solutes in Variably-Saturated Media; Technical Manual, Version 1; PC Progress: Prague, Czech Republic, 2006. [Google Scholar]
  48. Radcliffe, D.E.; West, L.T.; Singer, J. Gravel effect on wastewater infiltration from septic system trenches. Soil Sci. Soc. Am. J. 2005, 69, 1217–1224. [Google Scholar] [CrossRef]
  49. Finch, S.D.; Radcliffe, D.E.; West, L.T. Modeling trench sidewall and bottom flow in on-site wastewater systems. J. Hydrol. Eng. 2008, 13, 693–701. [Google Scholar] [CrossRef]
  50. Vogel, T.; Cislerova, M. On the reliability of unsaturated hydraulic conductivity calculated from the moisture retention curve. Transp. Porous Med. 1988, 3, 1–15. [Google Scholar] [CrossRef]
  51. Vogel, T.; Van Genuchten, M.T.; Cislerova, M. Effect of the shape of soil hydraulic functions near saturation on variably-saturated flow predictions. Adv. Water Resour. 2001, 24, 133–144. [Google Scholar] [CrossRef]
  52. Bergman, M.; Hedegaard, M.R.; Petersen, M.F.; Binning, P.; Mark, O.; Mikkelsen, P.S. Evaluation of two stormwater infiltration trenches in central Copenhagen after 15 years of operation. Water Sci. Technol. 2011, 63, 2279–2286. [Google Scholar] [CrossRef]
  53. Coulon, A.; Cannavo, P.; Charpentier, S.; Vidal-Beaudet, L. Clogging-up of a stormwater infiltration basin: A laboratory approach using image analysis. J. Soils Sediments 2015, 15, 1738–1752. [Google Scholar] [CrossRef]
  54. United States Department of Agriculture (USDA). Soil Survey of Islands of Kauai, Oahu, Maui, Molokai, and Lanai, State of Hawaii; Soil Conservation Service, United States Department of Agriculture in Cooperation with the University of Hawaii Agricultural Experiment Station: Washington, DC, USA, 1972.
  55. Yost, R.S.; Loague, K.; Nakamura, S.; Green, R.E.; Chromec, F.W.; Liang, T.C. Hawaii Soil Database for Organic Chemical Leaching Assessment; Research Extension Series 153; Hawaii Institute of Tropical Agriculture and Human Resources, University of Hawaii at Manoa: Honolulu, HI, USA, 1994; p. 11. [Google Scholar]
  56. Kayhanian, M.; Suverkropp, C.; Ruby, A.; Tsay, K. Characterization and prediction of highway runoff constituent event mean concentration. J. Environ. Manag. 2007, 85, 279–295. [Google Scholar] [CrossRef]
  57. Sansalone, J.J.; Buchberger, S.G. Partitioning and first flush of metals in urban roadway storm water. J. Environ. Eng. ASCE 1997, 123, 134–143. [Google Scholar] [CrossRef]
  58. Frenkel, H.; Goertzen, J.; Rhoades, J. Effects of clay type and content, exchangeable sodium percentage, and electrolyte concentration on clay dispersion and soil hydraulic conductivity. Soil Sci. Soc. Am. J. 1978, 42, 32–39. [Google Scholar] [CrossRef]
  59. Pupisky, H.; Shainberg, I. Salt effects on the hydraulic conductivity of a sandy soil. Soil Sci. Soc. Am. J. 1979, 43, 429–433. [Google Scholar] [CrossRef]
  60. Pignon, F.; Magnin, A.; Piau, J.M.; Cabane, B.; Aimar, P.; Meireles, M.; Lindner, P. Structural characterisation of deposits formed during frontal filtration. J. Membr. Sci. 2000, 174, 189–204. [Google Scholar] [CrossRef]
  61. Santiwong, S.R.; Guan, J.; Waite, T.D. Effect of ionic strength and pH on hydraulic properties and structure of accumulating solid assemblages during microfiltration of montmorillonite suspensions. J. Colloid Interface Sci. 2008, 317, 214–227. [Google Scholar] [CrossRef] [PubMed]
  62. Christensen, T.H.; Lehmann, N.; Jackson, T.; Holm, P.E. Cadmium and nickel distribution coefficients for sandy aquifer materials. J. Contam. Hydrol. 1996, 24, 75–84. [Google Scholar] [CrossRef]
  63. Anderson, P.R.; Christensen, T.H. Distribution coefficients of Cd, Co, Ni, and Zn in soils. Eur. J. Soil Sci. 1988, 39, 15–22. [Google Scholar] [CrossRef]
  64. Dong, D.; Zhao, X.; Hua, X.; Liu, J.; Gao, M. Investigation of the potential mobility of Pb, Cd and Cr (VI) from moderately contaminated farmland soil to groundwater in Northeast, China. J. Hazard. Mater. 2009, 162, 1261–1268. [Google Scholar] [CrossRef]
  65. Castro-Rodríguez, A.; Carro-Pérez, M.E.; Iturbe-Argüelles, R.; González-Chávez, J.L. Adsorption of hexavalent chromium in an industrial site contaminated with chromium in Mexico. Environ. Earth Sci. 2015, 73, 175–183. [Google Scholar] [CrossRef]
  66. Diatta, J.B.; Kociałkowski, W.Z.; Grzebisz, W. Lead and zinc partition coefficients of selected soils evaluated by Langmuir, Freundlich, and linear isotherms. Commun. Soil Sci. Plant Anal. 2003, 34, 2419–2439. [Google Scholar] [CrossRef]
  67. Jakomin, L.M.; Marbán, L.; Grondona, S.; Galli, M.G.; Martinez, D.E. Mobility of Heavy Metals (Pb, Cd, Zn) in the Pampeano and Puelche Aquifers, Argentina: Partition and Retardation Coefficients. Bull. Environ. Contam. Toxicol. 2015, 95, 325–331. [Google Scholar] [CrossRef]
  68. Hue, N.V. Arsenic chemistry and remediation in Hawaiian soils. Int. J. Phytoremediat. 2013, 15, 105–116. [Google Scholar] [CrossRef]
  69. Warnaars, E.; Larsen, A.V.; Jacobsen, P.; Mikkelsen, P.S. Hydrologic behaviour of stormwater infiltration trenches in a central urban area during 2¾ years of operation. Water Sci. Technol. 1999, 39, 217–224. [Google Scholar] [CrossRef]
  70. Dechesne, M.; Barraud, S.; Bardin, J.P. Experimental assessment of stormwater infiltration basin evolution. J. Environ. Eng. ASCE 2005, 131, 1090–1098. [Google Scholar] [CrossRef]
  71. Toran, L.; Jedrzejczyk, C. Water level monitoring to assess the effectiveness of stormwater infiltration trenches. Environ. Eng. Geosci. 2017, 23, 113–124. [Google Scholar] [CrossRef]
  72. Gonzalez-Merchan, C.; Barraud, S.; Le Coustumer, S.; Fletcher, T. Monitoring of clogging evolution in the stormwater infiltration system and determinant factors. Eur. J. Environ. Civ. Eng. 2012, 16, s34–s47. [Google Scholar] [CrossRef]
  73. Barraud, S.; Gonzalez-Merchan, C.; Nascimento, N.; Moura, P.; Silva, A. A method for evaluating the evolution of clogging: Application to the Pampulha Campus infiltration system (Brazil). Water Sci. Technol. 2014, 69, 1241–1248. [Google Scholar] [CrossRef]
  74. Dechesne, M.; Barraud, S.; Bardin, J.P. Indicators for hydraulic and pollution retention assessment of stormwater infiltration basins. J. Environ. Manag. 2004, 71, 371–380. [Google Scholar] [CrossRef]
  75. Siegrist, R.L. Soil Clogging During Subsurface Wastewater Infiltration as Affected by Effluent Composition and Loading Rate1. J. Environ. Qual. 1987, 16, 181–187. [Google Scholar] [CrossRef]
  76. Siriwardene, N.R.; Deletic, A.; Fletcher, T.D. Clogging of stormwater gravel infiltration systems and filters: Insights from a laboratory study. Water Res. 2007, 41, 1433–1440. [Google Scholar] [CrossRef]
  77. Abida, H.; Sabourin, J.F. Grass swale-perforated pipe systems for stormwater management. J. Irrig. Drain. Eng. 2006, 132, 55–63. [Google Scholar] [CrossRef]
  78. Tu, M.-C.; Smith, P. Modelling pollutant buildup and washoff parameters for SWMM based on land use in a semiarid urban watershed. Water Air Soil Pollut. 2018, 229, 121. [Google Scholar] [CrossRef]
Figure 1. Selection of sampling sites for potential siting of infiltration trenches along highways and major roads on Oahu, HI. The numbers refer to sampling sites, 1: H3—Kamehameha interchange (IC), 2: H3—H1 IC, 3: Likelike—H1 IC, 4: H1—University Ave., 5: H1—Moanalua Rd., 6: H1—H2 IC, 7: Pali—Kamehameha Hwy., 8: H1—Kamehameha Hwy., 9: H2—Kauka Blvd., 10: Kamehameha Hwy. —Waialua Beach Rd., 11: Pali from Ahi Pl. to the tunnel, 12–14: H1—Kalaeloa Blvd., 3 points, 15: Sandy Beach Park, 16: Likelike—Kahekili Hwy. Two additional sites from which the soil columns used for the laboratory experiments (North Shore and Kunia) and the location where stormwater highway runoff (H3 runoff) was collected are also shown.
Water 10 01832 g001
Figure 2. Schematic of the setup used for the intermittent infiltration-outflow experiments on four soil columns including gravel (80 cm), sand (10 cm), and soil (25 cm).
Water 10 01832 g002
Figure 3. Schematic of the two-dimensional flow domain used for the simulations.
Water 10 01832 g003
Figure 4. Median of observed concentrations of heavy metals in Oahu soils, topsoil at H3 runoff outlet, and environmental action levels.
Water 10 01832 g004
Figure 5. Results of the long-term clogging column experiments on Sandy Beach soil. A decrease of saturated hydraulic conductivity for the first run (Run 1) over 25 days and the second run (Run 2) over 48 days.
Water 10 01832 g005
Figure 6. Average saturated hydraulic conductivity values during intermittent infiltration-outflow experiments in four different soil columns. The abbreviations represent columns from North Shore (NS), Sandy Beach (SB), Kunia (K), and Pali (P). The numbers below the columns indicate the time (days since start of the experiment) when the evaluation of the saturated hydraulic conductivity was performed. The error bars represent standard deviations.
Water 10 01832 g006
Figure 7. Cumulative flux through from a hypothetical infiltration trench for sixteen simulated soils.
Water 10 01832 g007
Figure 8. Cumulative flux through the sidewall and bottom of the trench for Kawaihapai soil.
Water 10 01832 g008
Table 1. Measured bulk density (BD), saturated water content (θs), estimated saturated hydraulic conductivity (Ks), residual water content (θr) and Van Genuchten parameters (α, n, l) for soils along Oahu highways. Ks, θr, α, n, and l were estimated using the RETC program of Van Genuchten et al. [37] using Van Genuchten/Mualem model with (m = 1 − 1/n) [39]. Depth of soil samples was 30–50 cm.
No.LocationSoil TypeBD (g/cm3)Ks (mm/h)θs (%)θr (%)α (1/cm)n (–)l (–)
1H3—Kamehameha ICKaneohe1.101845200.0271.096
2H3—H1 ICKawaihapai1.06154600.0181.270.5
3Likelike—H1 ICKaena1.401365000.0281.170.5
4H1—University Ave.Makiki1.373515300.0231.156.5
5H1—Moanalua Rd.Molokai1.215650280.0181.309
6H1—H2 ICWaipahu1.291515400.021.220.5
7Pali—Kamehameha Hwy.Alaeloa1.143848290.161.482
8H1—Kamehameha Hwy.Makalapa1.5241265360.041.118
9H2—Kauka Blvd.Helemano1.152484300.051.194
10Kamehameha Hwy.—Waialua Beach Rd.Ewa1.482175400.011.152
11Pali from Ahi Pl. to the tunnelLolekaa1.223453200.0021.250.5
12H1—Kalaeloa Blvd., point 1Honouliuli1.5110046200.021.630.5
13H1—Kalaeloa Blvd., point 2Honouliuli1.518895690.061.126
14H1—Kalaeloa Blvd., point 3Honouliuli1.514675200.021.120.5
15Sandy Beach ParkKoko1.237147200.021.250.5
16Likelike—Kahekili Hwy.Hanalei1.067364360.041.066
Table 2. Summary statistics (median and standard deviation (SD)) of observed dissolved metal concentrations (μg/L) in stormwater highway runoff from H3 collected on Halawa Valley Street. Median and range values are reported for California highway dataset [56]. EALs values refer for groundwater discharging to surface water [43].
AsCdCoCrCuNiPbSeZn
H3 freeway—median15.55.610.032.961.615.542.759.241.9
H3 freeway—SD18.41.74.737.594.615.2125.019.082.1
California highways—median0.70.13-2.210.23.41.2-40.4
California highways—range0.5–200.2–8.4-1–231.1–1301.1–401–480-3–107
EAL0.1436116515522
Table 3. Characteristics of sediment trapped in gravel layer after Run 1 of the long-term flow clogging experiment.
Layer Thickness (cm)Sediment per Layer (g/cm)Sediment per Gram of Gravel (g/g)
0–94.970.0497
9–182.450.0251
18–270.350.0029
Table 4. Values of sorption distribution coefficient Kd (in L/g) obtained from the batch sorption tests.
CdCoCrNiPb
Min0.1480.0597.210.06467.8
Max4.981.47637.01.19832.0
Average1.110.541148.00.464237.0
Standard deviation1.250.398163.00.338183.0
Table 5. Simulated times required for infiltration of 2 L of stormwater in model trench.
No.LocationSoil TypeInfiltration Time (min)
1H3—Kamehameha ICKaneohe19.0
2H3—H1 ICKawaihapai208.0
3Likelike—H1 ICKaena20.8
4H1—University Ave.Makiki8.73
5H1—Moanalua Rd.Molokai62.5
6H1—H2 ICWaipahu17.5
7Pali—Kamehameha Hwy.Alaeloa72.4
8H1—Kamehameha Hwy.Makalapa9.39
9H2—Kauka Blvd.Helemano10.8
10Kamehameha Hwy.—Waialua Beach Rd.Ewa15.6
11Pali from Ahi Pl. to the tunnelLolekaa90.2
12H1—Kalaeloa Blvd., point 1Honouliuli24.2
13H1—Kalaeloa Blvd., point 2Honouliuli3.32
14H1—Kalaeloa Blvd., point 3Honouliuli7.19
15Sandy Beach Park—no cloggingKoko46.8
15Sandy Beach Park—with cloggingKoko53.8
16Likelike—Kahekili Hwy.Hanalei5.32

