Article

Post-Monsoon Season Precipitation Reduction over South Asia: Impacts of Anthropogenic Aerosols and Irrigation

Department of Atmospheric Sciences, National Taiwan University, Taipei 10617, Taiwan
*
Author to whom correspondence should be addressed.
Atmosphere 2018, 9(8), 311; https://doi.org/10.3390/atmos9080311
Submission received: 17 May 2018 / Revised: 3 August 2018 / Accepted: 6 August 2018 / Published: 9 August 2018
(This article belongs to the Special Issue Monsoons)

Abstract

:
A significant declining trend of post-monsoon season precipitation in South Asia is observed between 2000–2014. Two major anthropogenic climate change drivers, aerosols and irrigation, have been steadily increasing during this period. The impacts of their regional and seasonal forcings on the post-monsoon precipitation reduction is investigated in this study through using idealized global climate simulations. The increased post-monsoon aerosol loadings lead to surface cooling downwind of the source areas by reduced surface shortwave flux. The addition of post-monsoon irrigation induces a stronger temperature decrease mainly around the irrigation hotspots by enhanced evaporation. Precipitation over West and North India is reduced post-monsoon by either aerosol or irrigation, which is mainly contributed by the anomalous subsidence. With concurrent forcings, the surface cooling and precipitation decrease are stronger and more extended spatially than the response to the separate forcing, with nonlinear amplification in surface cooling, but nonlinear damping in precipitation reduction. The anomalous vertical motion accelerates the transition of the regional meridional circulation, and hence the earlier withdrawal of the summer monsoon, which is consistent with the observed signals. The current results highlight the importance of including anthropogenic aerosol and irrigation effects in present and future climate simulations over South Asia.

1. Introduction

The characteristics of precipitation in South Asia exhibit strong seasonality (Figure 1a), and in general can be separated into three distinct periods. As shown in Figure 1a, from the observations of the Global Precipitation Climatology Project (GPCP) archives V2.2 [1,2] and the rain gauge station data at New Delhi, the precipitation peaks in the summer monsoon season (June–September), gradually declines in the post-monsoon season (October–December, OND hereafter), then reaches the minimum in the dry season (January–May). The local economy and food security in South Asia heavily rely on agricultural activities, which is closely tied to the seasonality of precipitation.
Between 2000–2014, a significant declining trend in post-monsoon season precipitation has been observed over of the Indian subcontinent, as shown by the ground data at several Indian Meteorological Department weather stations and multiple gridded data sets (Figure 1b–d). The declination is particularly severe in the northwestern part of the Indian subcontinent (Figure 1d), where the OND precipitation has decreased by 88% during 2000–2014 relative to the 1979–2000 climatology. The drying of the post-monsoon season corresponds to an earlier transition from the rain season to the dry season, indicating a change in the local circulation over South Asia. The previous studies have shown that the winter droughts in North India are linked to the Arctic Oscillation (AO) interannual variation and its decadal trend toward negative phases, which producing a local mass flux circulation with the descending branch [3,4]. On the other hand, sea surface temperature (SST) warming in the southern Indian Ocean also enhances subsidence over North India [3,4,5,6]. However, the decade-long trend of OND precipitation reduction can also be related to anthropogenic climate forcing such as land-use change and aerosols, which have not been investigated in detail in previous studies.
As temperature in the post-monsoon season is generally still favorable for crop growth, cultivation practice continues with a heavy dependence on irrigation (Figure 1e). With a significant post-monsoon desiccation trend in western Nepal between the decades of 2001–2010 and 1991–2000, a marked reduction in groundwater storage over the past decade has also been reported [3]. Such a loss of ground water can be attributed to water consumption for irrigation over North India [7], and Irrigation in OND increased by 210 mm∙mon−1 in 2000–2014 according to the estimation by Wisser et al. [8] (Figure 1f). Irrigation is a potential anthropogenic climate forcing. As soil moisture controls both surface energy balance and water balance [9], it has been identified that irrigation has a direct effect on the near-surface climate by local surface energy partitioning [10]. Observation have shown that the atmosphere temperature is typically lower over heavily irrigated regions because of the evaporative cooling effect [11,12]. Model simulations have also demonstrated that irrigation leads to surface cooling and potentially enhanced subsidence [6,13,14,15]. Shukla et al. [16] demonstrated with a global climate model that the India summer monsoon weakened through a decreased land–sea temperature gradient. In addition, model simulations have also revealed that irrigation influences local circulation in other monsoonal regions, including North America [17] and West Africa [18].
The post-monsoon season is also the period with high anthropogenic aerosol emissions in northern India. Aerosol optical depths (AOD) retrieved from Aerosol Robotic Network (AERONET [19]) ground sun photometers shows high AOD between June and December in the annual cycle climatology (Figure 1g). Part of the AOD is contributed by the dust particles transported from the Middle East, which is concentrated mainly in June–August [20]. The aerosols in OND are more likely dominated by anthropogenic components such as sulfate and carbonaceous particles, as indicated by the higher fine mode fraction retrieved by the National Aeronautics and Space Administration (NASA) Moderate Resolution Imaging Spectroradiometer (MODIS) satellite sensors (not shown here) and in the aerosol emission inventory [21].
A significant increasing trend in the post-monsoon season AOD over 2000–2014 in northern India can be found in both the ground-based and satellite-based aerosol optical depth retrievals (Figure 1h). Ramanathan et al. [22] show that black carbon (BC) aerosols can affect the Asia monsoon by making up a significant part of what has been called the atmospheric brown cloud (ABC) over Asia. These absorbing aerosols both absorb and reflect incoming solar radiation, thus heating the low-level troposphere and cooling the surface [23,24,25]. The change of temperature can alter tropospheric stability and land–sea temperature contrast, leading to changes in regional circulation and convection intensity. Increased anthropogenic aerosols have been reported to lead to summer monsoon rainfall that is suppressed over central India, but enhanced in northern India and the slope of the Tibetan Plateau [24,25,26,27,28]. Previous studies have also found that the precipitation pattern of the East Asia summer monsoon is shifted when local anthropogenic aerosol emissions of either sulfate and BC aerosols are increased [29,30]. However, the climate effect of increasing aerosols on post-monsoon rainfall is less explored.
These two major anthropogenic climate drivers, namely, irrigation and aerosols, both peak during the post-monsoon season in the Indian subcontinent, and both have been exhibiting a significant, steady increasing trend between 2000–2014. They can potentially induce the recent decadal declination of the post-monsoon season precipitation over this region, or they can amplify the response to natural climate variability. Their combined climate impact when both factors coexist is also worth exploring, as previous study has found a nonlinear response in the East Asia summer monsoon to coexisting forcings of aerosol and urban land cover with global model simulation [35].
In the present study, we focus only on the regional forcings over South Asia during the post-monsoon season. With a unique experimental design of idealized global climate simulations, the regional precipitation responses to the post-monsoon season aerosols and irrigation forcing separately and combined can be identified and analyzed. The rest of this manuscript is organized as follows. A brief description of the model and experimental design is given in Section 2. The results are discussed in Section 3, including the effect of anthropogenic aerosol and irrigation on the India surface temperature and precipitation. The mechanisms of anthropogenic aerosol and irrigation effect in India precipitation during the post-monsoon season and the nonlinear responses to the concurrent aerosol and irrigation effects are discussed in Section 4. A summary and the conclusion are given in Section 5.

2. Model Description and Experimental Design

The idealized equilibrium climate simulations were carried out using the National Center for Atmospheric Research Community Earth System Model (CESM) v1.0.3. The atmospheric component is Community Atmosphere Model (CAM) version 5.1 [36] with the three-mode modal aerosol scheme (MAM3) [37]. The land component is the Community Land Model (CLM) version 4.0, with explicit representation of land hydrological processes and land–atmosphere interactions [38]. The physics parameterizations in this model are described in the Supplementary Text S1. Figure 1a,f show that CESM can realistically simulate the observed annual cycle of precipitation and AOD over South Asia when driven with present-day sea surface temperature and emission (25-year climatology with F2000 configuration).
The objective of the present study is to identify the potential effects by the regional aerosol and irrigation forcing during the post-monsoon season (OND). Table 1 for the list of all of the simulations conducted for this study. The control simulation is conducted with an emissions database representing the year 1850 and without irrigation. In the three forced experiments, the changes in aerosol and precursor emissions and/or irrigation effects were applied in OND only, and over the South Asia region only (the red box in Figure 2a). The configuration in the rest of the months, and outside the South Asia region is identical as in the control simulation. The amount of the emission increase and irrigation water is realistic according to their pre-industrial to present-day changes, yet the application timing and region are highly restricted. With such an idealized setting, perturbation occurs mostly in the season of our interest. The global climate and annual cycle climatology of the other seasons remain close to the control simulation, allowing us to cleanly identify the regional climate response to the regional forcing.
In the aerosol (AERO) and concurrent (BOTH) simulations, the year 1850 anthropogenic aerosol and precursor emissions are changed to a database from the year 2000 during the post-monsoon season (OND) only within 20–35° N, 70–95° E (the red box in Figure 2a). Details about the aerosol emission data are described in the Supplementary Text S1. The year 1850 and the year 2000 data sets represent the emissions before and after industrial development, respectively. The anthropogenic emissions were greatly enhanced over the Ganges valley in the year 2000, especially in the eastern part.
In the irrigation (IRRI) and BOTH simulations, the irrigation water amount estimated by Wisser et al. [8] over the last decade of the 20th century is imposed to the CLM (Figure 2b). The water is applied to the top layer of soil as effective precipitation, with a quarter of the irrigation water being supplied by an unconfined aquifer. Details about the methodology of irrigation in the simulation are given in the Supplementary Text S1.
All of the simulations were driven by sea surface temperature (SST) and greenhouse gas concentrations representing the year 1850 climatology, with a horizontal resolution of 1.9° × 2.5° and 30 vertical atmospheric levels with the top at 3.26 hPa. The last 25 years of the 30-year simulations were used for analysis. The climate responses owing to aerosol only (ΔA), irrigation only (ΔI), and concurrent effects (ΔAI) are differences in the 25-year average between the forced experiments and the control. By imposing limited forcing repeatedly using prescribed SST climatology, our results here can be interpreted as 25 “ensemble members” of the annual cycle, and the significance test represents the robustness of the responses.

3. Post-Monsoon Season Climate Responses

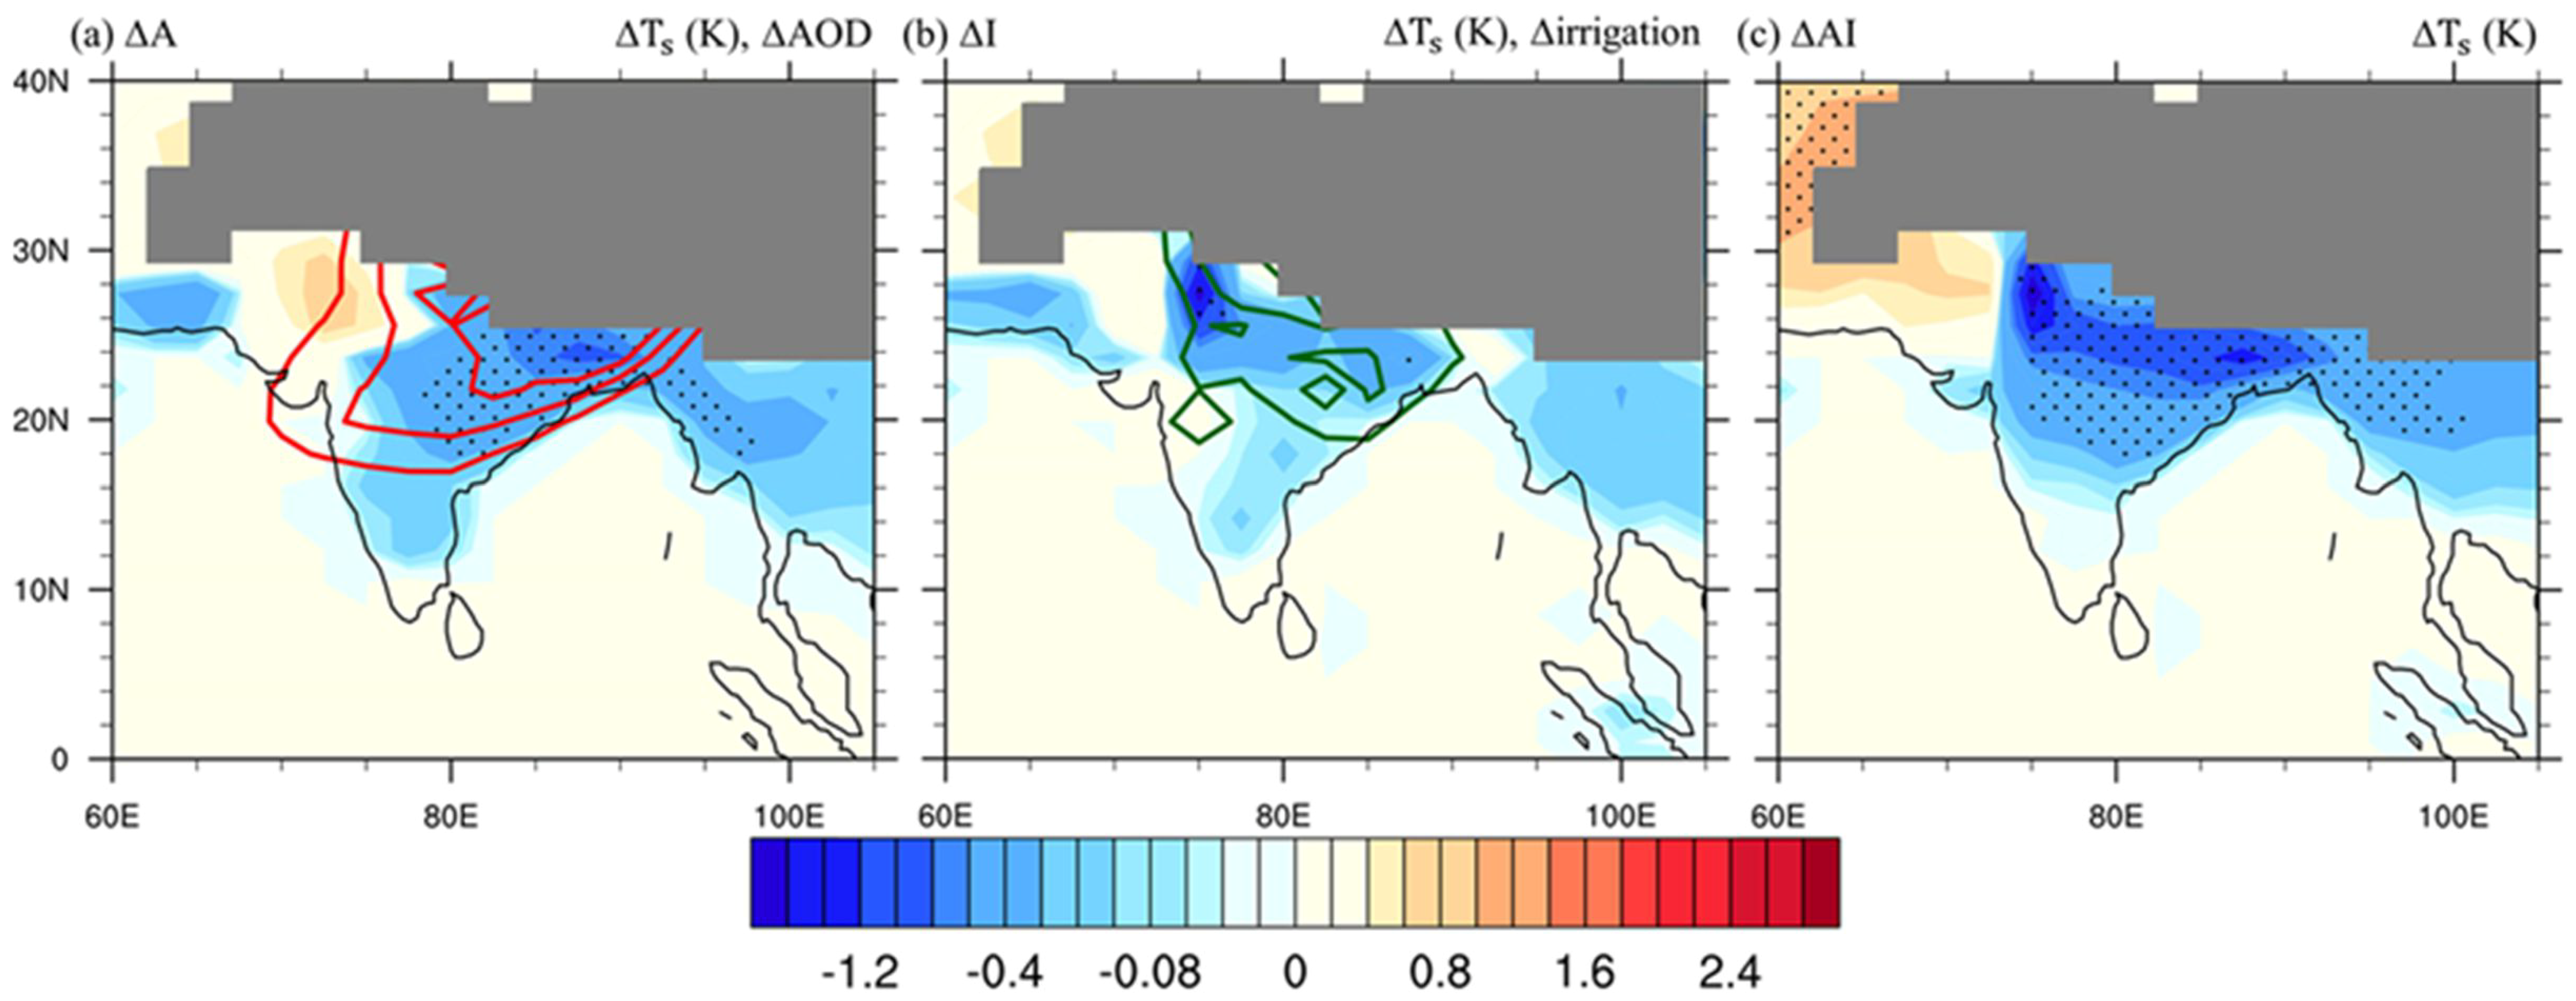
3.1. Surface Temperature Responses

Table 2 summarizes the simulated OND responses in AOD, surface energy fluxes, and surface temperature, which are averaged over the region where the aerosol emission change and/or irrigation was applied in the forced experiments (i.e., the red box in Figure 2, 20–35° N, 70–95° E). The spatial distribution of OND mean surface temperature changes are shown in Figure 3. In ΔA, the increase of AOD is spread out downwind of the maximum over the Indo-Ganges valley by the prevailing northeasterly winds, with an areal average increase of 0.21. Aerosol can influence the radiation budget by absorbing and reflecting solar radiation, and both effects can reduce the shortwave energy received by the surface. The surface energy budget in ΔA is dominated by the surface shortwave flux, which is decreased by 5.98 W∙m−2. As the colder surface emits less longwave radiation, the change in longwave flux is positive. Note that in Table 2, the positive value of flux change represents the surface receiving more (or emitting less) energy. Latent heat and sensible heat fluxes are changed only slightly in ΔA. The net effect is an average surface temperature cooling by 0.31 K, and the cooling is widely distributed over the Indian subcontinent (Figure 3a).
Irrigation change can change the partitioning between surface latent heat and sensible heat fluxes by providing additional soil water for evaporation. The surface energy budget (Table 2) in ΔI is dominated by the enhanced cooling of the latent heat flux (−8.97 W∙m−2), and balanced by an increase in the atmosphere-to-surface sensible heat flux (4.21 W∙m−2), as near-surface air provides more sensible heat to the colder surface. A stronger decrease in average surface temperature by 0.61 K can be found in ΔI as compared to ΔA, but the cooling is mostly concentrated over the irrigation hotspots within the Ganges valley (Figure 2b). The stronger surface longwave and sensible heat flux change is consistent with the stronger surface cooling by the irrigation effects.
In ΔAI, the surface energy budget shows the cooling effect by both the shortwave flux reduction from the aerosols (−8.52 W∙m−2) and the enhanced evaporative cooling of irrigation (−10.1 W∙m−2). The result is a significant surface cooling by 1.12 K on average, which is distributed over the north to central India. The cooling by the concurrent aerosol and irrigation effects is the highest among the three forced experiments, and is also balanced by the strongest response in surface longwave and sensible heat flux changes. We note that the increase in AOD in ΔAI is higher than that in ΔA, indicating a nonlinear response in the concurrent experiment, which will be discussed in Section 4.

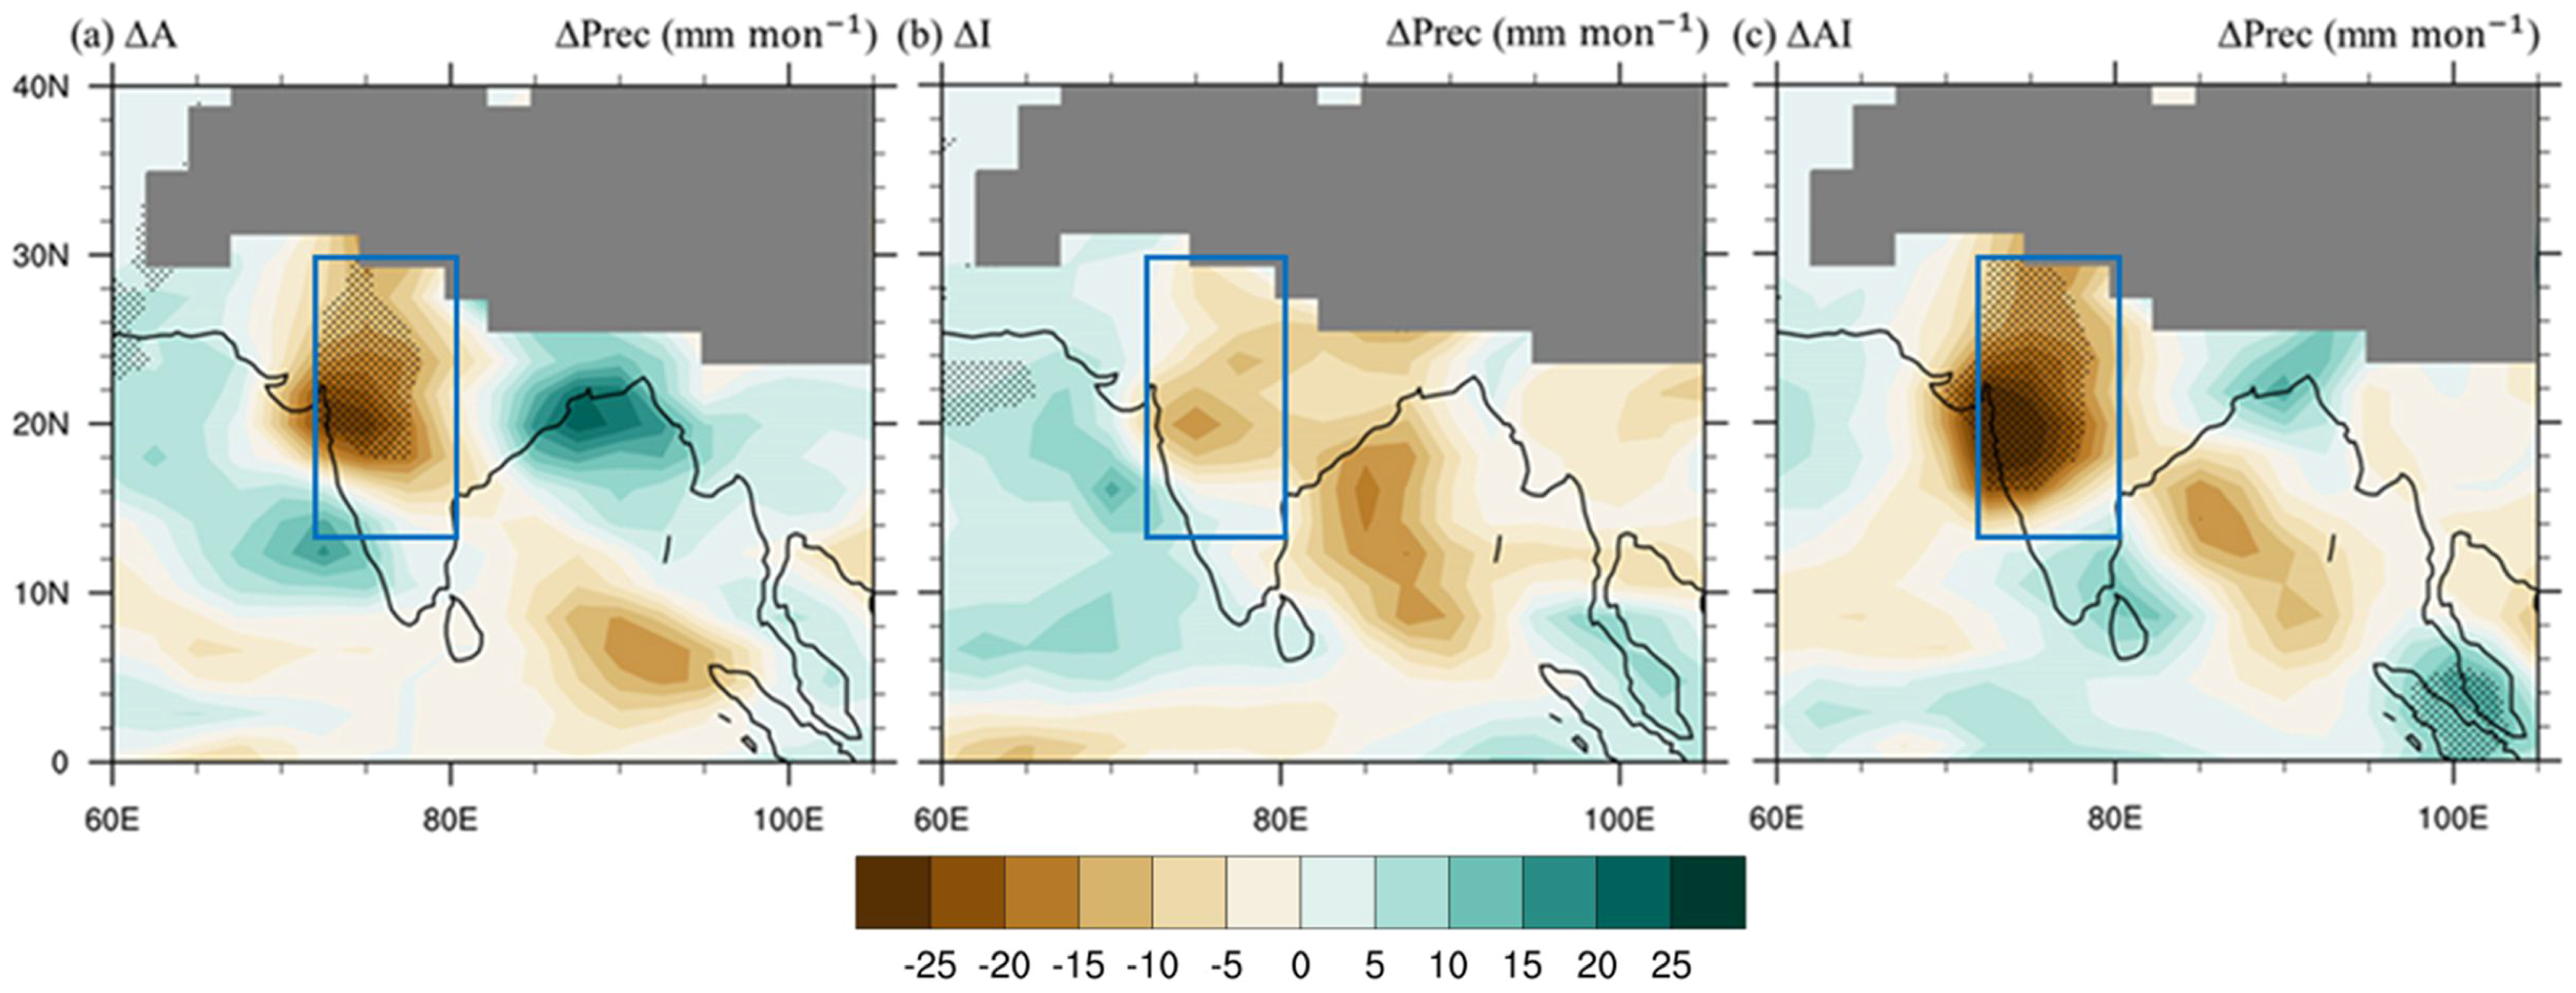
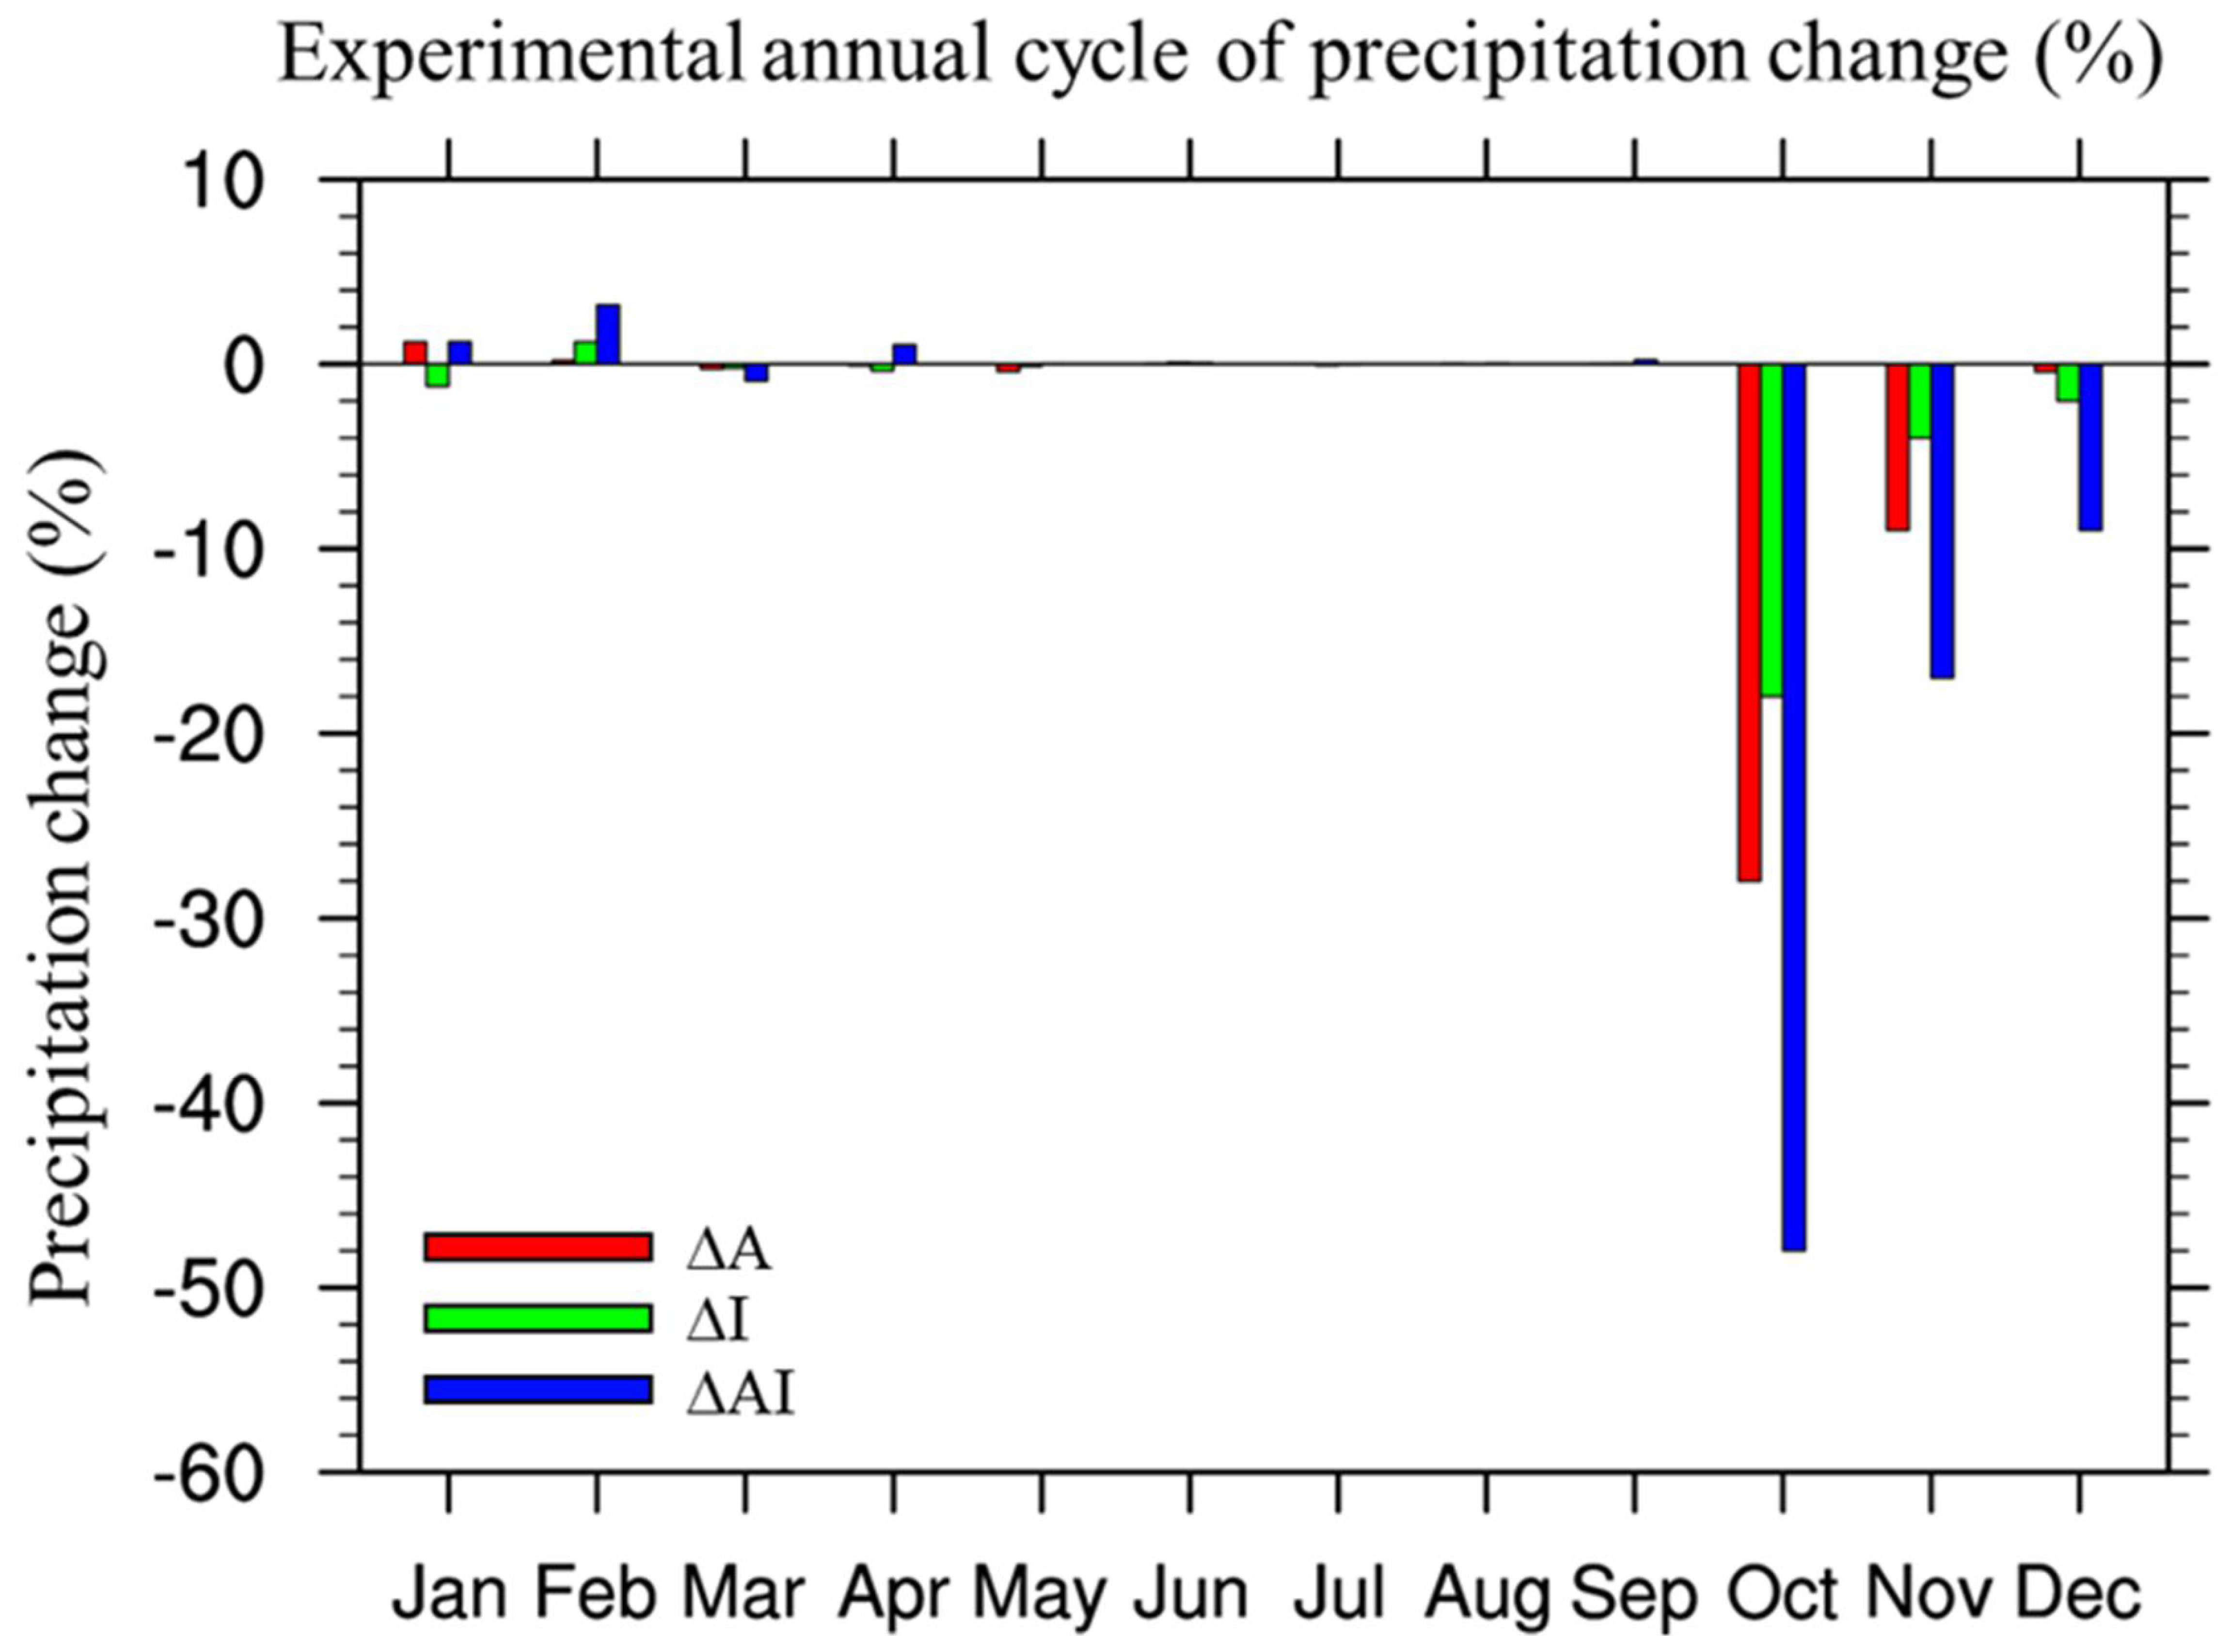
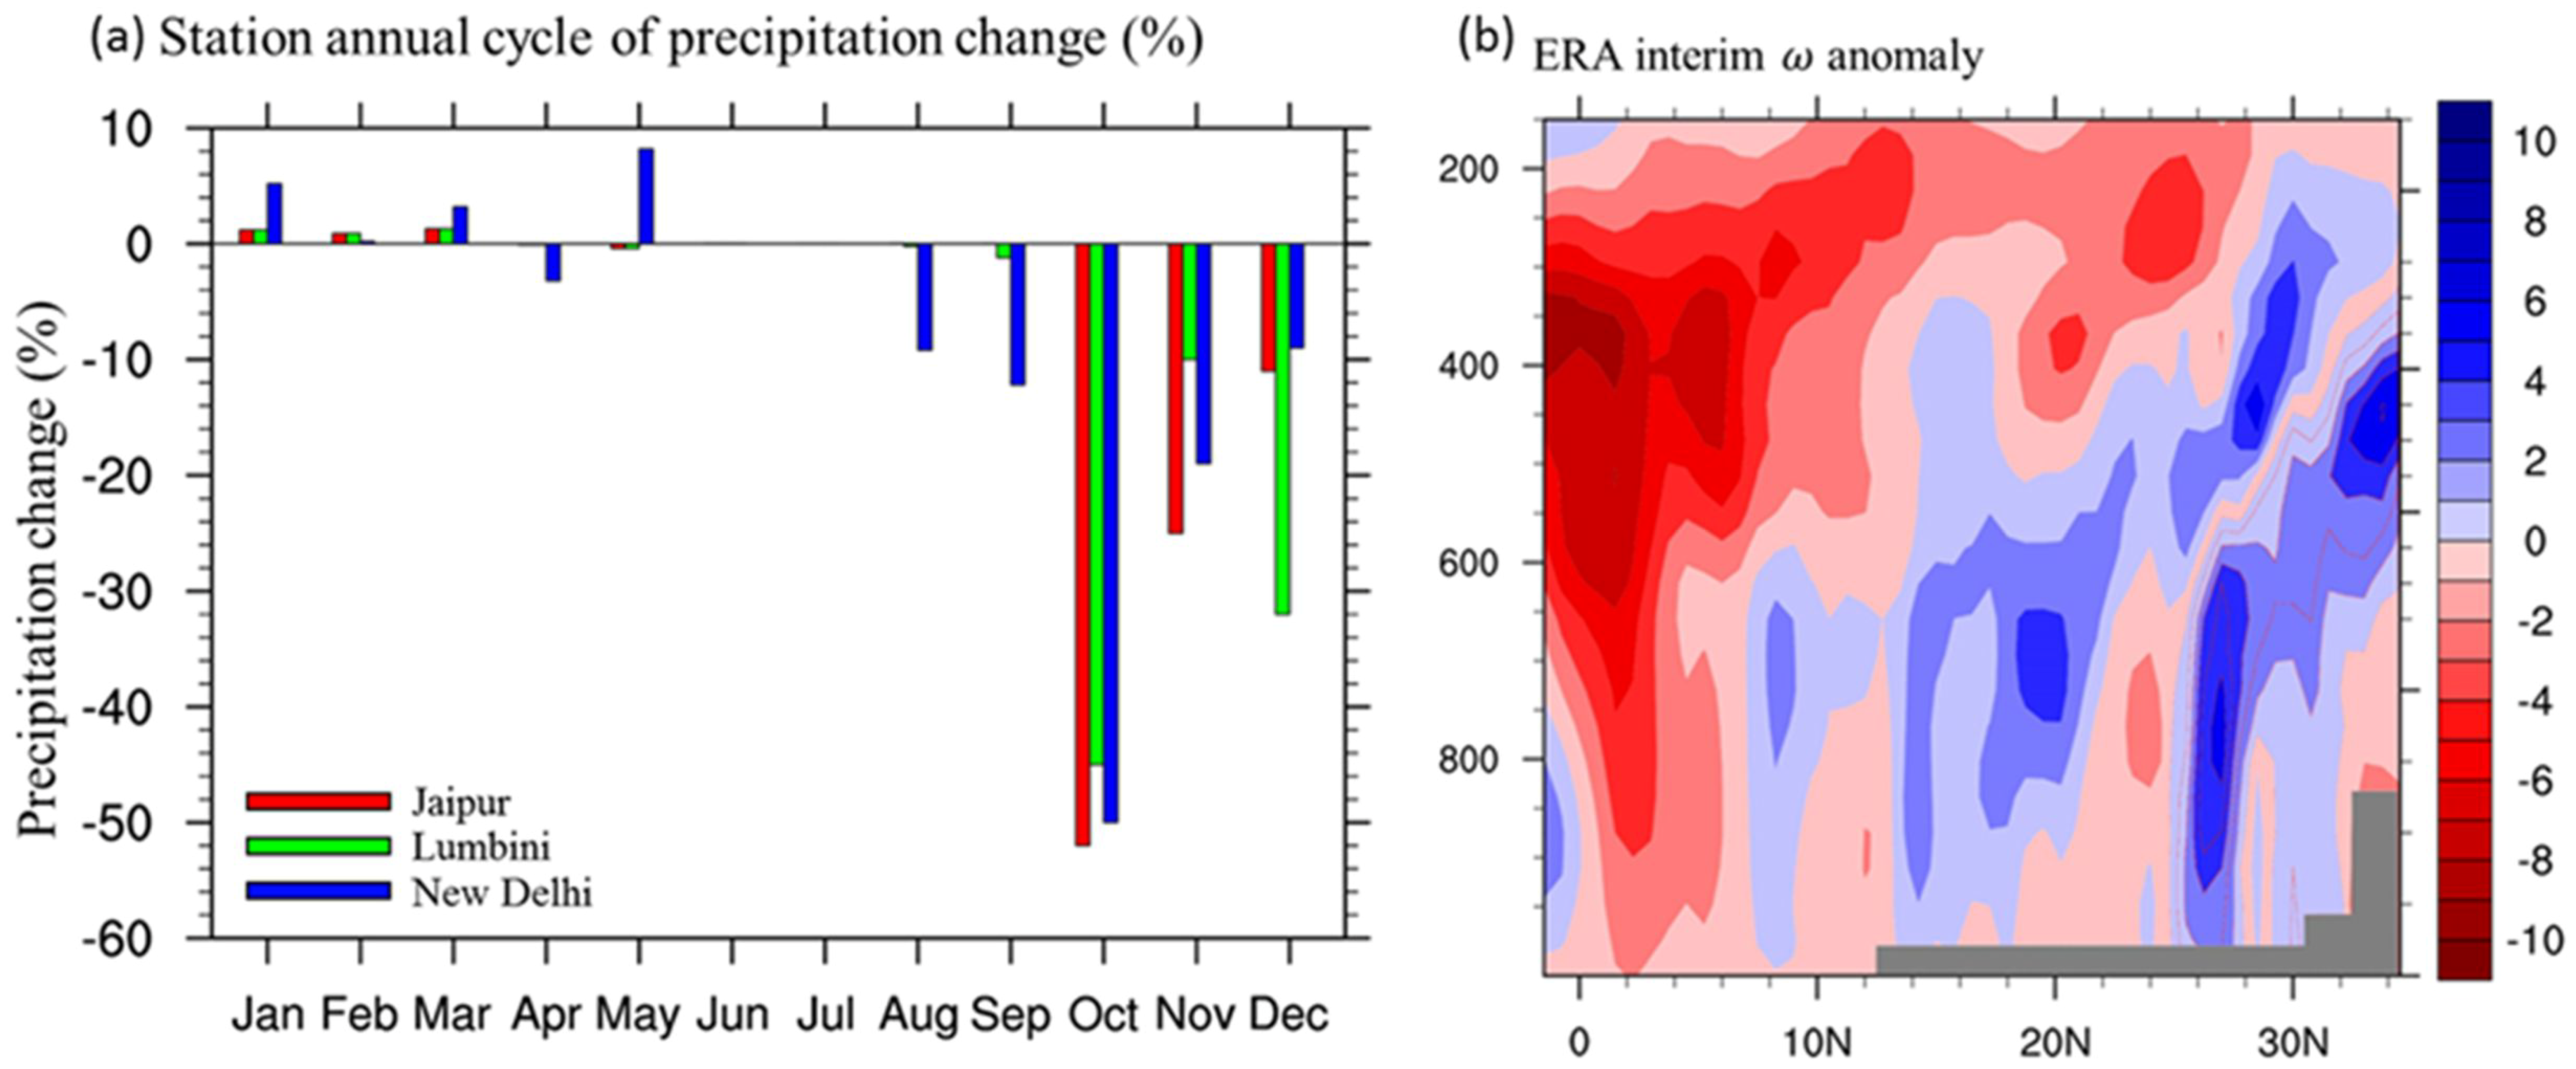
3.2. Precipitation Change and Moisture Budget

Figure 4 shows the spatial distribution of the simulated OND precipitation responses relative to the control. All three forced experiments exhibit precipitation reduction over west and North India. The precipitation reduction is the strongest and most extended with the concurrent forcing, followed by aerosol-only forcing. We note that the spatial pattern of the precipitation response in ΔAI resembles most of the observed OND precipitation changes (Figure 1c), including the concentrated decrease over west and North India, as well the north–south dipole of enhancement over Bangladesh and reduction over the Bay of Bengal. However, the simulated dipole pattern over Bangladesh and the Bay of Bengal is not statistically significant, and therefore will not be discussed in the present study. The areal average of precipitation change is computed over the blue box in Figure 4, where the land precipitation reduction maximizes in all three climate responses, and the results are reported in Table 3. The average precipitation is decreased by 16.32 (52%) mm∙mon−1, 7.66 (24%) mm∙mon−1, and 22.10 (70%) mm∙mon−1 in ΔA, ΔI, and ΔAI, respectively, relative to the control. A moisture budget analysis [39,40,41,42] was carried out to diagnose the simulated precipitation change (see Supplementary Text S2 for details of the methodology, and Figure S1 for the spatial distribution of each term). The averaged changes of each term in the moisture budget equation over west and North India are listed in Table 3. In all three responses, the column-integrated vertical moisture convergence is the dominating term, which can be further separated into the contributions by the altered vertical motion profile ( Δ ω q ¯ p ) and the altered moisture profile ( ω ¯ Δ q p ), respectively, and the former is the highest contributor to the OND precipitation reduction (−10.94 mm∙mon−1, −5.93 mm∙mon−1, and −19.11 mm∙mon−1 in ΔA, ΔI, and ΔAI, respectively). As moisture generally decrease with altitude, it indicates that the precipitation response is mainly modulated by the anomalous subsidence, which will be discussed in Section 4.2. We also note that applying irrigation does provide moisture to the lower atmosphere through evaporation (1.04 mm∙mon−1 and 2.90 mm∙mon−1 in ΔI and ΔAI, respectively), yet the magnitude is much smaller than the reduction by the vertical convergence term, especially the contribution by the vertical motion change.
The precipitation reduction associated with the anomalous subsidence in ΔA is highest among the three responses. Although both aerosol and irrigation induce surface cooling, their impacts on atmospheric temperature are different. The shortwave absorption of aerosols slightly warms up the low-level atmosphere, while irrigation leads to an overall atmospheric cooling. The increase in low level stability is therefore higher in ΔA (not shown here), which is consistent with its higher precipitation reduction associated with the altered vertical motions.

4. Discussion

4.1. Nonlinear Responses to the Concurrent Aerosol and irrigation Effects

The nonlinear effects of concurrent aerosol and irrigation forcings are discussed here on a regional mean basis, by comparing the response of ΔAI to the linear addition of ΔA and ΔI. The results are shown in the last columns of Table 2 and Table 3. If the value of ΔAI − (ΔA + ΔI) of a variable has the same (opposite) sign as ΔAI, there is a nonlinear amplification (damping) by the concurrent forcing. For example, both ΔA and ΔI exhibit average surface cooling over South Asia, and the cooling in ΔAI is stronger than their linear addition by 0.20 K, corresponding to a nonlinear amplification. This is due to the nonlinear amplification of the AOD increase in ΔAI by 0.11. With the irrigation effect, precipitation reduction is stronger in ΔAI than in ΔA, leading to a less wet removal of aerosols. The additional aerosol loading leads to the nonlinearly stronger reduction of surface shortwave flux and surface cooling. For the precipitation reduction over west and North India, the nonlinear damping effect of 1.88 mm mon−1 (6%) is found with a concurrent aerosol and irrigation effect by 6%. Based on the moisture budget analysis, the damping is contributed by surface evaporation (1.87 mm mon−1) and the column-integrated vertical convergence by the altered moisture profile (3.05 mm mon−1). The reduction by altered vertical motion is nonlinear amplified, but the magnitude is smaller than the sum of the former two terms. The enhanced evaporation by the concurrent forcing is contributed by the stronger surface wind speed (not shown), which provides additional water vapor to the atmosphere, mainly in the lower atmosphere; thus, the vertical moisture gradient is also increased.

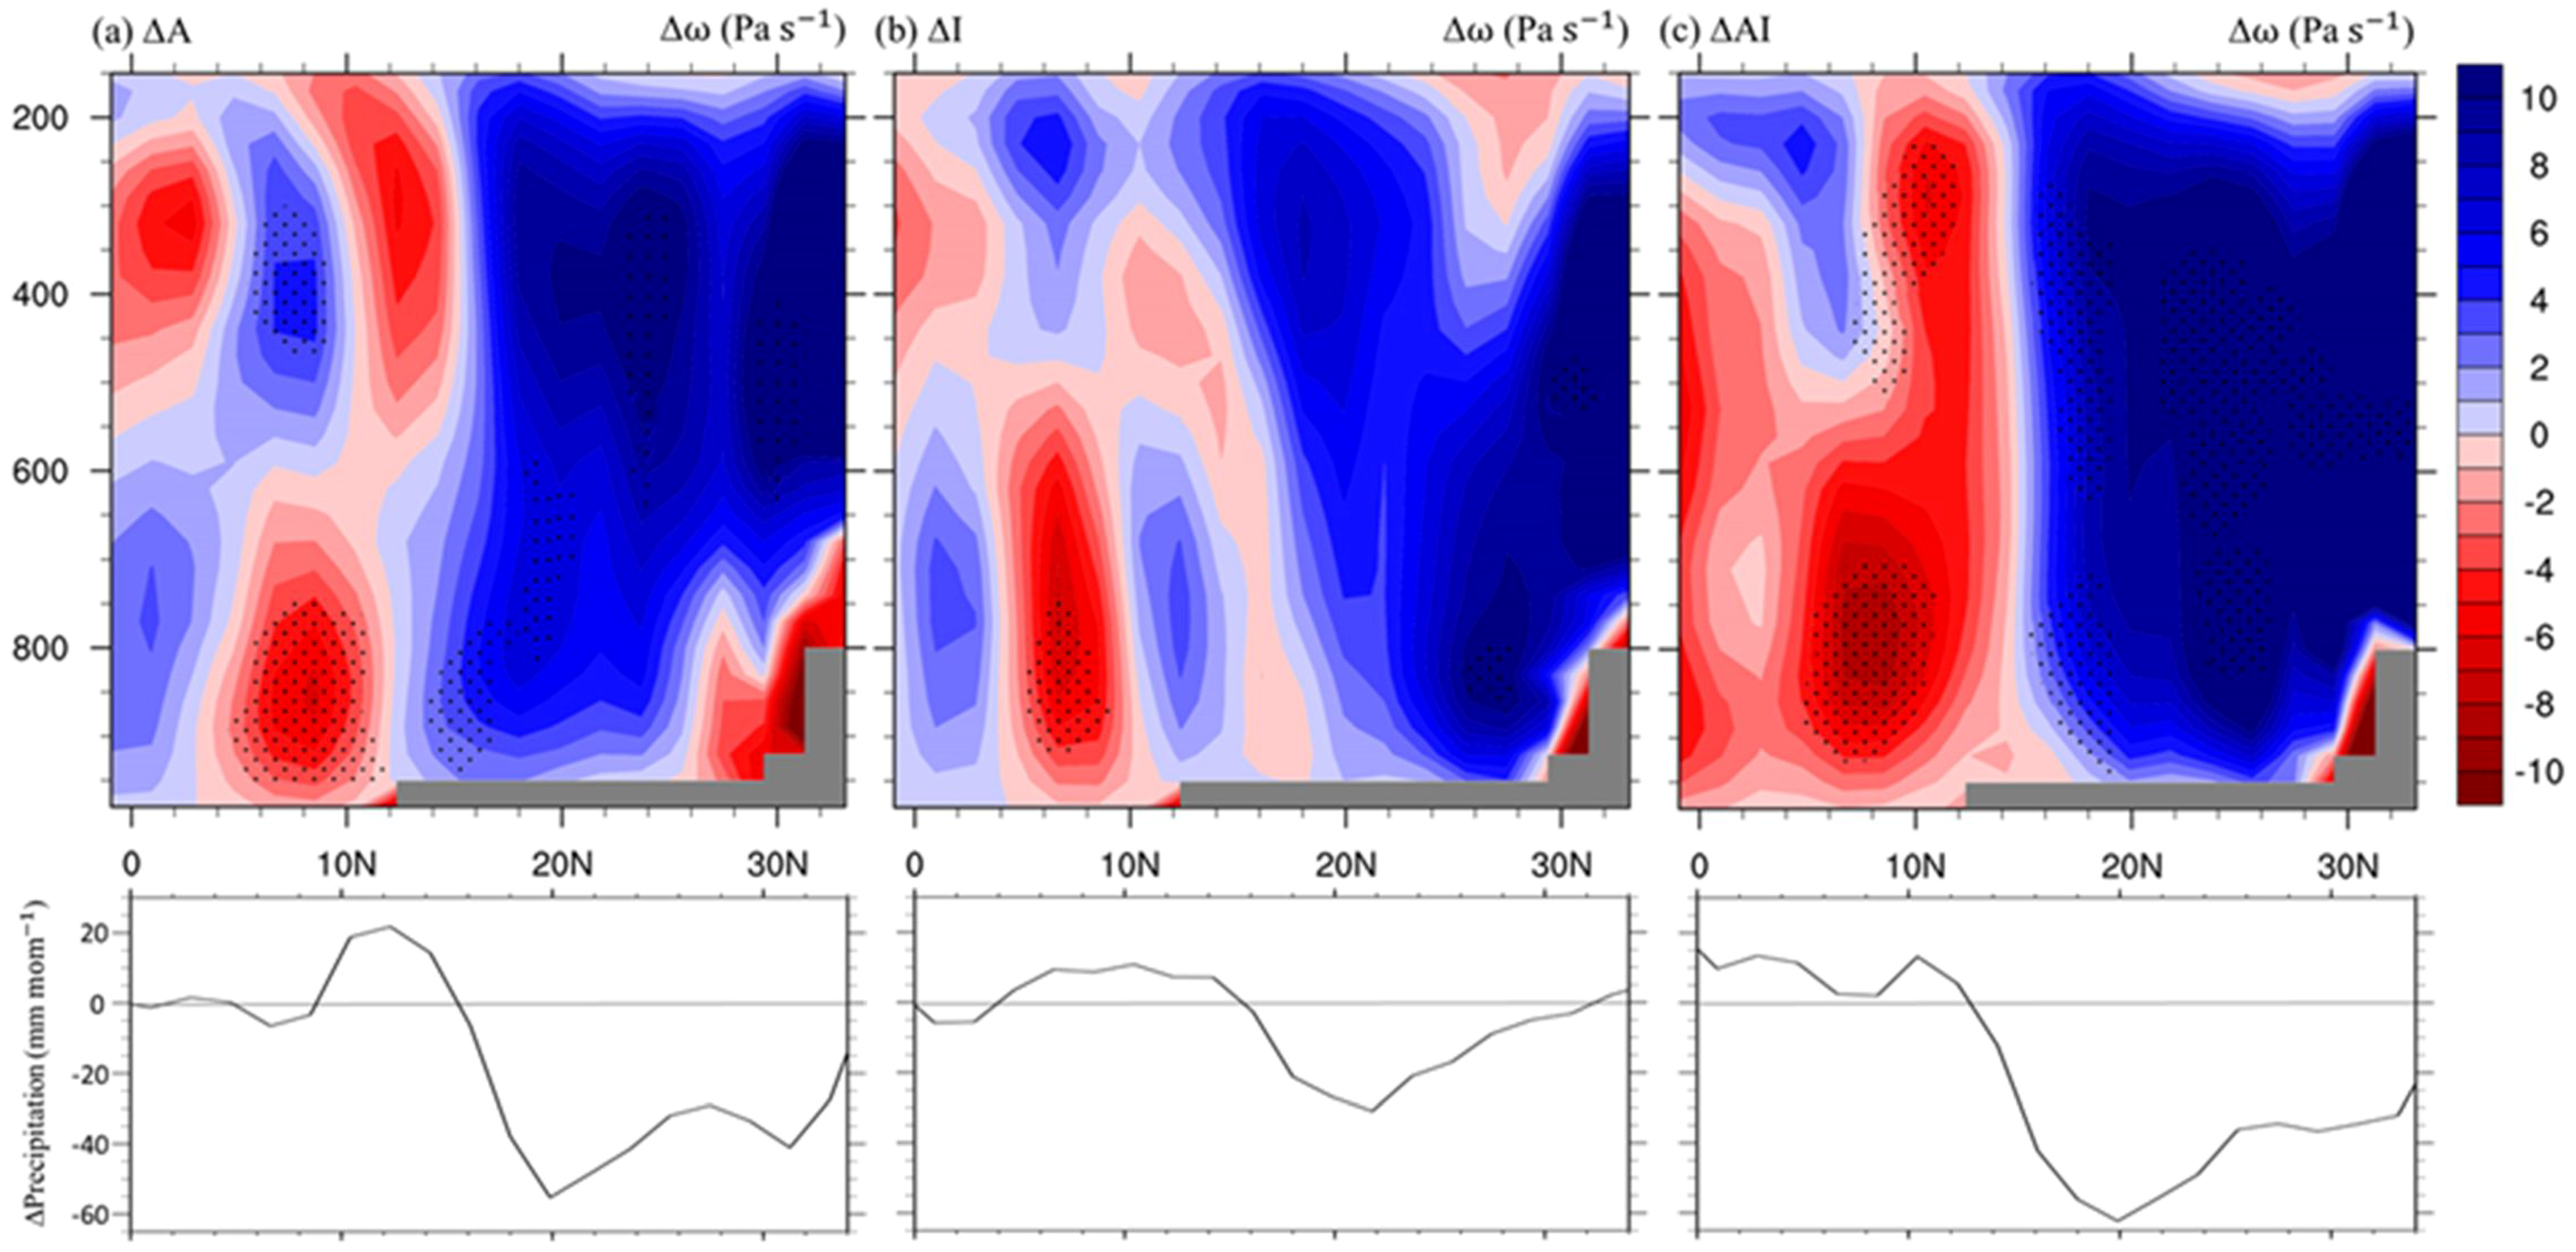
4.2. The Local Meridional Circulation Change and the Earlier Withdrawal of the South Asia Summer Monsoon

When examining the precipitation response month by month (Figure 5), it is found that the simulated precipitation reduction primarily occurs in October in all three forced experiments. Further examination of the monthly changes in vertical motion (not shown here) reveals that the most significant alternation in omega profiles also occurs in October. Figure 6 shows the north–south distribution of the omega profile change and the precipitation change over South Asia, zonally averaged over 70–80° E. In general, the increased aerosol and irrigation and their combined effects all lead to an anomalous descending motion over the Indian subcontinent and an anomalous updraft motion over the Indian Ocean over 5–10° N. In ΔA, anomalous updraft that is associated with the heat pump effect can be found over 25–35° N along the southern slope of the Tibetan Plateau. However, the anomalous upward motion is mostly confined between surface and the 700 hPa level, which is not as deep as in the summer monsoon season, as has been shown in previous studies [24,25]. This may be related to the differences in the prevailing local circulation between the summer monsoon and post-monsoon seasons, and the higher atmospheric stability in the post-monsoon season that traps the aerosols in lower levels. The more widespread anomalous subsidence over land is consistent with the spatially more extended cooling in ΔA, as shown in Section 3.1. In ΔI, the anomalous subsidence at mid-level and low-level atmosphere is stronger to the north of 20° N, which is also consistent with the surface cooling concentrated at the major irrigation area. The upward motion change in ΔAI is the combination of the two responses, with more robust and deeper development in the anomalous subsidence over land and updraft over the tropical Indian Ocean. This anomalous meridional circulation pattern is in phase with the wintertime local Hadley circulation over South Asia, with a descending motion over the cold continent, ascending motion over the warm ocean, and horizontally over the prevailing low-level northeasterly winds.
Consistent signals of precipitation and local circulation changes can be found in the observation and reanalysis data sets (Figure 7) over years 2000–2014. The most significant precipitation decrease is observed in October at the weather stations in northern India, which suggests the earlier withdrawal of the South Asia monsoon. The omega profile change in October in the European Centre for Medium-Range Weather Forecasts Reanalysis Interim (ERA-Int [43]) data set also exhibits a general anomalous downward motion between 2000–2014 over the Indian subcontinent, although the structure is noisier, as various climate variability signals can also play a role here.
It comes as no surprise that the most prominent feature for precipitation decrease appears in October around northern India (Figure 7). The climatological withdraw of the Asian summer monsoon over India takes place from mid-September to mid-October [44,45]. Once the large-scale circulation starts to lose control over the Indian subcontinent, the local anthropological effect becomes rampant, which is partly due to the agriculture pattern and partly, as our model results suggest, due to interaction between anthropogenically-induced circulation and a transition seasonal cycle. It creates a potential “downward spiral”, since the early withdraw of the rainy season leads to the shortening of the length of rainy season, which in turn reduces seasonal rainfall [46]. The shortage of rain facilitates more irrigation activities, and maybe more biomass burning and thus aerosol emissions. This scenario deserves closer investigation.

5. Summary and Conclusions

Observational evidence has identified a decade-long decline in post-monsoon (OND) rainfall over South Asia between 2000–2014. During the same period, the post-monsoon aerosol loadings and irrigation amount over this region have both exhibited strong increasing trends. The present study investigates the potential contribution of these two anthropogenic climate change drivers to the OND precipitation reduction, focusing on the regional forcing from South Asia during the same season. Idealized equilibrium climate simulations with CESM were carried out. The anthropogenic aerosol emissions and irrigation water representing year 2000 were applied over South Asia only in OND in the forced experiments, in order to study the climate responses to their separate and combined effects relative to the control run of the year 1850 without irrigation effects. The surface energy budget and atmospheric moisture budget were analyzed in order to understand the mechanisms that induce changes in surface temperature and precipitation. Nonlinear responses to the coexistence of the two forcings are also investigated.
The increase of anthropogenic aerosols leads to OND surface cooling through the decrease in surface incoming shortwave fluxes. The surface cooling region extends downwind of the major emission source areas to West and North India, as the aerosols are transported by the prevailing winds. The addition of irrigation water leads to stronger surface cooling through the enhanced surface evaporation, which is spatially more focused around the hotspots in North India. The concurrent effects of aerosol and irrigation lead to the strongest and most extended surface cooling, which is contributed by both surface shortwave flux reduction and evaporation enhancement. The cooling is nonlinearly amplified relative to the linear addition of the separate responses, as additional aerosol loadings, owing to less wet removal, cause a further reduction of the surface shortwave flux.
Strong precipitation reduction in OND over West and North India is simulated in all three forced experiments, and the reduction is mainly contributed by the vertical convergence term that is associated with changed vertical motion. The aerosol effect leads to stronger precipitation reduction than irrigation, as the induced anomalous subsidence is more extended to the lower levels and Central and South India. The anomalous upward motion associated with the aerosol heat pump only appears in the southern slope of the Tibetan Plateau below 700 hPa level. The irrigation effect leads to low-level subsidence mainly over North India. Although irrigation provides additional moisture to the lower atmosphere, our results indicate that the precipitation reduction by the changed vertical motion is more dominating. The OND drying is strongest in the concurrent simulation, and the simulated spatial distribution of precipitation change closely resembles the observed pattern. The precipitation declination is nonlinearly damped by 6%, because of additional surface evaporation and moisture profile change.
Previous study have investigated the variability of Indian summer monsoon rainfall [47,48], which is critical for the agricultural activity in the major growing season. Our results indicate that during the post-monsoon season, the anthropogenic aerosols and irrigation can both induce anomalous meridional circulation that is in phase with the wintertime local Hadley circulation over South Asia. The anomalous circulation is most robust when the forcings are combined, with subsidence over the Indian subcontinent and updraft over the tropical Indian Ocean. This anomalous circulation may accelerate the transition of the large-scale circulation to the dry season, which favors the earlier withdrawal of the South Asia summer monsoon, and is consistent with the signals in the observed changes in the precipitation annual cycle between 2000–2014. However, the steadily rising trend of anthropogenic aerosol emissions and irrigation over South Asia is expected to continue in the near future. Moreover, with more frequent drought during the post-monsoon season, the irrigation amount and aerosol emissions may be further increased. This study highlights the necessity of including the anthropogenic aerosol and irrigation forcing when simulating the present and future climate over South Asia.
The aerosol and irrigation forcing from other seasons and other regions can also contribute to the post-monsoon climate change over South Asia by modulating the spatial and temporal pattern of the large-scale circulation. The SST pattern or atmosphere–ocean coupling can also lead to different responses. These effects can be investigated upon future studies and compared to the local forcing effects in the present study, in order to provide a complete explanation for the observed post-monsoon precipitation reduction.

Supplementary Materials

The following are available online at https://www.mdpi.com/2073-4433/9/8/311/s1, Text S1: Configuration of the CESM Simulations, Text S2: The Moisture Budget, Figure S1: Differences in post-monsoon season (OND) moisture budget: (top) ΔA, (center) ΔI, and (bottom) ΔAI.

Author Contributions

Conceptualization, W.-T.C. and M.-H.L.; Data curation, K.-T.H.; Formal analysis, K.-T.H.; Funding acquisition, W.-T.C.; Investigation, W.-T.C. and K.-T.H.; Methodology, W.-T.C. and M.-H.L.; Software, M.-H.L.; Supervision, W.-T.C.; Visualization, K.-T.H.; Writing—original draft, W.-T.C. and K.-T.H.; Writing—review & editing, W.-T.C., M.-H.L. and L.H.L.

Funding

This research was funded by Ministry of Science and Technology (MOST), Taiwan, grant numbers [MOST 107-2119-M-002-024], [MOST-106-2111-M-002-005] and [MOST 106-2111-M-002-010-MY4].

Acknowledgments

The authors thank the Brent Holben, S. N. Tripathi, Philippe Goloub and their staff for establishing and maintaining the six AERONET sites used in this investigation. We thank the NOAA/OAR/ESRL PSD, Boulder, Colorado, USA, for providing the GPCC Precipitation data at https://www.esrl.noaa.gov/psd/. The authors thank the Indian Meteorological Department for maintaining and providing the weather station data. The authors thank Jen-Ping Chen, Chien-Ming Wu, and Yen-Ting Huang in Department of Atmospheric Sciences, National Taiwan University for their insightful comments to the present study.

Conflicts of Interest

The authors declare no conflict of interest. The founding sponsors had no role in the design of the study; in the collection, analyses, or interpretation of data; in the writing of the manuscript, and in the decision to publish the results.

References

  1. Adler, R.F.; Huffman, G.J.; Chang, A.; Ferraro, R.; Xie, P.-P.; Janowiak, J.; Rudolf, B.; Schneider, U.; Curtis, S.; Bolvin, D.; et al. The version-2 global precipitation climatology project (GPCP) monthly precipitation analysis (1979–present). J. Hydrometeorol. 2003, 4, 1147–1167. [Google Scholar] [CrossRef]
  2. Huffman, G.J.; Adler, R.F.; Bolvin, D.T.; Gu, G. Improving the global precipitation record: GPCP version 2.1. Geophys. Res. Lett. 2009, 36. [Google Scholar] [CrossRef]
  3. Wang, S.-Y.; Yoon, J.-H.; Gillies, R.R.; Cho, C. What caused the winter drought in western nepal during recent years? J. Clim. 2013, 26, 8241–8256. [Google Scholar] [CrossRef]
  4. Kar, S.C.; Rana, S. Interannual variability of winter precipitation over northwest India and adjoining region: Impact of global forcings. Theor. Appl. Climatol. 2014, 116, 609–623. [Google Scholar] [CrossRef]
  5. Barlow, M.; Cullen, H.; Lyon, B. Drought in central and southwest Asia: La niña, the warm pool, and Indian Ocean precipitation. J. Clim. 2002, 15, 697–700. [Google Scholar] [CrossRef]
  6. Wey, H.; Lo, M.; Lee, S.; Yu, J.; Hsu, H. Potential impacts of wintertime soil moisture anomalies from agricultural irrigation at low latitudes on regional and global climates. Geophys. Res. Lett. 2015, 42, 8605–8614. [Google Scholar] [CrossRef] [Green Version]
  7. Rodell, M.; Velicogna, I.; Famiglietti, J.S. Satellite-based estimates of groundwater depletion in India. Nature 2009, 460, 999–1002. [Google Scholar] [CrossRef] [PubMed] [Green Version]
  8. Wisser, D.; Frolking, S.; Douglas, E.M.; Fekete, B.M.; Vörösmarty, C.J.; Schumann, A.H. Global irrigation water demand: Variability and uncertainties arising from agricultural and climate data sets. Geophys. Res. Lett. 2008, 35. [Google Scholar] [CrossRef] [Green Version]
  9. Seneviratne, S.I.; Corti, T.; Davin, E.L.; Hirschi, M.; Jaeger, E.B.; Lehner, I.; Orlowsky, B.; Teuling, A.J. Investigating soil moisture–climate interactions in a changing climate: A review. Earth-Sci. Rev. 2010, 99, 125–161. [Google Scholar] [CrossRef]
  10. Douglas, E.M.; Niyogi, D.; Frolking, S.; Yeluripati, J.B.; Pielke, R.A.; Niyogi, N.; Vörösmarty, C.J.; Mohanty, U.C. Changes in moisture and energy fluxes due to agricultural land use and irrigation in the Indian Monsoon Belt. Geophys. Res. Lett. 2006, 33. [Google Scholar] [CrossRef] [Green Version]
  11. Bonfils, C.; Lobell, D. Empirical evidence for a recent slowdown in irrigation-induced cooling. Proc. Natl. Acad. Sci. USA 2007, 104. [Google Scholar] [CrossRef] [PubMed]
  12. Roy, S.S.; Mahmood, R.; Niyogi, D.; Lei, M.; Foster, S.A.; Hubbard, K.G.; Douglas, E.; Pielke, R. Impacts of the agricultural green revolution—Induced land use changes on air temperatures in India. J. Geophys. Res. 2007, 112. [Google Scholar] [CrossRef]
  13. Sacks, W.J.; Cook, B.I.; Buenning, N.; Levis, S.; Helkowski, J.H. Effects of global irrigation on the near-surface climate. Clim. Dyn. 2009, 33, 159–175. [Google Scholar] [CrossRef]
  14. DeAngelis, A.; Dominguez, F.; Fan, Y.; Robock, A.; Kustu, M.D.; Robinson, D. Evidence of enhanced precipitation due to irrigation over the Great Plains of the United States. J. Geophys. Res. 2010, 115. [Google Scholar] [CrossRef] [Green Version]
  15. Puma, M.J.; Cook, B.I. Effects of irrigation on global climate during the 20th century. J. Geophys. Res. 2010, 115. [Google Scholar] [CrossRef] [Green Version]
  16. Shukla, S.P.; Puma, M.J.; Cook, B.I. The response of the South Asian Summer Monsoon circulation to intensified irrigation in global climate model simulations. Clim. Dyn. 2014, 42, 21–36. [Google Scholar] [CrossRef]
  17. Lo, M.-H.; Famiglietti, J.S. Irrigation in California’s Central Valley strengthens the southwestern U.S. water cycle. Geophys. Res. Lett. 2013, 40, 301–306. [Google Scholar] [CrossRef]
  18. Im, E.; Eltahir, E.A.B. Enhancement of rainfall and runoff upstream from irrigation location in a climate model of West Africa. Water Resour. Res. 2014, 50, 8651–8674. [Google Scholar] [CrossRef] [Green Version]
  19. Holben, B.N.; Tanré, D.; Smirnov, A.; Eck, T.F.; Slutsker, I.; Abuhassan, N.; Newcomb, W.W.; Schafer, J.S.; Chatenet, B.; Lavenu, F.; et al. An emerging ground-based aerosol climatology: Aerosol optical depth from AERONET. J. Geophys. Res. 2001, 106, 12067–12097. [Google Scholar] [CrossRef] [Green Version]
  20. Jin, Q.; Wei, J.; Yang, Z. Positive response of Indian summer rainfall to Middle East dust. Geophys. Res. Lett. 2014, 41, 4068–4074. [Google Scholar] [CrossRef]
  21. Lamarque, J.-F.; Bond, T.C.; Eyring, V.; Granier, C.; Heil, A.; Klimont, Z.; Lee, D.; Liousse, C.; Mieville, A.; Owen, B.; et al. Historical (1850–2000) gridded anthropogenic and biomass burning emissions of reactive gases and aerosols: Methodology and application. Atmos. Chem. Phys. 2010, 10, 7017–7039. [Google Scholar] [CrossRef] [Green Version]
  22. Ramanathan, V.; Chung, C.; Kim, D.; Bettge, T.; Buja, L.; Kiehl, J.T.; Washington, W.M.; Fu, Q.; Sikka, D.R.; Wild, M. Atmospheric brown clouds: Impacts on South Asian climate and hydrological cycle. Proc. Natl. Acad. Sci. USA 2005, 102. [Google Scholar] [CrossRef] [PubMed]
  23. Meywerk, J.; Ramanathan, V. Observations of the spectral clear-sky aerosol forcing over the tropical Indian Ocean. J. Geophys. Res. 1999, 104, 24359–24370. [Google Scholar] [CrossRef] [Green Version]
  24. Lau, K.-M.; Kim, K.-M. Observational relationships between aerosol and Asian monsoon rainfall, and circulation. Geophys. Res. Lett. 2006, 33. [Google Scholar] [CrossRef] [Green Version]
  25. Lau, K.M.; Kim, M.K.; Kim, K.M. Asian summer monsoon anomalies induced by aerosol direct forcing: The role of the Tibetan Plateau. Clim. Dyn. 2006, 26, 855–864. [Google Scholar] [CrossRef]
  26. Bollasina, M.A.; Ming, Y.; Ramaswamy, V. Anthropogenic aerosols and the weakening of the South Asian Summer Monsoon. Science 2011, 334, 502–505. [Google Scholar] [CrossRef] [PubMed]
  27. Ganguly, D.; Rasch, P.J.; Wang, H.; Yoon, J. Climate response of the South Asian monsoon system to anthropogenic aerosols. J. Geophys. Res. 2012, 117. [Google Scholar] [CrossRef] [Green Version]
  28. Wang, C.; Kim, D.; Ekman, A.M.L.; Barth, M.C.; Rasch, P.J. Impact of anthropogenic aerosols on Indian summer monsoon. Geophys. Res. Lett. 2009, 36. [Google Scholar] [CrossRef] [Green Version]
  29. Guo, L.; Highwood, E.J.; Shaffrey, L.C.; Turner, A.G. The effect of regional changes in anthropogenic aerosols on rainfall of the East Asian Summer Monsoon. Atmos. Chem. Phys. 2013, 13, 1521–1534. [Google Scholar] [CrossRef]
  30. Chen, J.-P.; Chen, I.-J.; Tsai, I.-C. Dynamic feedback of aerosol effects on the East Asian Summer Monsoon. J. Clim. 2016, 29, 6137–6149. [Google Scholar] [CrossRef]
  31. Schneider, U.; Becker, A.; Finger, P.; Meyer-Christoffer, A.; Rudolf, B.; Ziese, M. GPCC full data reanalysis version 6.0 at 1.0°: Monthly land-surface precipitation from rain-gauges built on GTS-based and historic data. 2011. Available online: https://www.esrl.noaa.gov/psd/data/gridded/data.gpcc.html (accessed on 8 August 2018). [CrossRef]
  32. Xie, P.; Arkin, P.A. Global precipitation: A 17-year monthly analysis based on gauge observations, satellite estimates, and numerical model outputs. Bull. Am. Meteorol. Soc. 1997, 78, 2539–2558. [Google Scholar] [CrossRef]
  33. Huffman, G.J.; Adler, R.F.; Bolvin, D.T.; Nelkin, E.J. The TRMM multi-satellite precipitation analysis (TMPA). In Satellite Rainfall Applications for Surface Hydrology; Gebremichael, M., Hossain, F., Eds.; Springer: Dordrecht, The Netherlands, 2010. [Google Scholar]
  34. Remer, L.A.; Kleidman Richard, G.; Levy Robert, C.; Kaufman Yoram, J.; Didier, T.; Shana, M.; Vanderlei, M.J.; Charles, I.; Ilan, K.; Yu, H.; et al. Global aerosol climatology from the MODIS satellite sensors. J. Geophys. Res. 2008, 113. [Google Scholar] [CrossRef] [Green Version]
  35. Deng, J.; Xu, H. Nonlinear effect on the East Asian summer monsoon due to two coexisting anthropogenic forcing factors in eastern China: An AGCM study. Clim. Dyn. 2016, 46, 3767–3784. [Google Scholar] [CrossRef]
  36. Neale, R.B.; Chen, C.-C.; Gettelman, A.; Lauritzen, P.H.; Park, S.; Williamson, D.L.; Conley, A.J.; Garcia, R.; Kinnison, D.; Lamarque, J.-F.; et al. Description of the NCAR Community Atmosphere Model (CAM 5.0); NCAR Tech. Note NCAR/TN-486+STR. 2012. Available online: http://www.cesm.ucar.edu/models/cesm1.0/cam/docs/description/cam5_desc.pdf (accessed on 8 August 2018).
  37. Liu, X.; Easter, R.C.; Ghan, S.J.; Zaveri, R.; Rasch, P.; Shi, X.; Lamarque, J.-F.; Gettelman, A.; Morrison, H.; Vitt, F.; et al. Toward a minimal representation of aerosols in climate models: description and evaluation in the Community Atmosphere Model CAM5. Geosci. Model Dev. 2012, 5, 709–739. [Google Scholar] [CrossRef]
  38. Henderson-Sellers, A.; Pitman, A.J.; Love, P.K.; Irannejad, P.; Chen, T.H. The project for intercomparison of land surface parameterization schemes (PILPS): Phases 2 and 3*. Bull. Am. Meteorol. Soc. 1995, 76, 489–504. [Google Scholar] [CrossRef]
  39. Lo, M.; Famiglietti, J.S. Precipitation response to land subsurface hydrologic processes in atmospheric general circulation model simulations. J. Geophys. Res. 2011, 116. [Google Scholar] [CrossRef] [Green Version]
  40. Chou, C.; Neelin, J.D. Mechanisms of global warming impacts on regional tropical precipitation. J. Clim. 2004, 17, 2688–2701. [Google Scholar] [CrossRef]
  41. Chou, C.; Neelin, J.D.; Chen, C.-A.; Tu, J.-Y. Evaluating the “rich-get-richer” mechanism in tropical precipitation change under global warming. J. Clim. 2009, 22, 1982–2005. [Google Scholar] [CrossRef]
  42. Chou, C.; Tu, J.-Y.; Tan, P.-H. Asymmetry of tropical precipitation change under global warming. Geophys. Res. Lett. 2007, 34. [Google Scholar] [CrossRef] [Green Version]
  43. Dee, D.P.; Uppala, S.M.; Simmons, A.J.; Berrisford, P.; Poli, P.; Kobayashi, S.; Andrae, U.; Balmaseda, M.A.; Balsamo, G.; Bauer, P.; et al. The ERA-Interim reanalysis: Configuration and performance of the data assimilation system. Q. J. R. Meteorol. Soc. 2011, 137, 553–597. [Google Scholar] [CrossRef]
  44. Wang, B. LinHo rainy season of the Asian–Pacific summer monsoon. J. Clim. 2002, 15, 386–398. [Google Scholar] [CrossRef]
  45. Goswami, B.N.; Xavier, P.K. ENSO control on the south Asian monsoon through the length of the rainy season. Geophys. Res. Lett. 2005, 32. [Google Scholar] [CrossRef] [Green Version]
  46. Sabeerali, C.T.; Rao, S.A.; Ajayamohan, R.S.; Murtugudde, R. On the relationship between Indian summer monsoon withdrawal and Indo-Pacific SST anomalies before and after 1976/1977 climate shift. Clim. Dyn. 2012, 39, 841–859. [Google Scholar] [CrossRef]
  47. Li, J.; Wang, B. How predictable is the anomaly pattern of the Indian summer rainfall? Clim. Dyn. 2016, 46, 2847–2861. [Google Scholar] [CrossRef]
  48. Li, J.; Wang, B.; Yang, Y.-M. Retrospective seasonal prediction of summer monsoon rainfall over West Central and Peninsular India in the past 142 years. Clim. Dyn. 2017, 48, 2581–2596. [Google Scholar] [CrossRef]
Figure 1. (a) Precipitation annual cycle climatology over the South Asia from satellite-based observations (Global Precipitation Climatology Project (GPCP) V2.2, purple line averaged over 20–35° N, 70–95° E, 1979–2014), ground weather station at New Delhi (brown line, 1960–1974), and in the 25-year National Center for Atmospheric Research Community Earth System Model (CESM) F2000 present-day climate simulations (red line). (b) Time series of October–December (OND) mean precipitation observed at three Indian weather stations (solid line for New Delhi, dotted line for Jaipur, dashed line for Lumbini). (c) Time series of OND mean precipitation over South Asia (20–35° N, 70–95° E) from three gridded observational data sets: Global Precipitation Climatology Centre (GPCC V6 [31], solid line), Climate Prediction Center (CPC) Merged Analysis of Precipitation (CMAP [32], dotted line) and The Tropical Rainfall Measuring Mission (TRMM 3B43 V7 [33], dashed line). (d) Observed OND precipitation percentage change (%) from GPCP averaged over 2000–2014 relative to the 1979–2000 climatology. Regions with altitude higher than 3000 m are masked out by gray shading. (e) The annual cycle climatology of estimated irrigation water and (f) time series of OND mean estimated irrigation water by Wisser et al. [8] for 1990–2014. (g) Aerosol optical depth (AOD) annual cycle climatology retrieved at six Aerosol Robotic Network (AERONET V3 [19]) ground stations at South Asia (dashed lines, Gandhi College, Lumbini, Mobile_S_011509_ND, Kanpur, New Delhi, and Bareilly; 1980–2014) and in the 25-year CESM F2000 present-day climate simulations (red solid line). (h) Time series of OND mean AOD retrieved from Moderate Resolution Imaging Spectroradiometer (MODIS) onboard the Terra satellite (collection 5 L3 retrievals [34], black line, averaged over 20–35° N, 70–95° E), and at six AERONET stations in South Asia (red lines).
Atmosphere 09 00311 g001
Figure 2. The distribution of anthropogenic climate change drivers imposed over South Asia (20–35° N, 70–95° E) in the forced experiments: (a) aerosol emission, (b) irrigation water. Regions with altitudes higher than 3000 m are masked out by gray shading.
Atmosphere 09 00311 g002
Figure 3. The OND surface temperature differences (°C) in (a) ΔA, (b) ΔI, and (c) ΔAI. Stippling indicates regions where the changes are statistically significant at the 95% confidence levels. Regions with altitudes higher than 3000 m are masked out by gray shading. The red contour shows the increase of AOD (contour levels at 0.04, 0.06, and 0.08), and green contours show the addition of irrigation water (contour levels at 20 mm∙mon−1, 80 mm∙mon−1).
Atmosphere 09 00311 g003
Figure 4. The OND total precipitation differences (mm mon−1) in (a) ΔA, (b) ΔI, and (c) ΔAI. Stippling indicates regions where the changes are statistically significant at the 95% confidence levels. Regions with altitude higher than 3000 m are masked out by gray shading.
Atmosphere 09 00311 g004
Figure 5. The percentage change of monthly mean precipitation averaged over the blue box in Figure 4 (13–30° N, 70–80° E).
Atmosphere 09 00311 g005
Figure 6. The north–south distribution of October (top) omega profile change (Pa s−1), and (bottom) precipitation change in (a) ΔA, (b) ΔI, and (c) ΔAI, zonally averaged over 70–80° E. Stippling indicates regions where the changes are statistically significant at the 95% confidence levels.
Atmosphere 09 00311 g006
Figure 7. (a) Observed changes in monthly mean precipitation annual cycle (%) from ground station data at Jaipur, Lumbini, and New Delhi, and (b) changes in the October mean omega (P s−1) in the data from the European Centre for Medium-Range Weather Forecasts Reanalysis Interim (ERA-Int), zonally averaged over 70–80° E. The changes are the differences between the 2000–2014 average relative to the 1970–2000 climatology.
Atmosphere 09 00311 g007
Table 1. Experimental design. AERO: aerosol, BOTH: concurrent, IRRI: irrigation.
SimulationsAerosol and Precursor EmissionsIrrigationClimate Responses
ControlYear 1850No
AEROYear 2000NoΔA = AERO–Control
IRRIYear 1850YesΔI = IRRI–Control
BOTHYear 2000YesΔAI = BOTH–Control
Table 2. Responses in post-monsoon season surface energy fluxes and surface temperature over South Asia relative to the control simulation i.
VariablesΔAΔIΔAIΔAI − (ΔA + ΔI) ii
Aerosol optical depth0.210.000.320.11 *
Shortwave flux (W m−2)−5.98−0.01−8.52−2.53 *
Longwave flux (W m−2)1.072.883.03−0.92
Latent heat flux (W m−2)0.02−8.97−10.1−1.15 *
Sensible heat flux (W m2)0.114.215.411.09 *
Surface temperature (K)−0.31−0.61−1.12−0.20 *
i Values are averaged over the Indo-Gangetic plain (20–35° N, 70–95° E, the red box in Figure 2 over flat land only). Bold faced numbers represents changes that are statistically significant at 95% confidence levels. Positive (negative) values of the surface flux correspond to surface gaining (losing) energy; ii The * symbols mark nonlinear amplification by concurrent aerosol and irrigation forcings.
Table 3. OND mean changes in column-integrated moisture budget over west and North India relative to the control simulation i.
VariablesΔAΔIΔAIΔAI − (ΔA + ΔI) ii
Total precipitation, ΔP−16.32
(−52%)
−7.66
(−24%)
−22.10
(−70%)
1.88
(+6%)
Vertical moisture convergence by changed vertical motion, Δ ω q ¯ p −10.94−5.93−19.11−2.24 *
Vertical moisture convergence by changed moisture profile, ω ¯ Δ q p −6.45−2.79−6.193.05
Horizontal moisture convergence, Δ V · q 1.050.020.30−0.77
Evaporation, ΔET−0.011.042.901.87 *
i Values are averaged over the blue box in Figure 4 (13–30° N, 70–80° E), with the unit in mm mon−1. Detail of the moisture budget is provided in Supplementary Text S2. Bold-faced numbers represent changes that are statistically significant at 95% confidence levels; ii The * symbols mark nonlinear amplification by concurrent aerosol and irrigation forcings.

