
Temporal Variability and Characterization of Aerosols across the Pakistan Region during the Winter Fog Periods


Abstract
:
1. Introduction
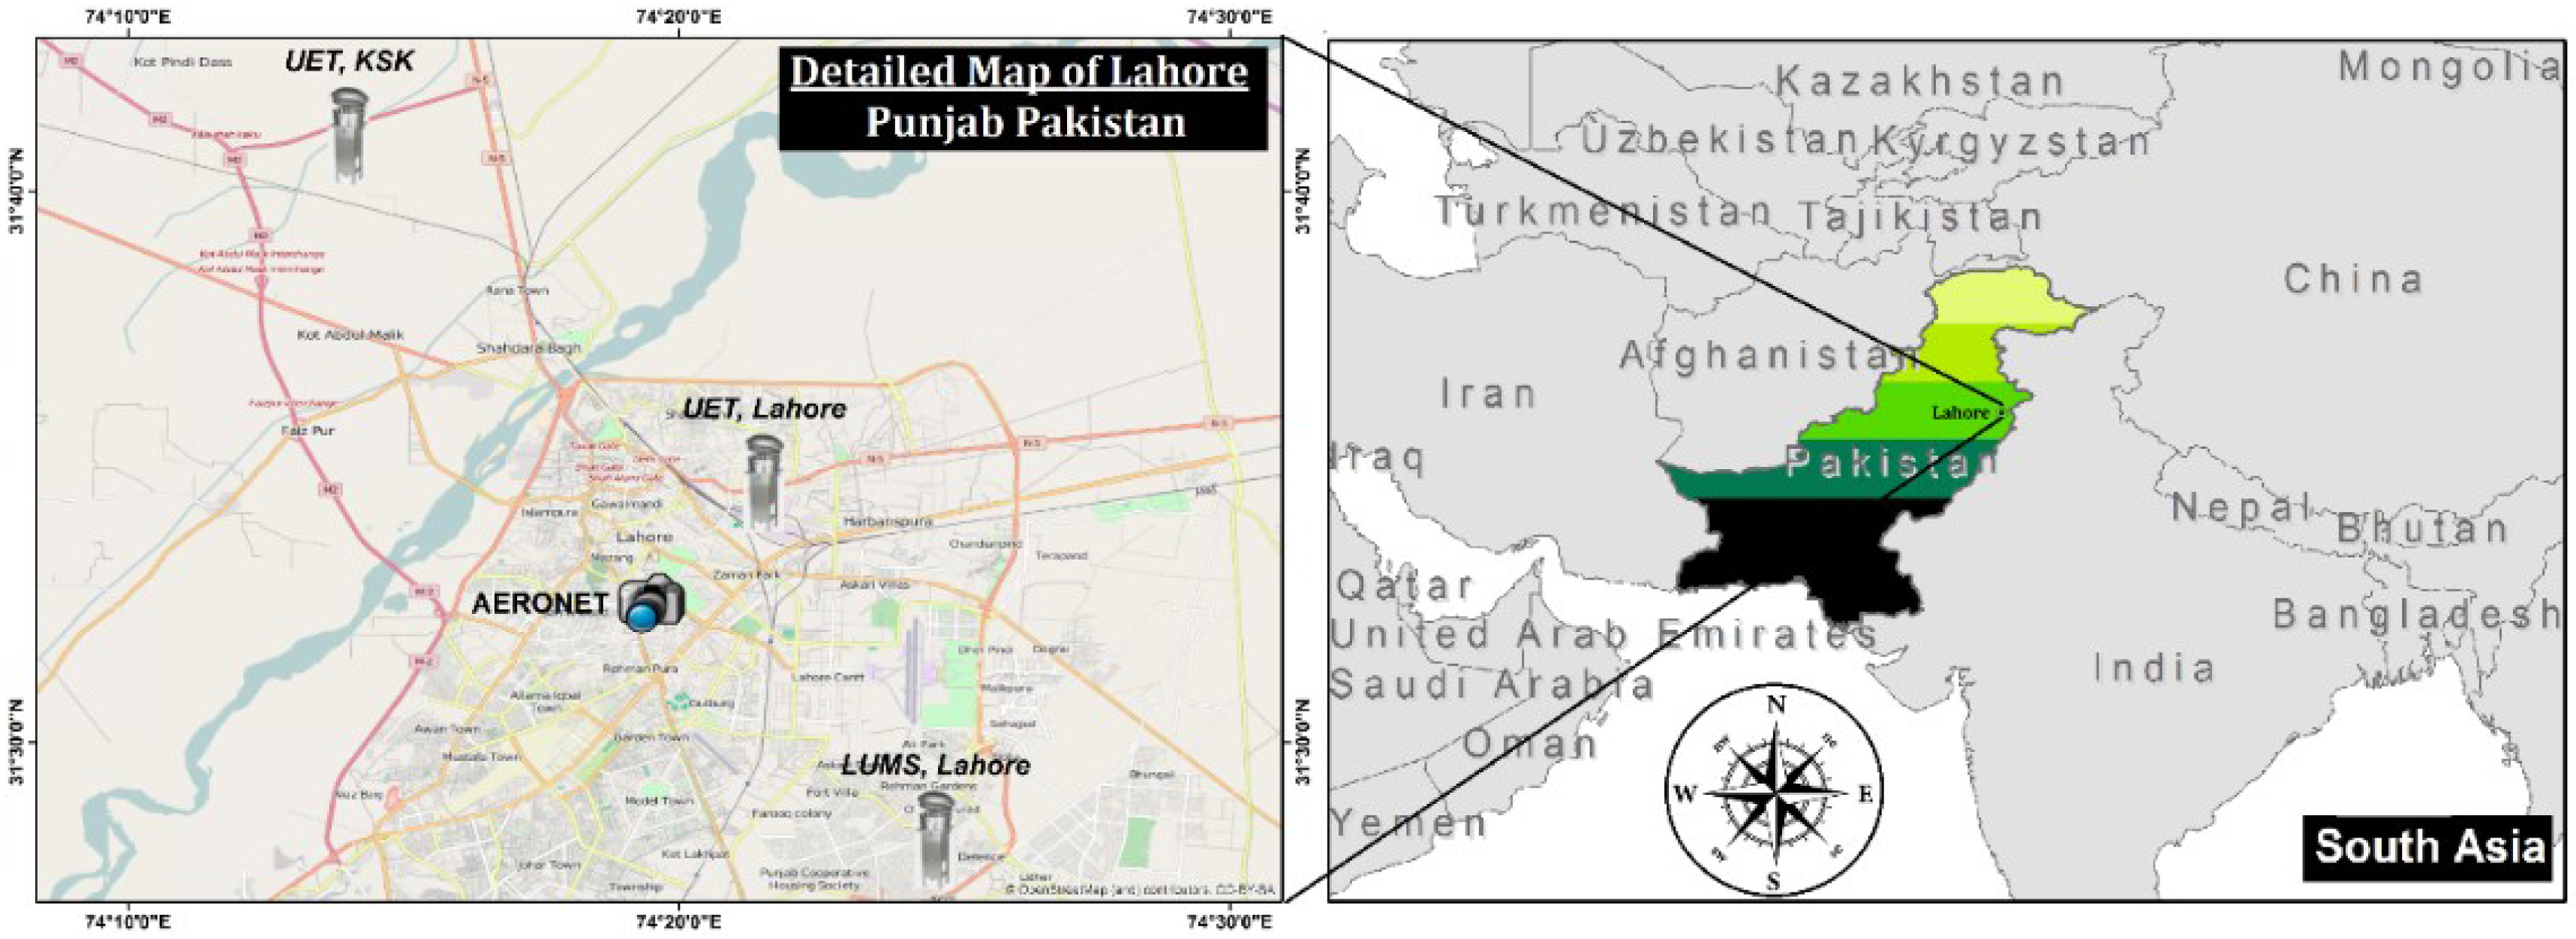
Study Area
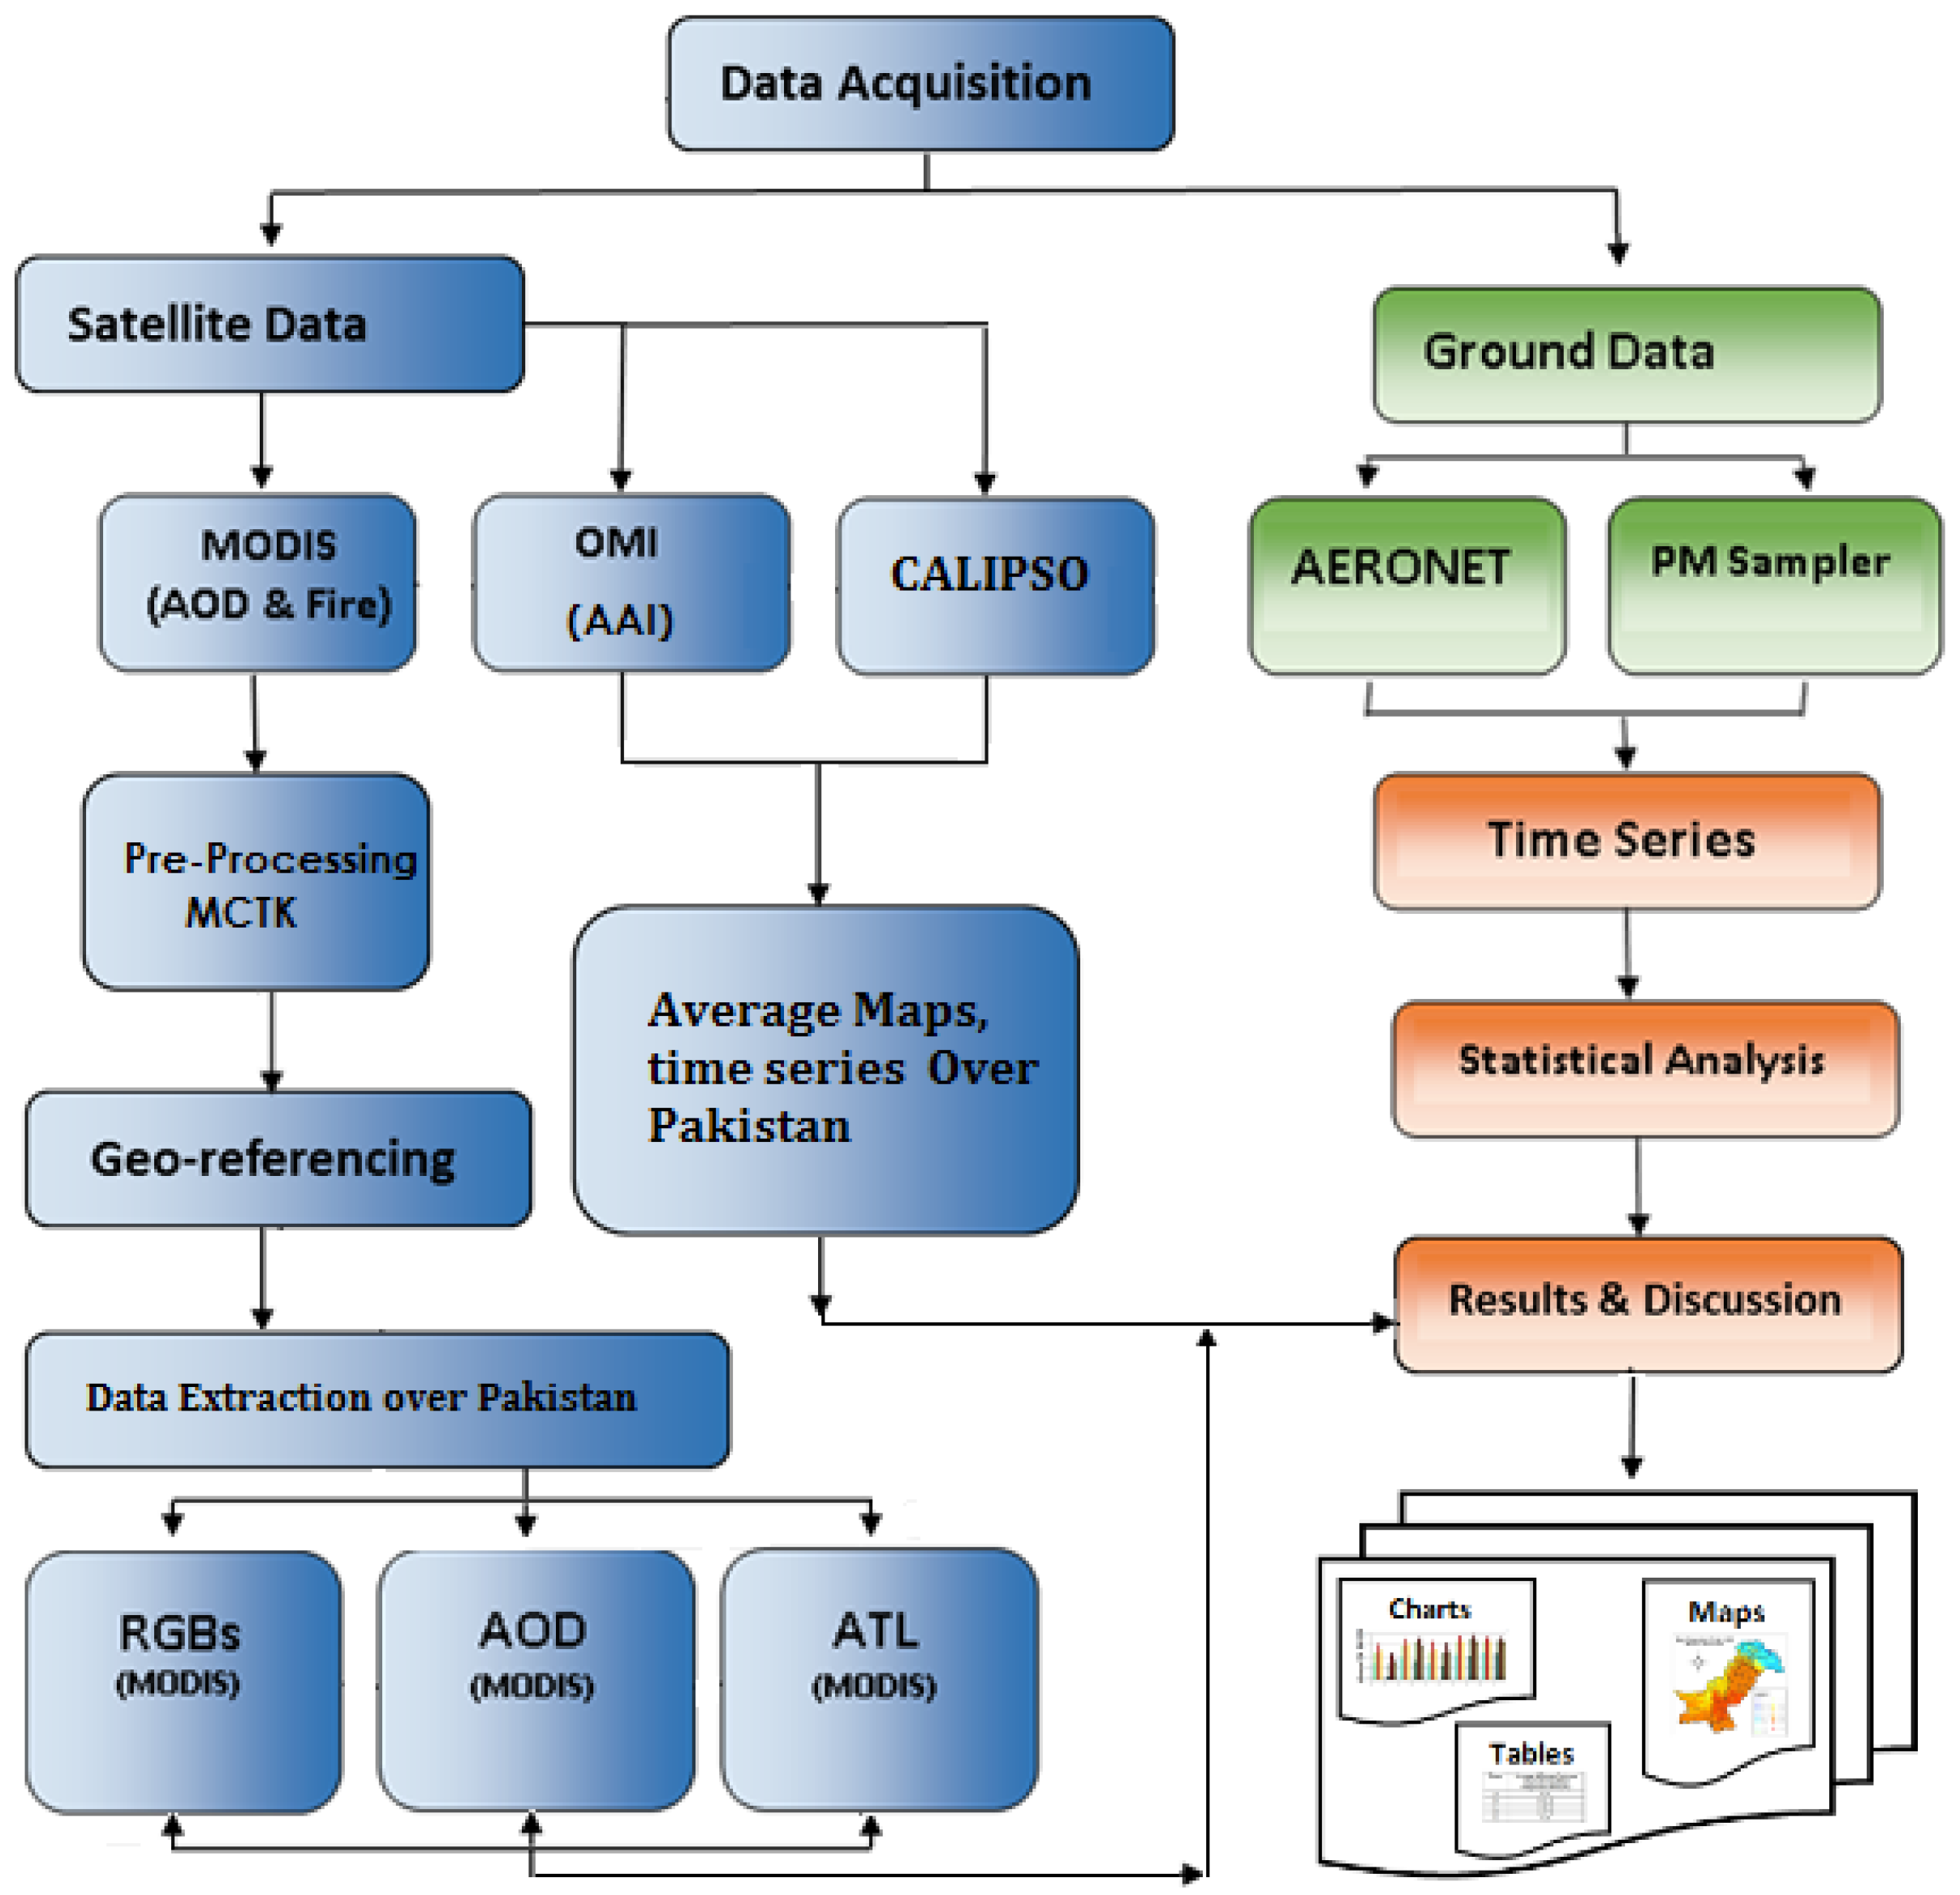
2. Materials and Methods
- Lahore University of Management Sciences (LUMS), Lahore, Pakistan.
- University of Engineering and Technology (UET), Lahore campus, Pakistan.
- University of engineering and Technology (UET), Kala Shah Khaku campus, Pakistan.
3. Results and Discussion
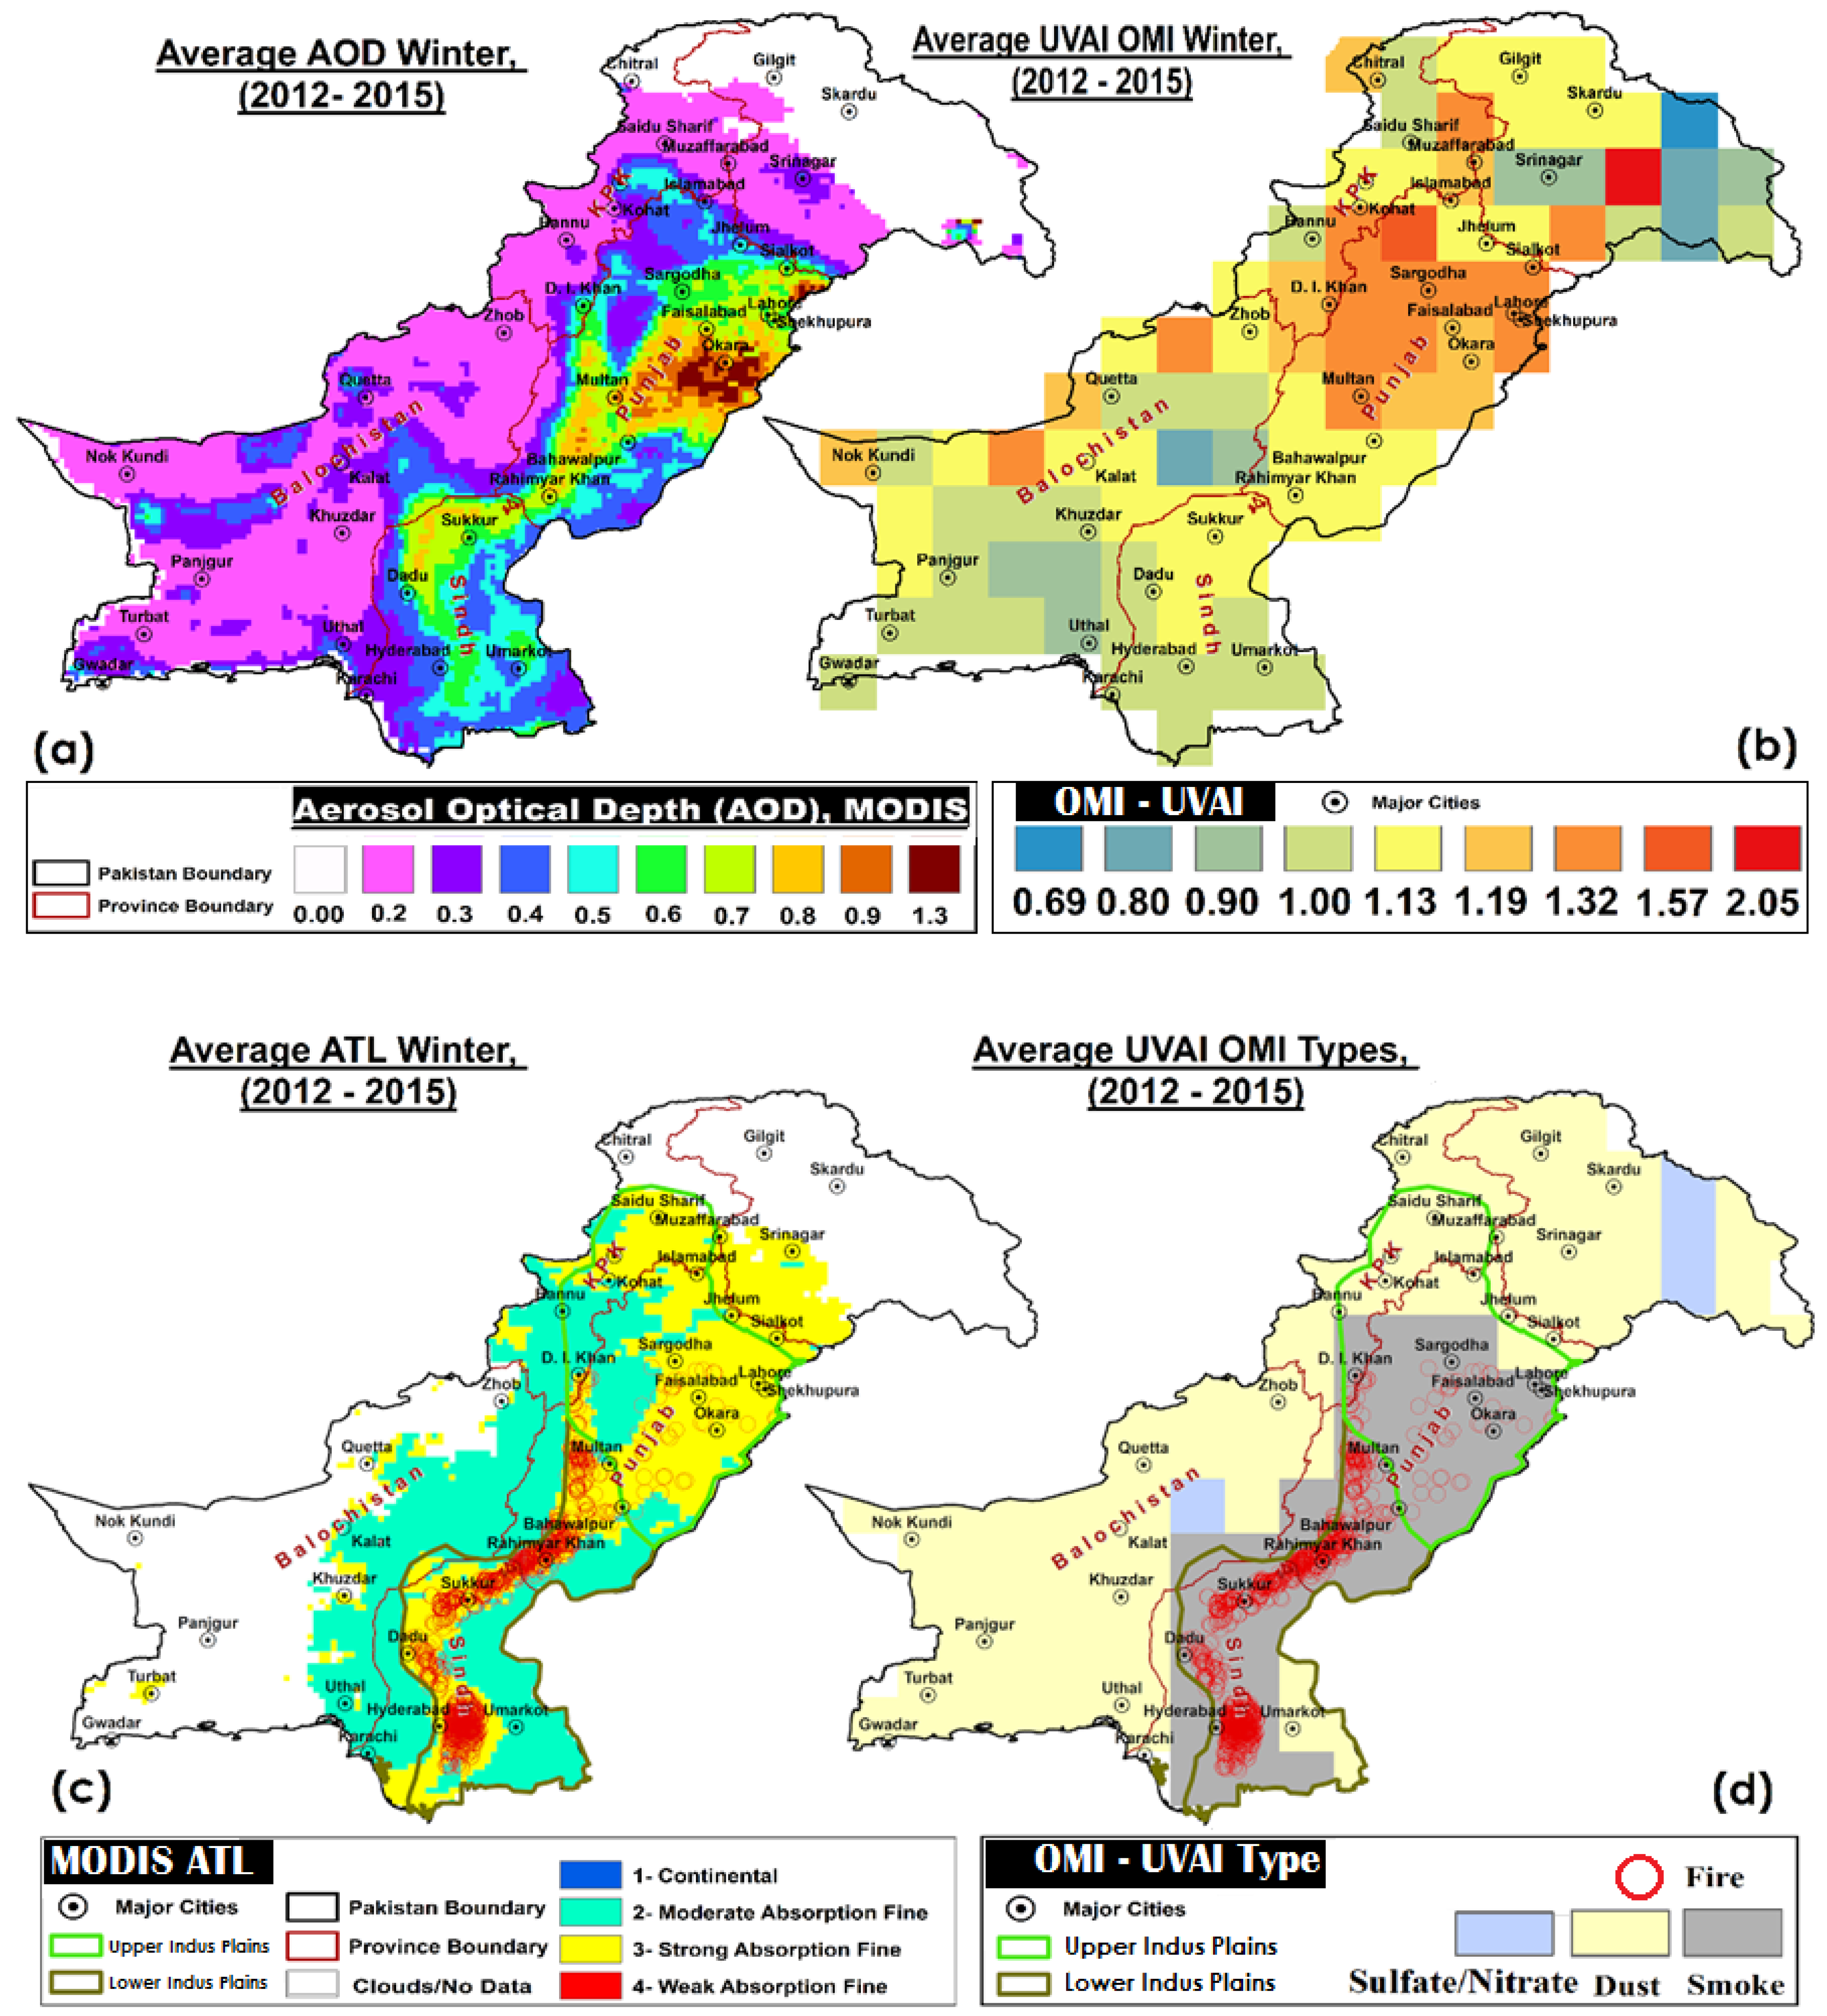
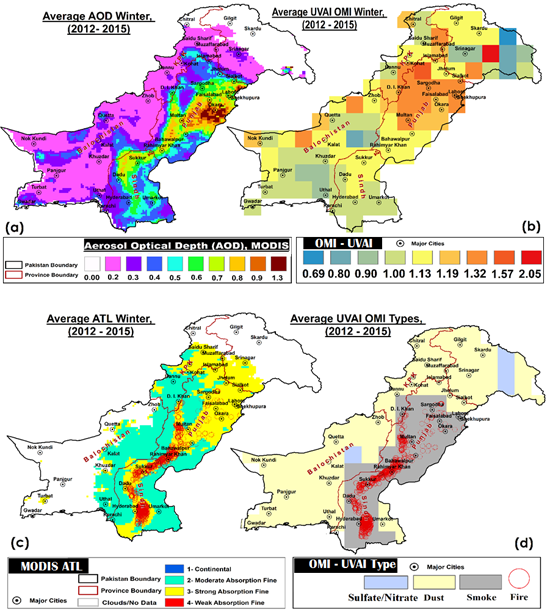
3.1. Major Sources of Aerosols
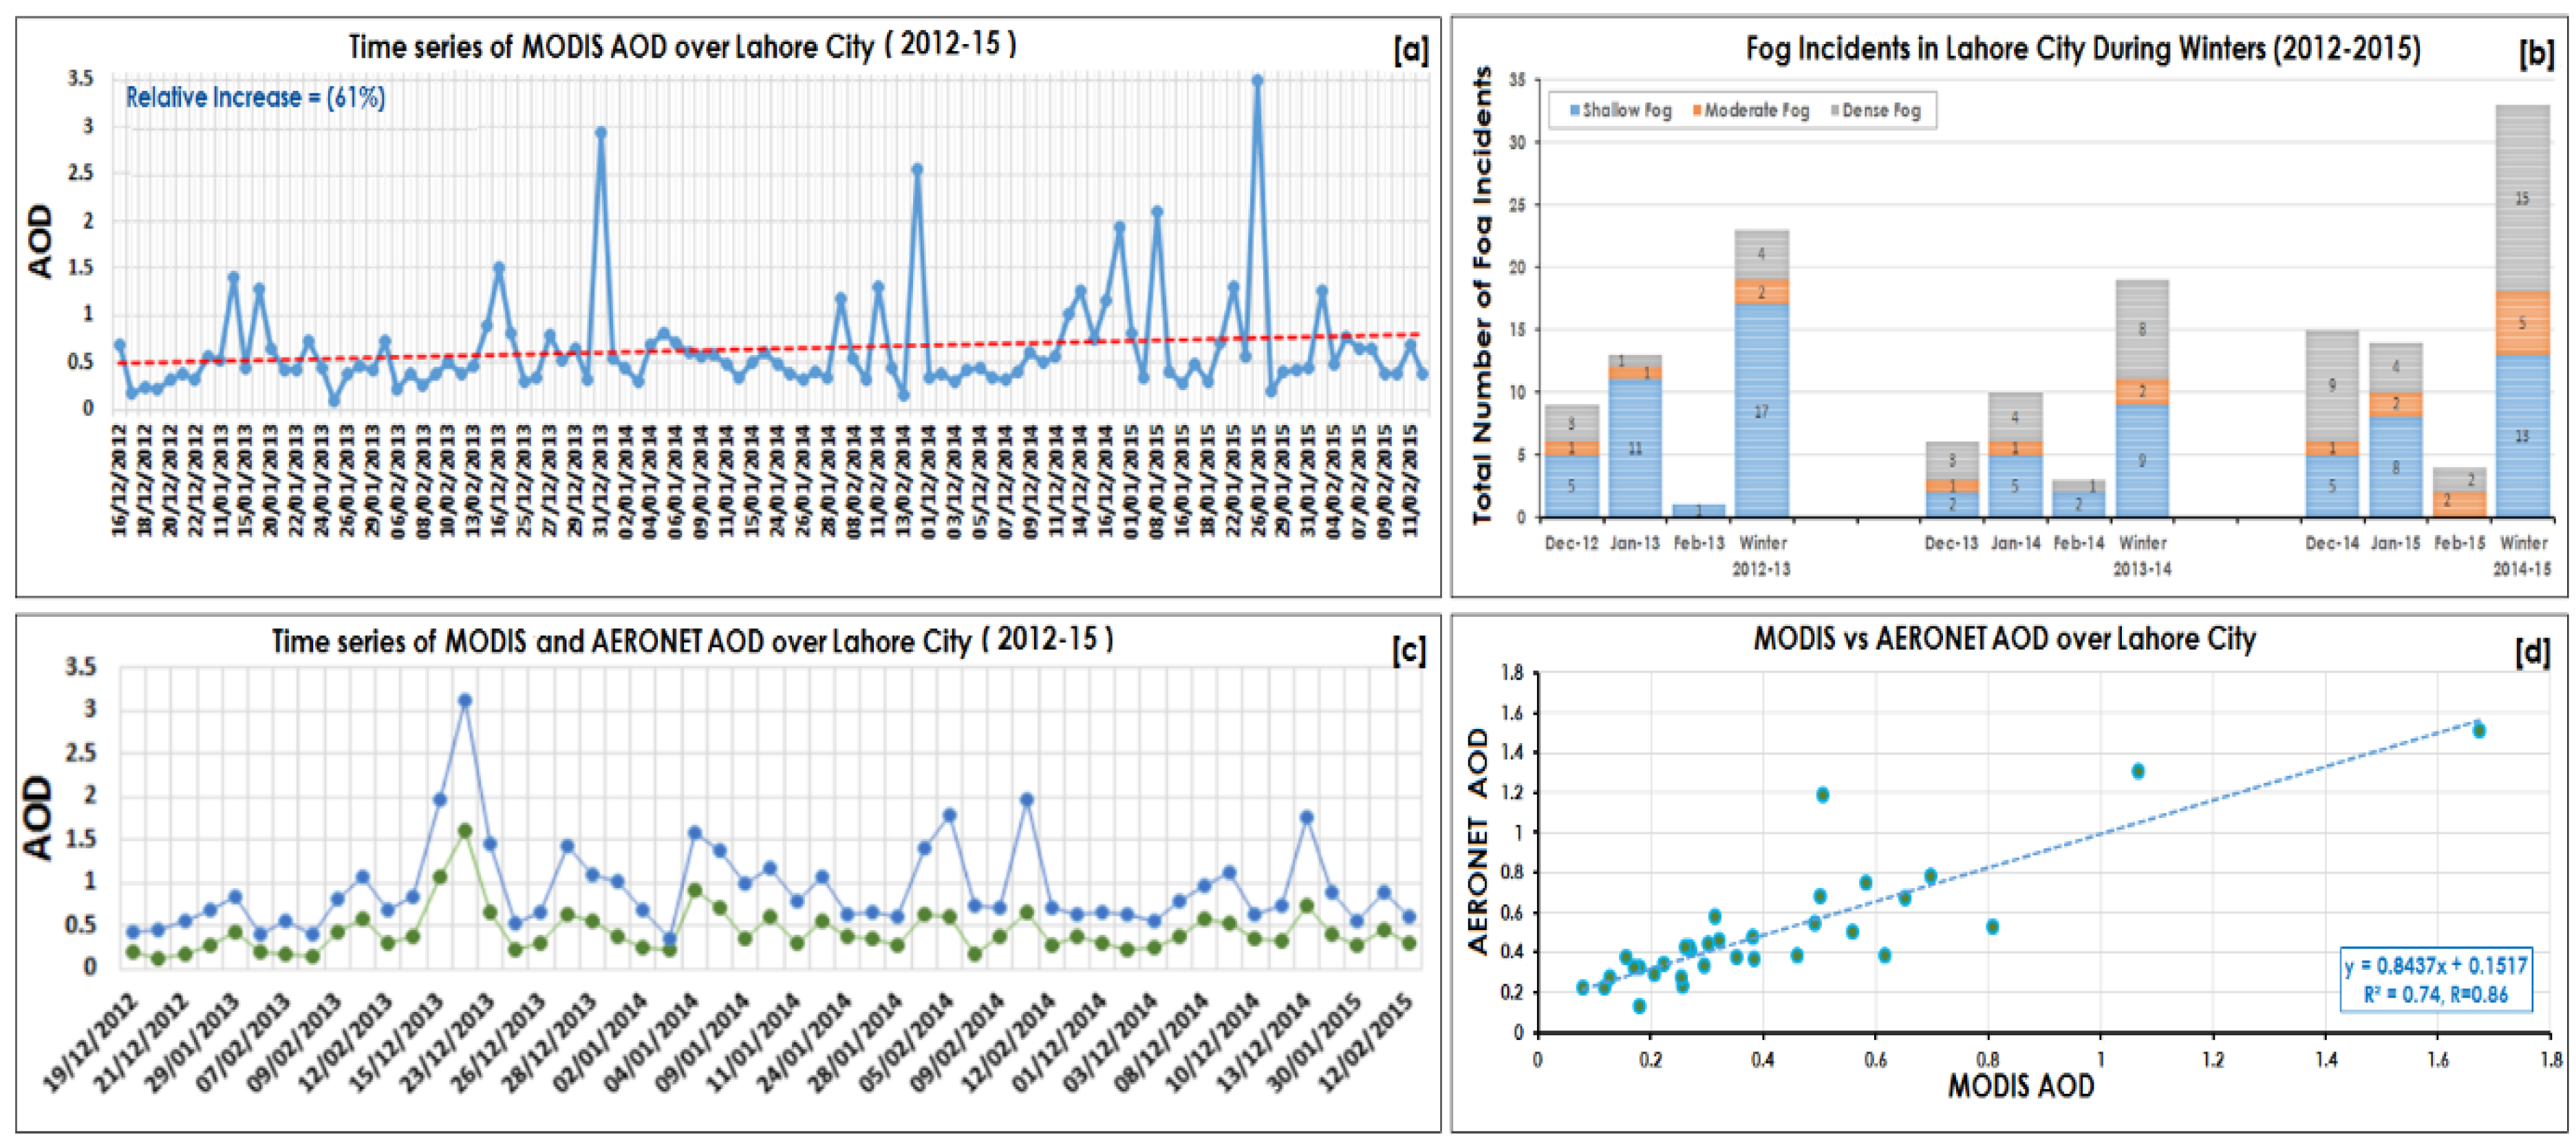
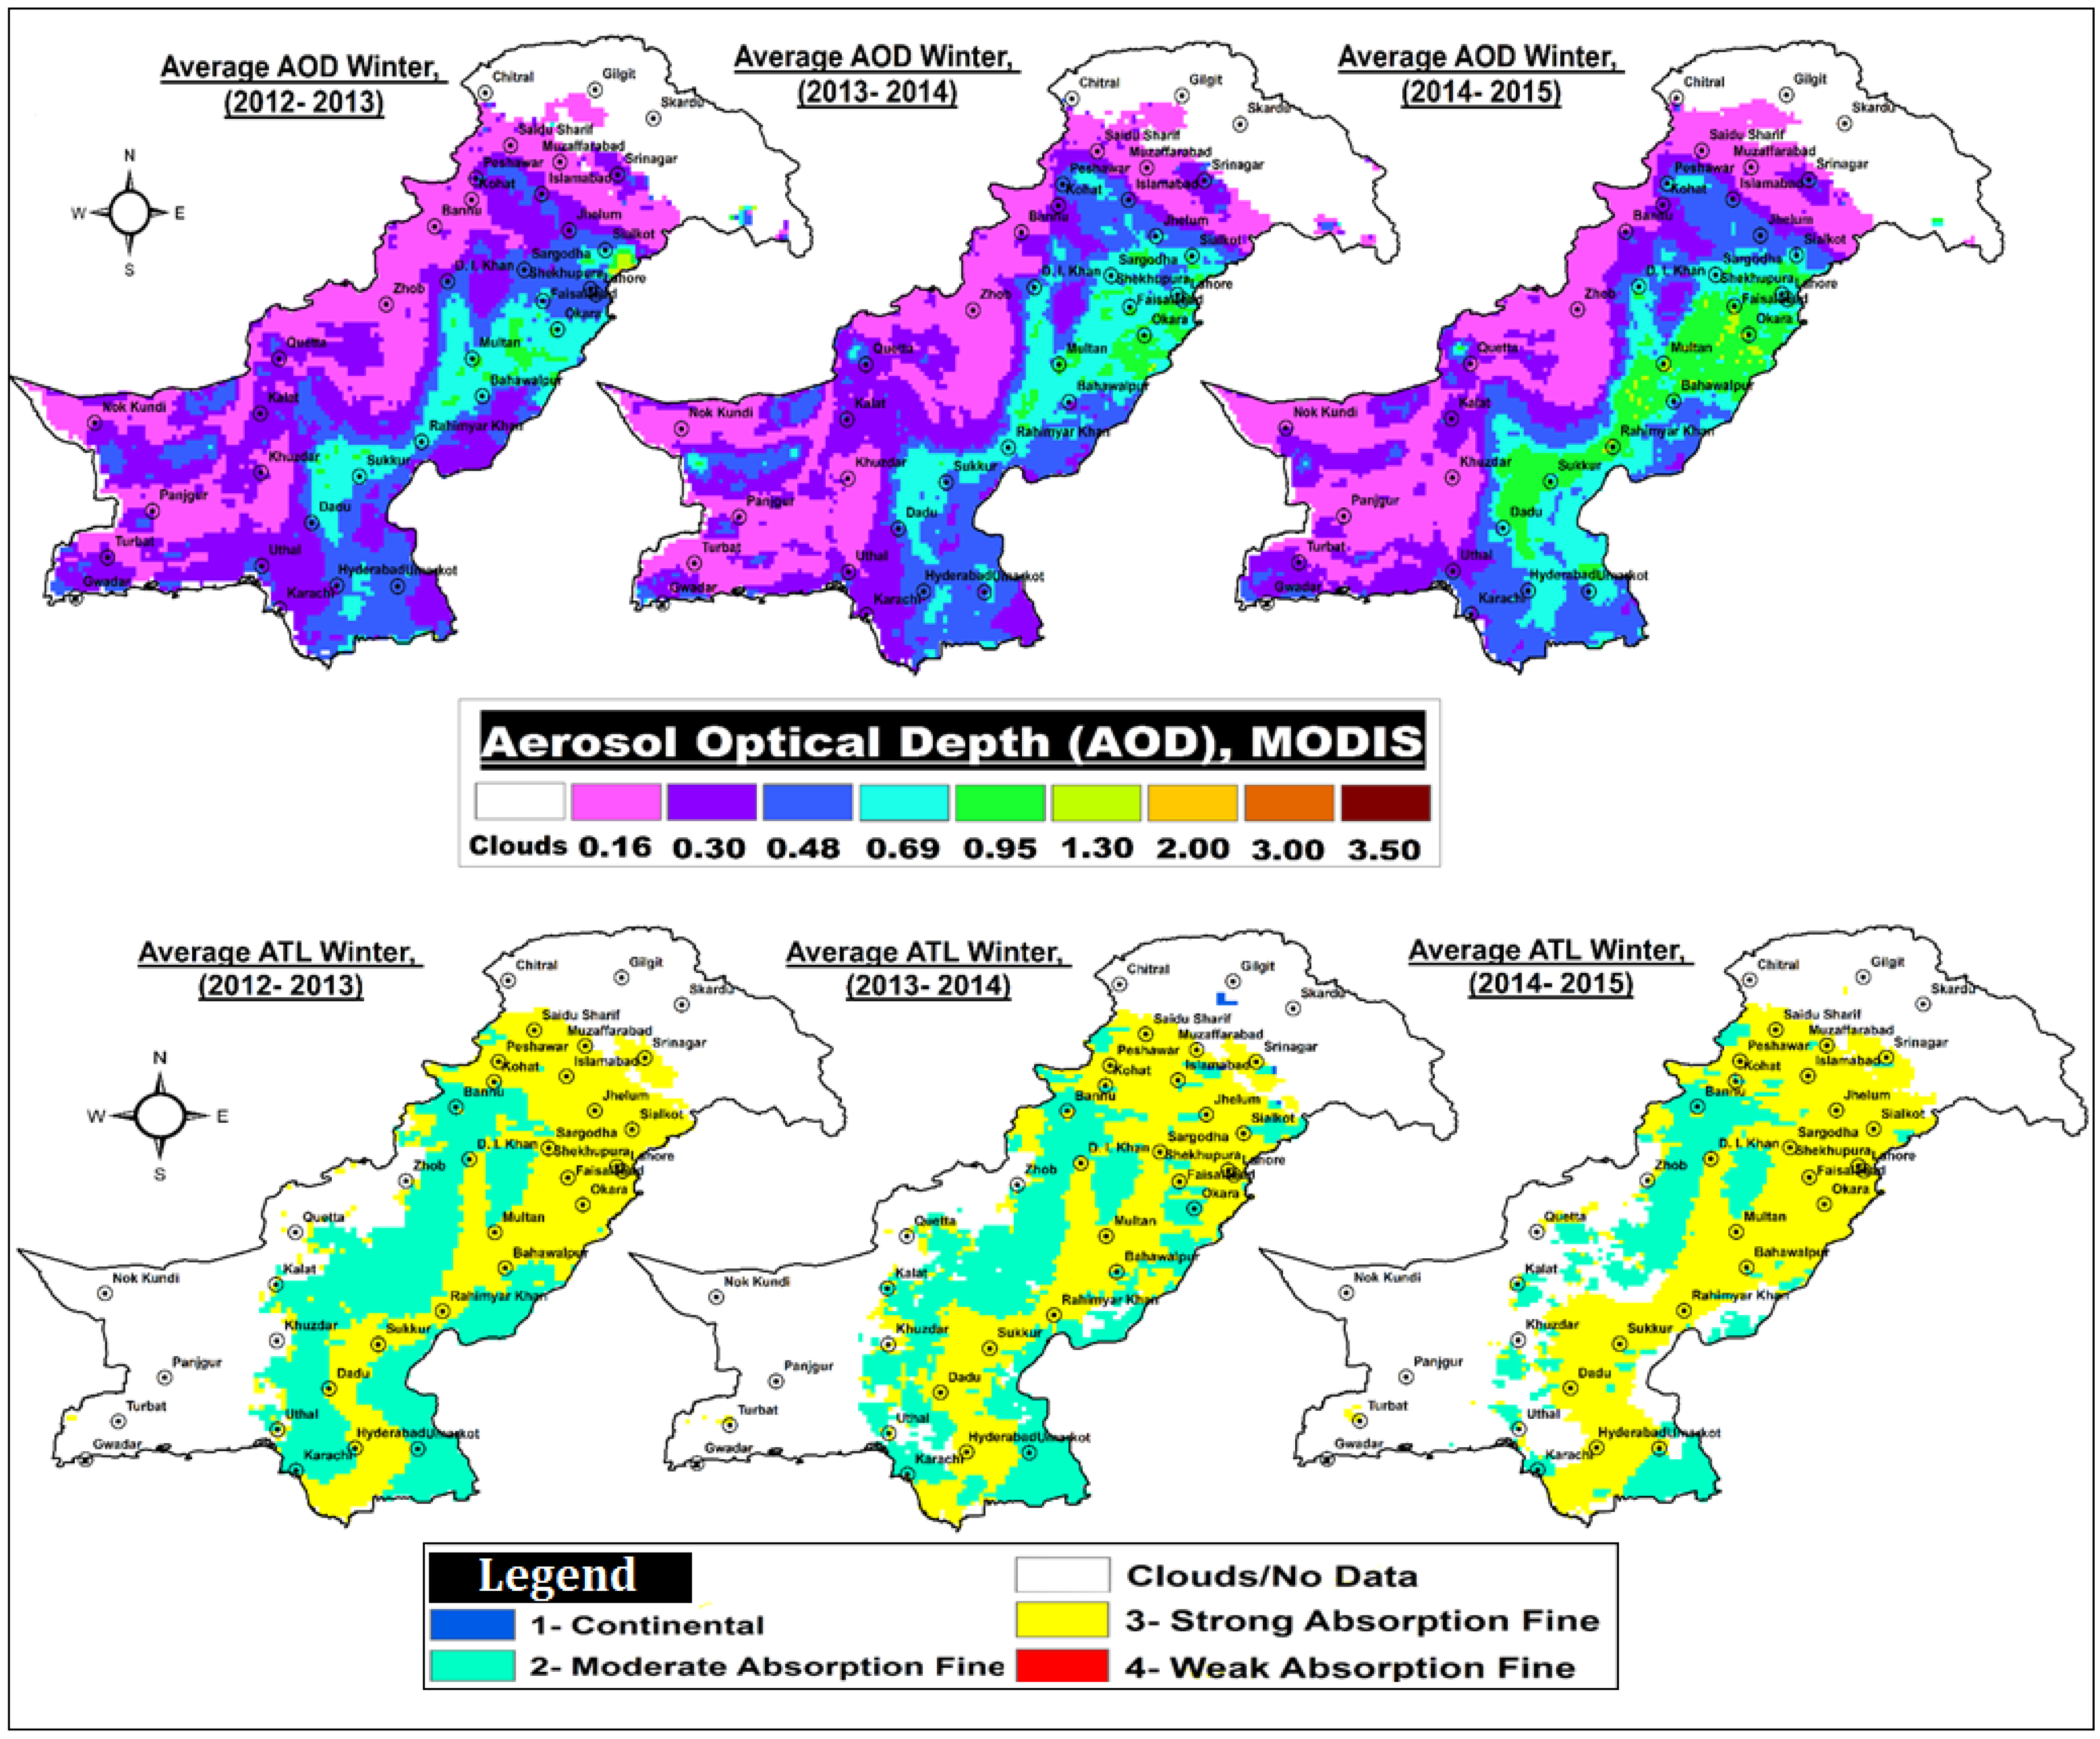
3.2. Persistent Winter Fog over Lahore City
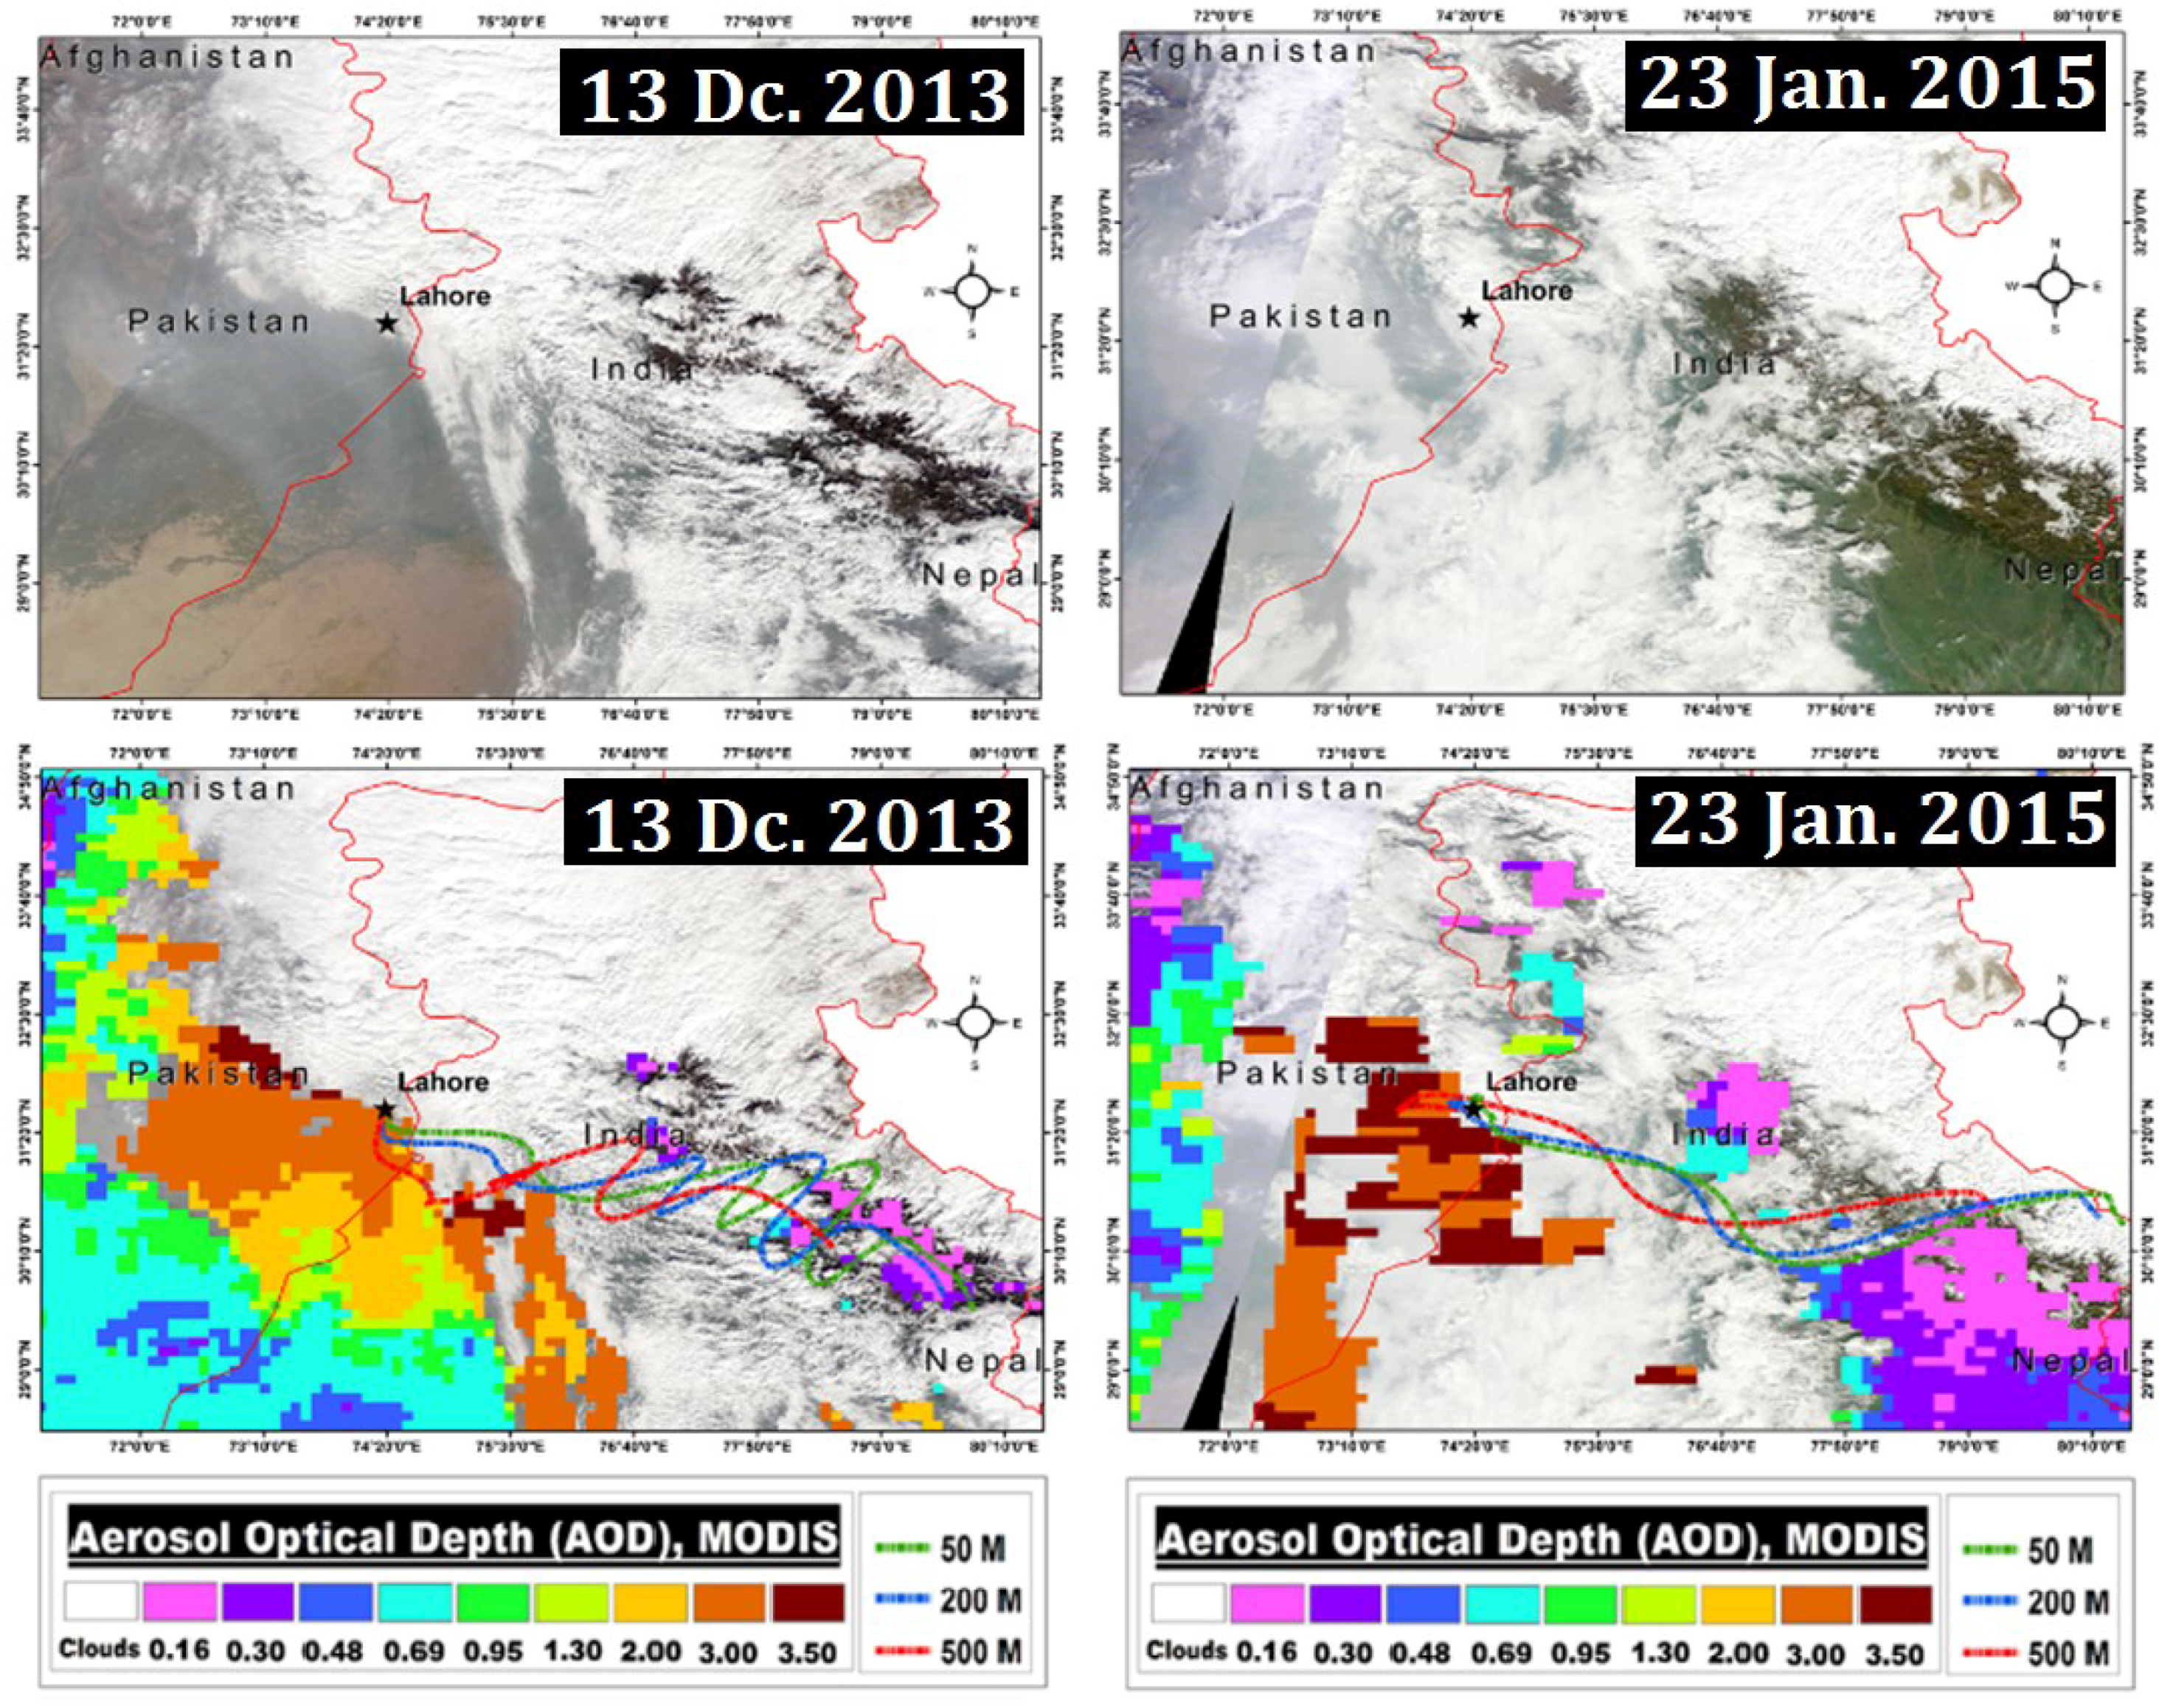
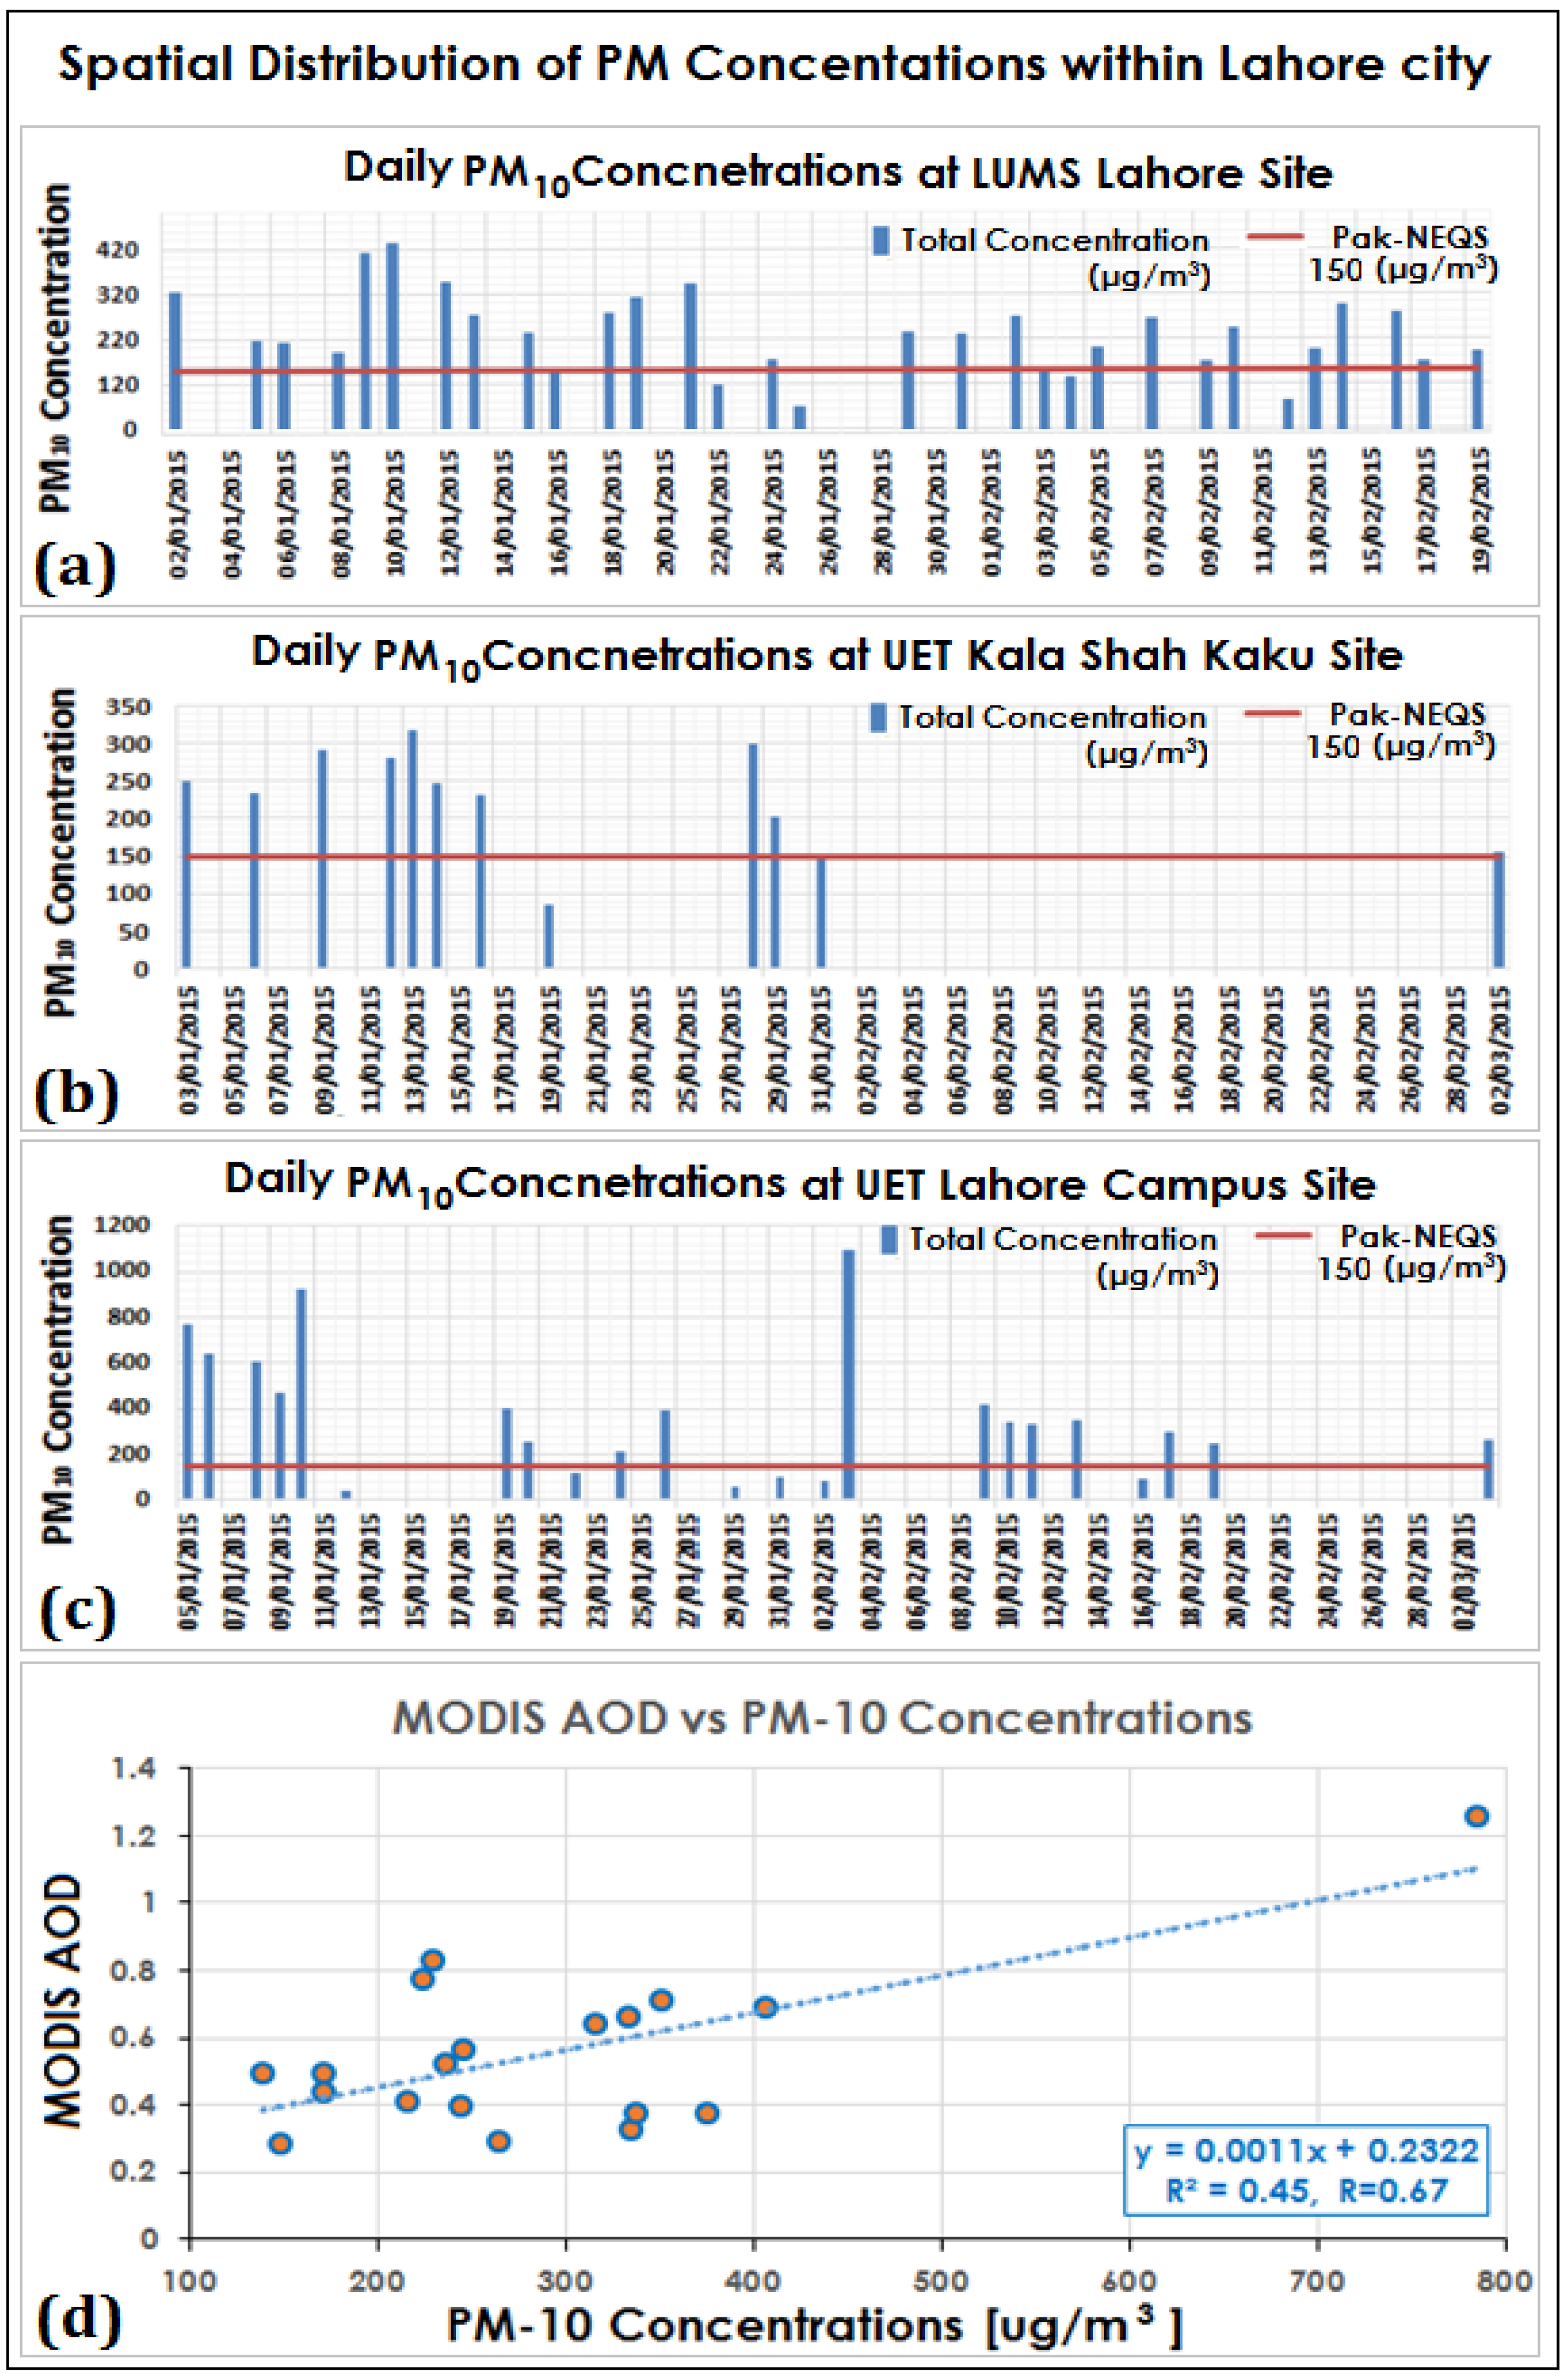
3.3. Case Study-Winter 2014–2015
3.4. HYSPLIT Back Trajectory Analysis
4. Conclusions
Acknowledgments
Author Contributions
Conflicts of Interest
Abbreviations
| IGP | Indo–Gangetic Plains |
| km2 | Square Kilometer |
| AOD | Aerosol optical depth |
| nm | Nanometer |
| UV-Vis-NIR-SWIR | Ultraviolet, Visible, Near Infrared, Short Wavelength Infrared |
| MODIS | Moderate Resolution Imaging Spectroradiometer |
| OMI | Ozone monitoring instrument |
| CALIPSO | Cloud-Aerosol Lidar and Infrared Pathfinder Satellite Observations |
| AERONET | AErosol RObotic NETwork |
References
- Syed, F.S.; Körnich, H.; Tjernström, M. On the fog variability over South Asia. Clim. Dyn. 2012, 39, 2993–3005. [Google Scholar] [CrossRef]
- Gultepe, I.; Tardif, R.; Michaelides, S.; Cermak, J.; Bott, A.; Bendix, J.; Müller, M.; Pagowski, M.; Hansen, B.; Ellrod, G. Fog research: A review of past achievements and future perspectives. Pure Appl. Geophys. 2007, 164, 1121–1159. [Google Scholar] [CrossRef]
- Dejmal, K.; Repal, V. Forecasting the Formation of Radiation Fog. Available online: http://www.wseas.us/e-library/conferences/2010/Taipei/FH/FH-44.pdf (accessed on 29 February 2016).
- Muslehuddin, M.; Mir, H.; Faisal, N. Recent occurrence of fog over pakistan (1997 to 2000). Pak. J. Meteorol. 2004, 1, 3–18. [Google Scholar]
- Bushahab, A.; Al Suwaidi, A.; Ghedira, H.; Mubarak, K. Fog forecasting, detection and monitoring in the Uae using seviri-msg data. In Proceedings of the 2009 IEEE International Geoscience and Remote Sensing Symposium, Cape Town, South Africa, 12–17 July 2009; pp. 535–538.
- Ramanathan, V.; Crutzen, P.J.; Kiehl, J.T.; Rosenfeld, D. Aerosols, climate, and the hydrological cycle. Science 2001, 294, 2119–2124. [Google Scholar] [CrossRef] [PubMed]
- Charlson, R.J.; Schwartz, S.E.; Hales, J.M.; Cess, R.D.; Coakley, J.A.; Hansen, J.E.; Hofmann, D.J. Climate forcing by anthropogenic aerosols. Science 1992, 255, 423–430. [Google Scholar] [CrossRef] [PubMed]
- Kosmopoulos, P.G.; Kaskaoutis, D.G.; Nastos, P.T.; Kambezidis, H.D. Seasonal variation of columnar aerosol optical properties over athens, greece, based on modis data. Remote Sens. Environ. 2008, 112, 2354–2366. [Google Scholar] [CrossRef]
- Lohmann, U.; Feichter, J. Global indirect aerosol effects: A review. Atmos. Chem. Phys. 2005, 5, 715–737. [Google Scholar] [CrossRef]
- Solomon, S. IPCC (2007): Climate Change the Physical Science Basis. In Proceedings of the AGU Fall Meeting Abstracts, San Francisco, CA, USA, 10–14 December 2007.
- Shabbir, Y.; Khokhar, M.F.; Shaiganfar, R.; Wagner, T. Spatial variance and assessment of nitrogen dioxide pollution in major cities of pakistan along n5-highway. J. Environ. Sci. 2015. [Google Scholar] [CrossRef] [PubMed]
- Khokhar, M.F.; Yasmin, N.; Fatima, N.; Beirle, S.; Wagner, T. Detection of trends and seasonal variation in tropospheric nitrogen dioxide over Pakistan. Aerosol Air Qual. Res. 2015, 15, 2508–2524. [Google Scholar] [CrossRef]
- Seinfeld, J.; Pandis, S. Atmospheric Chemistry and Physics, a Wiley-Inter Science Publication; John Wiley & Sons Inc.: New York, NY, USA, 2006. [Google Scholar]
- Brooks, S.D.; Gonzales, M.; Farias, R. Using surface tension measurements to understand how pollution can influence cloud formation, fog, and precipitation. J. Chem. Educ. 2009. [Google Scholar] [CrossRef]
- Mohan, M.; Payra, S. Influence of aerosol spectrum and air pollutants on fog formation in urban environment of megacity Delhi, India. Environ. Monit. Assess. 2009, 151, 265–277. [Google Scholar] [CrossRef] [PubMed]
- Chen, L.-W.A.; Doddridge, B.G.; Dickerson, R.R.; Chow, J.C.; Henry, R.C. Origins of fine aerosol mass in the baltimore–Washington corridor: Implications from observation, factor analysis, and ensemble air parcel back trajectories. Atmos. Environ. 2002, 36, 4541–4554. [Google Scholar] [CrossRef]
- Andreae, M.O. Chapter 10 climatic effects of changing atmospheric aerosol levels. In World Survey of Climatology; Henderson-sellers, A., Ed.; Elsevier: Amsterdam, The Netherlands, 1995; Volume 16, pp. 347–398. [Google Scholar]
- Rosenfeld, D.; Lensky, I.M. Satellite–based insights into precipitation formation processes in continental and maritime convective clouds. Bull. Am. Meteorol. Soc. 1998, 79, 2457–2476. [Google Scholar] [CrossRef]
- Twomey, S. The influence of pollution on the shortwave albedo of clouds. J. Atmos. Sci. 1977, 34, 1149–1152. [Google Scholar] [CrossRef]
- D’Almeida, G.A.; Koepke, P.; Shettle, E.P. Atmospheric Aerosols: Global Climatology and Radiative Characteristics; A Deepak Publishing: Hampton, VA, USA, 1991. [Google Scholar]
- Kaskaoutis, D.G.; Kambezidis, H.D.; Hatzianastassiou, N.; Kosmopoulos, P.G.; Badarinath, K.V.S. Aerosol climatology: On the discrimination of aerosol types over four aeronet sites. Atmos. Chem. Phys. Discuss. 2007, 7, 6357–6411. [Google Scholar] [CrossRef]
- Menon, S.; Hansen, J.; Nazarenko, L.; Luo, Y. Climate effects of black carbon aerosols in China and India. Science 2002, 297, 2250–2253. [Google Scholar] [CrossRef] [PubMed]
- Sarkar, S.; Chokngamwong, R.; Cervone, G.; Singh, R.P.; Kafatos, M. Variability of aerosol optical depth and aerosol forcing over India. Adv. Space Res. 2006, 37, 2153–2159. [Google Scholar] [CrossRef]
- Otto, S.; de Reus, M.; Trautmann, T.; Thomas, A.; Wendisch, M.; Borrmann, S. Atmospheric radiative effects of an in situ measured saharan dust plume and the role of large particles. Atmos. Chem. Phys. 2007, 7, 4887–4903. [Google Scholar] [CrossRef]
- Haywood, J.M.; Francis, P.N.; Glew, M.D.; Taylor, J.P. Optical properties and direct radiative effect of saharan dust: A case study of two saharan dust outbreaks using aircraft data. J. Geophys. Res. Atmos. 2001, 106, 18417–18430. [Google Scholar] [CrossRef]
- Smart, J.C.R.; Hicks, K.; Morrissey, T.; Heinemeyer, A.; Sutton, M.A.; Ashmore, M. Applying the ecosystem service concept to air quality management in the UK: A case study for ammonia. Environmetrics 2011, 22, 649–661. [Google Scholar] [CrossRef]
- Tripathi, S.N.; Dey, S.; Chandel, A.; Srivastava, S.; Singh, R.P.; Holben, B.N. Comparison of modis and aeronet derived aerosol optical depth over the Ganga Basin, India. Ann. Geophys. 2005, 23, 1093–1101. [Google Scholar] [CrossRef]
- Penner, J.E.; Dickinson, R.E.; O’Neill, C.A. Effects of aerosol from biomass burning on the global radiation budget. Science 1992, 256, 1432–1434. [Google Scholar] [CrossRef] [PubMed]
- Yoon, J.; Burrows, J.; Vountas, M.; von Hoyningen-Huene, W.; Chang, D.; Richter, A.; Hilboll, A. Changes in atmospheric aerosol loading retrieved from space-based measurements during the past decade. Atmos. Chem. Phys. 2014, 14, 6881–6902. [Google Scholar] [CrossRef]
- Kaufman, Y.J.; Tanré, D.; Boucher, O. A satellite view of aerosols in the climate system. Nature 2002, 419, 215–223. [Google Scholar] [CrossRef] [PubMed]
- Mao, K.; Ma, Y.; Xia, L.; Chen, W.Y.; Shen, X.; He, T.; Xu, T. Global aerosol change in the last decade: An analysis based on modis data. Atmos. Environ. 2014, 94, 680–686. [Google Scholar] [CrossRef]
- Mishchenko, M.I.; Geogdzhayev, I.V.; Rossow, W.B.; Cairns, B.; Carlson, B.E.; Lacis, A.A.; Liu, L.; Travis, L.D. Long-term satellite record reveals likely recent aerosol trend. Science 2007, 315, 1543–1543. [Google Scholar] [CrossRef] [PubMed]
- Mishchenko, M.I.; Geogdzhayev, I.V. Satellite remote sensing reveals regional tropospheric aerosol trends. Opt. Express 2007, 15, 7423–7438. [Google Scholar] [CrossRef] [PubMed]
- Alam, K.; Qureshi, S.; Blaschke, T. Monitoring spatio-temporal aerosol patterns over Pakistan based on modis, toms and misr satellite data and a hysplit model. Atmos. Environ. 2011, 45, 4641–4651. [Google Scholar] [CrossRef]
- Kaufman, Y.J.; Koren, I.; Remer, L.A.; Rosenfeld, D.; Rudich, Y. The effect of smoke, dust, and pollution aerosol on shallow cloud development over the Atlantic Ocean. Proc. Natl Acad. Sci. USA 2005, 102, 11207–11212. [Google Scholar] [CrossRef] [PubMed]
- Nakajima, T.; Higurashi, A.; Kawamoto, K.; Penner, J.E. A possible correlation between satellite-derived cloud and aerosol microphysical parameters. Geophys. Res. Lett. 2001, 28, 1171–1174. [Google Scholar] [CrossRef]
- Lodhi, A.; Ghauri, B.; Khan, M.R.; Rahman, S.; Shafique, S. Particulate matter (PM2.5) concentration and source apportionment in Lahore. J. Bra. Chem. Soc. 2009, 20, 1811–1820. [Google Scholar] [CrossRef]
- Mansha, M.; Ghauri, B.; Rahman, S.; Amman, A. Characterization and source apportionment of ambient air particulate matter (PM2.5) in Karachi. Sci. Total Environ. 2012, 425, 176–183. [Google Scholar] [CrossRef] [PubMed]
- Shahid, M.Z.; Liao, H.; Li, J.; Shahid, I.; Lodhi, A.; Mansha, M. Seasonal variations of aerosols in Pakistan: Contributions of domestic anthropogenic emissions and transboundary transport. Aerosol Air Qual. Res. 2015, 15, 1580–1600. [Google Scholar] [CrossRef]
- Shahid, M.Z.; Hong, L.; Yu-Lu, Q.; Shahid, I. Source sector contributions to aerosol levels in Pakistan. Atmos. Ocean. Sci. Lett. 2015, 8, 308–313. [Google Scholar]
- Alam, K.; Trautmann, T.; Blaschke, T.; Majid, H. Aerosol optical and radiative properties during summer and winter seasons over Lahore and Karachi. Atmos. Environ. 2012, 50, 234–245. [Google Scholar] [CrossRef]
- Mitra, A.P.; Sharma, C. Global Environmental Changes in South Asia: A Regional Perspective; Springer Science & Business Media: New York, NY, USA, 2012. [Google Scholar]
- Khan, N. Marine Resources in Pakistan: A Tentative Inventory. Available online: http://sustainableinitiatives.org.pk/da/Government%20Documents/Research%20Doucment/Marine%20Resources%20In%20Pakistan%20NIO.pdf (accessed on 29 February 2016).
- Haider, K.; Shah, S.M.R.; Ghaffar, B.; Naeem, S. Estimating the potential habitat of coral reefs along the coastline of Pakistan using GIS and RS techniques. Int. J. Fauna Biol. Stud. 2015, 2, 92–95. [Google Scholar]
- Chaudhry, Q.-Z.; Mahmood, A.; Rasul, G.; Afzaal, M. Climate Change Indicators of Pakistan; Technical Report No. PMD-22/2009; Pakistan Meteorological Department: Islamabad, Pakistan, August 2009.
- Naheed, G.; Kazmi, D.; Rasul, G. Seasonal variation of rainy days in Pakistan. Pak. J. Meteorol. 2013, 9, 9–13. [Google Scholar]
- Ahmad, I.; Zhaobo, S.; Weitao, D.; Ambreen, R. Trend analysis of January temperature in Pakistan over the period of 1961–2006: Geographical perspective. Pak. J. Meteorol. 2010, 7, 11–22. [Google Scholar]
- Hui, F.; Ci, T.; Cheng, X.; Scambos, T.A.; Liu, Y.; Zhang, Y.; Chi, Z.; Huang, H.; Wang, X.; Wang, F. Mapping blue-ice areas in Antarctica using ETM+ and MODIS data. Ann. Glaciol. 2014, 55, 129–137. [Google Scholar] [CrossRef]
- Levy, R.; Mattoo, S.; Munchak, L.; Remer, L.; Sayer, A.; Hsu, N. The collection 6 modis aerosol products over land and ocean. Atmos. Meas. Tech. Discuss 2013, 6, 159–259. [Google Scholar] [CrossRef]
- Veihelmann, B.; Veefkind, J.; Braak, R.; Levelt, P.; de Haan, J. Aerosol properties from omi using the multi-wavelength algorithm. In Proceedings of the 2007 ESA Envisat Symposium, Montreux, Switzerland, 23–27 April 2007.
- Winker, D.M.; Pelon, J.R.; McCormick, M.P. The CALIPSO mission: Spaceborne lidar for observation of aerosols and clouds. In Proceedings of the Third International Asia-Pacific Environmental Remote Sensing Remote Sensing of the Atmosphere, Ocean, Environment, and Space, Hangzhou, China, 24 March 2003; pp. 1–11.
- Cesnulyte, V.; Lindfors, A.; Pitkänen, M.; Lehtinen, K.; Morcrette, J.-J.; Arola, A. Comparing ECMWF AOD with AERONET observations at visible and UV wavelengths. Atmos. Chem. Phys. 2014, 14, 593–608. [Google Scholar] [CrossRef]
- Gupta, P.; Khan, M.N.; da Silva, A.; Patadia, F. Modis aerosol optical depth observations over urban areas in Pakistan: Quantity and quality of the data for air quality monitoring. Atmos. Pollut. Res. 2013, 4, 43–52. [Google Scholar] [CrossRef]
- Ali, M.; Tariq, S.; Mahmood, K.; Daud, A.; Batool, A.; Haq, Z. A study of aerosol properties over lahore (Pakistan) by using aeronet data. Asia-Pac. J. Atmos. Sci. 2013, 50, 153–162. [Google Scholar] [CrossRef]
- Torres, O.; Jethva, H.; Bhartia, P. Retrieval of aerosol optical depth above clouds from omi observations: Sensitivity analysis and case studies. J. Atmos. Sci. 2012, 69, 1037–1053. [Google Scholar] [CrossRef]
- De Graaf, M.; Stammes, P.; Torres, O.; Koelemeijer, R. Absorbing aerosol index: Sensitivity analysis, application to gome and comparison with toms. J. Geophys. Res. Atmos. 2005, 110. [Google Scholar] [CrossRef]
- Jaffe, D.; Bertschi, I.; Jaeglé, L.; Novelli, P.; Reid, J.S.; Tanimoto, H.; Vingarzan, R.; Westphal, D.L. Long-range transport of siberian biomass burning emissions and impact on surface ozone in Western North America. Geophys. Res. Lett. 2004, 31. [Google Scholar] [CrossRef]
- Nedelec, P.; Thouret, V.; Brioude, J.; Sauvage, B.; Cammas, J.P.; Stohl, A. Extreme CO concentrations in the upper troposphere over northeast Asia in June 2003 from the in situ MOZAIC aircraft data. Geophys. Res. Lett. 2005, 32. [Google Scholar] [CrossRef]
- Khokhar, M.F.; Khalid, T.; Yasmin, N.; De Smedt, I. Spatio-temporal analyses of formaldehyde over Pakistan by using SCIAMACHY and GOME-2 observations. Aerosol Air Qual. Res. 2015, 15, 1760–1773. [Google Scholar] [CrossRef]
- Lall, J.S.; Moddie, A.D. Himalaya, Aspects of Change; Oxford University Press: New York, NY, USA, 1981. [Google Scholar]
- Venkataraman, C.; Habib, G.; Eiguren-Fernandez, A.; Miguel, A.H.; Friedlander, S.K. Residential biofuels in South Asia: Carbonaceous aerosol emissions and climate impacts. Science 2005, 307, 1454–1456. [Google Scholar] [CrossRef] [PubMed]
- Nair, V.S.; Moorthy, K.K.; Alappattu, D.P.; Kunhikrishnan, P.K.; George, S.; Nair, P.R.; Babu, S.S.; Abish, B.; Satheesh, S.K.; Tripathi, S.N.; et al. Wintertime aerosol characteristics over the Indo-Gangetic plain (IGP): Impacts of local boundary layer processes and long-range transport. J. Geophys. Res. Atmos. 2007, 112. [Google Scholar] [CrossRef]
- Kaskaoutis, D.G.; Houssos, E.E.; Goto, D.; Bartzokas, A.; Nastos, P.T.; Sinha, P.R.; Kharol, S.K.; Kosmopoulos, P.G.; Singh, R.P.; Takemura, T. Synoptic weather conditions and aerosol episodes over indo-gangetic plains, india. Clim Dyn 2014, 43, 2313–2331. [Google Scholar] [CrossRef]
- Ganguly, D.; Jayaraman, A.; Rajesh, T.A.; Gadhavi, H. Wintertime aerosol properties during foggy and nonfoggy days over urban center Delhi and their implications for shortwave radiative forcing. J. Geophys. Res. Atmos. 2006, 111. [Google Scholar] [CrossRef]
- Mehta, B.; Venkataraman, C.; Bhushan, M.; Tripathi, S.N. Identification of sources affecting fog formation using receptor modeling approaches and inventory estimates of sectoral emissions. Atmos. Environ. 2009, 43, 1288–1295. [Google Scholar] [CrossRef]
- Ahmad, S.; Majeed, R. Indus basin irrigation system water budget and associated problems. J. Eng. Appl. Sci. 2001, 20, 69–77. [Google Scholar]
- Kaskaoutis, D.G.; Sinha, P.R.; Vinoj, V.; Kosmopoulos, P.G.; Tripathi, S.N.; Misra, A.; Sharma, M.; Singh, R.P. Aerosol properties and radiative forcing over Kanpur during severe aerosol loading conditions. Atmos. Environ. 2013, 79, 7–19. [Google Scholar] [CrossRef]
- Crutzen, P.J.; Andreae, M.O. Biomass burning in the tropics: Impact on atmospheric chemistry and biogeochemical cycles. Science 1990, 250, 1669–1678. [Google Scholar] [CrossRef] [PubMed]
- Active Fire Data (MCD14DL). Available online: https://earthdata.nasa.gov/earth-observation-data/near-real-time/firms/active-fire-data (accessed on 29 February 2016).
- Olivier, J.; Bouwman, A.; Van der Hoek, K.; Berdowski, J. Global air emission inventories for anthropogenic sources of NOx, NH3 and N2O in 1990. Environ. Pollut. 1998, 102, 135–148. [Google Scholar] [CrossRef]
- Veefkind, J.P.; Boersma, K.; Wang, J.; Kurosu, T.; Krotkov, N.; Chance, K.; Levelt, P. Global satellite analysis of the relation between aerosols and short-lived trace gases. Atmos. Chem. Phys. 2011, 11, 1255–1267. [Google Scholar] [CrossRef]
- Ichoku, C.; Chu, D.A.; Mattoo, S.; Kaufman, Y.J.; Remer, L.A.; Tanré, D.; Slutsker, I.; Holben, B.N. A spatio-temporal approach for global validation and analysis of modis aerosol products. Geophys. Res. Lett. 2002, 29. [Google Scholar] [CrossRef]
- Streets, D.G.; Canty, T.; Carmichael, G.R.; de Foy, B.; Dickerson, R.R.; Duncan, B.N.; Edwards, D.P.; Haynes, J.A.; Henze, D.K.; Houyoux, M.R. Emissions estimation from satellite retrievals: A review of current capability. Atmos. Environ. 2013, 77, 1011–1042. [Google Scholar] [CrossRef]
- Ichoku, C.; Kahn, R.; Chin, M. Satellite contributions to the quantitative characterization of biomass burning for climate modeling. Atmospheric Research 2012, 111, 1–28. [Google Scholar] [CrossRef]
- Khattak, P.; Khokhar, M.F.; Yasmin, N. Spatio-temporal analyses of atmospheric sulfur dioxide column densities over Pakistan by using sciamachy data. Aerosol Air Qual. Res. 2014, 14, 1883–1896. [Google Scholar] [CrossRef]
- Ramanathan, V.; Chung, C.; Kim, D.; Bettge, T.; Buja, L.; Kiehl, J.T.; Washington, W.M.; Fu, Q.; Sikka, D.R.; Wild, M. Atmospheric brown clouds: Impacts on South Asian climate and hydrological cycle. Proc. Natl. Acad. Sci. USA 2005, 102, 5326–5333. [Google Scholar] [CrossRef] [PubMed]
- Lau, K.M.; Kim, M.K.; Kim, K.M. Asian summer monsoon anomalies induced by aerosol direct forcing: The role of the Tibetan plateau. Clim. Dyn. 2006, 26, 855–864. [Google Scholar] [CrossRef]
- Qian, Y.; Flanner, M.G.; Leung, L.R.; Wang, W. Sensitivity studies on the impacts of Tibetan plateau snowpack pollution on the Asian hydrological cycle and monsoon climate. Atmos. Chem. Phys. 2011, 11, 1929–1948. [Google Scholar] [CrossRef]
- Yasunari, T.J.; Bonasoni, P.; Laj, P.; Fujita, K.; Vuillermoz, E.; Marinoni, A.; Cristofanelli, P.; Duchi, R.; Tartari, G.; Lau, K.M. Estimated impact of black carbon deposition during pre-monsoon season from Nepal climate observatory–Pyramid data and snow albedo changes over Himalayan glaciers. Atmos. Chem. Phys. 2010, 10, 6603–6615. [Google Scholar] [CrossRef]
- Gautam, R.; Hsu, N.C.; Lau, W.K.M.; Yasunari, T.J. Satellite observations of desert dust-induced Himalayan snow darkening. Geophys. Res. Lett. 2013, 40, 988–993. [Google Scholar] [CrossRef]
- Cams. Available online: http://iridl.ldeo.columbia.edu/maproom/Global/Atm_Temp/Anomaly.html (accessed on 29 February 2016).
- Ohara, T.; Akimoto, H.; Kurokawa, J.; Horii, N.; Yamaji, K.; Yan, X.; Hayasaka, T. An Asian emission inventory of anthropogenic emission sources for the period 1980–2020. Atmos. Chem. Phys. 2007, 7, 4419–4444. [Google Scholar] [CrossRef]
- Hsu, N.C.; Gautam, R.; Sayer, A.M.; Bettenhausen, C.; Li, C.; Jeong, M.J.; Tsay, S.C.; Holben, B.N. Global and regional trends of aerosol optical depth over land and ocean using seawifs measurements from 1997 to 2010. Atmos. Chem. Phys. 2012, 12, 8037–8053. [Google Scholar] [CrossRef]
- Dimitris, G.K.; Ramesh, P.S.; Ritesh, G.; Manish, S.; Kosmopoulos, P.G.; Tripathi, S.N. Variability and trends of aerosol properties over kanpur, northern india using aeronet data (2001–10). Environ. Res. Lett. 2012, 7, 024003. [Google Scholar]
- Babu, S.S.; Manoj, M.R.; Moorthy, K.K.; Gogoi, M.M.; Nair, V.S.; Kompalli, S.K.; Satheesh, S.K.; Niranjan, K.; Ramagopal, K.; Bhuyan, P.K.; et al. Trends in aerosol optical depth over Indian region: Potential causes and impact indicators. J. Geophys. Res. Atmos. 2013, 118, 11794–11806. [Google Scholar] [CrossRef]
- Ahrens, C.D. Meteorology Today: An Introduction to Weather, Climate, and the Environment; Cengage Learning: Belmont, CA, USA, 2012. [Google Scholar]
- Visibility Data. Available online: http://www.weatherforyou.com/reports/index.php (accessed on 29 February 2016).
- Pak-NEQS: Paksitan’s National Environmental Quality Standards. Available online: http://environment.gov.pk/NEQS/SRO-2010-NEQS%20Air-Water-Noise.pdf (accessed on 29 February 2016).
- Xia, X.; Chen, H.; Wang, P.; Zhang, W.; Goloub, P.; Chatenet, B.; Eck, T.; Holben, B. Variation of column-integrated aerosol properties in a Chinese urban region. J. Geophys. Res. Atmos. 2006, 111. [Google Scholar] [CrossRef]
- Zha, Y.; Gao, J.; Jiang, J.; Lu, H.; Huang, J. Monitoring of urban air pollution from modis aerosol data: Effect of meteorological parameters. Tellus B 2010, 62, 109–116. [Google Scholar] [CrossRef]
- Han, Y.; Wu, Y.; Wang, T.; Zhuang, B.; Li, S.; Zhao, K. Impacts of elevated-aerosol-layer and aerosol type on the correlation of aod and particulate matter with ground-based and satellite measurements in Nanjing, southeast china. Sci. Total Environ. 2015, 532, 195–207. [Google Scholar] [CrossRef] [PubMed]
- Li, R.; Gong, J.; Chen, L.; Wang, Z. Estimating ground-level pm 2.5 using fine-resolution satellite data in the megacity of Beijing, China. Aerosol Air Qual. Res. 2015, 15, 1347–1356. [Google Scholar] [CrossRef]
- Rolph, G. Real-Time Environmental Applications and Display System; NOAA Air Resources Laboratory: Silver Spring, MD, USA, 2003.
- Rolph, G.; Ngan, F.; Draxler, R. Modeling the fallout from stabilized nuclear clouds using the hysplit atmospheric dispersion model. J. Environ. Radioact. 2014, 136, 41–55. [Google Scholar] [CrossRef] [PubMed]
- Stein, A.; Draxler, R.; Rolph, G.; Stunder, B.; Cohen, M.; Ngan, F. NOAA’S hysplit atmospheric transport and dispersion modeling system. Bull. Am. Meteorol. Soc. 2015, 96, 2059–2077. [Google Scholar] [CrossRef]


| Region | Provinces | CO | NO2 | SO2 |
|---|---|---|---|---|
| Upper Indus Plains (UIP) | KPK, Northern and Central Punjab | −0.07 | 0.38 | 0.47 |
| Lower Indus Plains (LIP) | Southern Punjab and Sindh | 0.6 | −0.37 | 0.09 |
| Indus Plains | KPK, Punjab, Sindh | 0.37 | 0.11 | 0.45 |
| Month | Winter (2012–2013) | Winter (2013–2014) | Winter (2014–2015) | Average |
|---|---|---|---|---|
| December | 0.37 | 0.90 | 1.08 | 0.67 ± 0.15 |
| January | 0.54 | 0.43 | 0.84 | 0.62 ± 0.09 |
| February | 0.39 | 0.64 | 0.63 | 0.56 ± 0.06 |
| Average | 0.43 | 0.57 | 0.84 | 0.62 ± 0.09 |
© 2016 by the authors; licensee MDPI, Basel, Switzerland. This article is an open access article distributed under the terms and conditions of the Creative Commons Attribution (CC-BY) license (http://creativecommons.org/licenses/by/4.0/).
Share and Cite
Khokhar, M.F.; Yasmin, N.; Chishtie, F.; Shahid, I. Temporal Variability and Characterization of Aerosols across the Pakistan Region during the Winter Fog Periods. Atmosphere 2016, 7, 67. https://doi.org/10.3390/atmos7050067
Khokhar MF, Yasmin N, Chishtie F, Shahid I. Temporal Variability and Characterization of Aerosols across the Pakistan Region during the Winter Fog Periods. Atmosphere. 2016; 7(5):67. https://doi.org/10.3390/atmos7050067
Chicago/Turabian StyleKhokhar, Muhammad Fahim, Naila Yasmin, Farrukh Chishtie, and Imran Shahid. 2016. "Temporal Variability and Characterization of Aerosols across the Pakistan Region during the Winter Fog Periods" Atmosphere 7, no. 5: 67. https://doi.org/10.3390/atmos7050067
APA StyleKhokhar, M. F., Yasmin, N., Chishtie, F., & Shahid, I. (2016). Temporal Variability and Characterization of Aerosols across the Pakistan Region during the Winter Fog Periods. Atmosphere, 7(5), 67. https://doi.org/10.3390/atmos7050067