Article

Heatwave Conditions and Long-Term Variability of Air Pollutants in a Spanish Urban Environment

by
Jude Maduabuchi Anyanwu
1,2,
María Ángeles García
1,* and
Isidro A. Pérez
1
1
Department of Applied Physics, Faculty of Sciences, University of Valladolid, Paseo de Belén 7, 47011 Valladolid, Spain
2
Department of Physics and Astronomy, University of Nigeria, Nsukka 410001, Enugu State, Nigeria
*
Author to whom correspondence should be addressed.
Atmosphere 2026, 17(6), 566; https://doi.org/10.3390/atmos17060566 (registering DOI)
Submission received: 10 April 2026 / Revised: 27 May 2026 / Accepted: 27 May 2026 / Published: 30 May 2026
(This article belongs to the Section Air Quality and Health)

Abstract

Heatwave conditions are increasingly being recognized as important drivers of urban air-quality variability in southern European cities, particularly in inland urban environments exposed to persistent summer warming and atmospheric stagnation. This study examines the long-term variability of O3, NO2, and PM2.5 concentrations in Valladolid, Spain, between 2006 and 2024, focusing particular attention on the occurrence and persistence of heatwave conditions. Ground-level ozone (O3), nitrogen dioxide (NO2), and fine particulate matter (PM2.5) were analyzed to assess temporal variability, seasonal behavior, long-term trends, and exceedance characteristics. Results indicate an increasing persistence of heatwave episodes during the study period, particularly after 2015, with recent events exhibiting longer duration and broader regional extent. O3 concentrations showed stronger accumulation during warm-season conditions, which is consistent with enhanced photochemical activity under elevated temperatures, while NO2 concentrations generally declined over time. PM2.5 variability reflected both local emissions and episodic regional influences, including Saharan dust intrusions. These findings highlight the growing relevance of heatwave conditions in shaping urban air-quality variability in medium-sized inland cities of the Iberian Peninsula.

1. Introduction

Extreme meteorological phenomena have increased in both frequency and intensity over recent decades, largely driven by anthropogenic climate change. Rising global temperatures have amplified the occurrence of extreme events such as heat waves, cold waves, droughts, and intense precipitation, with heat extremes emerging as one of the most critical climate-related hazards worldwide. Urban environments are particularly affected, as local climatic processes often intensify thermal stress and exacerbate environmental risks [1,2]. European cities are under increasing pressure to meet rising demands for urban services while also staying affordable, inclusive, and resilient in the face of climate change. At the same time, air pollution continues to be one of the most serious environmental threats to public health across Europe [3]. Rapid urban expansion—especially in peri-urban and suburban areas—has altered land–atmosphere interactions, leading to environmental disturbances and localized climate modification [4]. Recent studies indicate that continued urban growth is expected to intensify urban temperatures and strengthen the urban heat island (UHI) effect, which is defined as the temperature difference between urban and surrounding rural areas [5,6]. As highlighted by Evers et al. [7], increasing temperatures and extreme climate events pose growing challenges for sustainable urban planning across Europe.
Beyond thermal stress, extreme meteorological conditions play a key role in shaping urban air quality. Elevated temperatures, strong solar radiation, and stagnant atmospheric conditions commonly associated with heat events enhance the photochemical formation of ground-level ozone (O3). Although ozone in the stratosphere acts as a protective layer against harmful ultraviolet radiation, tropospheric ozone is a secondary air pollutant formed through complex photochemical reactions involving nitrogen oxides and volatile organic compounds from both natural and anthropogenic sources [8,9]. High ozone concentrations are associated with adverse health outcomes, particularly during summer heat episodes when exposure levels are highest [10]. Recent research across Spain demonstrates substantial spatial variability in ozone concentrations, driven by meteorological conditions, atmospheric circulation, and regional topography. García et al. [11] reported frequent exceedances of health-protection thresholds in Spanish cities, particularly in Córdoba, where suburban monitoring stations are influenced by precursor transport from surrounding areas, whereas ozone levels in Valladolid generally remained below regulatory limits. Nevertheless, both regions experienced elevated ozone concentrations during heatwave periods, with reduced levels observed during the COVID-19 lockdown in 2020. These findings underscore the strong coupling between extreme heat events and ozone formation as well as the importance of local climatic and geographic factors in modulating urban air quality. Heatwave conditions are increasingly being recognized as important drivers of urban air-quality variability, particularly in southern European regions characterized by intense solar radiation and recurrent summer stagnation episodes. Elevated temperatures can accelerate photochemical ozone production while simultaneously favoring atmospheric stability, reduced pollutant dispersion, and the accumulation of secondary pollutants. These interactions are especially relevant in inland urban environments such as Valladolid, where prolonged summer heat episodes have become increasingly persistent in recent decades.
Urban populations are especially vulnerable to the combined impacts of extreme meteorological events and air pollution due to the physical structure of cities and socio-economic conditions. Dense building configurations, extensive impervious surfaces, limited vegetation cover, and anthropogenic heat emissions increase exposure to extreme urban temperatures [12]. In Spain, the principal air pollutants of concern include nitrogen dioxide (NO2), tropospheric ozone (O3), and particulate matter (PM2.5 and PM10), all of which have well-documented impacts on human health [13]. While much of the existing literature focuses on mortality outcomes, morbidity-based analyses are increasingly being recognized as key to understanding quality-of-life impacts and optimizing healthcare resource allocation [14].
Vulnerability to extreme meteorological phenomena is further shaped by socio-economic and demographic factors. Climate change does not affect populations uniformly; instead, it often amplifies existing inequalities related to income, housing quality, and access to healthcare [15,16]. Lower-income populations are typically more exposed to unhealthy environments and possess fewer resources to implement adaptive measures, thus increasing their susceptibility to climate-related health risks [17,18]. At the regional scale, atmospheric circulation patterns play a crucial role in modulating temperature extremes and air pollution levels. Studies over the Iberian Peninsula have shown that synoptic-scale weather types strongly influence surface temperature variability and long-term warming trends, with several studies having examined the characteristics and evolution of heatwave events across the Iberian Peninsula [19]. Airflow patterns govern both meteorological variables and pollutant transport, facilitating the advection of air masses and the redistribution of pollutants far from their emission sources. Advances in weather-type classification methods—including clustering techniques applied to wind fields, cloud cover, and visibility—have improved understanding of recurring atmospheric patterns and their climatic implications [20,21,22]. These approaches have revealed shifts toward warmer and drier summers and milder winters across Europe, highlighting the dynamic link between atmospheric circulation and climate extremes [23]. Extreme temperature events—particularly heat waves—have received increasing attention due to their profound impact on human health and socio-economic systems. High-resolution climatological analyses over Spain indicate a marked increase in the frequency, duration, and intensity of heat waves since the early 1980s, accompanied by a decline in cold-wave severity [24]. These trends have been closely associated with changes in large-scale atmospheric circulation and regional climate variability, emphasizing the importance of integrating synoptic and local-scale perspectives when analyzing extreme meteorological phenomena. Within this context, the present study focuses on the city of Valladolid, a medium-sized urban center located in the interior of the Iberian Peninsula. Valladolid experiences a continental Mediterranean climate characterized by hot summers and cold winters, making it particularly susceptible to extreme temperature events. Its urban configuration and long-term availability of meteorological and air quality observations provide an ideal framework for investigating extreme meteorological phenomena in an urban environment. Previous studies conducted in Valladolid have explored specific aspects of ozone variability and heatwave occurrence over shorter temporal periods. However, limited attention has been given to the combined long-term evolution of O3, NO2, and PM2.5 concentrations alongside the increasing persistence of heatwave conditions over an extended observational period. The present study expands previous work by integrating long-term pollutant variability with the characterization of extreme summer heat events between 2006 and 2024, thereby providing a broader perspective on the interaction between urban air quality and evolving climatic conditions in a medium-sized inland Iberian city.
The present study investigates the long-term variability of O3, NO2, and PM2.5 concentrations in Valladolid, Spain, between 2006 and 2024, focusing particular attention on the occurrence and persistence of heatwave conditions and their potential influence on urban air quality. The study combines pollutant trend analysis, heatwave characterization, and meteorological interpretation to examine how increasing thermal extremes may contribute to changes in atmospheric composition within a medium-sized inland urban environment.

2. Materials and Methods

2.1. Study Area, Topographical and Climatic Setting

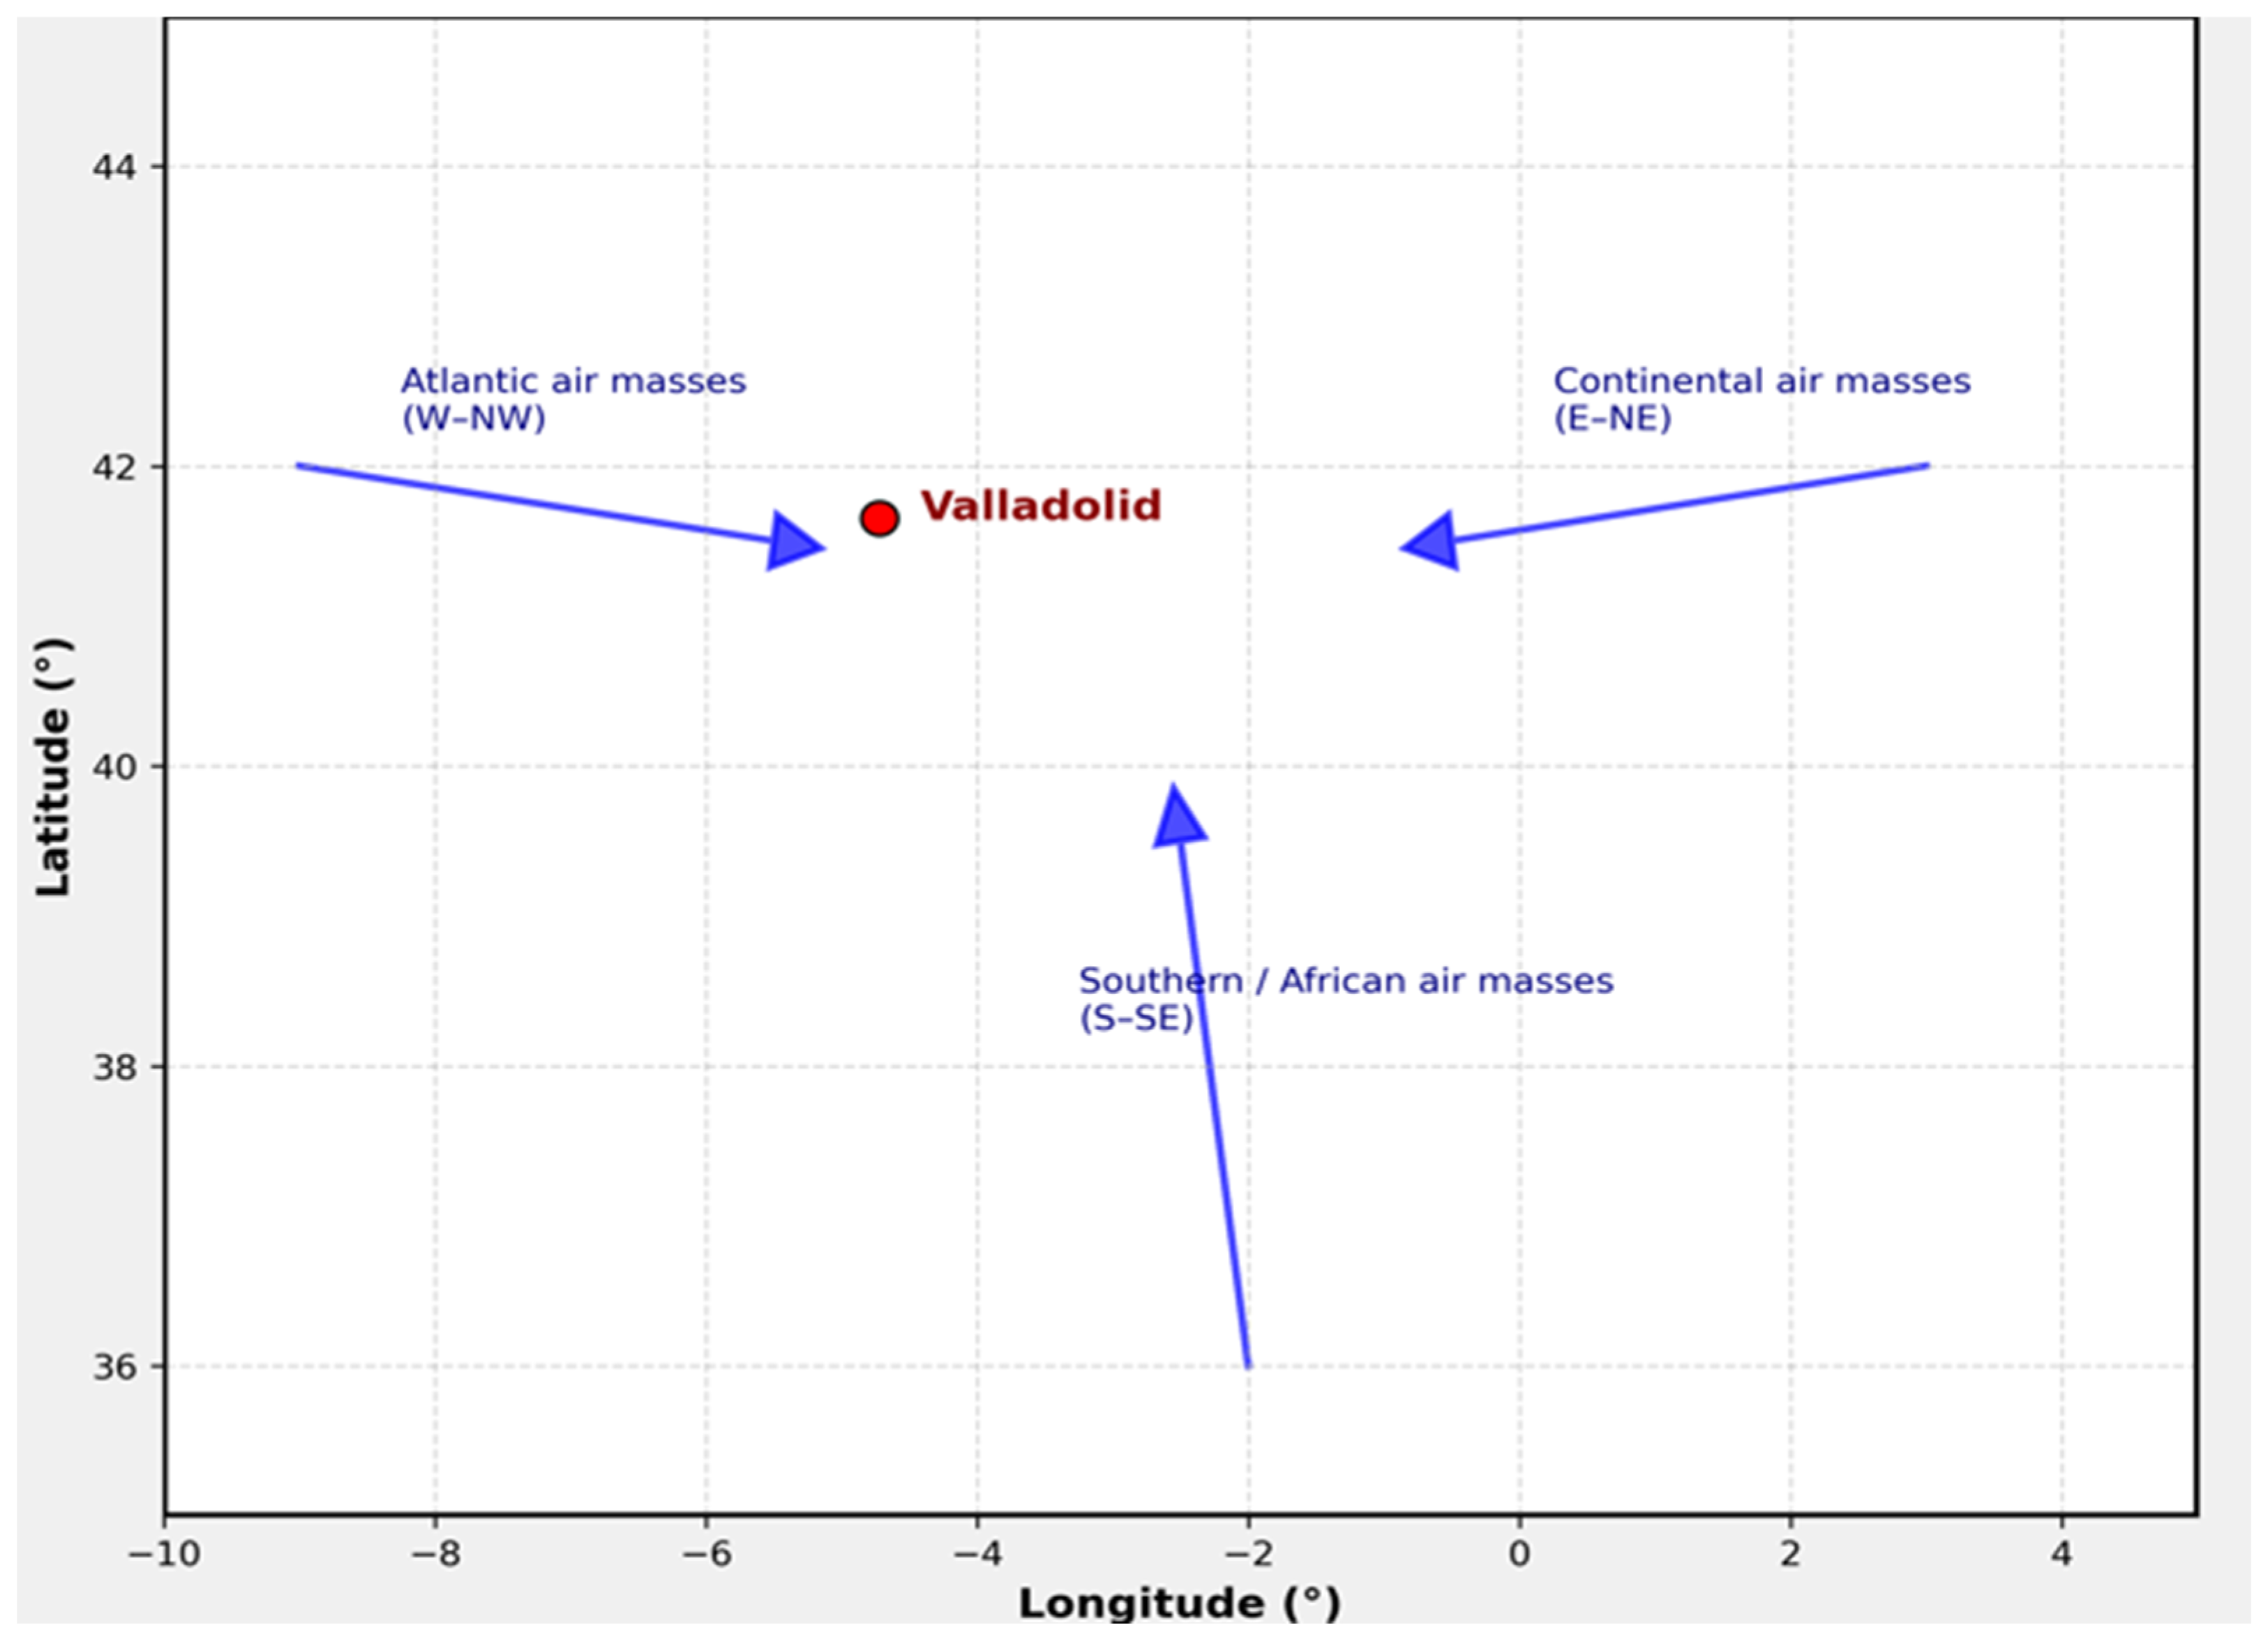
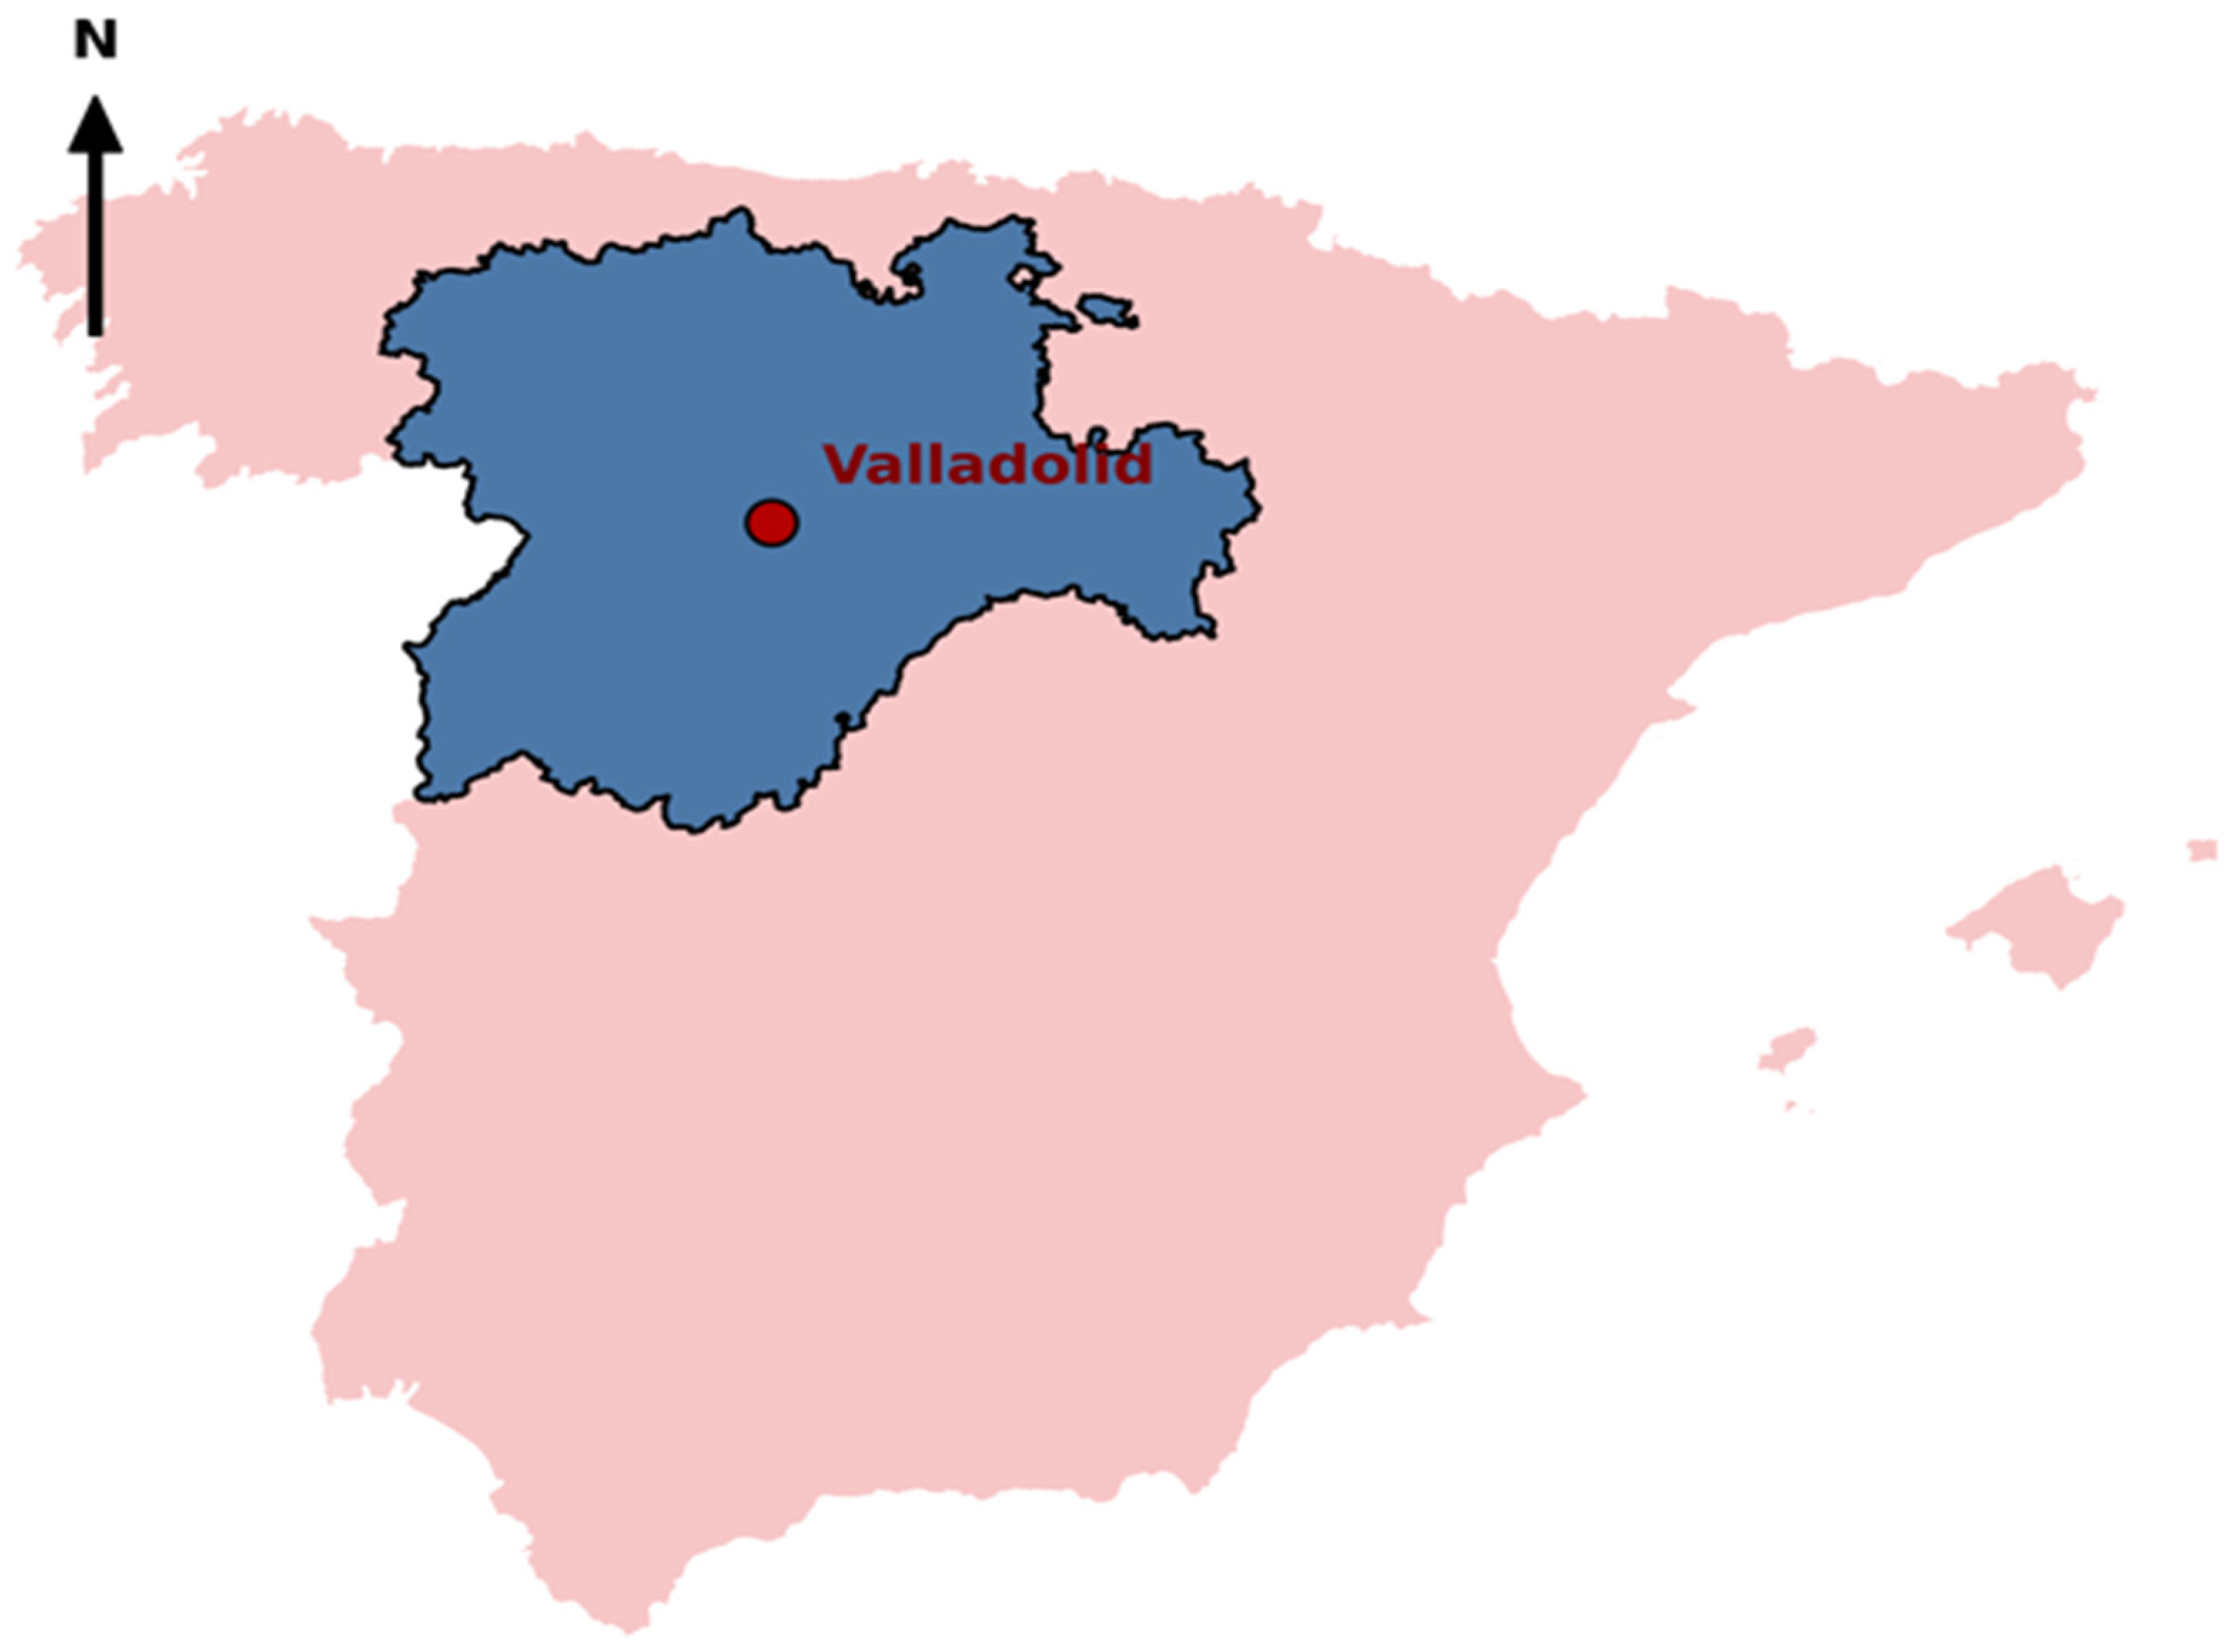
The present study focuses on the city of Valladolid, situated in north-central Spain within the region of Castile and Leon (Figure 1). Located on the central plateau of the Iberian Peninsula at approximately 41.65° N latitude and 4.72° W longitude, Valladolid lies at an average elevation of around 700 m above sea level within the Duero basin [22]. Its inland position, coupled with its lying at a significant distance from maritime influences, results in pronounced seasonal and diurnal temperature variability, which is a defining characteristic of the regional climate [19,25]. Valladolid experiences a continental Mediterranean climate, with hot, dry summers and cold winters. Summer maximum temperatures frequently exceed 35 °C during extreme heat events, while winter conditions are often marked by frost and temperature inversions [24]. Precipitation is generally low and unevenly distributed, with peaks typically occurring in spring and autumn. These climatic traits render the city particularly sensitive to extreme temperature events and related atmospheric processes [1].
From an urban perspective Valladolid is a medium-sized city with a population of approximately 300,000 inhabitants [26,27]. Its urban structure comprises a compact city center surrounded by suburban and peri-urban areas. High building density, extensive impervious surfaces, and limited vegetation cover in central districts contribute to enhanced heat storage and reduced nocturnal cooling, thereby promoting the urban heat island effect [12,28]. Previous studies have also shown that medium-sized cities can exhibit UHI intensities that are comparable to larger metropolitan areas, particularly during heatwave events [6]. Valladolid’s environmental location also influences local air quality dynamics. The city is affected by regional atmospheric circulation patterns that govern pollutant dispersion across the Iberian Peninsula [22]. Under stable anticyclonic conditions—which are common during summer heat events—reduced wind speeds and enhanced solar radiation facilitate the accumulation and photochemical formation of ground-level ozone [8,11]. The topographical and surface characteristics of Valladolid may influence local atmospheric circulation, thermal persistence, and pollutant dispersion processes, particularly during prolonged summer heat episodes. Combined with recurrent anticyclonic conditions during summer, the inland setting can favor atmospheric stagnation and the accumulation of photochemically generated pollutants such as ozone.
The combination of a continental climate, an urban morphology conducive to heat accumulation, and the availability of long-term meteorological and air quality observations makes Valladolid an ideal case study for investigating heatwave conditions and the long-term variability of urban air pollutants. As a representative medium-sized European city, Valladolid provides valuable insights into the interactions between extreme heat events and urban atmospheric processes, contributing to a broader understanding of climate-related risks in similar urban settings.

2.2. Air Quality and Meteorological Data

This study is based on long-term air quality observations and meteorological observations collected in Valladolid, Spain, covering the period from 2006 to 2024. Hourly concentrations of particulate matter with an aerodynamic diameter smaller than 2.5 μm (PM2.5), nitrogen dioxide (NO2), and surface ozone (O3) were obtained from the Valladolid-Poniente air quality monitoring station, which forms part of the regional air quality monitoring network of Castile and Leon, managed by the City Council (RCCAVA), https://www.valladolid.es/es/rccava (accessed on 18 February 2026). Meteorological data on temperature, precipitation, and humidity were collected from Meteomanz.com, which retrieves its information from the National Oceanic and Atmospheric Administration (NOAA). The air quality station is located in an urban environment influenced by mixed residential and traffic-related emissions and is considered representative of general urban conditions in Valladolid. Pollutant concentrations are expressed in micrograms per cubic meter (µg m−3) and are accompanied by timestamp information and quality control flags, allowing for consistent long-term analysis. The selected pollutants are widely used indicators of urban air quality and are strongly linked to meteorological variability, photochemical processes, and adverse health effects [29,30]. Previous studies have demonstrated that long-term temporal trends and meteorology-pollution relationships can be robustly assessed using single-station datasets when spatial homogeneity and extended temporal coverage are ensured [8]. The focus on temporal variability rather than spatial gradients supports the suitability of this approach for the objectives of the present study. While the overall study period spans 2006–2024, continuous NO2 and PM2.5 observations only became fully available in later years, resulting in slight differences in temporal coverage among pollutants. O3 observations were available for 2006–2024, whereas NO2 and PM2.5 datasets covered 2008–2024 and 2009–2024, respectively. Missing or invalid observations identified during preprocessing were removed prior to statistical analysis.

2.3. Data Processing and Analytical Workflow

All data processing, statistical analysis, and visualization were conducted using Python (version 3.13.5) within a Jupyter Notebook environment. Data handling and time-series manipulation were performed using the panda’s library (version 2.2.3) [30]. Numerical computations and statistical analyses were implemented using NumPy (version 2.1.3), while visualizations were produced using Matplotlib (version 3.10.0). This scripted workflow ensured transparency, reproducibility, and traceability of all analytical steps. Intermediate datasets, processed outputs, and final figures were automatically saved to structured directories. Initial data preprocessing involved the standardization of column names, conversion of date and time fields to datetime format, and transformation of pollutant concentration fields into numerical values. Records containing missing, invalid, or non-numeric entries were removed to ensure data integrity. Observations were subsequently ordered chronologically prior to analysis. These quality control procedures follow established best practices in atmospheric and environmental data analysis and are essential for minimizing uncertainties associated with measurement gaps and inconsistencies [29,31,32]. Following standard practice in atmospheric science and air-quality assessment, temporal aggregation of pollutant concentrations was performed using arithmetic averaging. Daily mean concentration C ¯ d was calculated using Equation (1):
C ¯ d = 1 n d i = 1 n d C i
where C i   is the individual pollutant concentration measured at observation i, and nd is the number of observations for that day. Monthly and annual mean concentrations were computed analogously by averaging hourly values within each calendar month and year. Temporal aggregation reduces short-term variability and enhances the detection of seasonal and long-term patterns. Figure 2 presents a conceptual representation of the atmospheric and meteorological processes associated with heatwave persistence and pollutant accumulation in Valladolid. The schematic highlights the potential influence of elevated temperatures, atmospheric stability, and reduced dispersion on ozone formation and urban air-quality variability during prolonged summer episodes.

2.4. Heatwave Identification

Extreme heat events were identified using daily maximum air temperature (Tmax) as the primary indicator of thermal stress. A heatwave day was defined when Tmax exceeded the 95th percentile of the local summer temperature distribution (June–September) during the study period (2006–2024). Heatwave events were subsequently identified as periods of at least three consecutive heatwave days. This percentile-based approach accounts for local climatic variability and is widely applied in climatological studies to identify persistent extreme thermal conditions [2,24]. Identified heatwave periods were subsequently compared with non-heatwave summer conditions to evaluate potential differences in pollutant behavior under elevated thermal stress. High-ozone conditions were evaluated using the European Union target value for surface ozone, defined as a maximum daily eight-hour mean (MDA8) concentration exceeding 120 µg m−3, in accordance with Directive 2008/50/EC [30]. The MDA8 threshold was used in the present study as a general reference indicator of elevated ozone conditions rather than as a formal regulatory compliance assessment. Periods of enhanced ozone accumulation were therefore identified in relation to meteorological variability and heatwave occurrence during the study period defined in Equation (2), where ozone concentrations surpassed the European Union target value for the maximum daily 8 h mean.
O3 > 120 µg m−3

2.5. Statistical Analysis

Basic descriptive statistics were calculated for PM2.5, NO2, and O3, including mean values, standard deviations, and minimum and maximum concentrations. Variability in atmospheric variables is commonly quantified using the standard deviation, defined as expressed in Equation (3):
σ d = 1 n d i = 1 n d C i     C ¯ d 2
where C ¯ d is the mean concentration for day, d, C i is the individual pollutant concentration measured at observation i, and nd is the number of observations for that day. Inter-seasonal variability was examined using monthly mean concentrations to assess seasonal differences and the impact of meteorological conditions and anthropogenic activity on pollutant behavior. Long-term trends in air pollutant concentrations were assessed using linear regression applied to annual mean time series as expressed in Equation (4):
C ( t )   =   β 0 +   β 1 t +   ε
where C(t) represents the annual mean concentration in year, β 0 is the intercept, β1 is the slope coefficient representing the rate of change of concentration over time, and ε is the residual error term. The goodness-of-fit of the regression models was evaluated using the coefficient of determination R2. To assess potential common emission sources and shared atmospheric processes, the linear association between PM2.5 and NO2 concentrations was evaluated using the Pearson correlation coefficient, as calculated in Equation (5):
r = i = 1 n C P M 2.5 , i   C ¯ P M 2.5   C N O 2 , i C ¯ N O 2   i = 1 n C P M 2.5 , i   C ¯ P M 2.5 2   i = 1 n C N O 2 , i   C ¯ N O 2 2
High positive correlation values indicate shared emission sources, such as vehicular traffic, while weaker correlations may reflect differing source contributions or atmospheric transformation processes. Pearson correlation analysis and linear regression were additionally applied to evaluate relationships between maximum daily temperature and pollutant concentrations, particularly ozone during warm-season conditions, following standard statistical approaches commonly used in atmospheric science research [32,33]. Statistical significance was evaluated at the 95% confidence level.

2.6. Heatwave-Air Quality Comparison

In order to evaluate the influence of extreme heat on urban air quality, ozone concentrations recorded during identified heatwave periods were compared with concentrations observed during non-heatwave summer days. Comparative analysis was performed using descriptive statistics and graphical visualization to assess changes in ozone behavior under elevated thermal conditions.

3. Results

3.1. Heatwave Characteristics and Temperature Variability

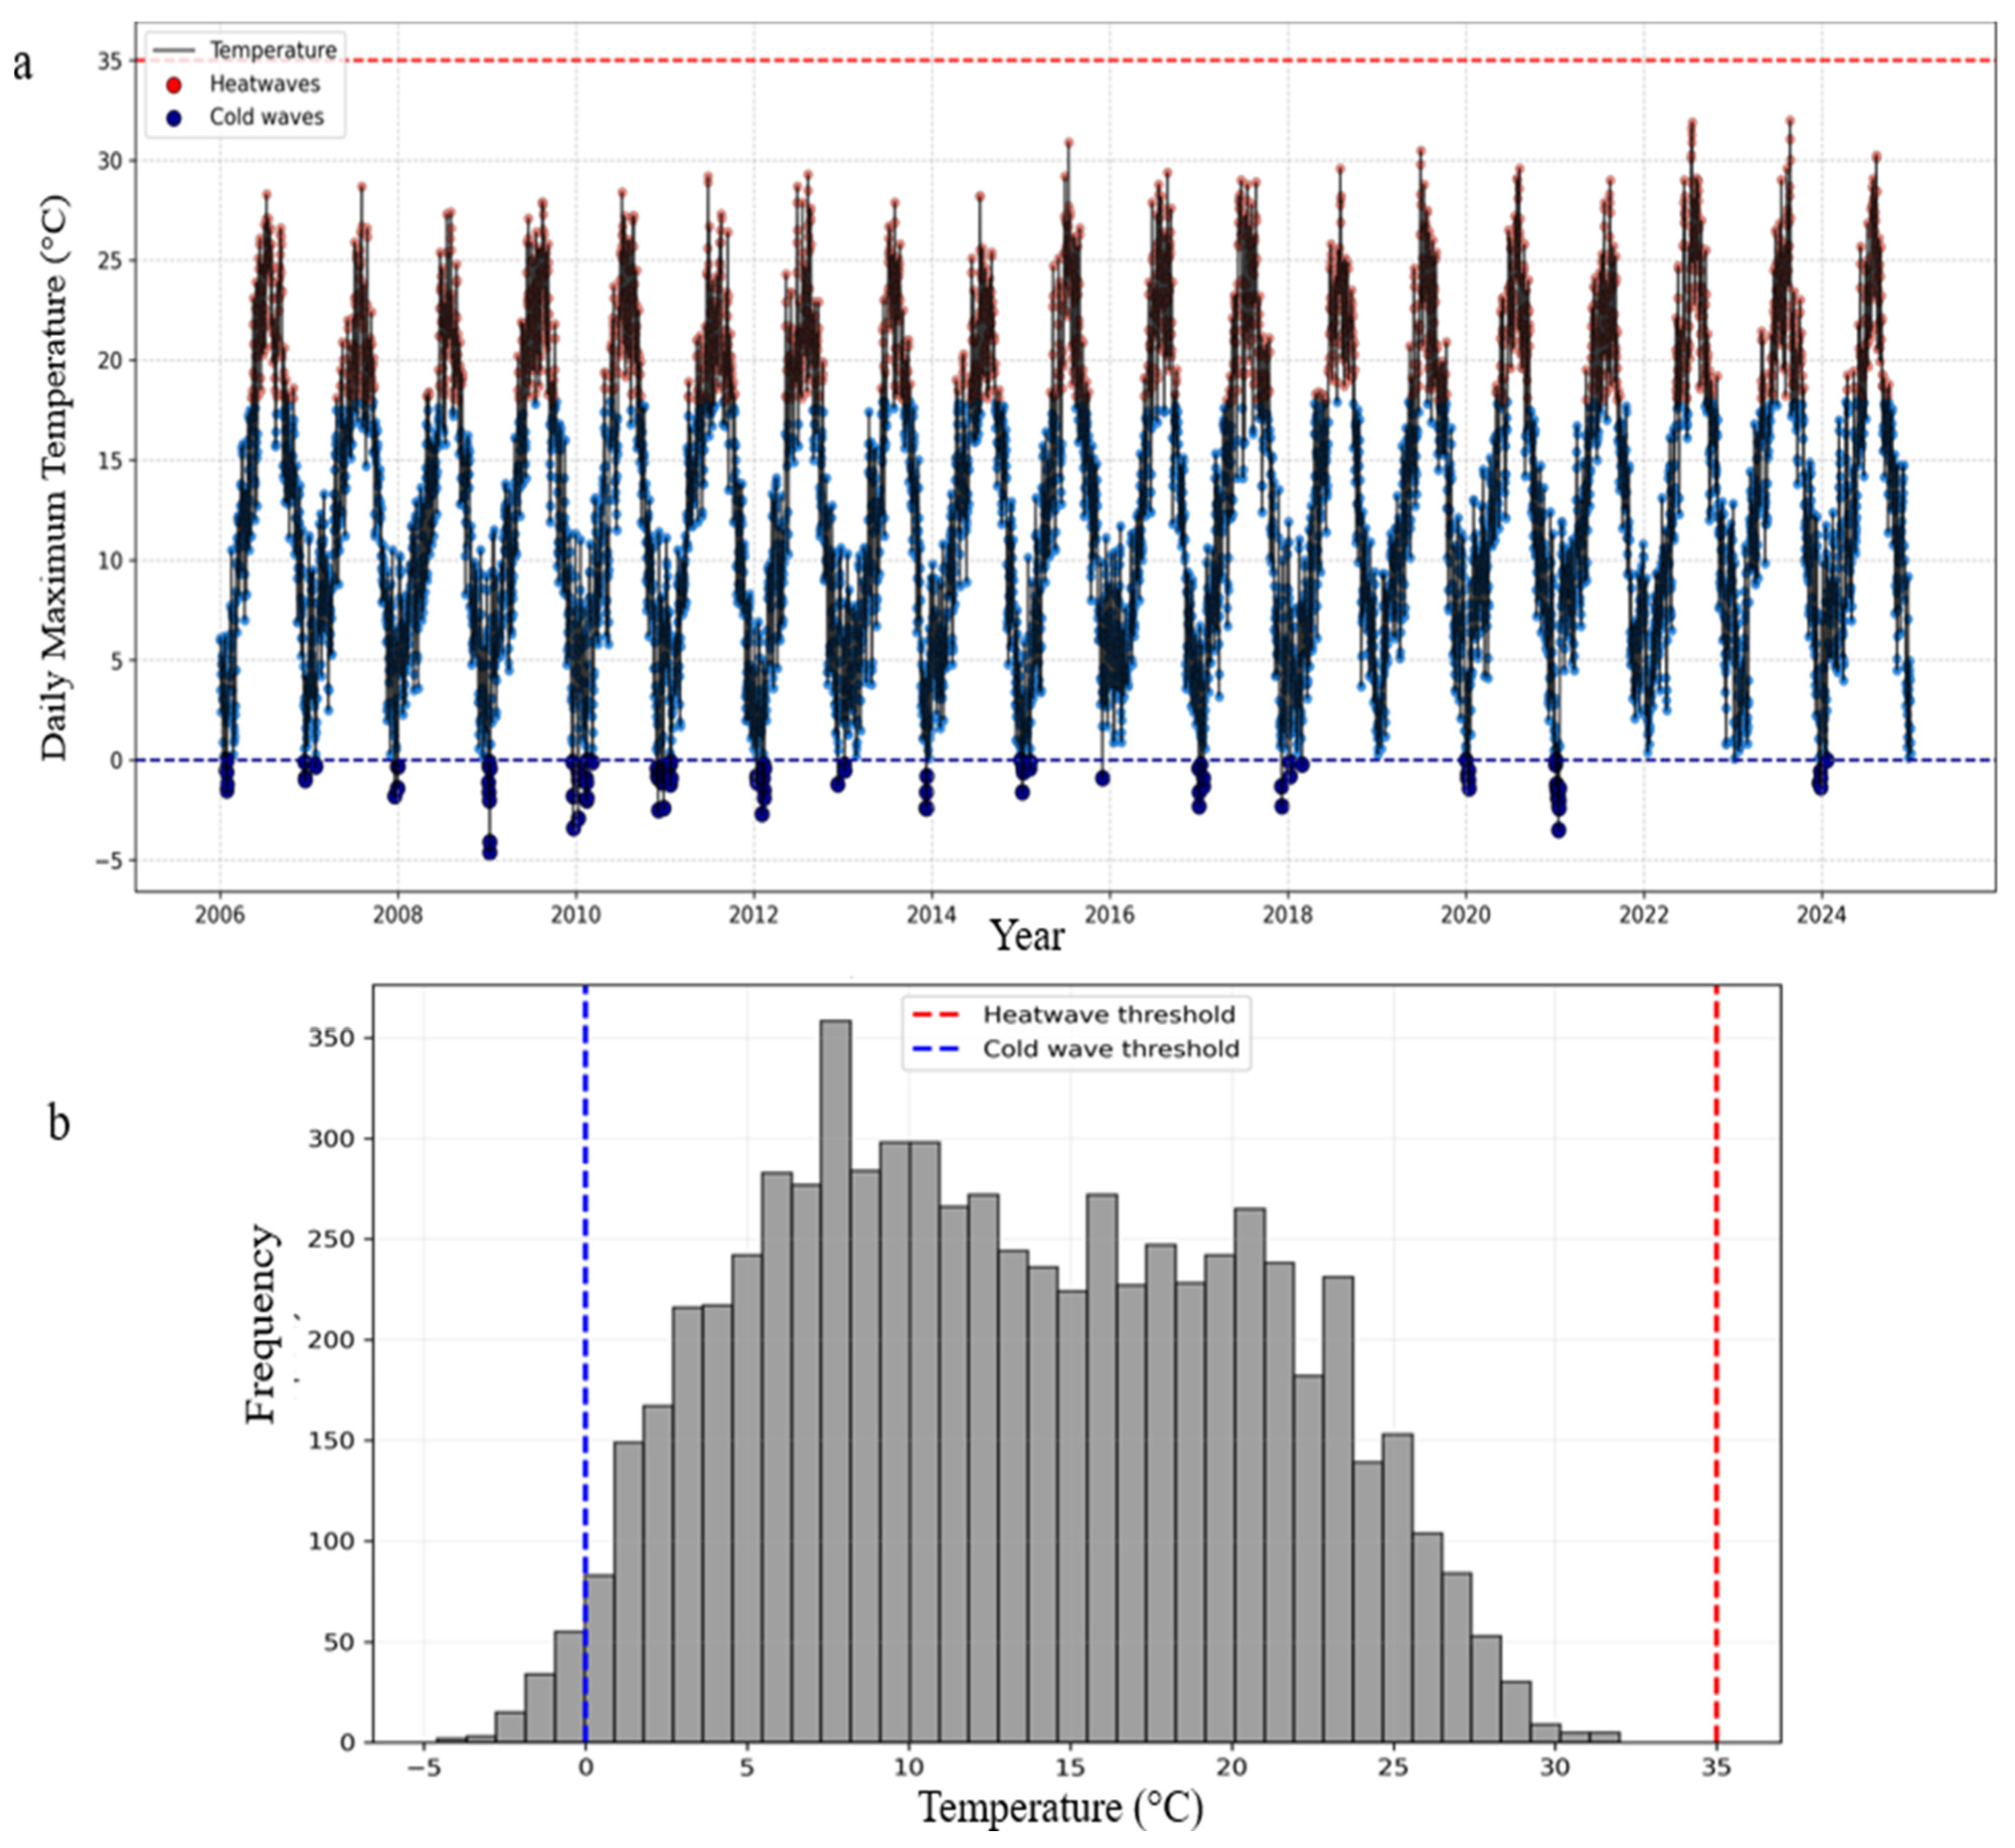
Analysis of extreme temperature events in Valladolid between 2006 and 2024 indicates an increase in the persistence, duration, and regional extent of heatwave episodes over time. Earlier heatwave events—particularly those identified during the first years of the study period—were generally shorter and spatially less extensive. In contrast, several episodes observed after 2015 exhibited longer durations and affected broader areas across the Iberian Peninsula. The 2022 heatwave was one of the most prolonged events identified during the study period, persisting for approximately eighteen consecutive days and affecting numerous Spanish provinces. Heatwaves are becoming more frequent and intense under ongoing climate change conditions, and have major consequences for urban air quality and heat-related mortality [3]. Figure 3a illustrates the temporal occurrence of identified heatwave events throughout the study period. The distribution of events indicates that prolonged heatwave episodes became more frequent during the later years of the record, although substantial interannual variability remains evident. Figure 3b presents the long-term temperature distribution for Valladolid during the same period. Most temperature observations remain concentrated within moderate thermal ranges, while the upper tail of the distribution reflects episodic high-temperature extremes associated with heatwave conditions. The characteristics of the identified heatwave episodes are summarized in Table 1, including their timing, duration, and reported spatial extent during the study period.
Provincial heatwave extent information was compiled from official heatwave reports published by the Spanish Meteorological Agency (AEMET). Results indicate that prolonged heatwave episodes became more common after 2015, with several events lasting beyond one week and affecting large areas of the Iberian Peninsula. This pattern is broadly consistent with previous studies reporting increasing summer heatwave activity across inland regions of southern Europe [24].

3.2. Extreme Events and Ozone Analysis

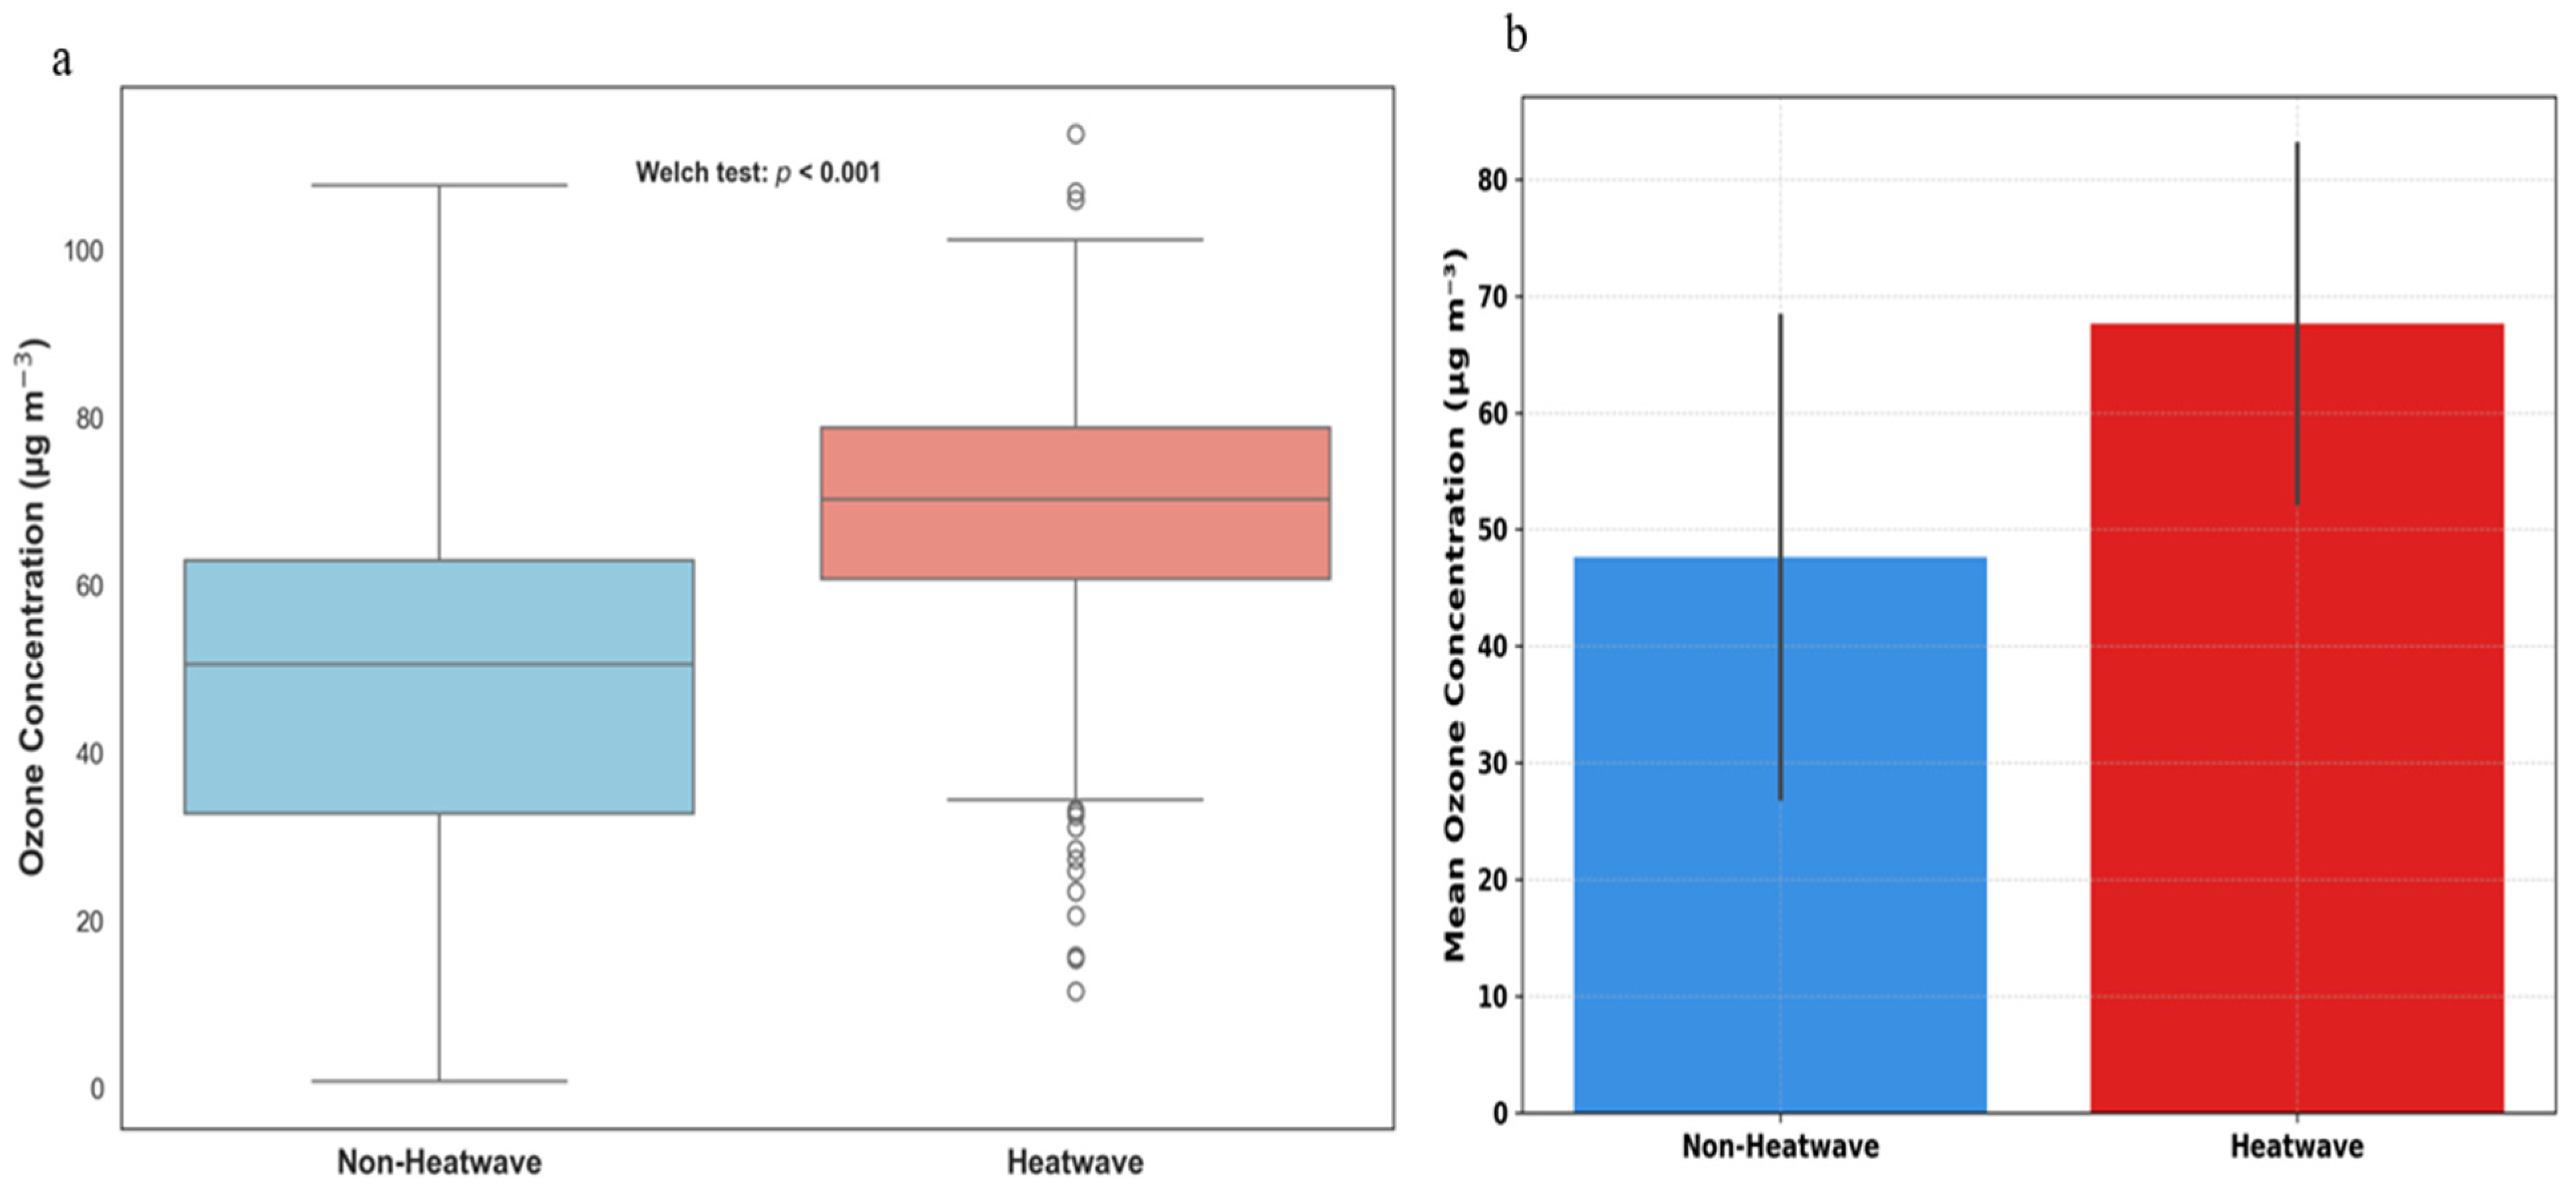
Figure 4a shows a clear difference in ozone behavior between heatwave and non-heatwave conditions. Ozone concentrations during heatwave periods were generally higher and more variable than those observed during non-heatwave days. Median ozone concentrations increased noticeably during heatwave events, while the upper range of the distribution became more pronounced, indicating more frequent occurrences of elevated ozone levels under extreme thermal conditions. In contrast, non-heatwave periods exhibited lower concentrations and a narrower distribution, reflecting comparatively more stable atmospheric conditions. The higher ozone concentrations observed during heatwave periods are consistent with enhanced photochemical activity under elevated temperatures and persistent summer atmospheric stability. Reduced atmospheric mixing and limited pollutant dispersion during these episodes likely favored the accumulation of ozone and its precursors near the surface. Figure 4b further supports this behavior by showing higher mean ozone concentrations during heatwave days compared with non-heatwave conditions. Error bars shown in Figure 4b represent standard deviations, while Table 2 summarizes the descriptive statistics for both groups. Mean ozone concentrations during heatwave days reached 67.62 ± 15.32 µg m−3 (n = 336), compared with 47.63 ± 20.60 µg m−3 during non-heatwave conditions (n = 6381). Welch’s two-sample t-test indicated that the difference between the two groups was statistically significant (t = 22.86, p < 0.001). Taken together, Figure 4a,b indicates that heatwave conditions are associated with increased ozone accumulation in Valladolid during the warm season, although meteorological variability explains only part of the observed ozone variability.

3.3. Temperature-Ozone Relationship

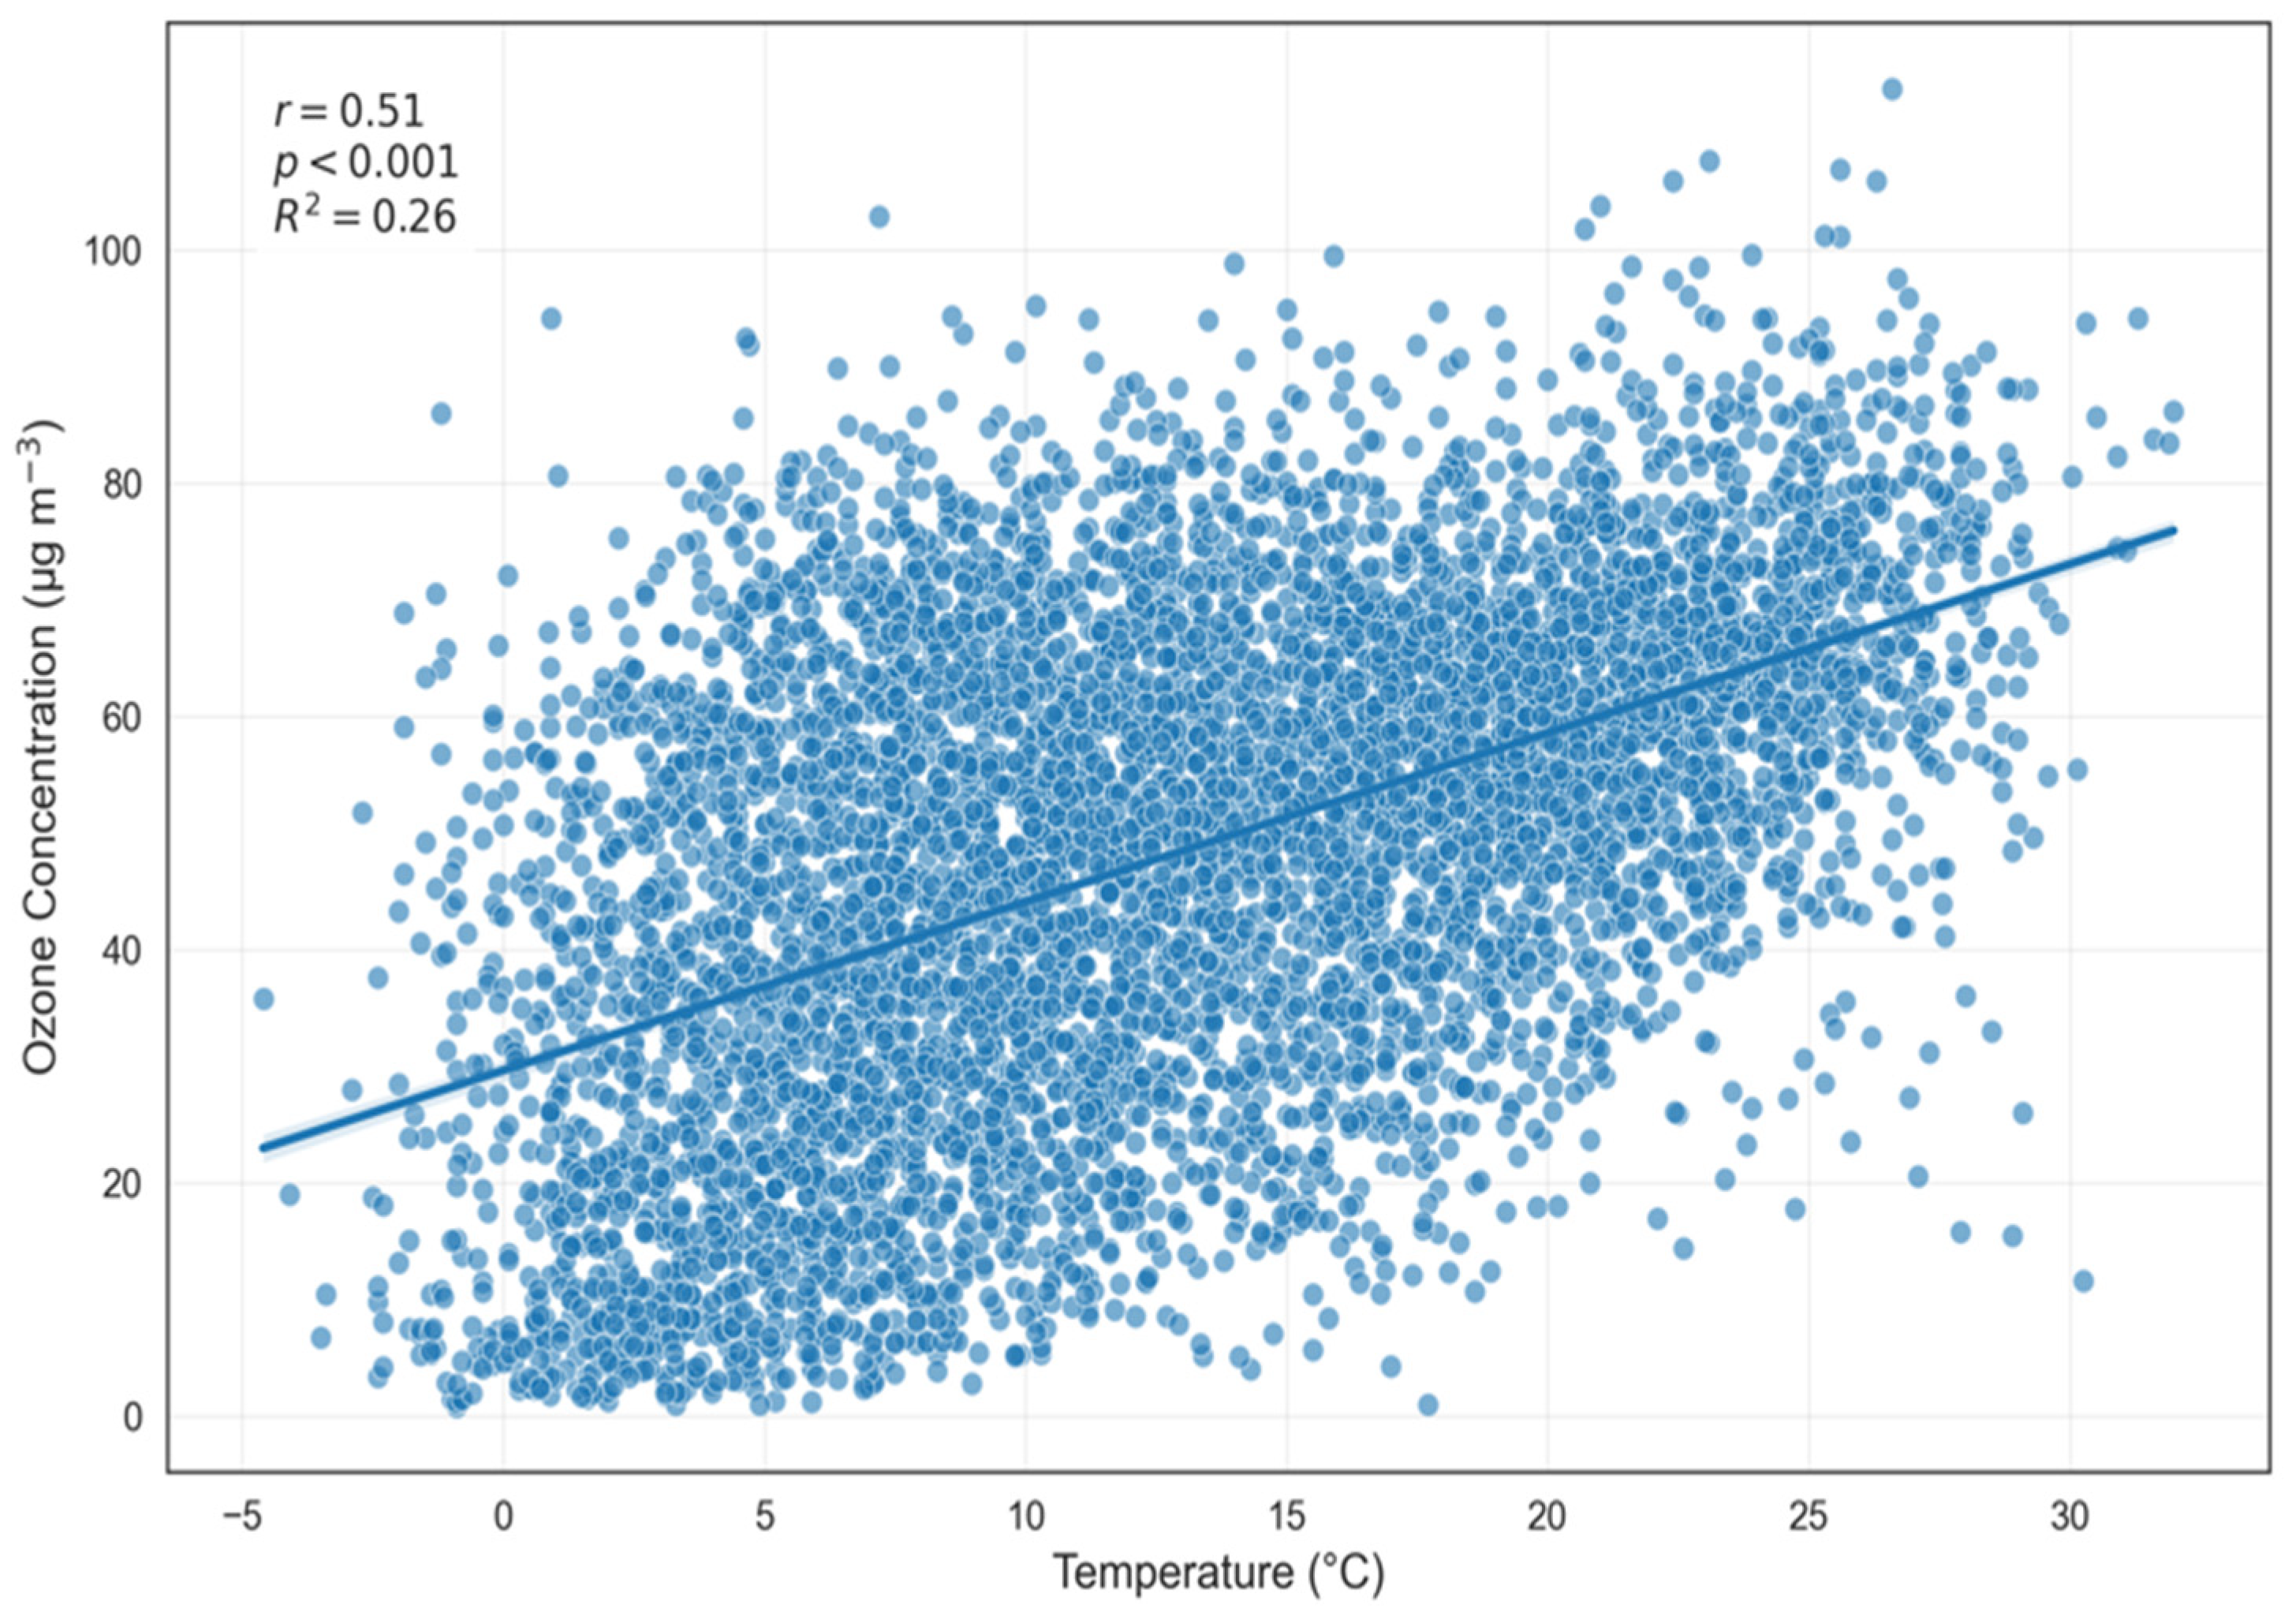
The relationship between temperature and ozone concentration is presented in Figure 5. The scatterplot and regression analysis show a positive association between air temperature and ozone variability, indicating that ozone concentrations generally increase under warmer atmospheric conditions. Pearson correlation analysis revealed a moderate positive and statistically significant relationship between temperature and ozone concentrations (r = 0.51, p < 0.001). Linear regression analysis also produced a coefficient of determination of R2 = 0.26, indicating that approximately 26% of the observed ozone variability can be explained by variations in temperature alone. The regression line displayed a consistent upward trend, confirming the tendency for higher ozone concentrations to occur during warmer atmospheric conditions. The results therefore suggest that elevated thermal conditions contribute to ozone variability in Valladolid, particularly during persistent summer heat episodes.

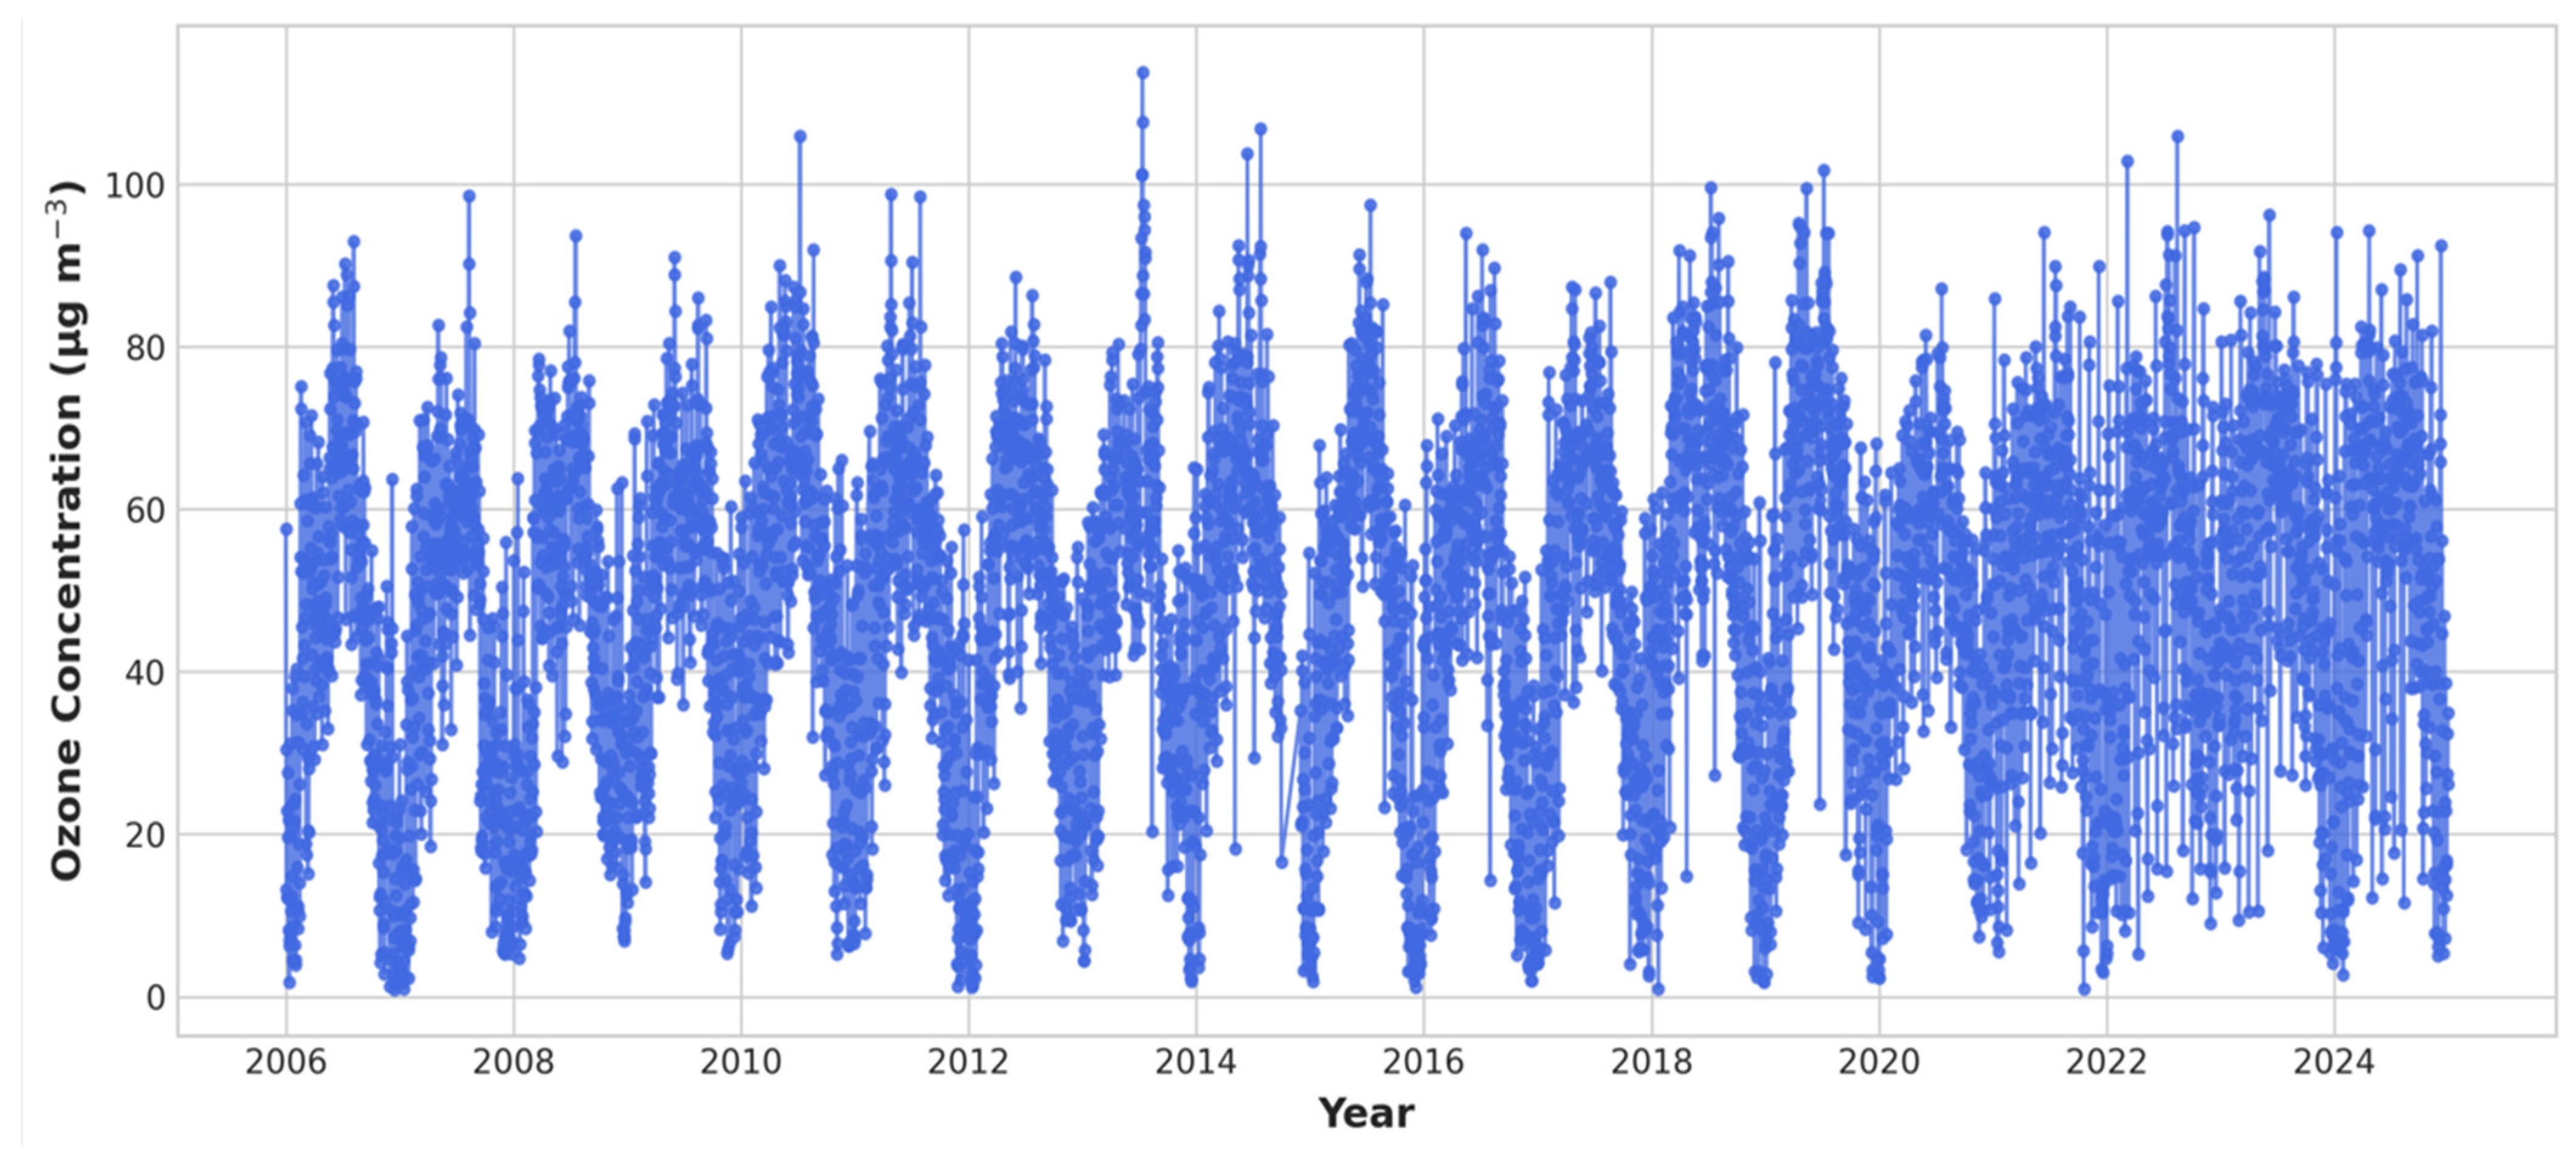
3.4. Temporal Variability of Ozone in Valladolid

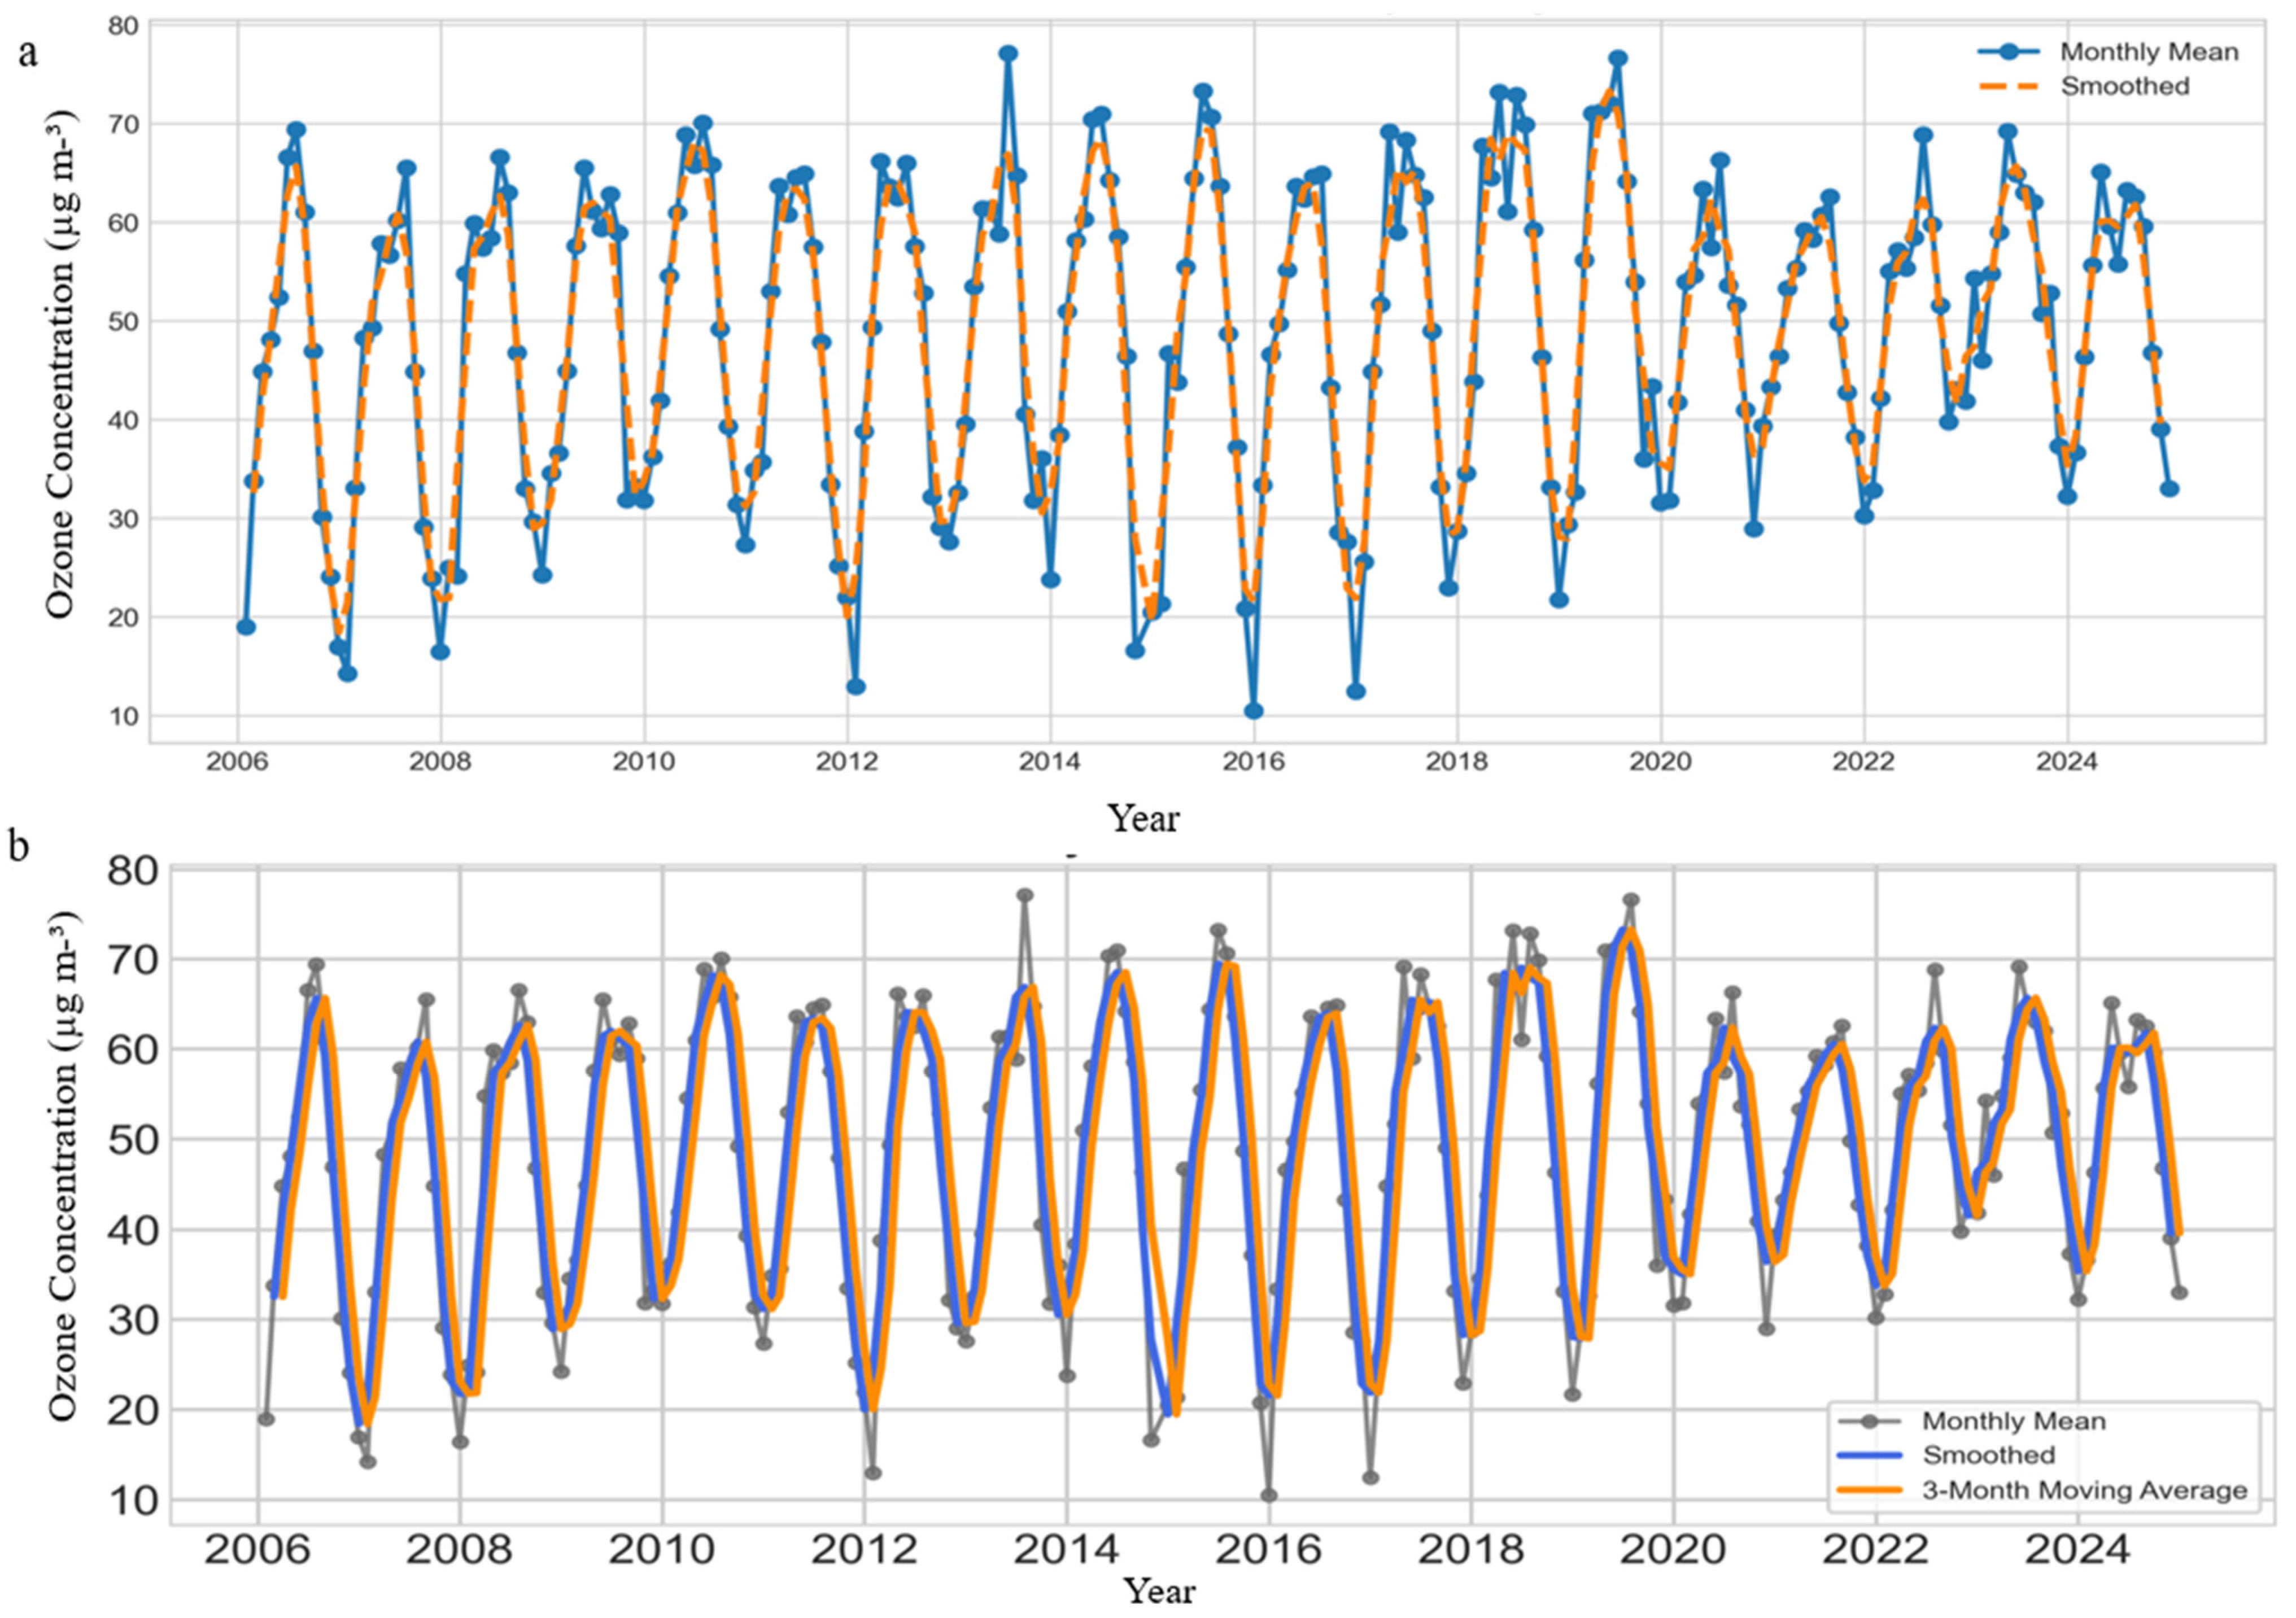
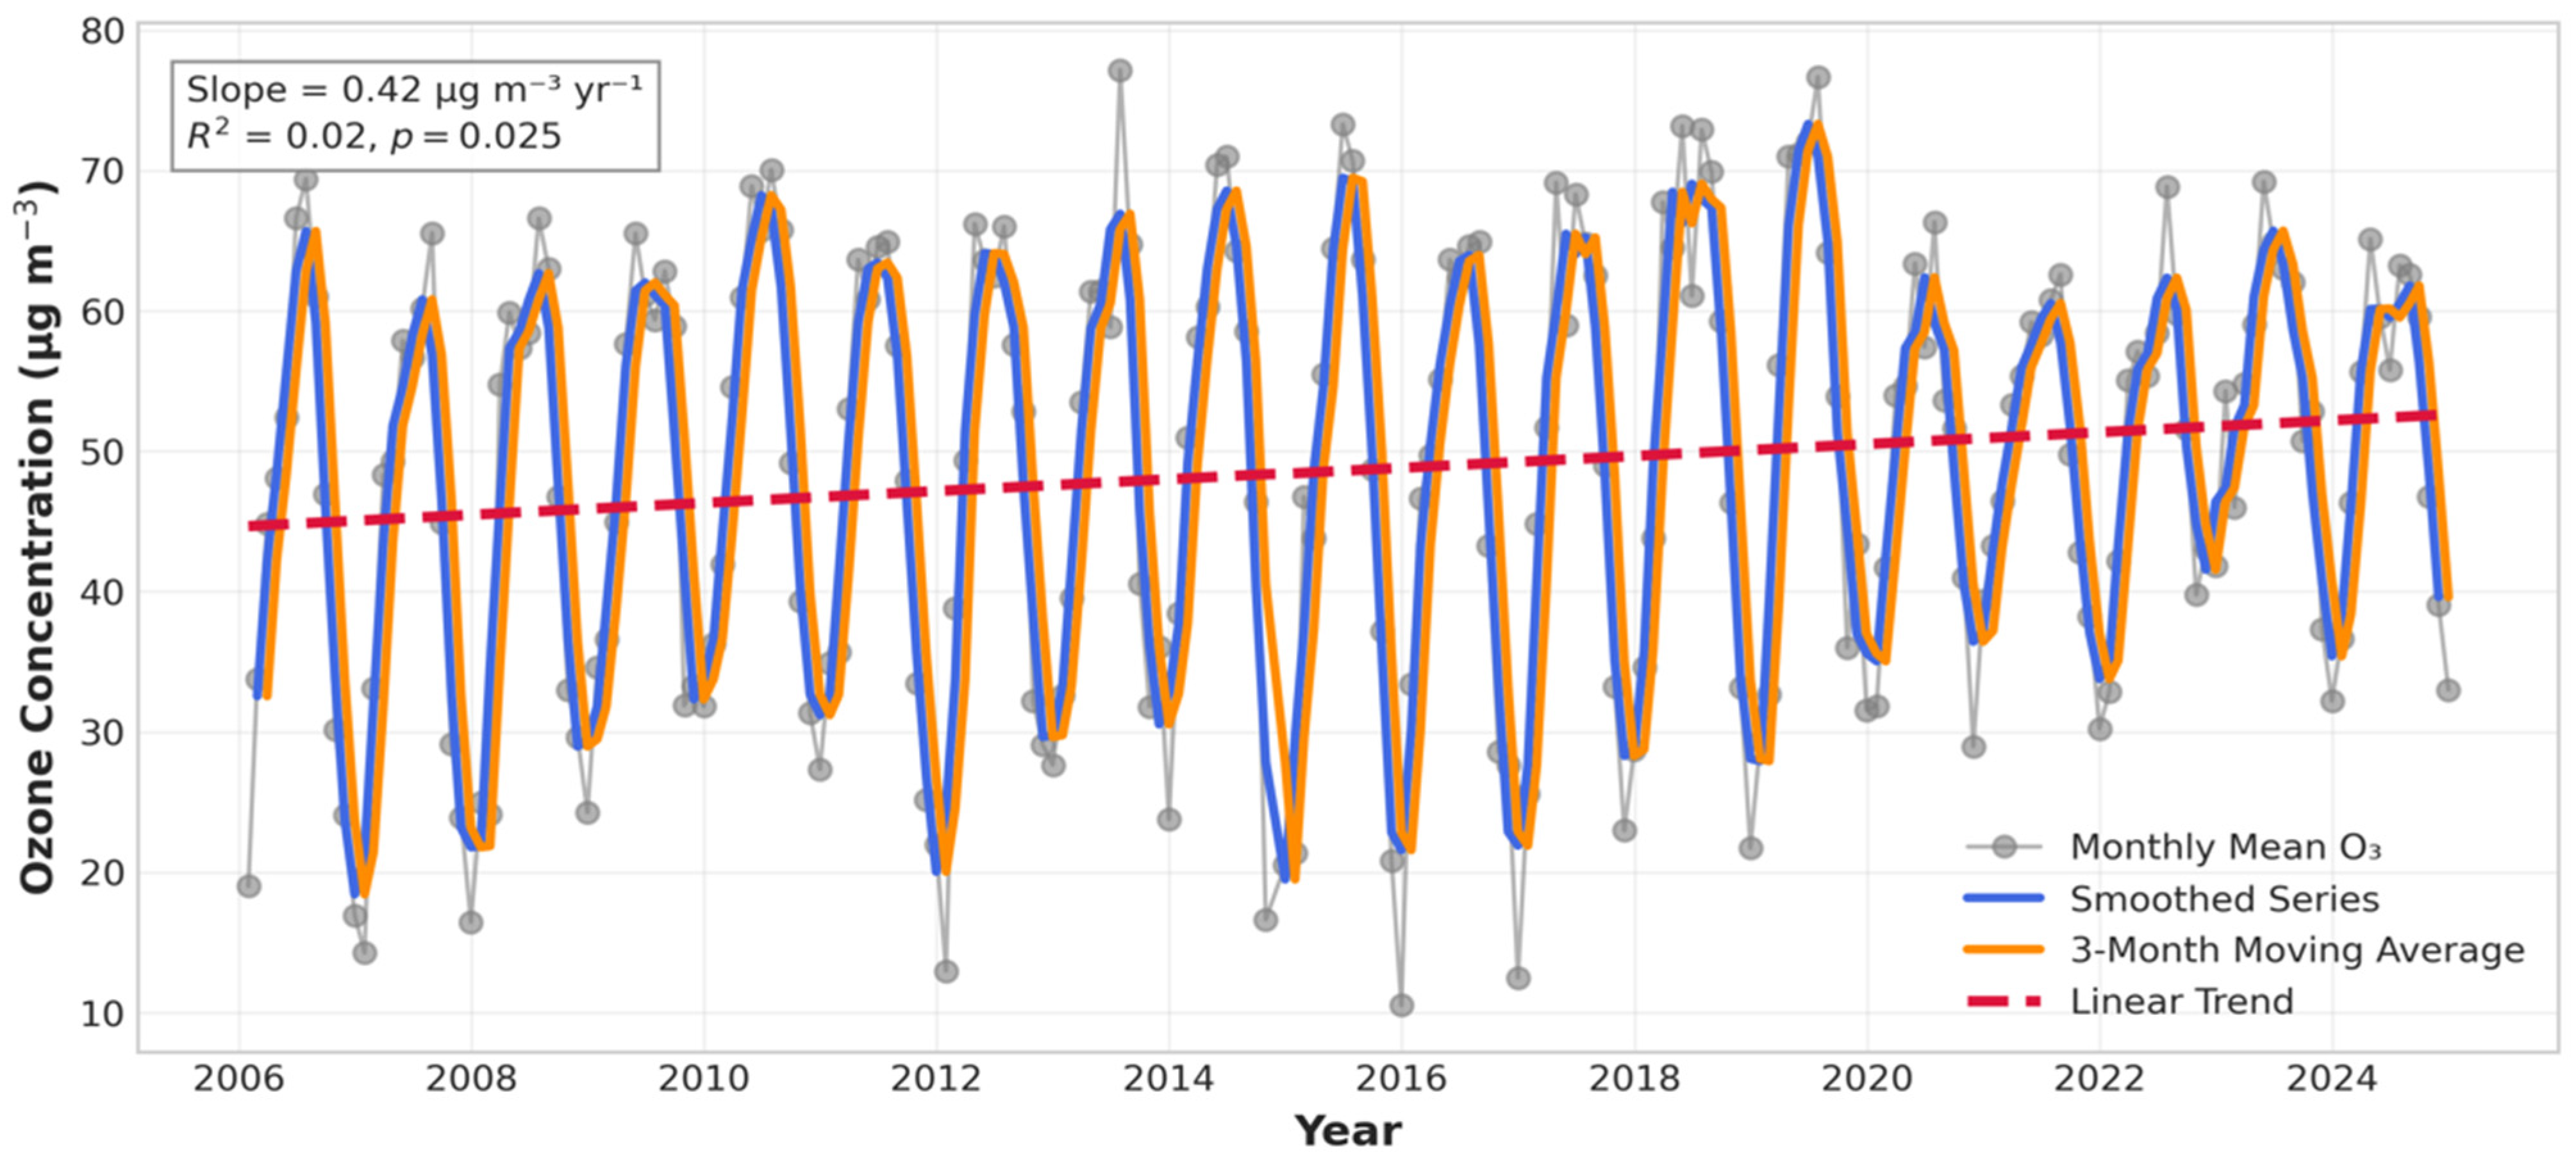
The daily ozone time series in Valladolid (Figure 6) reveals pronounced short-term variability characterized by recurrent high-concentration episodes, particularly during the warm season. These periods generally coincide with elevated temperatures and enhanced solar radiation—conditions that favor photochemical ozone formation. Only a limited number of daily ozone episodes approached or exceeded the European Union MDA8 target value during the study period, indicating that regulatory exceedance conditions were relatively uncommon in Valladolid. Hence, the persistence of elevated summer concentrations indicates that meteorological conditions play an important role in shaping ozone variability in the urban environment. Figure 7a shows a clear seasonal cycle in monthly ozone concentrations, with higher values during late spring and summer and lower concentrations during winter. Considerable interannual variability is also evident, reflecting the combined influence of meteorological conditions and precursor emissions. To better highlight the underlying temporal behavior, Figure 7b presents a 3-month moving average, which reduces short-term fluctuations and clarifies the persistence of the seasonal cycle throughout the study period. The smoothed series also suggests a slight long-term increase in ozone concentrations despite reductions in primary pollutant emissions, indicating the growing importance of climatic and meteorological influences on urban ozone formation. The long-term ozone trend presented in Figure 8 indicates a slight increase in monthly mean ozone concentrations during the study period, although substantial interannual variability remains evident. Linear regression analysis indicates a modest positive trend of approximately 0.42 µg m−3 yr−1 (R2 = 0.022, p = 0.025). Despite the statistical significance of the trend, the low coefficient of determination suggests that long-term linear change explains only a small fraction of the observed ozone variability. This behavior is consistent with the impact of meteorological variability and photochemical processes on urban ozone dynamics in inland environments.

3.5. Variability of Nitrogen Dioxide and Particulate Matter

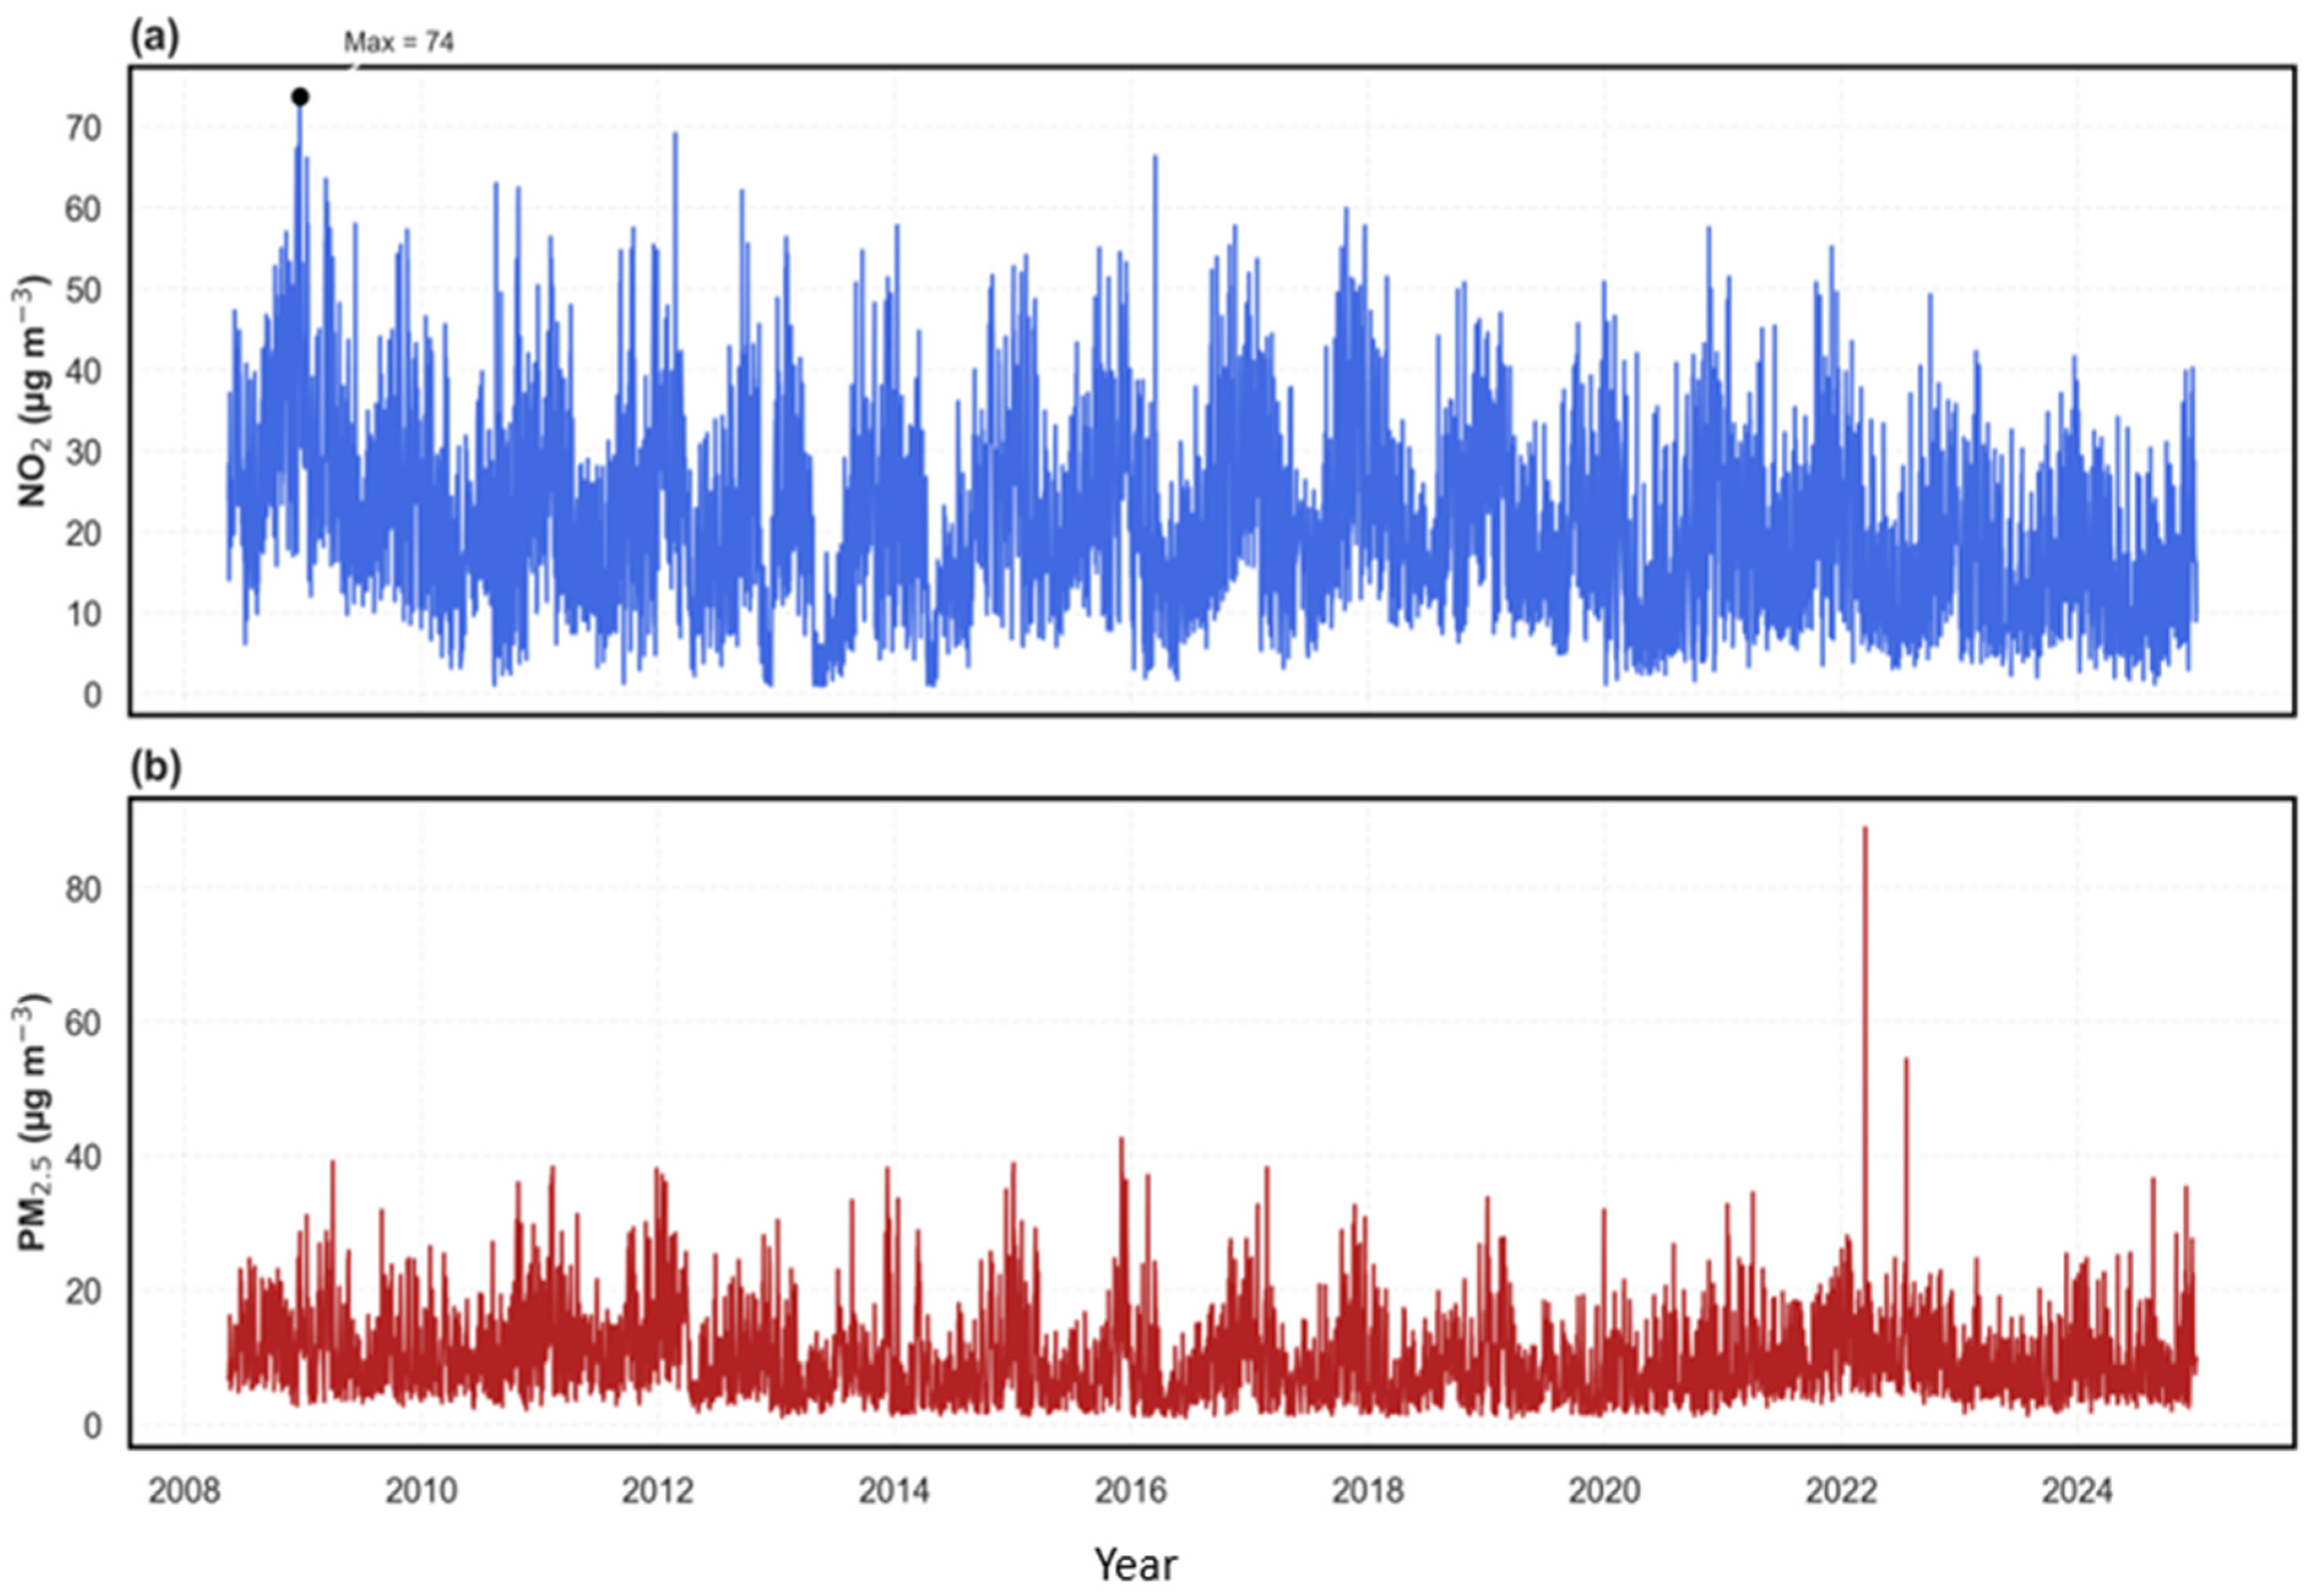
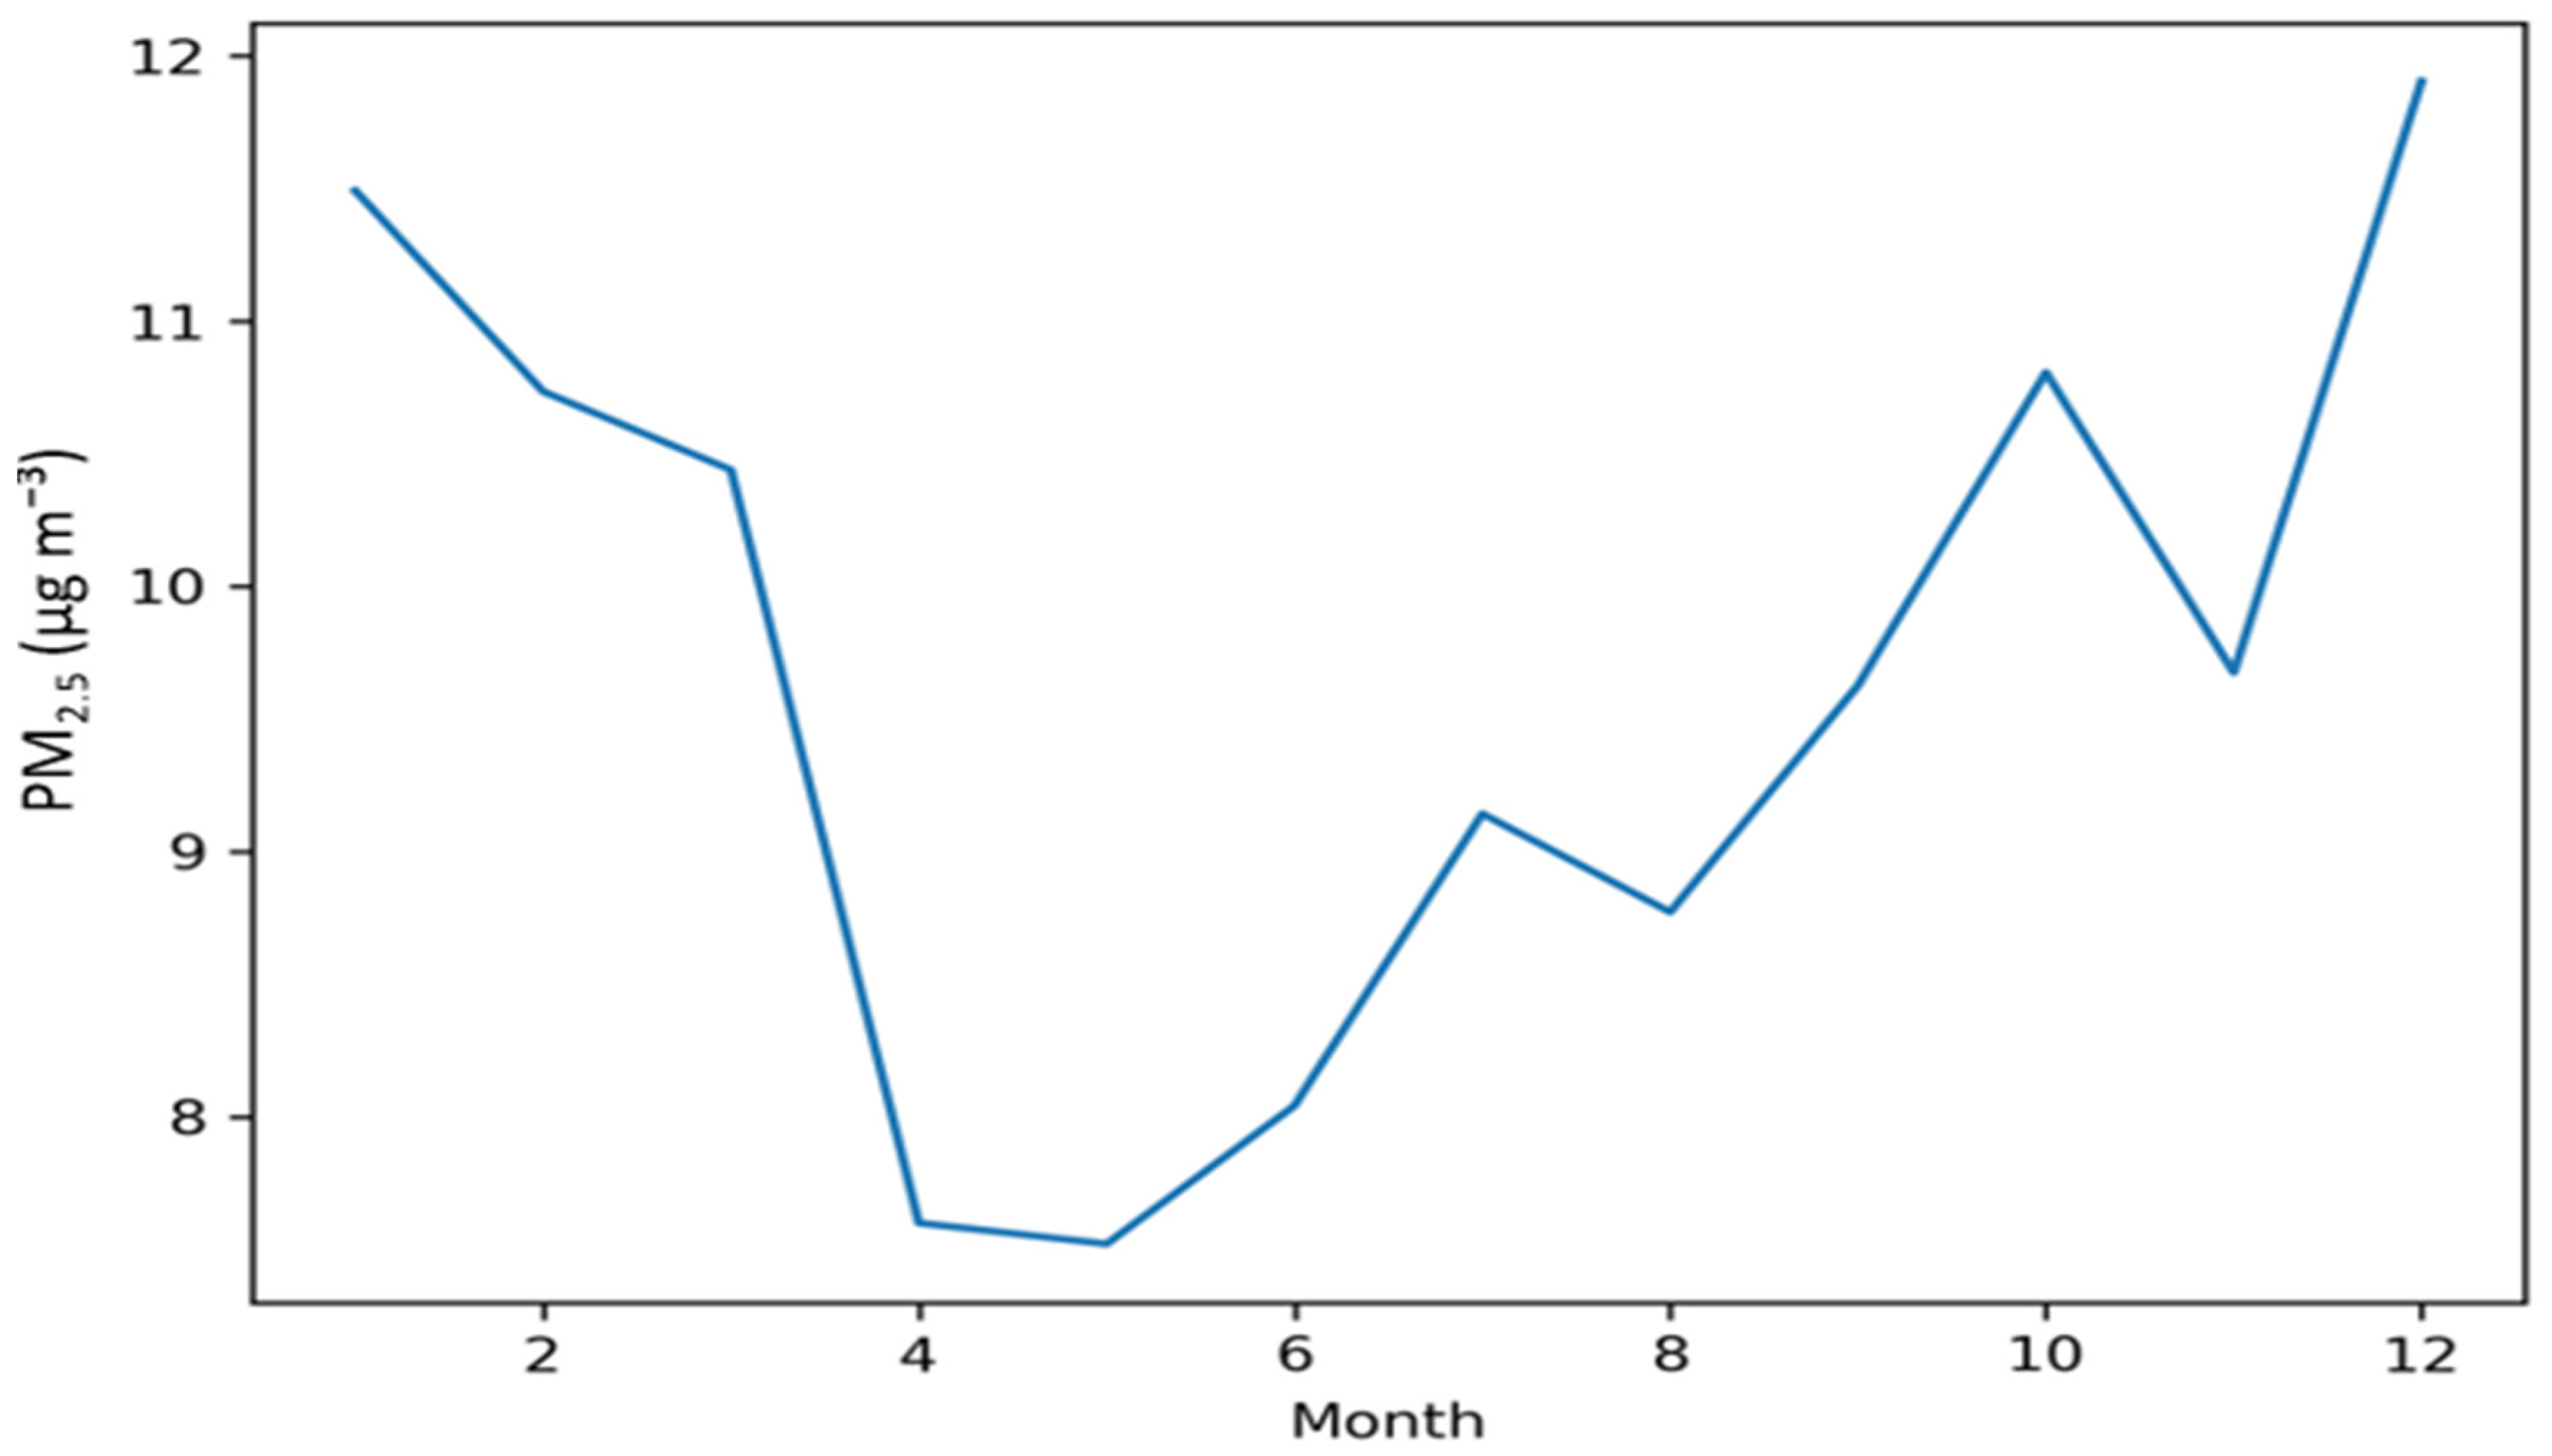
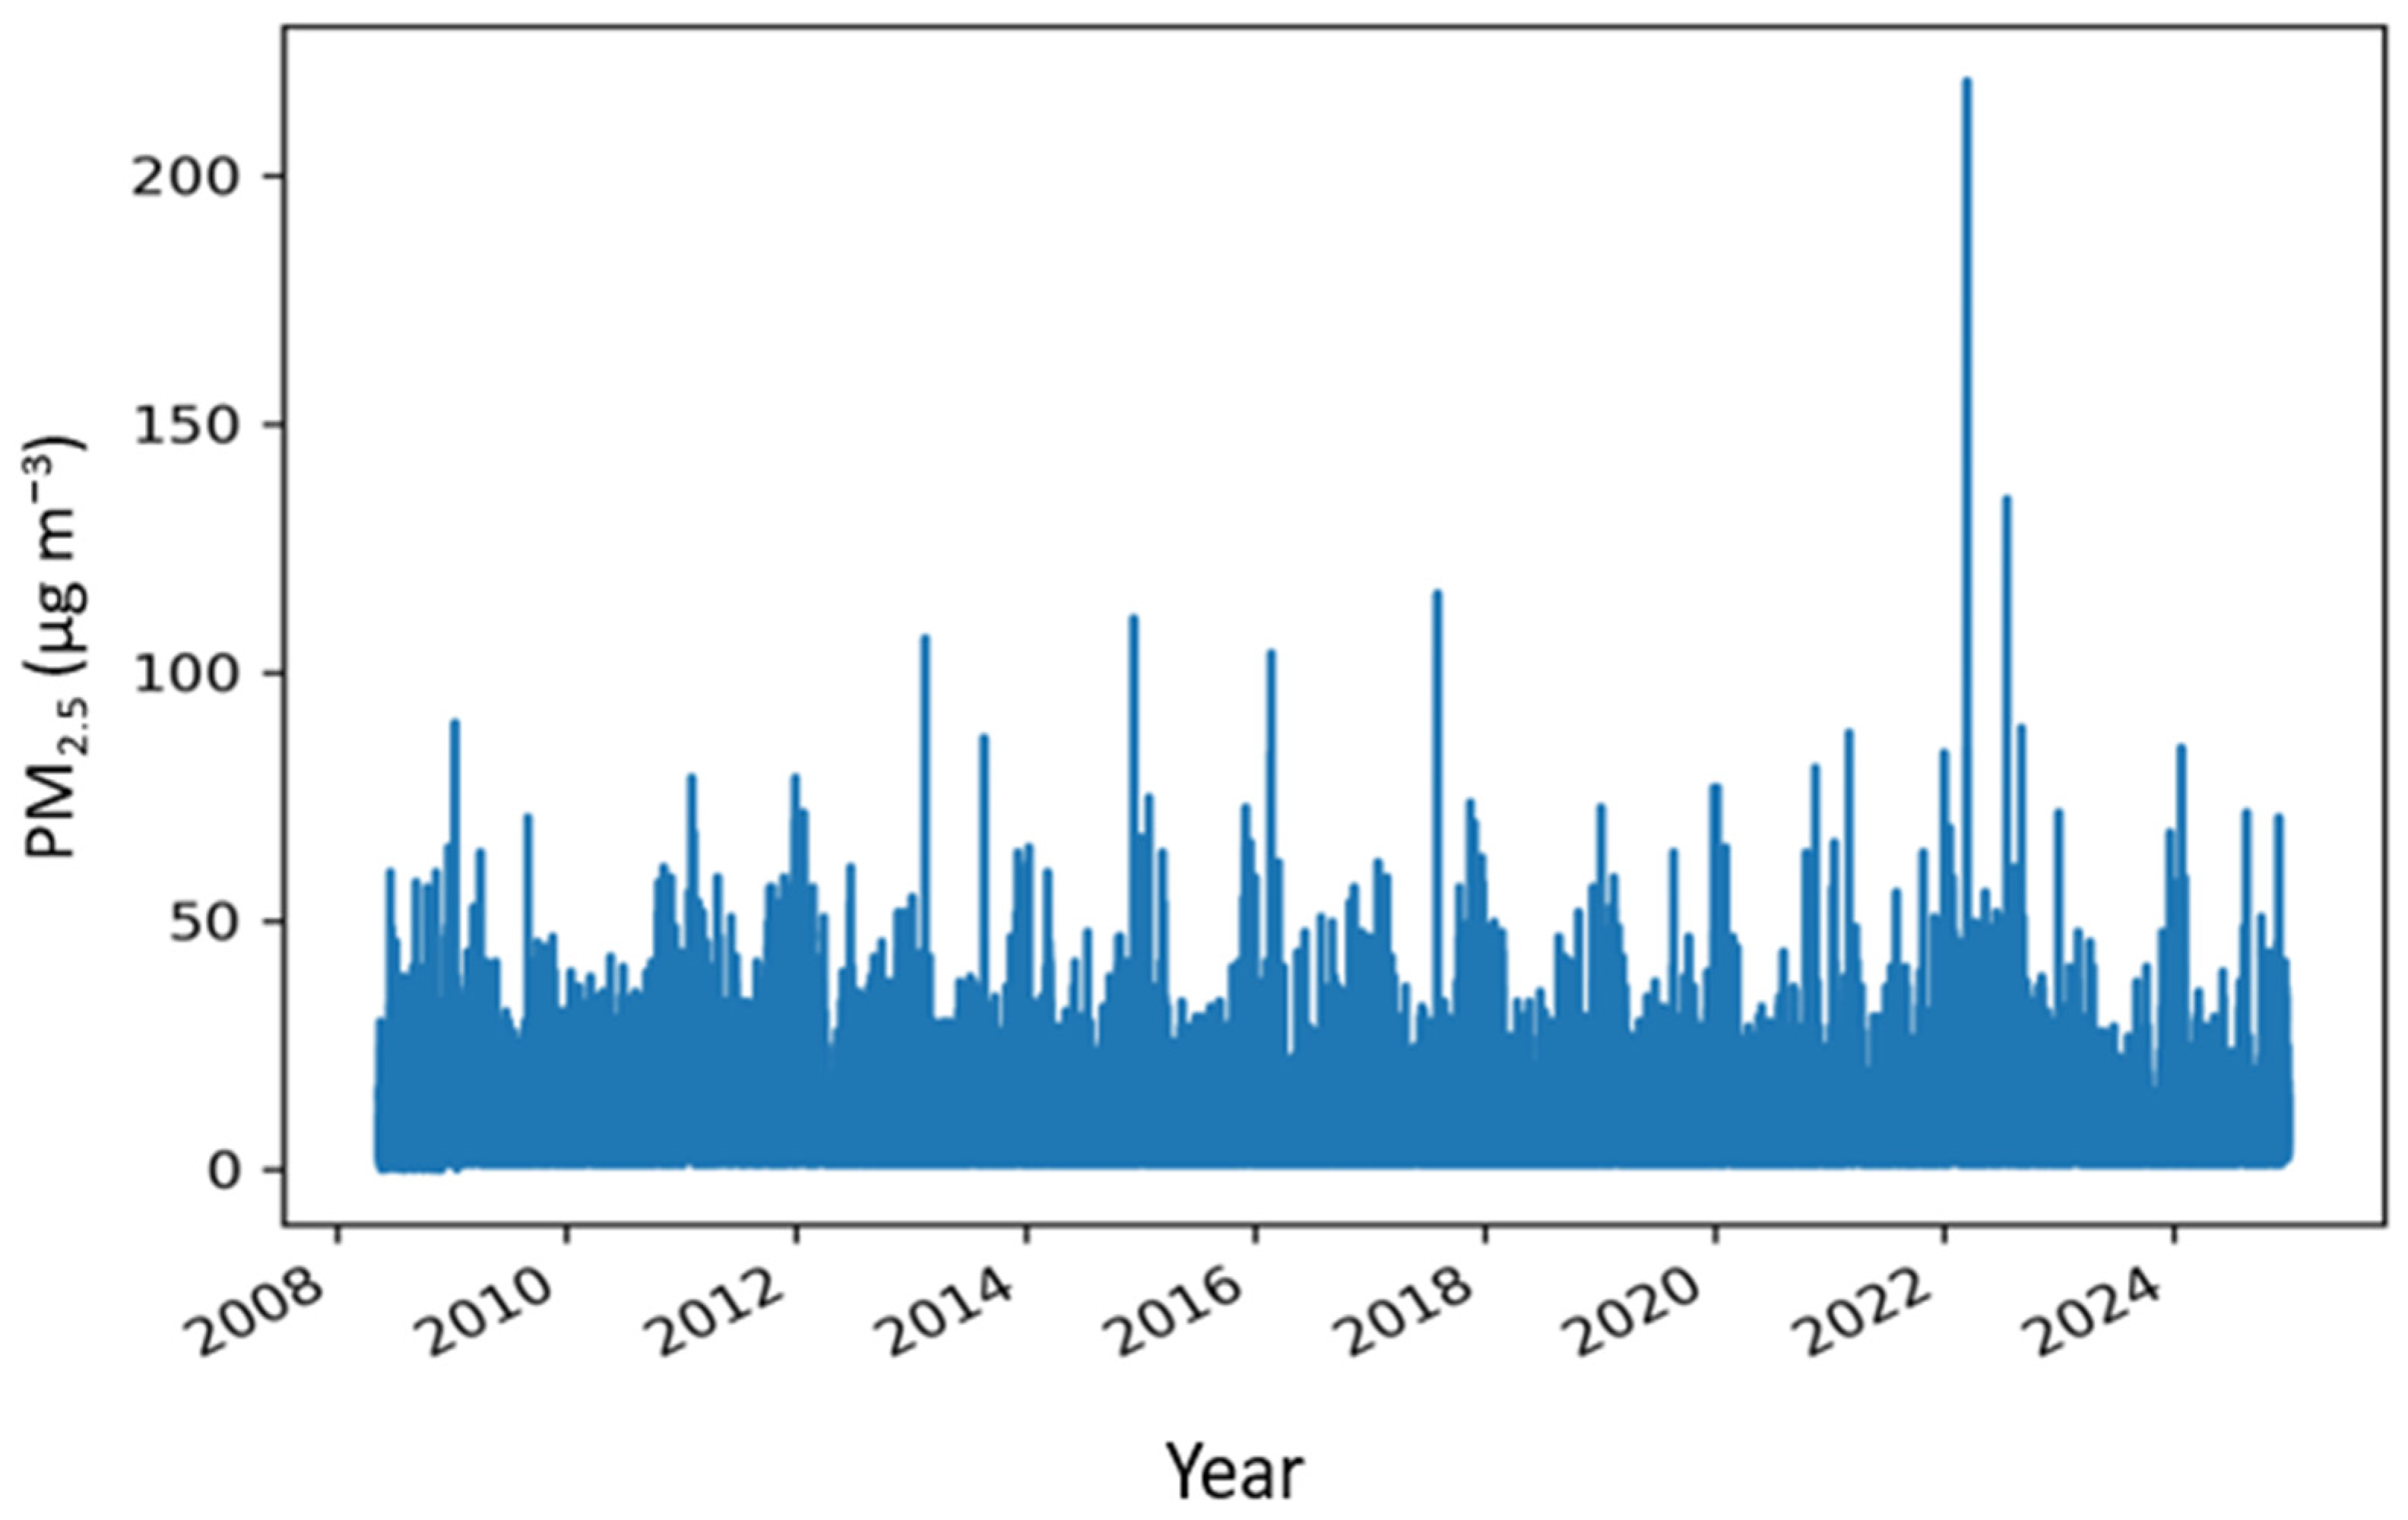
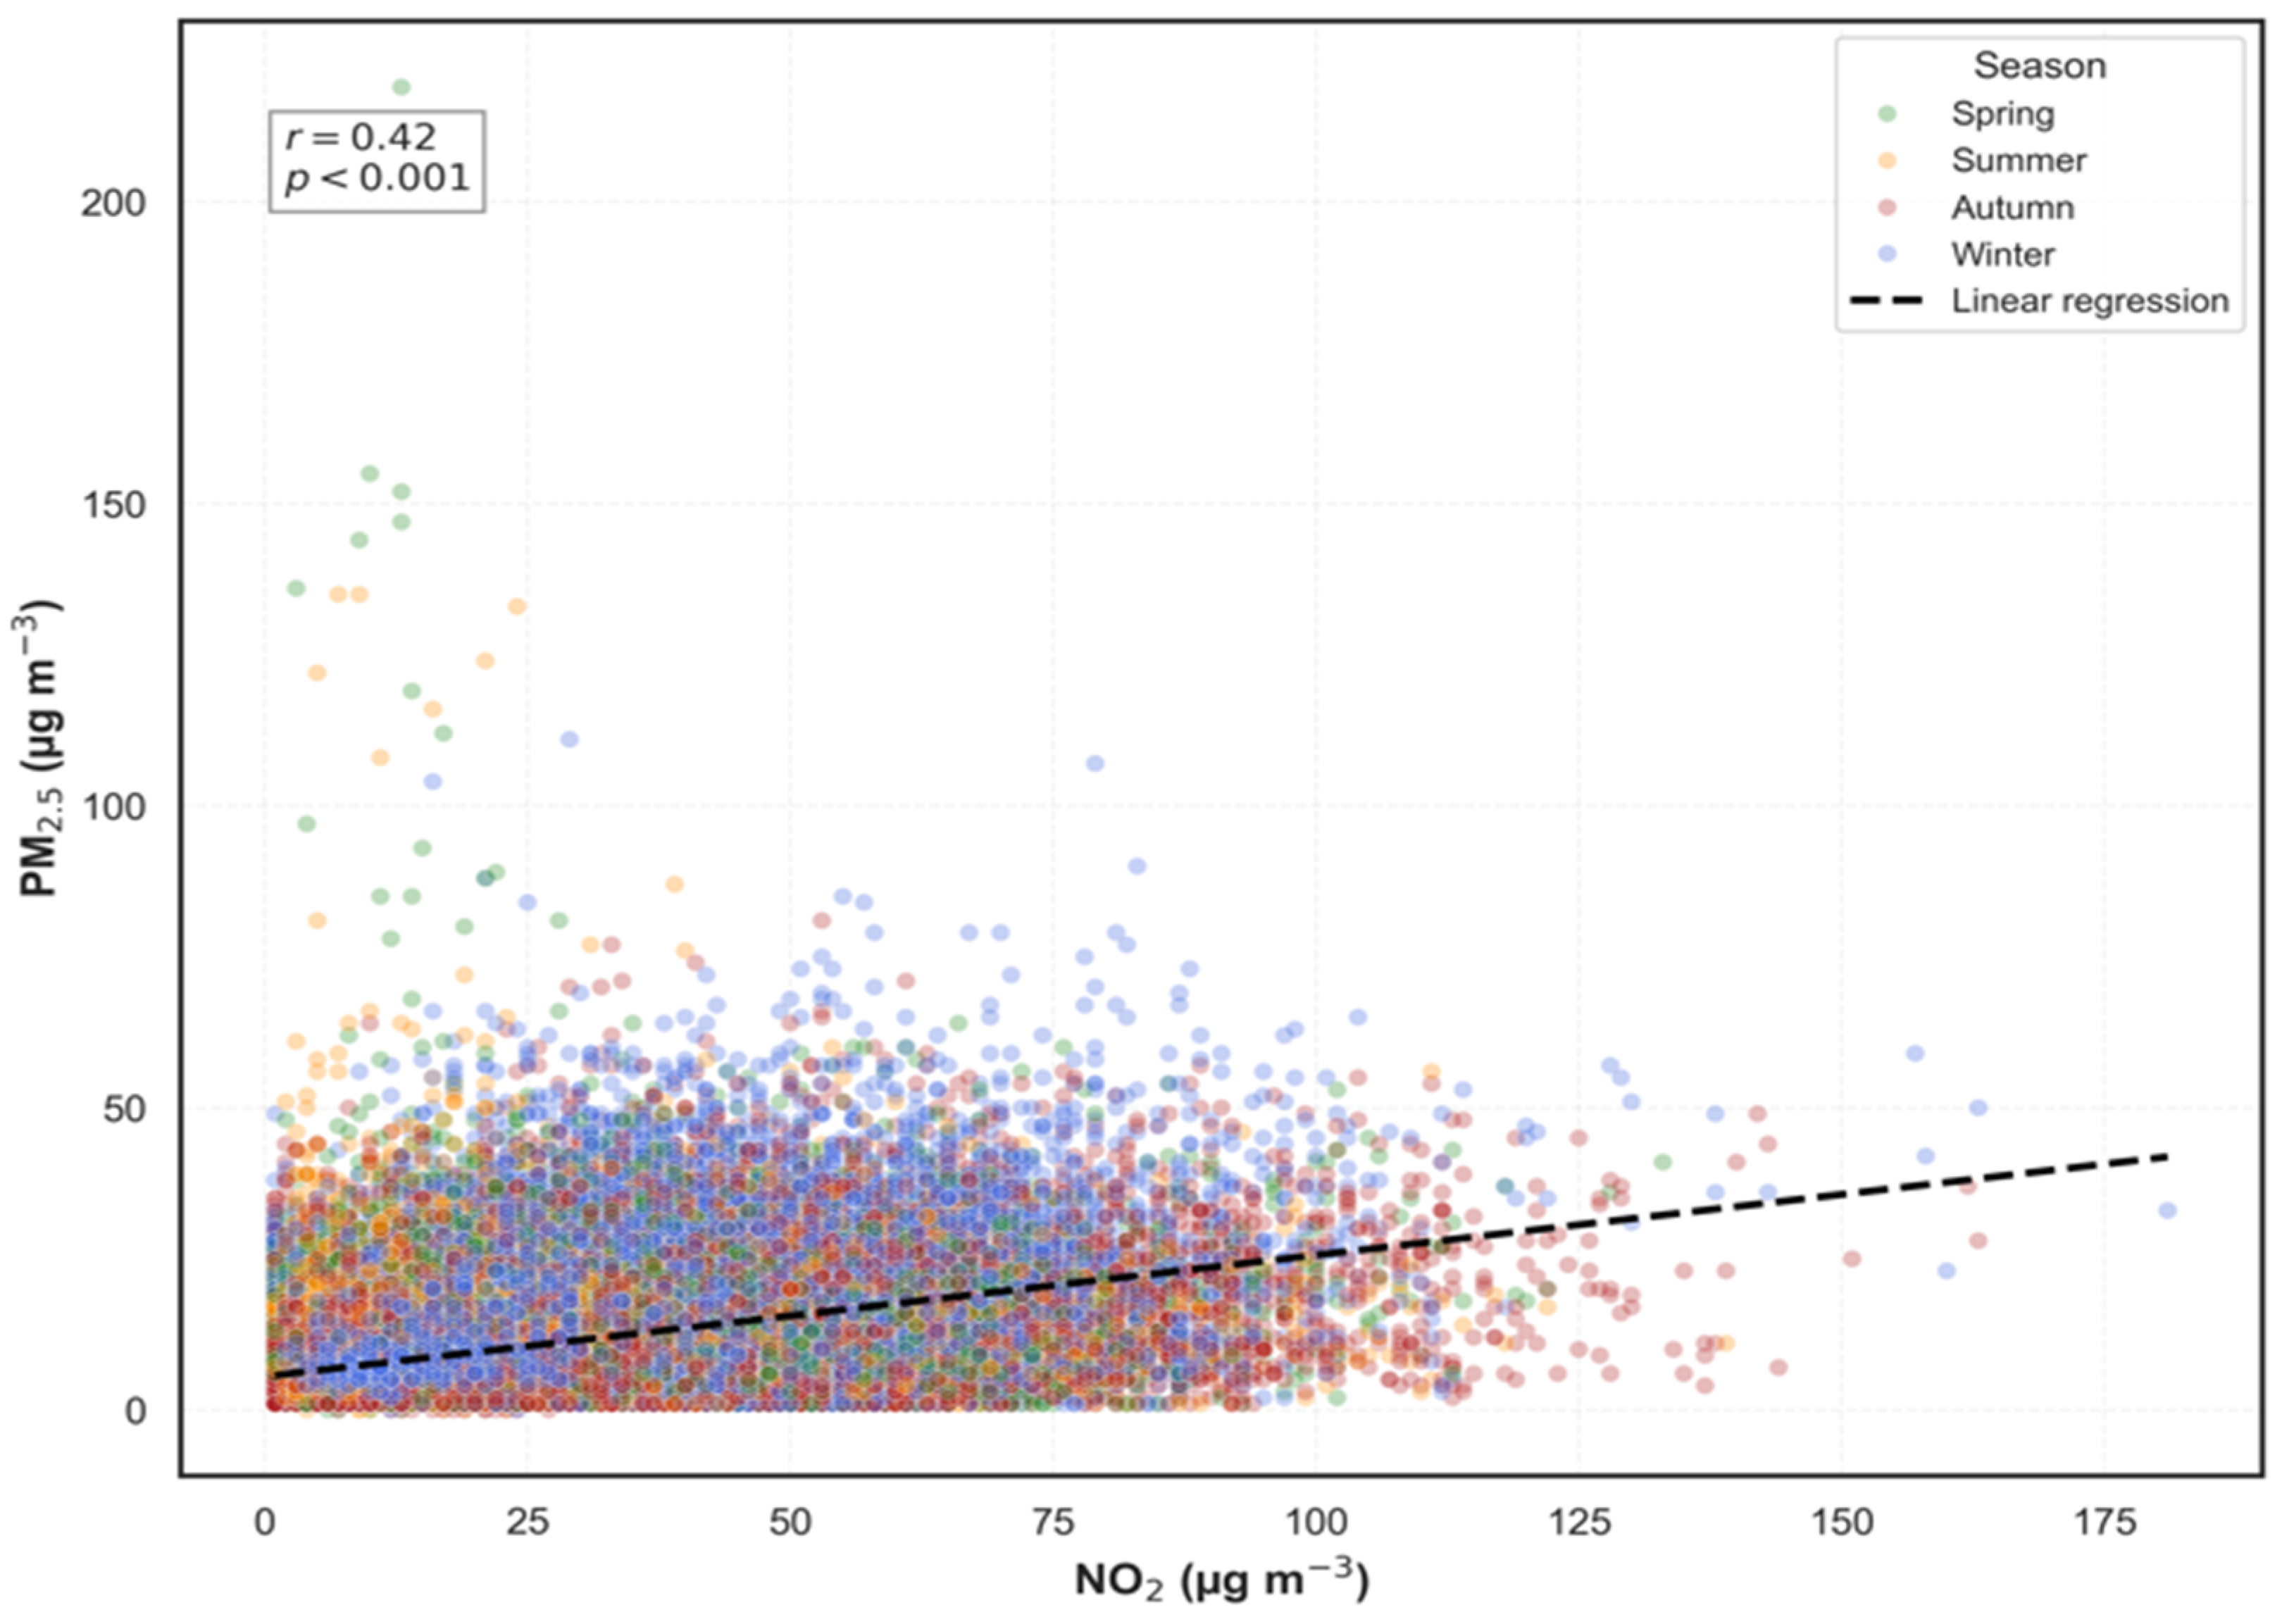
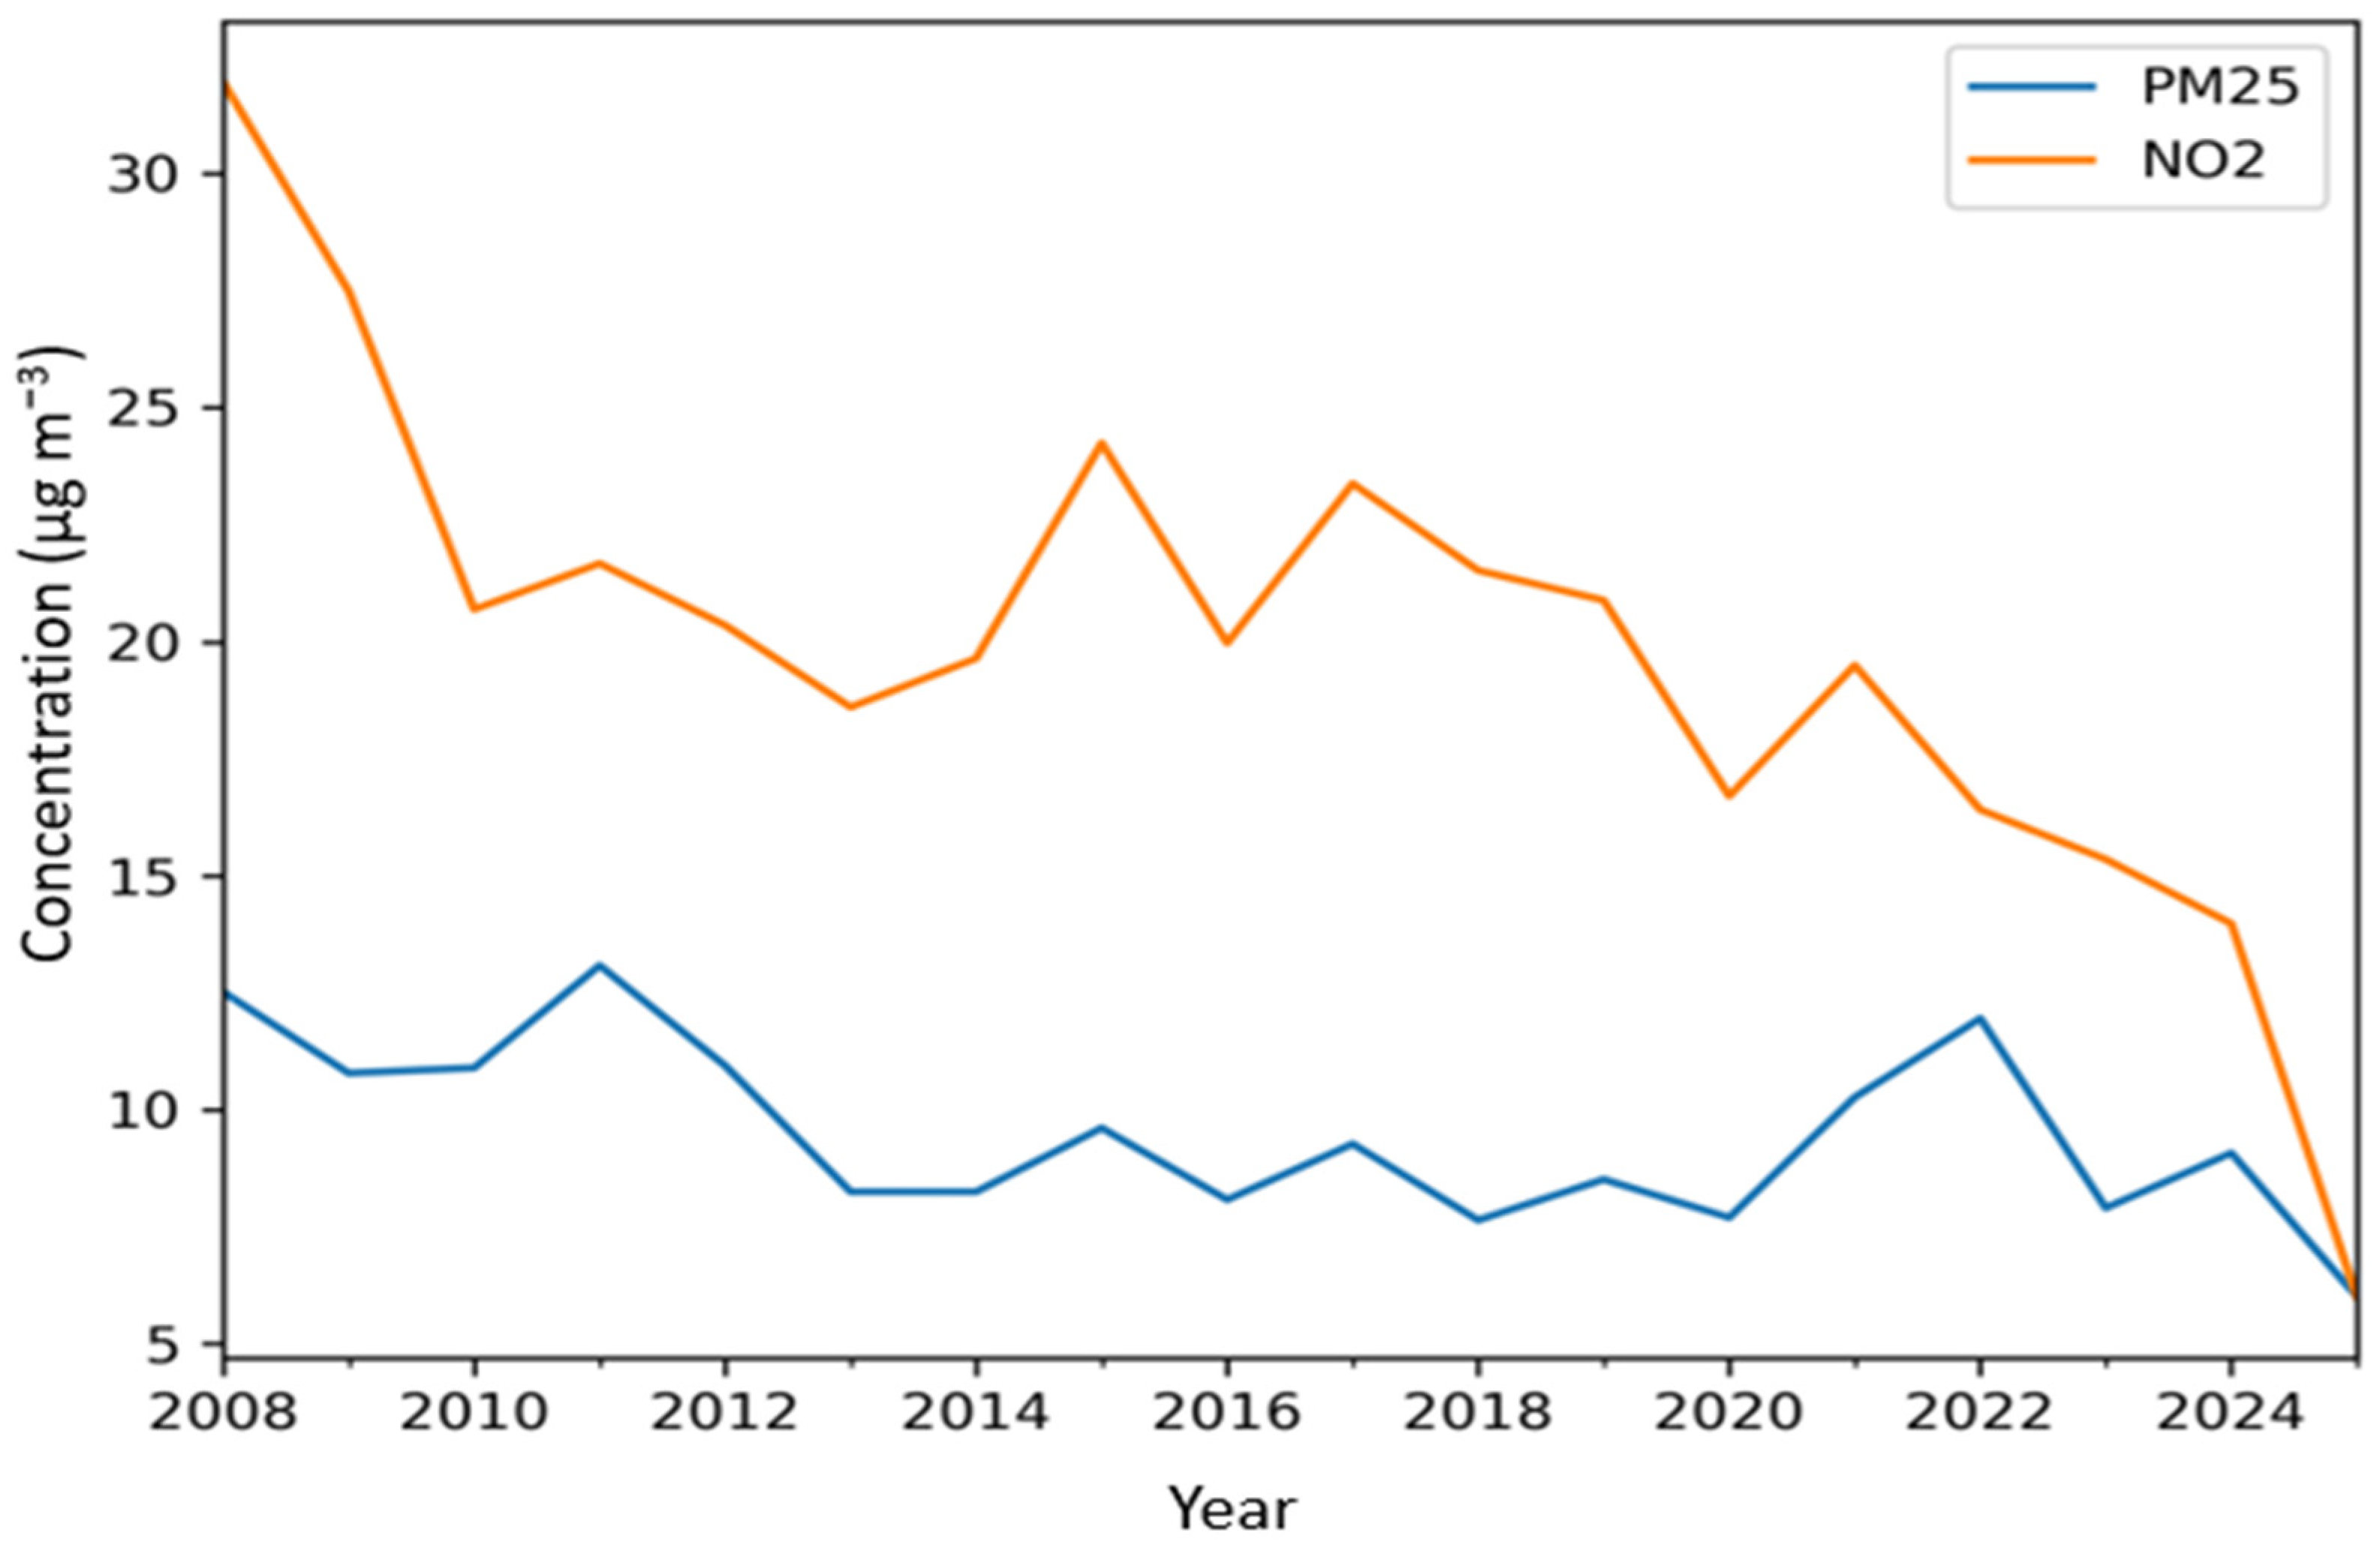
Figure 9 illustrates the temporal variability of NO2 and PM2.5 concentrations measured in Valladolid during the study period. Figure 9a shows daily mean NO2 concentrations, which exhibit pronounced short-term variability associated with changes in traffic emissions, atmospheric mixing conditions, and meteorological variability. A noticeable reduction in NO2 concentrations is observed around 2020, consistent with reduced traffic activity and mobility restrictions during the COVID-19 pandemic period. Daily mean NO2 concentrations generally remain below 75 µg m−3, with occasional short-term peaks reflecting episodic pollution events. Figure 9b presents daily mean PM2.5 concentrations, which show both short-term fluctuations and seasonal variability. Higher PM2.5 concentrations are generally observed during winter months, while lower values occur during summer. This seasonal pattern is consistent with reduced atmospheric dispersion, more frequent thermal inversions, and increased domestic heating emissions during colder periods. Figure 10 further illustrates this seasonal distribution, confirming that winter represents the period of highest particulate matter accumulation in Valladolid. The PM2.5 time series presented in Figure 11 shows substantial day-to-day variability throughout the study period, although a gradual long-term decline remains evident. This reduction likely reflects the influence of air-quality management strategies and emission control measures implemented in recent decades. Despite the general downward trend, several short-term concentration peaks are still evident, particularly during stagnant atmospheric conditions. The elevated PM2.5 concentrations seen in 2022 may also partly reflect the influence of Saharan dust intrusions that affected large parts of the Iberian Peninsula in March 2022, contributing to temporary increases in particulate matter concentrations [34,35]. Figure 12 presents the relationship between PM2.5 and NO2 concentrations during the study period. The scatter distribution indicates a moderate positive association between the two pollutants, suggesting that they are partially influenced by common combustion-related emission sources. However, the dispersion of observations also reflects the influence of meteorological variability and atmospheric transport processes on pollutant concentrations. Pearson correlation analysis confirms a statistically significant moderate positive relationship between PM2.5 and NO2 concentrations (r = 0.48, p < 0.001). The annual mean concentrations shown in Figure 13 indicate coherent long-term behavior for NO2 and PM2.5, with both pollutants exhibiting a gradual decline over the study period. This pattern contrasts with the increasing tendency observed for ozone, highlighting the differing atmospheric behavior of primary pollutants and secondary photochemical species under changing emissions and meteorological conditions.
Concentrations of all the pollutants analyzed are summarized in Table 3 based on daily mean values. Ground-level ozone at the Valladolid-Poniente monitoring station exhibited relatively stable background levels with moderate variability over the study period, with a mean concentration of 48.61 µg m−3 and a median of 51.58 µg m−3. Daily ozone concentrations ranged from 0.83 to 113.79 µg m−3, reflecting the influence of changing meteorological conditions and regional photochemical activity. In comparison, NO2 showed a lower median concentration of 18.54 µg m−3, while PM2.5 presented a median value of 8.29 µg m−3. NO2 and PM2.5 also exhibited stronger short-term variability than ozone, consistent with their direct dependence on local emission sources and boundary-layer dynamics. Hence, the observed differences between pollutants reflect the distinct atmospheric processes governing primary pollutants (NO2 and PM2.5) and secondary photochemical pollutants such as ozone.
The results of this study demonstrate that extreme meteorological conditions play an important role in shaping urban air quality variability in Valladolid, particularly through their influence on ground-level ozone formation. The heatwave comparison analysis further demonstrated that ozone concentrations were significantly higher during heatwave periods than during non-heatwave conditions (Welch’s t-test, p < 0.001), supporting the role played by extreme summer heat in enhancing ozone accumulation during stagnant atmospheric conditions. Although very high ozone episodes were relatively infrequent during the study period, elevated summer ozone concentrations remained persistent during warm conditions, suggesting that meteorological variability is increasingly contributing to inland urban ozone dynamics. The positive relationship identified between temperature and ozone concentration further supports the role of thermal conditions in enhancing photochemical activity. Higher temperatures accelerate atmospheric reactions involving nitrogen oxides (NOx) and volatile organic compounds (VOCs) under favorable photochemical conditions, thereby promoting ozone production. In addition, heatwave periods are commonly associated with reduced atmospheric mixing, weak ventilation, and stagnant air masses, all of which favor pollutant accumulation near the surface. Similar relationships between heatwave conditions and ozone enhancement have been reported across the Iberian Peninsula and other southern European regions [11,24]. Despite reductions in primary pollutants, the persistence of ozone concentrations observed in Valladolid supports the need for integrated climate–air quality management strategies that consider both emission controls and the increasing influence of heatwave conditions [34]. Air pollution remains one of the leading environmental risks to human health across Europe [36,37]. Similar compound atmospheric conditions associated with summertime heat and air-quality deterioration have also been reported across Spain [38]. The seasonal ozone behavior observed in Valladolid is also consistent with previous studies describing the influence of large-scale atmospheric circulation patterns on thermal extremes and air quality variability in Spain. Pérez and García [19] showed that persistent anticyclonic circulation patterns strongly influence surface temperature variability across the Iberian Peninsula, favoring heat accumulation and atmospheric stagnation. The persistence of elevated ozone concentrations during warm periods in Valladolid aligns with these regional-scale observations and provides additional evidence of the interaction between meteorological conditions and urban atmospheric chemistry at city level. The increasing occurrence and persistence of heatwave conditions observed during the study period is consistent with broader climatological evidence reported for Spain. Serrano-Notivoli et al. [24] documented a substantial increase in the frequency and intensity of heatwaves across the Iberian Peninsula since the early 1980s. The present results suggest that persistent thermal extremes may influence ozone behavior in medium-sized inland cities such as Valladolid. While many previous studies have primarily focused on large metropolitan regions, the present analysis demonstrates that medium-sized urban environments are also vulnerable to climate-related air-quality impacts.
The gradual decline observed for NO2 and PM2.5 concentrations likely reflects the influence of emission reduction measures and improvements in urban air-quality management during recent decades. Despite reductions in primary pollutants, the persistence of ozone does, however, highlight the complexity of secondary pollutant chemistry under changing climatic conditions. The simultaneous decline in NO2 concentrations and the persistence of ozone levels may partly reflect reduced NOX titration effects during warm-season conditions, allowing ozone concentrations to remain high even when traffic-related emissions decrease. This behavior emphasizes the nonlinear response of urban ozone formation to changes in precursor emissions and meteorological forcing. The seasonal behavior of PM2.5 further illustrates the important influence of meteorological conditions on urban pollutant dynamics. Higher particulate concentrations during winter were associated with reduced atmospheric mixing, increased domestic heating emissions, and frequent thermal inversions, whereas lower summer concentrations reflected enhanced atmospheric dispersion. Short-term PM2.5 peaks seen in 2022 were likely influenced by Saharan dust intrusions affecting large parts of the Iberian Peninsula, which have previously been associated with elevated particulate matter concentrations across southern Europe [35]. A noticeable reduction in NO2 concentrations during 2020 was also evident in the observational record and was likely associated with reduced traffic activity and mobility restrictions during the COVID-19 period. Similar reductions in urban NO2 concentrations were widely reported across European cities during pandemic-related restrictions, confirming the strong contribution of transport emissions to urban nitrogen dioxide variability. The findings of this study are consistent with previous research that has underscored the growing interaction between climate variability and urban air quality. Romanello et al. [15] highlighted the increasing health burden associated with the combined effects of climate change and atmospheric pollution. Despite reductions in primary pollutants, the persistence of ozone concentrations in Valladolid supports the importance of taking meteorological variability into consideration in urban air-quality management strategies that consider both emission controls and the increasing influence of meteorological extremes. These findings are also relevant in the context of the recently adopted Directive (EU) 2024/2881 [37], which introduces stricter future European air-quality objectives and reinforces the importance of integrating climate-related meteorological variability into urban air-quality management strategies. From a methodological perspective, the approach adopted in this study is consistent with time-series and threshold-based analyses commonly applied in atmospheric and climate-related air-quality research [8,13,20,21,22,23,36]. Similar approaches have been used to investigate pollutant variability, extreme meteorological conditions, and long-term urban air-quality dynamics across different environmental settings. However, many previous studies have focused primarily on large metropolitan regions or broad regional assessments, whereas the present analysis applies these methods to a medium-sized inland city using long-term observational data. This provides additional insights into how extreme meteorological conditions influence pollutant behavior in urban environments that are less frequently represented in climate–air quality research.
One limitation of the present study is its reliance on observations from a single urban monitoring station, which restricts the assessment of spatial variability and regional transport processes. Nevertheless, the long-term observational dataset does provide valuable insights into pollutant behavior and climate–air quality interactions in a medium-sized inland city that is less frequently represented in atmospheric research. Previous analyses of ozone concentrations in Valladolid and other urban stations in northern Spain have also reported persistent ozone variability associated with meteorological conditions and seasonal atmospheric dynamics [22]. The present study extends these observations by examining the relationship between heatwave conditions and long-term variability of multiple urban air pollutants over an extended observational period.

4. Conclusions

This study examines the influence of extreme meteorological conditions on urban air quality variability in Valladolid between 2006 and 2024 using long-term observations of ozone, nitrogen dioxide, particulate matter, and temperature conditions. The results demonstrate that elevated temperatures and persistent heatwave conditions are associated with increased ozone concentrations, particularly during late spring and summer when photochemical activity is most intense. The analysis identified a moderate positive relationship between temperature and ozone variability (r = 0.51, R2 = 0.26, p < 0.001), indicating that warm atmospheric conditions contribute to enhanced ozone formation and accumulation. Heatwave periods were generally characterized by higher ozone concentrations compared with non-heatwave conditions, thus highlighting the influence of extreme thermal events on urban atmospheric chemistry, with mean ozone concentrations during heatwave days being significantly higher than those measured during non-heatwave conditions (Welch’s t-test, p < 0.001). These findings suggest that meteorological conditions contribute to ozone variability in inland urban environments. In contrast, NO2 and PM2.5 concentrations exhibited gradual long-term declines during the study period, likely reflecting the influence of emission reduction measures and improvements in urban air-quality management. Seasonal differences were also evident among pollutants. PM2.5 concentrations were generally higher during winter because of reduced atmospheric mixing, thermal inversions, and increased particulate accumulation, whereas summer concentrations remained comparatively lower. Short-term PM2.5 increases observed in 2022 were likely influenced by Saharan dust intrusions affecting the Iberian Peninsula. A temporary reduction in NO2 concentrations was also observed in 2020, coinciding with reduced mobility and traffic activity during the COVID-19 period.
Despite reductions in primary pollutants, the persistence of ozone concentrations highlights the complexity of urban atmospheric chemistry and suggests that meteorological variability may partly influence the effectiveness of conventional emission-control strategies. The results highlight the relevance of incorporating meteorological variability and extreme heat conditions into urban air-quality assessment and adaptation planning under a warming climate. This study thus provides additional evidence that medium-sized inland cities such as Valladolid are also vulnerable to the combined effects of climate variability and atmospheric pollution. The findings contribute to current understanding of climate–air quality interactions in southern European urban environments and provide further insights into the relationship between heatwave conditions and urban pollutant variability.

Author Contributions

J.M.A.: Conceptualization, methodology, formal analysis, writing—original draft preparation; M.Á.G.: Conceptualization, formal analysis, writing—review and editing; I.A.P.: Conceptualization, formal analysis, writing—review and editing. All authors have read and agreed to the published version of the manuscript.

Funding

This research received no external funding.

Institutional Review Board Statement

Not applicable.

Informed Consent Statement

Not applicable.

Data Availability Statement

Data are available from the web pages: Meteomanz.com and https://www.valladolid.es/es/rccava, accessed on 18 February 2026.

Conflicts of Interest

The authors declare no conflicts of interest.

References

  1. IPCC (Intergovernmental Panel on Climate Change). Climate Change 2023: Synthesis Report. Contribution of Working Groups I, II and III to the Sixth Assessment Report of the Intergovernmental Panel on Climate Change; Core Writing Team, Lee, H., Romero, J., Eds.; IPCC: Geneva, Switzerland, 2023; Available online: https://www.ipcc.ch/report/ar6/syr/ (accessed on 26 May 2026).
  2. Perkins-Kirkpatrick, S.E.; Lewis, S.C. Increasing trends in regional heatwaves. Nat. Commun. 2020, 10, 161–167. [Google Scholar] [CrossRef]
  3. Alari, A.; Chen, C.; Schwarz, L.; Hdansen, K.; Chaix, B.; Benmarhnia, T. The role of ozone as a mediator of the relationship between heat waves and mortality in 15 French urban areas. Am. J. Epidemiol. 2023, 192, 949–962. [Google Scholar] [CrossRef] [PubMed]
  4. Schiavina, M.; Melchiorri, M.; Corbane, C.; Freire, S.; Batista e Silva, F. Built-up areas are expanding faster than population growth: Regional patterns and trajectories in Europe. J. Land Use Sci. 2022, 17, 591–608. [Google Scholar] [CrossRef]
  5. Cheval, S.; Amihăesei, V.A.; Chitu, Z.; Dumitrescu, A.; Falcescu, V.; Irașoc, A.; Tudose, N.C. A systematic review of urban heat island and heat waves research (1991–2022). Clim. Risk Manag. 2024, 44, 100603. [Google Scholar] [CrossRef]
  6. Sfîcă, L.; Corocăescu, A.C.; Crețu, C.Ș.; Amihăesei, V.A.; Ichim, P. Spatiotemporal features of the surface urban heat island of Bacău City (Romania). Remote Sens. 2023, 15, 3385. [Google Scholar] [CrossRef]
  7. Evers, D.; Katurić, I.; van der Wouden, R. Urbanization interventions: Strategies, plans, and policies. In Urbanization in Europe: Past Developments and Pathways to a Sustainable Future; Springer Nature: Cham, Switzerland, 2024; pp. 53–85. [Google Scholar]
  8. Monks, P.S.; Archibald, A.T.; Colette, A.; Cooper, O.; Coyle, M.; Derwent, R.; Williams, M.L. Tropospheric ozone and its precursors from the urban to the global scale. Atmos. Chem. Phys. 2015, 15, 8889–8973. [Google Scholar] [CrossRef]
  9. Abdul Aziz, F.A.B.; Abd Rahman, N.; Mohd Ali, J. Tropospheric ozone formation estimation in an urban city (Bangi) using artificial neural networks (ANN). Comput. Intell. Neurosci. 2019, 2019, 6252983. [Google Scholar] [CrossRef] [PubMed]
  10. EPA (Environmental Protection Agency). Achievements in Stratospheric Ozone Protection: Progress Report (EPA-430-R-07-001); U.S. Environmental Protection Agency, Office of Air and Radiation: Washington, DC, USA, 2007.
  11. García, M.Á.; Pérez, I.A.; Hernández-Ceballos, M.Á. Heatwave events and concurrent ozone concentrations between 2006 and 2022 at two sites in southern and northern Spain. Environ. Sci. Pollut. Res. 2024, 31, 60819–60835. [Google Scholar] [CrossRef]
  12. Oke, T.R.; Mills, G.; Christen, A.; Voogt, J.A. Urban Climates; Cambridge University Press: Cambridge, UK, 2017. [Google Scholar] [CrossRef]
  13. Tatay, I.C.; Domenech, F.; Carot, V.; Ricart, C.P. Visualización de la calidad del aire en Valencia: Una herramienta para la ciudadanía. Obs. Medioambient. 2025, 28, 75–88. [Google Scholar] [CrossRef]
  14. WHO (World Health Organization). Review of Evidence on Health Aspects of Air Pollution—REVIHAAP Project Technical Report; WHO Regional Office for Europe: Copenhagen, Denmark, 2013. [Google Scholar]
  15. Romanello, M.; McGushin, A.; Di Napoli, C.; Drummond, P.; Hughes, N.; Jamart, L.; Hamilton, I. The 2021 report of the Lancet Countdown on health and climate change: Code red for a healthy future. Lancet 2021, 398, 1619–1662. [Google Scholar] [CrossRef] [PubMed]
  16. UNDP (United Nations Development Programme). Climate Change Is a Matter of Justice 2023. Available online: https://climatepromise.undp.org/news-and-stories/climate-change-matter-justice-heres-why (accessed on 13 January 2026).
  17. Paavola, J. Health impacts of climate change and health and social inequalities in the UK. Environ. Health 2017, 16, 113. [Google Scholar] [CrossRef]
  18. López-Bueno, J.A.; Díaz, J.; Iriso, M.; Ruiz-Páez, R.; Navas-Martín, M.A.; Linares, C. Emergency hospital admissions for cardiovascular causes attributable to air pollution and extreme temperatures in Spain: Influence of economic and demographic factors in a nationwide study. J. Urban Health 2025, 102, 813–829. [Google Scholar] [CrossRef]
  19. Pérez, I.A.; García, M.Á. Climate change in the Iberian Peninsula by weather types and temperature. Atmos. Res. 2023, 284, 106596. [Google Scholar] [CrossRef]
  20. Neal, R.; Fereday, D.; Crocker, R.; Comer, R.E. A flexible approach to defining weather patterns and their application in weather forecasting over Europe. Meteorol. Appl. 2016, 23, 389–400. [Google Scholar] [CrossRef]
  21. Qian, J.H.; Lu, M.-M.; Sui, C.H. Evolution of South China Sea and East Asian monsoon from spring to summer by the progression of daily weather types. Int. J. Climatol. 2022, 42, 3633–3647. [Google Scholar] [CrossRef]
  22. García, M.Á.; Villanueva, J.; Pardo, N.; Pérez, I.A.; Sánchez, M.L. Analysis of ozone concentrations between 2002–2020 in urban air in northern Spain. Atmosphere 2021, 12, 1495. [Google Scholar] [CrossRef]
  23. Pope, J.O.; Brown, K.; Fung, F.; Hanlon, H.M.; Neal, R.; Palin, E.J.; Reid, A. Investigation of future climate change over the British Isles using weather patterns. Clim. Dyn. 2022, 58, 2405–2419. [Google Scholar] [CrossRef]
  24. Serrano-Notivoli, R.; Lemus-Cánovas, M.; Barrao, S.; Sarricolea, P.; Meseguer-Ruiz, O.; Tejedor, E. Heat and cold waves in mainland Spain: Origins, characteristics, and trends. Weather Clim. Extrem. 2022, 37, 100471. [Google Scholar] [CrossRef]
  25. AEMET (Agencia Estatal de Meteorología). Mapas Climáticos de España (1981–2010); Ministerio para la Transición Ecológica, Agencia Estatal de Meteorología: Madrid, Spain, 2018.
  26. Council of Europe. Valladolid, Spain—Intercultural City. Available online: https://www.coe.int/en/web/interculturalcities/valladolid (accessed on 10 January 2026).
  27. INE (Instituto Nacional de Estadística). Population of Valladolid, Spain. Available online: http://www.ine.es (accessed on 10 January 2026).
  28. Lemus-Cánovas, M.; Montesinos-Ciuró, E.; Cearreta-Innocenti, T.; Serrano-Notivoli, R.; Royé, D. Attribution of the unprecedented heat event of August 2023 in Barcelona (Spain) to observed and projected global warming. Urban Clim. 2024, 56, 102019. [Google Scholar] [CrossRef]
  29. WHO (World Health Organization). Air Quality Guidelines: Global Update 2005; WHO Regional Office for Europe: Copenhagen, Denmark, 2005. [Google Scholar]
  30. European Parliament and Council of the European Union. Directive 2008/50/EC of the European Parliament and of the Council of 21 May 2008 on ambient air quality and cleaner air for Europe. Off. J. Eur. Union 2008, L 152, 1–44. [Google Scholar]
  31. McKinney, W. Data structures for statistical computing in Python. In Proceedings of the 9th Python in Science Conference, Austin, TX, USA, 28 June–3 July 2010; pp. 51–56. [Google Scholar] [CrossRef]
  32. Seinfeld, J.H.; Pandis, S.N. Atmospheric Chemistry and Physics: From Air Pollution to Climate Change, 3rd ed.; Wiley: Hoboken, NJ, USA, 2016. [Google Scholar]
  33. Wilks, D.S. Statistical Methods in the Atmospheric Sciences, 3rd ed.; Academic Press: Cambridge, MA, USA, 2011. [Google Scholar]
  34. Sicard, P.; De Marco, A.; Troussier, F.; Renou, C.; Vas, N.; Paoletti, E. Decrease in surface ozone concentrations at Mediterranean remote sites and increase in the cities. Atmos. Environ. 2013, 79, 705–715. [Google Scholar] [CrossRef]
  35. Querol, X.; Pey, J.; Pandolfi, M.; Alastuey, A.; Cusack, M.; Pérez, N.; Moreno, T.; Viana, M.; Mihalopoulos, N.; Kallos, G.; et al. African dust contributions to mean ambient PM10 mass-levels across the Mediterranean Basin. Atmos. Environ. 2009, 43, 4266–4277. [Google Scholar] [CrossRef]
  36. Kotsias, G.; Lolis, C.J.; Hatzianastassiou, N.; Lionello, P.; Bartzokas, A. A comparison of different approaches for the definition of seasons in the Mediterranean region. Int. J. Climatol. 2022, 42, 1954–1974. [Google Scholar] [CrossRef]
  37. European Environment Agency. Harm to Human Health from Air Pollution in Europe: Burden of Disease Status, 2024; European Union: Luxembourg, 2024; Available online: https://www.eea.europa.eu/en/analysis/publications/harm-to-human-health-from-air-pollution-2024 (accessed on 22 May 2026).
  38. Garnés-Morales, G.; Jiménez-Guerrero, P.; Gil-Guirado, S.; García-Fernández, E.; Raluy-López, E.; Segado-Moreno, L.; Montávez, J.P. Meteorological drivers of compound atmospheric events associated with summertime mortality excess in Spain. Environ. Int. 2026, 209, 110199. [Google Scholar] [CrossRef] [PubMed]
Figure 1. Location of Valladolid in Castile and Leon, Spain.
Atmosphere 17 00566 g001
Figure 2. Conceptual representation of atmospheric and meteorological processes associated with heatwave persistence and urban air-quality variability in Valladolid.
Atmosphere 17 00566 g002
Figure 3. Temporal distribution of identified heatwave events based on daily maximum temperature data (a) and frequency distribution of temperature observations in Valladolid between 2006 and 2024 (b).
Atmosphere 17 00566 g003
Figure 4. Comparison of daily mean ozone concentrations measured during heatwave and non-heatwave conditions in Valladolid. (a) Boxplot distribution of ozone concentrations for both groups. (b) Mean ozone concentrations with standard deviation error bars. Welch’s two-sample t-test indicated significantly higher ozone concentrations during heatwave conditions (p < 0.001). Open circles represent outlier values.
Atmosphere 17 00566 g004
Figure 5. Relationship between daily maximum temperature and daily mean ozone concentrations measured in Valladolid during the study period. The regression analysis indicates a statistically significant positive association (r = 0.51, R2 = 0.26, p < 0.001).
Atmosphere 17 00566 g005
Figure 6. Daily Average of Ozone in Valladolid.
Atmosphere 17 00566 g006
Figure 7. Monthly mean ozone concentrations in Valladolid (a) and corresponding 3-month moving average showing long-term variability and seasonal behavior (b).
Atmosphere 17 00566 g007
Figure 8. Long-term variability and trend of monthly mean ozone concentrations in Valladolid.
Atmosphere 17 00566 g008
Figure 9. Temporal variability of daily mean NO2 concentrations (a) and monthly mean PM2.5 concentrations (b) in Valladolid during the study period.
Atmosphere 17 00566 g009
Figure 10. Seasonal distribution of monthly PM2.5 concentrations in Valladolid.
Atmosphere 17 00566 g010
Figure 11. Time series of daily mean PM2.5 concentrations in Valladolid during the study period.
Atmosphere 17 00566 g011
Figure 12. Relationship between PM2.5 and NO2 concentrations measured in Valladolid during the study.
Atmosphere 17 00566 g012
Figure 13. Annual mean concentrations of NO2 and PM2.5 measured in Valladolid during the study period.
Atmosphere 17 00566 g013
Table 1. Heatwave events affecting Valladolid between 2006 and 2024, including event duration and spatial extent across affected provinces in Spain.
YearStart DateEnd DateDuration (Days)Spatial Extent (No. of Provinces)
200604 September06 September315
201125 June27 June315
201113 August18 August620
201119 August21 August319
201224 June28 June525
201208 August11 August440
201217 August23 August730
201527 June22 July2630
201527 July29 July310
201617 July19 July320
201622 August25 August412
201712 July16 July514
201720 August22 August311
201831 July07 August836
201926 June01 July629
201920 July25 July630
202025 July02 August923
202005 August10 August627
202111 August16 August636
202212 June18 June739
202209 July26 July1844
202230 July14 August1633
202317 July20 July421
202306 August13 August826
202317 August25 August939
202423 July01 August1033
202404 August12 August935
Table 2. Descriptive statistics of ozone concentrations measured during heatwave and non-heatwave conditions in Valladolid.
ConditionnMean ± SD
(µg m−3)
Median
(µg m−3)
Minimum
(µg m−3)
Maximum
(µg m−3)
Heatwave33667.62 ± 15.3268.6211.54113.79
Non-heatwave638147.63 ± 20.6050.630.83107.63
Table 3. Descriptive statistics of daily mean pollutant concentrations measured in Valladolid during the study period (2006–2024 for O3, 2008–2024 for NO2, and 2009–2024 for PM2.5).
PollutantMean
(μg m−3)
Median
(μg m−3)
Minimum
(μg m−3)
Maximum
(μg m−3)
Standard Deviation
(μg m−3)
O348.6151.580.83113.7920.84
NO220.5218.541.0073.7011.42
PM2.59.688.291.0089.006.32
Disclaimer/Publisher’s Note: The statements, opinions and data contained in all publications are solely those of the individual author(s) and contributor(s) and not of MDPI and/or the editor(s). MDPI and/or the editor(s) disclaim responsibility for any injury to people or property resulting from any ideas, methods, instructions or products referred to in the content.