Article

Concentrations and Health Risk Assessment of Ambient PM2.5-Bound Elements in Windsor, Ontario, Canada

1
Department of Civil and Environmental Engineering, University of Windsor, Windsor, ON N9B 3P4, Canada
2
Environmental Monitoring and Reporting Branch, Ontario Ministry of the Environment, Conservation and Parks, Toronto, ON M9P 3V6, Canada
3
Technical Assessment and Standards Development Branch, Ontario Ministry of the Environment, Conservation and Parks, Toronto, ON M4V 1M2, Canada
*
Authors to whom correspondence should be addressed.
Atmosphere 2026, 17(3), 328; https://doi.org/10.3390/atmos17030328
Submission received: 20 January 2026 / Revised: 12 March 2026 / Accepted: 16 March 2026 / Published: 23 March 2026
(This article belongs to the Special Issue Air Pollution: Health Risks and Mitigation Strategies)

Abstract

Hourly concentrations of PM2.5-bound elements were continuously monitored in Windsor, Canada, from April 2021 to April 2023. Health risk assessment methods of the USEPA were utilized to quantify lifetime cumulative cancer risks (CRs) using six PM2.5-bound elements, and chronic non-cancer hazard quotients (HQs) using 11 elements, for each season, each source factor, and each hour of day. The two-year average PM2.5 mass concentration was 9.2 μg/m3, slightly exceeding Ontario’s Ambient Air Quality Criteria of 8.8 μg/m3. A discernible diurnal concentration pattern was noted for most elements, peaking during morning rush hours and tapering during the daytime, largely attributed to local human activities and changes in atmospheric mixing heights. Despite this, both the total lifetime cumulative CR (4.1 × 10⁻⁵) and non-cancer total HQ (0.82) from exposure to ambient elements remained below the corresponding USEPA-acceptable levels. The seasonal variation in CRs and HQs was minimal. However, the diurnal variation was strong, with higher risks during morning rush hours (6:00–8:00) when traffic volume peaks, and lower risks during the daytime (12:00–20:00) when atmospheric mixing height is enhanced. Metal processing emerged as the most significant contributor to the total CR (52%) and HQ (60%), followed by coal/heavy oil burning (19% and 16%, respectively), and vehicular exhaust (19% and 12%, respectively). The remaining two source factors accounted for 10% of CR and 12% of HQ. Cd (62%) was the largest contributor to CRs, followed by Cr(VI) (25%), Co (6%), As (5%), Ni (2%), and Pb (<0.1%). Similarly, Cd dominated HQs (73%), followed by Mn (11%), Ni (6.3%), with the remaining eight elements collectively contributing 9.7%. Although levels of CRs and HQs are low, efforts to mitigate ambient Cd emissions from metal processing sources will help reduce exposure and protect the environment and human health, given Cd is the primary contributor to the total CR and HQ during the study period.

1. Introduction

Outdoor air pollution and particulate matter are classified as carcinogenic to humans by the International Agency for Research on Cancer [1]. Air pollution is responsible for approximately 7 million premature deaths each year around the globe [2]. Health Canada estimated that total economic cost of health impacts is 52 billion Canadian dollars in Ontario, Canada, for exposure to ambient fine particulate matter (PM2.5), ozone, and nitrogen dioxide [3]. Exposure to these air pollutants is associated with 6500 premature deaths in Ontario, 4300 of which are attributed to PM2.5 [3]. Epidemiological research has established a positive correlation between levels of ambient PM2.5 and respiratory morbidity and mortality [4]. It was reported that the prevalence rate of respiratory diseases for general population increased by 2.1% and hospitalization rate raised by 8% accordingly when the daily PM2.5 increased by 10 µg/m3 [5]. Furthermore, short- and long-term inhalation exposure to PM2.5 has been associated with significant deficits in the cardiovascular [6], digestive [7] and central nervous systems [8].
Studies suggest that chemical compositions of PM2.5, in addition to PM2.5 mass concentrations, are valuable for assessing health risks [9]. Although trace elements represent a small portion of PM2.5 mass, they are detrimental to human health because of their high toxicity [10]. Once deposited in the human body through ingestion and/or inhalation, those trace elements accumulate in an organ because they can neither be digested nor biodegraded easily. Elements originated from the earth’s crust (e.g., Al, Ca, Fe and Si) are more common in coarse-sized particles (i.e., PM2.5–10, particles with an aerodynamic diameter between 2.5 and 10 μm) and less reactive and toxic in comparison to PM2.5-bound elements emitted from combustion processes, such as As, Cd, Cr, Pb, Ni, Se, and Zn [11]. For instance, As, Cd, Cr, and Ni are classified as Group 1 carcinogens [12]. Exposure to As may cause cancers, pigmentation disorders, and other related diseases [13]. Long-term Cd exposure is associated with cancer, leukemia, and genetic toxicity [14]. Inhalation of Cr(VI) has been linked with an increased risk in lung cancer [15]. Ni exposure has been shown to contribute to cardiovascular disease, lung fibrosis, and cancers of the respiratory tract [16]. Pb can affect children’s nervous systems and hinder their brain development [17]. Furthermore, PM2.5 gets into deep parts of lungs due to its smaller sizes and is more harmful than PM2.5–10 [18].
A health risk assessment evaluates whether a substance is likely to pose a risk to human health [19]. For assessing health risks associated with long-term (chronic) and short-term (acute) inhalation exposures to hazardous air pollutants, dose–response criteria have been used [20]. The threshold and non-threshold approaches are commonly used to quantify health risks associated with exposure to chemicals [21]. The threshold is defined as the dose or exposure concentration below which no deleterious effect is expected to occur in humans [22]. In other words, the exposures from zero to the threshold value can be tolerated by an organism with essentially no toxic effects, and the threshold of toxicity is where the toxic effects begin to occur. For the non-threshold approach, there is theoretically no level of exposure for such a chemical that does not pose cancer risks. A linear relationship between dose and cancer incidence is assumed when calculating the excess lifetime cancer risks which are expressed as probability, such as one in one million [23]. The USEPA’s risk assessment methods [24] are widely employed to evaluate lifetime carcinogenic (non-threshold approach) and chronic non-carcinogenic (threshold approach) risks due to exposure to ambient trace metals in PM2.5. For example, these USEPA methods have been used to assess cancer risks (CRs) and hazard quotients (HQs) due to inhalation exposure of ambient PM2.5-bound elements in two Canadian oil sand communities in Alberta during 2010–2013 [25], in an urban residential area in Aglantzia, Cyprus, in 2018 [26], and in Ningbo, China, during 2015–2016 [27].
While estimates of the total lifetime cumulative CR and non-cancer HQ are valuable, it is crucial to quantify the contribution of various emission sources to human health risks. Source apportionment of PM2.5-bound element concentrations (e.g., [25,28,29]) provided valuable insights into the contribution of specific emission sources. Knowledge of emission sources and their impacts on human health help develop emission control strategies and prioritize control measures effectively [30]. In addition, high temporal resolution data are increasingly necessary for source-specific risk assessment, as many toxic elements display strong diurnal variability that is not captured by daily averages. Evaluating risks at an hourly scale enables the identification of sources that contribute to short-term exposures, providing more information for both public health protection and effective emission-control planning.
Currently, understanding of health risks associated with PM2.5-bound elements is limited in the Windsor area. During the Michigan–Ontario Ozone Source Experiment (MOOSE) study [31], hourly measurements of PM2.5-bound elements were collected from April 2021 to April 2023 in Windsor, Ontario. In our previous study of source apportionment of PM2.5-bound elements in Windsor [28], a shorter period (i.e., April 2021–October 2021) of hourly data was used to assess diurnal variations in each element and to identify sources and quantify the contribution of each source affecting PM2.5-bound element concentrations using the USEPA Positive Matrix Factorization (PMF) model. In that study, general statistics, Pearson correlations, and analysis of diurnal variations in PM2.5 mass and 24 PM2.5-bound elements were employed to examine data distribution and identify potential sources influencing element concentrations during the short study period from April to October 2021. In the current study, same statistical methods were applied to a longer study period from April 2021 to April 2023. The extended study period allows for the analysis of seasonal variations. Spearman’s rank correlations between hour-of-day PM2.5 concentrations and hour-of-day element concentrations were also conducted to provide insights into whether PM2.5 mass concentrations is a good indicator to PM2.5-bound element concentrations. The objectives of current study are (1) to investigate ambient levels and temporal variations in trace elements in Windsor, (2) to determine whether PM2.5 mass concentration is an accurate indicator of PM2.5-bound element concentrations, (3) to assess life-time incremental CRs and chronic non-cancer HQs from exposure to PM2.5-bound elements through inhalation pathway, and (4) to conduct health risk assessment of the elements per specific source, season of year, and hour of day. Building upon the previous study [28], the present study assessed health risks associated with PM2.5-bound elements at an hourly resolution and further apportioned these risks among five potential sources. The findings help local residents plan outdoor activities to protect their health, as well as support the development of effective emission-control strategies.

2. Methodology

2.1. Data Collection and Screening

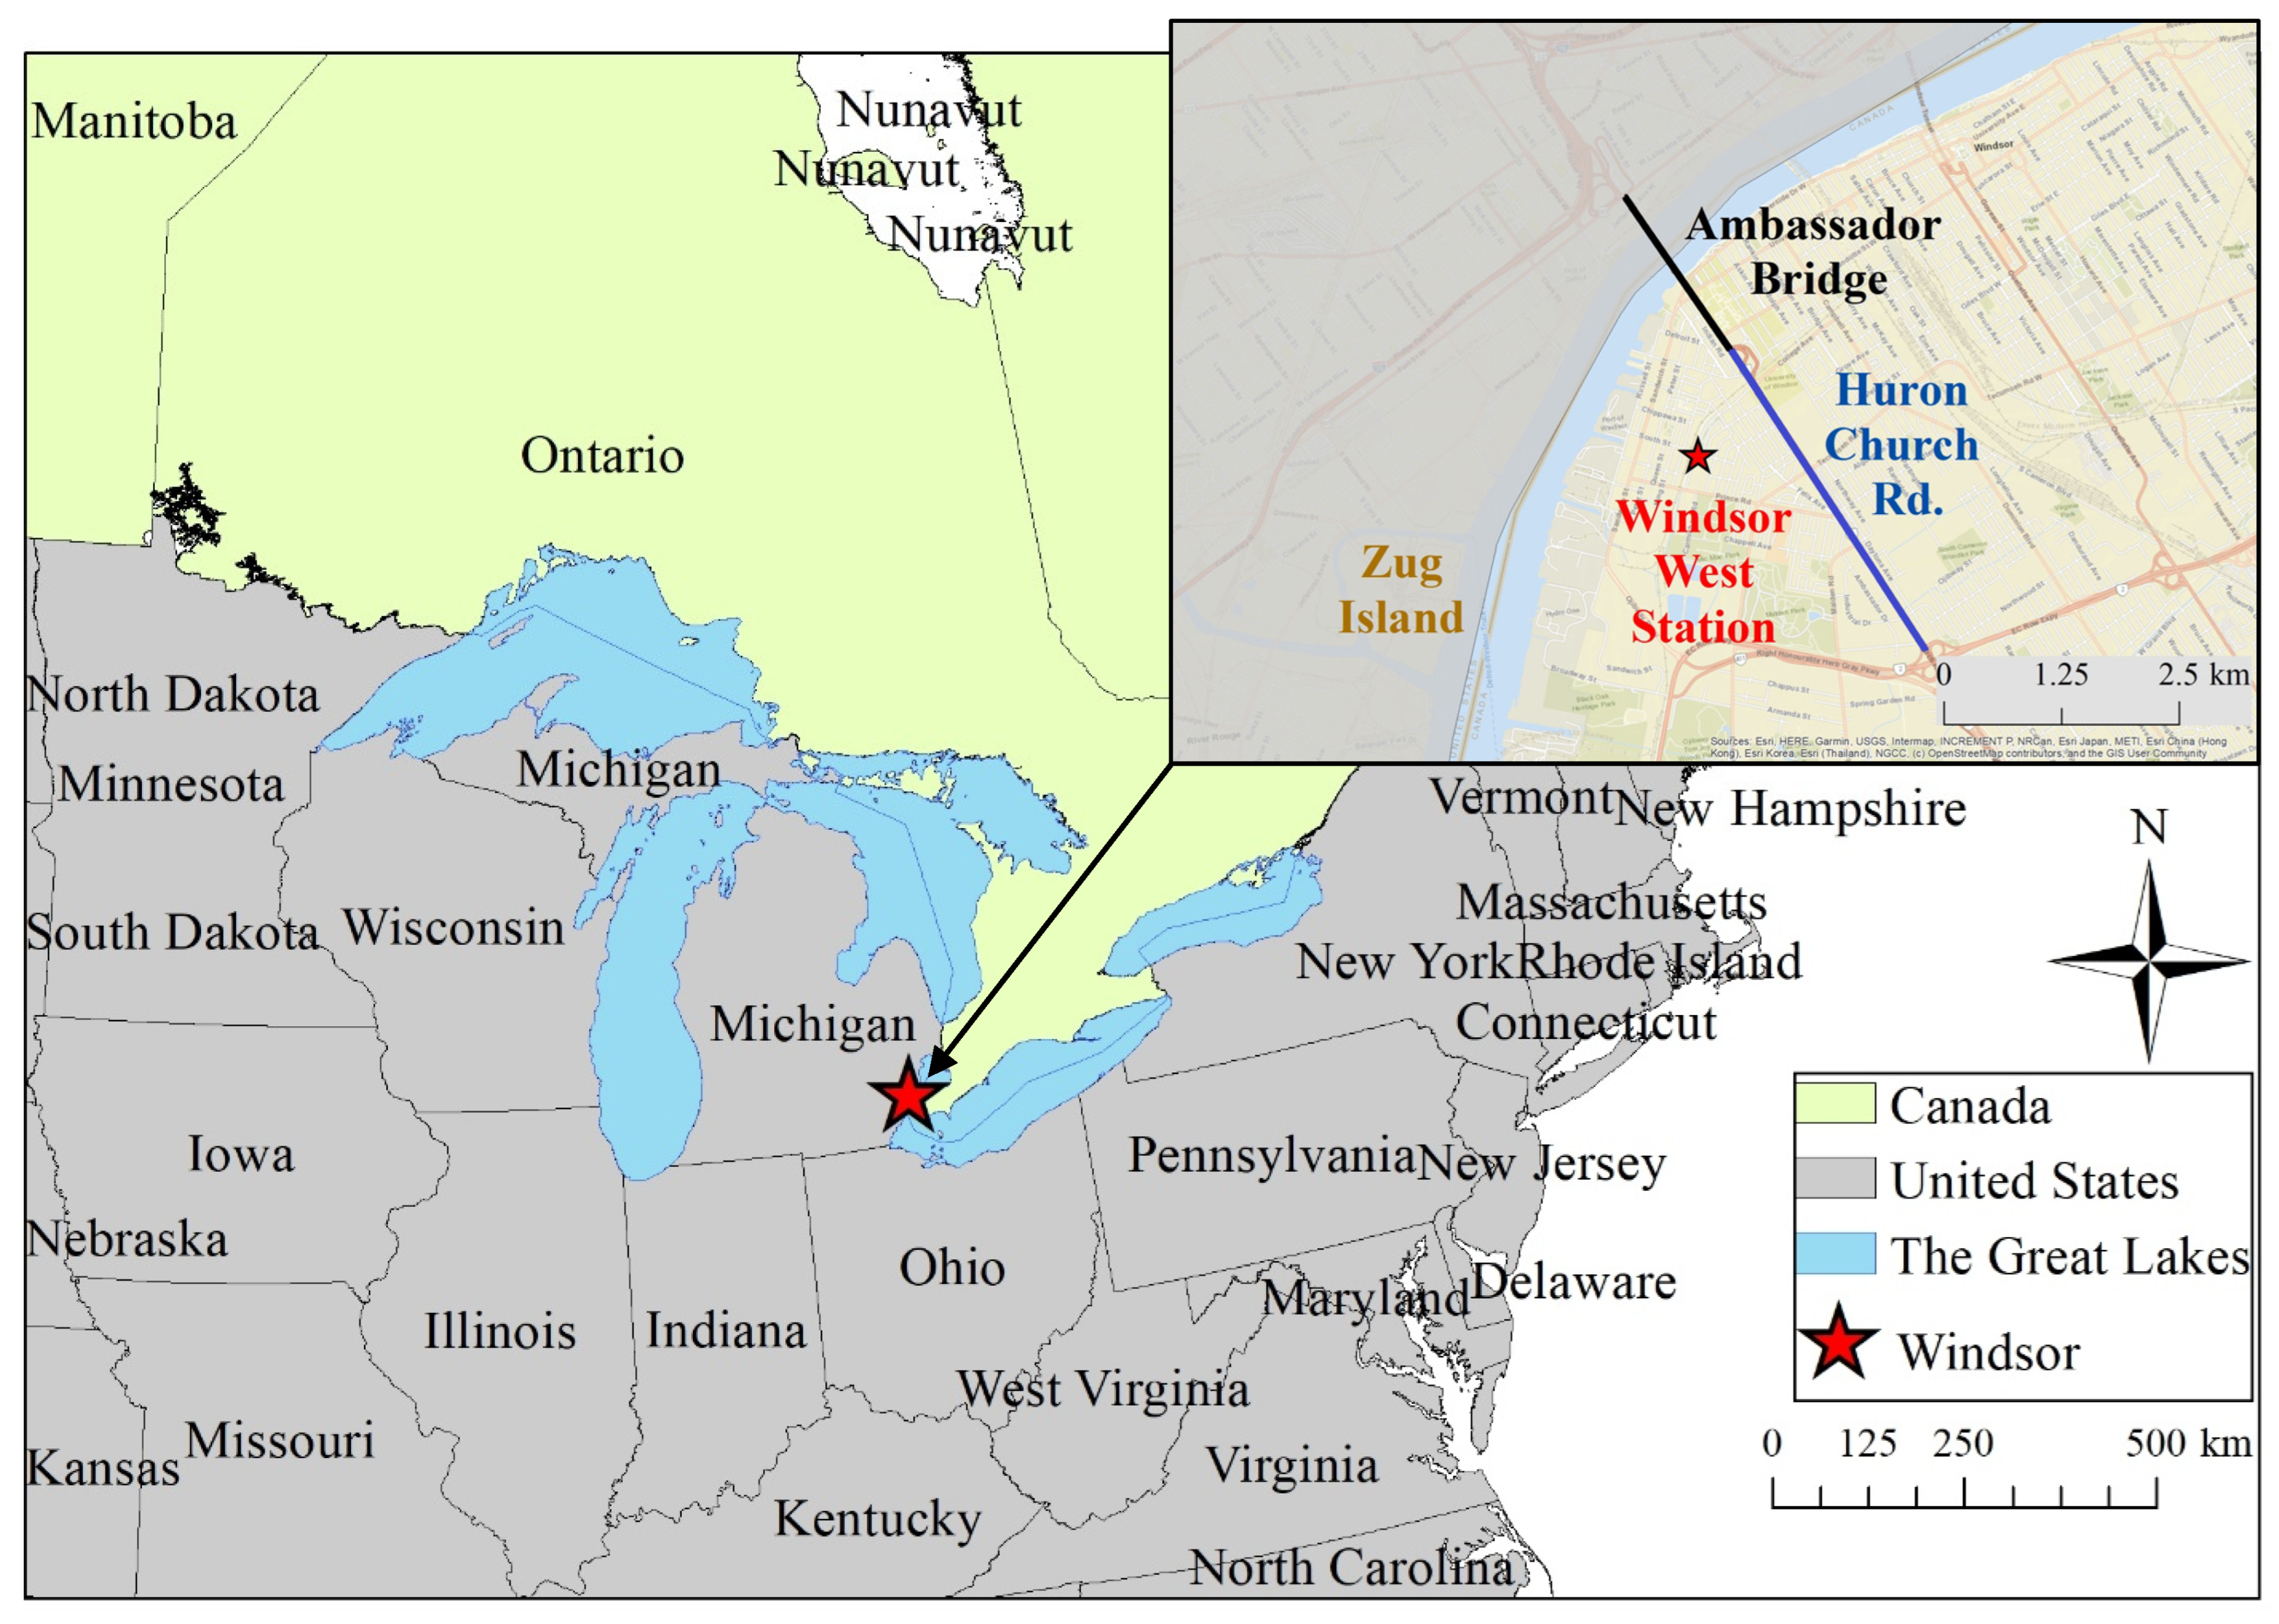
Hourly measurements of PM2.5-bound elements and PM2.5 mass were conducted during April 2021–April 2023 at Windsor West air monitoring station in a residential area. The location is devoid of notable point emissions within a 2 km radius, as illustrated in Figure 1. Detailed information on the station and its surrounding environments can be found in our previous paper [28].
Hourly concentrations of 24 PM2.5-bound elements (i.e., Ag, As, Ba, Br, Ca, Cd, Co, Cr, Cu, Fe, Hg, K, Mn, Ni, Pb, Rb, S, Se, Si, Sn, Sr, Ti, V, and Zn) were continuously measured by an Xact 625 particulate metal analyzer (Pall Corporation, Port Washington, NY, USA). The Xact 625 is an online X-ray fluorescence (XRF) spectrometer specifically designed for monitoring multiple metals in ambient particles with high temporal resolution [32]. In the Xact 625, ambient air is sampled through a PM2.5 inlet at a flow rate of 16.7 L/min for 60 min and drawn through a filter tape. The PM deposit is then automatically advanced for 20 s for each hour and analyzed by XRF for metals while the next sample is being collected. The analyzer emits high-energy X-rays onto the surface of the PM sample. These X-rays have enough energy to eject inner shell electrons from the atoms in the sample. When inner shell electrons are ejected, outer shell electrons would transition to fill the vacancy, emitting characteristic X-ray photons in the process. The energies and intensities of these emitted X-rays are characteristic of the elements present in the sample [32]. This technique cannot distinguish between different oxides. As such, XRF quantifies the total concentration of each element in a sample [33].
Calibrations of temperature and pressure sensor and flow system were conducted every month using certified calibration units. The XRF response was calibrated once every 6 months using thin-film standards for selected elements (i.e., Cd Cr, Mn, Pd, Se and Sr) provided by Cooper Environmental Services (Portland, OR, US). These element standards are free from any interfering elements and contain a known amount of each element on a Nucleopore substrate that is mounted on a plastic ring. The accuracy of measurements with the Xact 625 analyzer is demonstrated by its high linearity value of R2 ≥ 0.99 [34]. This value represents the coefficient of determination between the instrument’s response and the known concentrations of the analyte within a defined range.
Concentrations of hourly PM2.5 mass were monitored by a synchronized hybrid ambient real-time particulate (SHARP) 5030 monitor (Thermo Fisher Scientific Corporation, Franklin, MA, USA) from April 2021 to November 2022, and by a T640 monitor (Teledyne API, San Diego, CA, USA) from December 2022 to April 2023. A collocated study at Toronto North station over five years (from June 2017 to October 2022) showed comparable measurements by the two instruments. Hourly concentrations were highly correlated between T640 and SHARP 5030 with an R2 of 0.77, a regression slope of 0.86 and an intercept of 1.0. There was no difference in median hourly concentrations during the 5-year period, indicating negligible systematic differences between the two instruments. Instrument internal performance checks were performed every month to ensure adherence to QA/QC and reporting practices [35]. Calibration of air flow rates of the instruments was carried out by the operator with a certified calibration unit once every 3 months.
Numbers for missing data points, data below method detection limits (MDLs) and flagged data points were counted for concentrations of PM2.5 and PM2.5-bound elements during the study period. For PM2.5 mass concentrations, 1.2% of data points are below the MDLs. For each of the 24 PM2.5-bound elements, the percentages of data points above MDLs ranged from 0% to 100% (Table S1). The flagged values of “−999” were substituted with blank cells to maintain consecutive date and time for individual elements. The processing of data points below MDLs is presented in Section 2.2.

2.2. Processing Data Below MDLs

PM2.5-bound element concentrations below MDLs are frequently observed with improved air quality. When the concentration dataset contains a large percentage of data points below MDLs, the mean values calculated using those uncensored data are likely biased, so are the health risk estimates. The USEPA recommends using the 95% upper confidence level (UCL) of the mean concentration to represent a conservative exposure concentration estimate [36]. This approach was widely applied to risk assessment studies, e.g., in Ningbo, China [27]; in Fort McKay and Fort McMurray, Alberta, Canada [25]; and in Aglantzia, Cyprus [26]. In each study, the cumulative CRs and chronic HQs were calculated based on the 95% UCL of the mean concentration for selected elements. However, other studies used the mean concentrations, e.g., in Lanzhou, China [37], and Jinan, China [38], to estimate lifetime incremental CRs and chronic HQs.
Two scenarios were employed to process data points below MDLs. For Scenario 1, data points below MDLs were replaced with their MDLs. For Scenario 2, data points below MDLs were replaced based on the data distribution of the remaining values, i.e., the Kaplan–Meier (KM) method, which is a function embedded in the USEPA Pro-UCL 5.1 software [39]. The software identifies data points below MDLs and replaces them based on the data distribution of the remaining values [39]. It is well-known that the KM method yields a better estimate of the population mean [40].
In this study, mean concentrations and its 95% UCL of PM2.5 mass and individual PM2.5-bound elements were calculated for each of the two scenarios and summarized in Table S2. It was vital to maintain the conservative nature of health risk assessment. Therefore, the 95% UCL of the mean concentration was used from either Scenario 1 or Scenario 2, whichever yielded a higher value. The higher 95% UCL of the mean value calculated from the two scenarios was used to calculate the lifetime incremental CRs and chronic non-cancer HQs for Windsor, although this approach may overestimate risks.

2.3. Statistical Analysis

The distribution of hourly concentrations of PM2.5 mass and each of the 24 elements was analyzed throughout the two-year study period from April 2021 to April 2023. For all elements, data do not follow any of the three types of distributions (i.e., normal, lognormal, or gamma). Most of PM2.5-bound elements exhibited a right-skewed distribution in the data.
Time series and general statistics of PM2.5 mass concentrations and PM2.5-bound elements concentrations were generated using the original dataset without replacing data below MDLs. Diurnal and seasonal variations were investigated to assess the impact of local human activities and to assess whether hour of day and seasonal variability of PM2.5-bound elements is consistent with that of PM2.5 mass concentrations. One-way ANOVA was used to compare the mean concentrations of four seasons in order to determine whether they are significantly different. Subsequently, the Tukey grouping method was employed to assess specific seasons showing significant differences from one to another. Spring is defined from March to May, summer is from June to August, fall is from September to November, and winter is from December to February. Spearman rank correlation was conducted on the hourly and hour-of-day averaged concentrations of PM2.5 mass and PM2.5-bound elements to investigate if elements with moderate to high correlation coefficients with PM2.5 mass exhibit similar temporal patterns.

2.4. Approaches to Estimate Health Risks

The lifetime incremental CRs and chronic HQs due to inhalation exposure to PM2.5-bound elements in Windsor were estimated using 95% UCL of mean concentrations of PM2.5-bound elements collected from April 2021 to April 2023. The 95% UCL of mean concentrations were calculated based on the two scenarios presented in Section 2.2, i.e., in Scenario 1, data points below MDLs were replaced with their MDLs; in Scenario 2, data points below MDLs were replaced based on the data distribution of the remaining values that are equal to or above MDLs. The higher of the 95% UCL of mean concentrations computed from the two scenarios was used to calculate the lifetime cumulative CRs and chronic HQs. The major contributors to total CR or HQ were determined by ranking CR or HQ per element from the highest to lowest.
There are three assumptions associated with USEPA’s health risk assessment approaches: (1) the 95% UCL of mean concentrations of PM2.5-bound elements during the study period are representative of lifetime average concentrations, (2) the 95% UCL of mean concentrations are representative of personal exposure concentrations, and (3) each selected element posed independent and equal-weighted effects to human health, i.e., there are no synergistic or antagonistic chemical interactions [41], which likely underestimates CRs and HQs. Further, the Xact 625 metal analyzer lacks the capability to differentiate between elemental and oxidized forms [33]. Consequently, the concentrations it reports are total concentrations comprising both elemental and oxidized forms. The total concentrations are likely higher than the elemental concentrations. Assumptions are made to equate total concentrations to their elemental form. As such, the health risks using total concentrations of each element would likely be overestimated.
Six PM2.5-bound elements (i.e., As, Cd, Co, Cr, Ni, and Pb) were selected to estimate the lifetime incremental CRs because they are considered as carcinogens by USEPA [42], WHO [12] and U.S. Department of Health and Human Services [43]. A comprehensive literature review was conducted to compile inhalation unit risks (IURs) for individual elements developed by different agencies, as listed in Table S3. These IURs were taken from U.S. DHHS, USEPA, WHO, OEHHA, and Health Canada since they are peer-reviewed and internationally recognized benchmarks for risk assessment. When multiple IURs existed for one element, the most conservative IUR was selected to ensure conservative nature of health risk assessment although this approach may overestimate risks. Following the USEPA method [23], individual CRs for each selected element was calculated and the total CR was the summation of all individual CRs using Equation (1).
CR = i = 1 N E C E i × I U R i
where ECEi is the inhalation exposure concentration of the ith element (µg/m3) which is the 95% UCL of mean observed concentrations during the study period, IURi is inhalation unit risk (µg/m3)−1 of the ith element (Table S3), and N is the number of selected carcinogenic elements (i.e., 6 elements in this study). The IUR of each element is developed directly from a dose–response analysis based on standard inhalation rate (m3 air/day) body weight (kg), exposure duration (days), the slope factor (i.e., cancer potency slope, mg/kg body weight–day). The more toxic element has a larger slope factor, hence a larger IUR [44]. When two or more IUR values are available for an element from different agencies (4 out of 6, Table S3), the largest and smallest of IURs were used to obtain a range of CRs for that element. For example, the IURs of 3.3 × 10⁻³ (µg/m3)−1 [45] and 6.4 × 10⁻³ (µg/m3)−1 [46] (Table S3) were used to calculate CRs for As. The IUR is available for Cr(VI) but not for Cr [42]. Therefore, incremental lifetime CR of Cr(VI) was calculated instead of Cr. The concentrations of Cr(VI) is assumed to be as one seventh of Cr concentrations [47]. According to the USEPA guidelines, the upper limit of acceptable lifetime CR is 1 in 10,000 (i.e., 10−4) [48]. In other words, there is a concern for increased CRs when the risk is greater than or equal to 10−4 [49]. Some health institutions also use the threshold of 10−6 to 10−5, e.g., European Chemical Agency [50].
Eleven PM2.5-bound elements (i.e., As, Ba, Cd, Co, Cr, Hg, Mn, Ni, Pb, Se, and V) were used to estimate chronic inhalation exposure of non-cancer HQs in Windsor. These elements are selected because they pose significant non-carcinogenic health effects to humans [42,45,46,49]. A comprehensive literature review was conducted to collect reference concentrations (RfCs) or equivalent concentrations for individual elements reported by different agencies (Table S4). These RfCs were taken from USEPA, ATSDR, Health Canada, OEHHA, and MECP since they are peer-reviewed and internationally recognized benchmarks for risk assessment. The individual and total HQ were calculated using Equation (2) following the USEPA method [23].
HQ = i = 1 M E C E i R f C i
where RfCi is the reference concentration (µg/m3) for the ith element (Table S4) and M is the number of selected non-cancer-causing elements (11). When two RfC values are available for an element (five out of 11), the largest and smallest RfCs were used to obtain a range. HQs less than or equal to 1 indicate that inhalation exposure to these elements has insignificant non-cancer health effects to humans, while HQs greater than 1 suggest inhalation exposure to these elements might pose significant non-cancer health effects; consequently, remedial actions are needed [51].
Diurnal and seasonal variations in total and individual CRs and HQs were investigated, and lifetime incremental CRs and chronic HQs per PMF-resolved source were calculated using factor profiles derived from the previous PMF source apportionment study in Windsor [28]. For example, the vehicular exhaust factor includes 75% of As, 11% of Cd, 18% of Co, 27% of Cr, 11% of Ni, and 27% of Pb (Table S5). The CR contributed by this source is the summation of CRs from 75% of CR by As, 11% of CR by Cd, 18% of CR by Co, 27% of CR by Cr(VI), 11% of CR by Ni, and 27% CR by Pb.

3. Results and Discussion

3.1. Concentrations of PM2.5 and PM2.5-Bound Elements

3.1.1. General Statistics

The statistics of PM2.5 mass and PM2.5-bound element concentrations in Windsor between April 2021 and April 2023 are summarized in Table 1. The two-year average PM2.5 concentration was 9.20 ± 5.86 µg/m3, which is comparable to the annual means of 8.3 µg/m3 and 9.6 µg/m3 in 2021 at Windsor Downtown and Windsor West station, respectively [52], but slightly above the Ontario Ontario’s Ambient Air Quality Criteria (AAQC) of 8.8 µg/m3 [53]. Much higher annual average PM2.5 mass concentrations have been reported in other urban centers, e.g., 51.4 ± 25.4 µg/m3 in Chengdu, China, during 2017–2018 [54]. Among the 24 elements, S, Si, Fe, K, and Ca were the predominant PM2.5-bound elements, with concentrations between 490 ± 421 ng/m3 and 70 ± 99 ng/m3 in descending order. These five elements combined contributed to 95% of total elemental concentrations in Windsor during the study period. These results are comparable with findings from the previous study in Windsor [28] and in other regions. For example, high proportions of Si (31%), K (22%), Ca (15%), and Fe (13%) among 13 measured PM2.5-bound elements have been reported in two cities in Korea, i.e., Chuncheon and Yeongwol, during 2012–2013 [55]; and concentrations of K (1086 ± 1002 ng/m3), Ca (1070 ± 1456 ng/m3), Fe (967 ± 997 ng/m3) and Zn (167 ± 117 ng/m3) combined contributed 88% of total 17 metallic masses in PM2.5 in Chengdu, China, during 2017–2018 [54]. The high coefficients of variance for Co and Sn (1751% and 9390%, respectively) were mainly to the result of their low mean concentrations and moderate standard deviations due to occasional episodic events. Sn was excluded from seasonal and diurnal trend analysis due to fewer data points above the MDL.

3.1.2. Seasonal Variability

As depicted in Figure S1, the results of one-way ANOVA with Tukey grouping indicate significant differences in concentrations among four seasons for PM2.5 mass and 22 out of 23 PM2.5-bound elements (except for Co) in Windsor during the study period. PM2.5 concentrations were higher in winter (10.5 µg/m3, Tukey’s group A) and summer (9.2 µg/m3, group B) and were lower in spring (8.8 µg/m3, group C) and fall (8.4 µg/m3, group D). The distinct letter of Tukey grouping indicates that PM2.5 concentrations significantly differ from each of the four seasons. The high PM2.5 mass concentrations in winter could be due to low mixing layer heights, and high PM2.5 concentrations in summer could be due to enhanced photochemical activity (higher solar flux and extended daylight hours compared to other seasons) that leads to higher rate of formation of secondary aerosol during summer months throughout the region [56]. Conversely, 18 out of 23 PM2.5-bound elements (i.e., Ag, Ba, Ca, Cd, Cu, Fe, Hg, K, Mn, Pb, Rb, S, Se, Si, Sr, Ti, V, and Zn) showed significantly higher concentrations in warm seasons of summer and fall than those in spring and winter (ANOVA, p < 0.01). This is likely associated with increased traffic volume and construction work in Windsor and surrounding areas during the study period. The concentrations of As, Br, Cr, and Ni exhibited less pronounced seasonal variation (Figure S1), as indicated by the overlapping whiskers in the interval plots. This is also evidenced by a lack of seasonal differences because they are classified in the same Tukey grouping (Figure S1). Co showed no significant variations in seasonal concentrations (p-value of ANOVA > 0.05), likely due to a large percentage of observations were below the MDLs.
The discrepancies in seasonal patterns of PM2.5 mass and PM2.5-bound elements concentrations were also indicated by weak-to-moderate Spearman correlations between them (ρ = −0.011 to 0.606, Figure S2). This is not unexpected because PM2.5 mass is influenced by both primary emissions and secondary formation (e.g., nitrate, sulphate, and ammonium) while trace elements largely from primary emissions. This further highlights the need for a study of temporal trends of PM2.5 mass and its associated elements separately.

3.1.3. Diurnal Variability

As illustrated in Figure S3, the highest PM2.5 levels occurred during the early morning hours of 5:00–6:00 local time. Subsequently, there was a continuous decline until 15:00, coinciding with the peak mixing height. Following this, PM2.5 concentrations showed a steady increase until 5:00 in the morning. A similar diurnal trend was also observed for five out of 23 PM2.5-bound elements: As, Ba, K, Pb, and V. This finding is further supported by moderate to high Spearman’s rank correlation coefficients (ρ = 0.67 to 0.805, p < 0.05, Figure S4) between hour-of-day average concentrations of PM2.5 mass and these five elements during the study period. Eight out of 23 elements (i.e., Br, Cr, Cu, Fe, Hg, Mn, Ni, and Zn) showed a less consistent diurnal pattern with PM2.5: peak concentrations occurred between 8:00 and 9:00 and then steadily declined until 2:00–3:00 after the midnight, followed by an increase thereafter. As such, the correlations between PM2.5 mass concentrations and these eight elements were weak to moderate (ρ = −0.134 to 0.602). Ca, Si and Ti showed the opposite diurnal trend compared to that of PM2.5, i.e., low in the early morning 3:00–5:00 and peaked in 8:00, with moderate to high negative correlation with hour-of-day PM2.5 mass concentrations (ρ = −0.631 to −0.755, p < 0.05). Sulfur showed a unique diurnal trend that peaked from 10:00 to 14:00 when solar radiation is strong, and low in midnight from 23:00 to 2:00. The diurnal pattern of sulfur closely tracks that of ambient temperature. The remaining six elements did not exhibit a distinct diurnal pattern with either a flat line (i.e., Ag, Cd, Co, and Rb) when there was a large percentage of measurements below MDLs (42–50%), or a zigzag pattern (i.e., Se and Sr) when hour-of-day averaged concentration fluctuated greatly. Unsurprisingly, these six elements exhibited weak-to-moderate correlations with PM2.5 mass concentrations (ρ = −0.235 to 0.62). Noting that elements of As, Ba, Cu, K, Mn, Ni, and Pb exhibited secondary peaks around late night of 23:00–3:00. This is likely associated with reduced atmospheric mixing height during that period.
Overall, there are similarities of the diurnal trend of 13 elements, indicating strong influence of both emissions from human activities and atmospheric mixing height. However, the diurnal trend of PM2.5 mass concentrations is only highly consistent with the following five elements: As, Ba, K, Pb, and V, but less consistent or even opposite with majority (18 out of 23) of PM2.5-bound elements. This discrepancy is likely because the 23 elements comprise a small portion of the total PM2.5 mass, approximately at 15%. In other words, PM2.5 mass concentration is not an effective surrogate of PM2.5-bound elements concentrations in terms of seasonal and diurnal variability, therefore monitoring PM2.5-bound elements remains essential.

3.2. Health Risk Assessment

3.2.1. Cancer Risks

The range of total incremental lifetime CRs due to inhalation exposure to the six PM2.5-bound elements (i.e., As, Cd, Co, Cr(VI), Ni, and Pb) was from 1.6 × 10⁻⁵ to 4.1 × 10⁻⁵, which is below the upper limit of acceptable level of 1 × 10⁻⁴. This is considered as no concern for incremental CRs [51]. Because total incremental lifetime CRs were calculated using two sets of IUR values, i.e., the highest and the lowest values, the difference was a factor of 2.5 between the total CRs computed by the upper and lower ranges of IUR values. The ratios between the upper and lower CRs for the six elements ranged from 1 to 12.5 (Table S6). Higher ratios were observed for Cr(VI) (12.5) and Ni (5.4), due to a large difference in upper and lower IURs for each of the two elements from different agencies. Utilizing the upper IUR is more conservative and may overestimate risks. The total incremental lifetime CRs in Windsor are comparable to those in other industrial cities, e.g., Aglantzia, Cyprus (5.3 × 10⁻⁵, [26]), Ningbo, China (2.5 × 10⁻⁵, [27]), and Düzce, Turkey (4.0 × 10⁻⁵, [57]). Differences in CRs between Windsor and other cities likely reflect variations in local emission sources (e.g., due to different economic activities) and meteorological conditions. The metal source profile in Windsor was impacted by its proximity to major U.S. industrial states, particularly those involved in metal processing (e.g., Cd and Ni), as well as heavy transportation corridors and cross-border freight traffic. In contrast, cities such as Aglantzia and Düzce were likely affected by their different industrial sectors and emissions across the studies, which may contribute to variability in elemental concentration profiles, consequently impacting the estimated CRs.
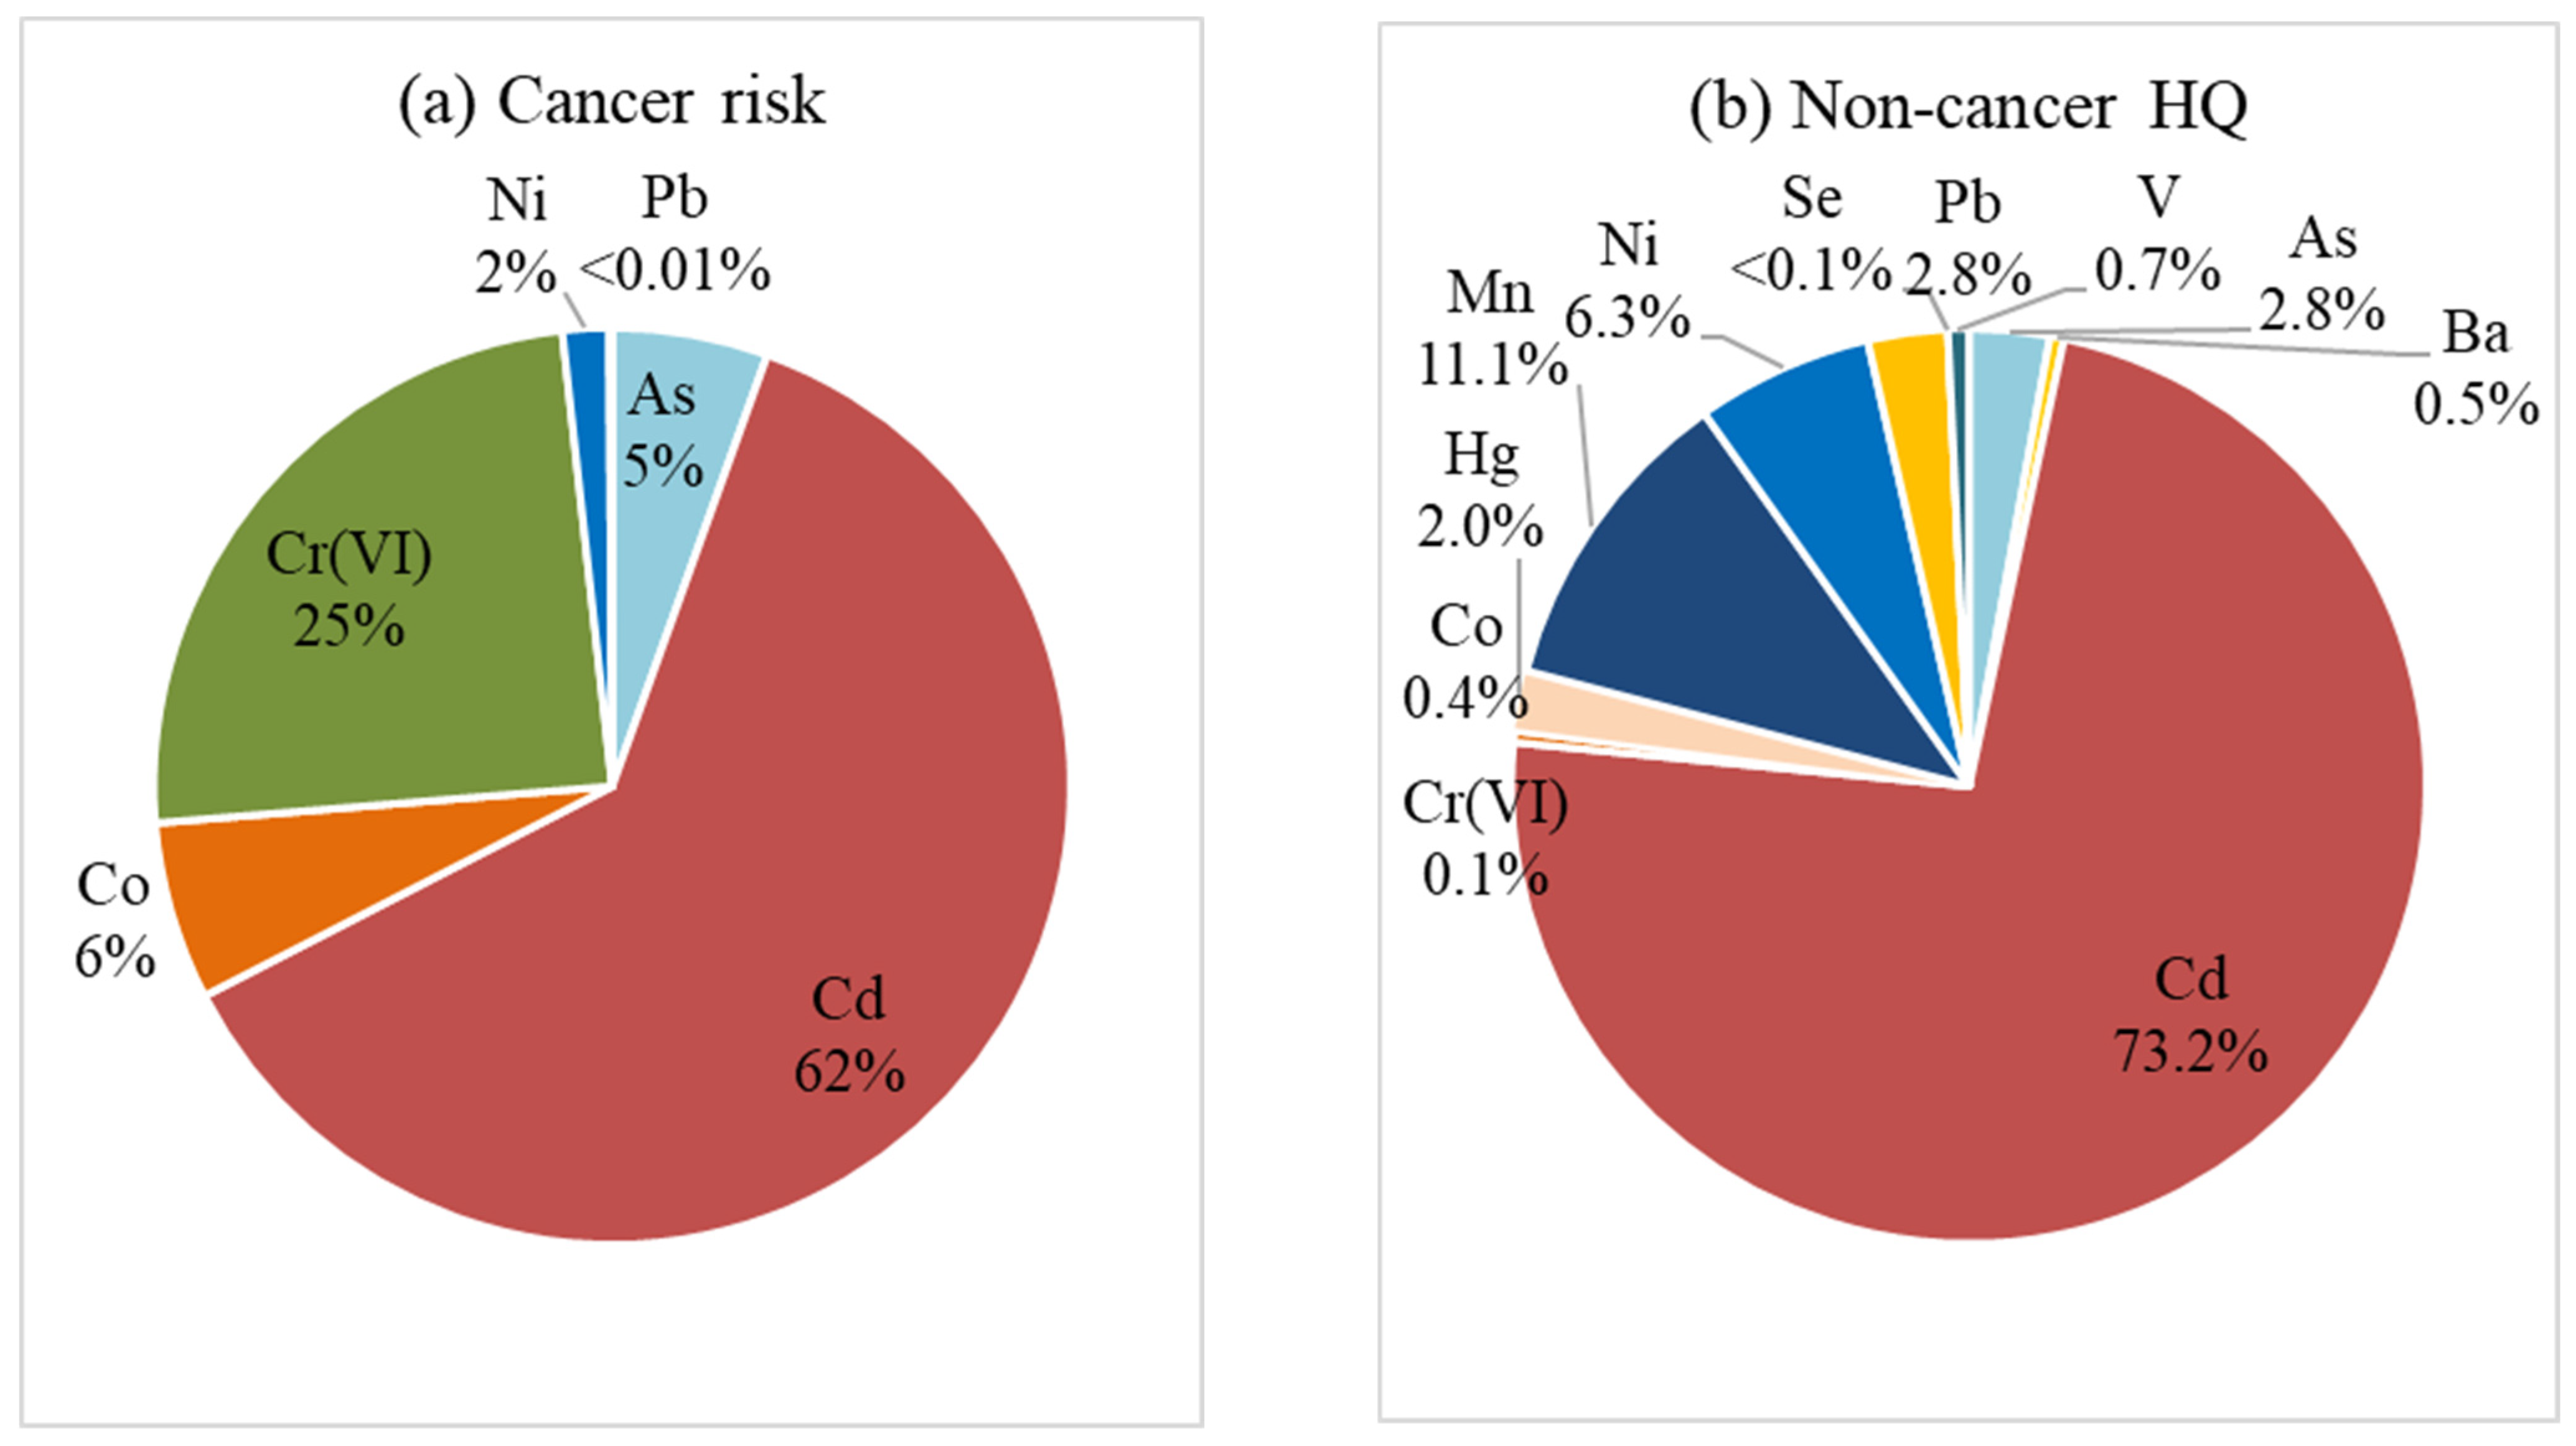
For the precautionary purpose, the discussion of CRs focuses on results computed with high IUR values for the six PM2.5-bound elements. Among the six elements, the largest contributor to the total CR was Cd (62%), followed by Cr(VI) (25%), Co (6%), As (5%), Ni (2%), and Pb (<0.1%) (Figure 2a). Cr(VI) has been identified as the primary contributor to total CRs in several studies, including Shanxi and Beijing, China [58,59], and Ulsan, Korea [60], owing to its high concentrations and toxicity. In this study, the top contributors to the total CR are not necessarily top contributors to total concentrations. Cr(VI) contributed more to the total CR (25%) than to the total concentrations of these six elements (1%, Figure S5a), due to its higher cancer-causing toxicity, i.e., higher IUR, compared to other elements (Table S3). In contrast, Pb contributed very little to the total CR (<0.1%) but was the second-largest contributor to the total concentrations (32%, Figure S5a) among the six elements. This is primarily because Pb has lower cancer-causing toxicity, i.e., lower IUR, compared to other elements (Table S3).
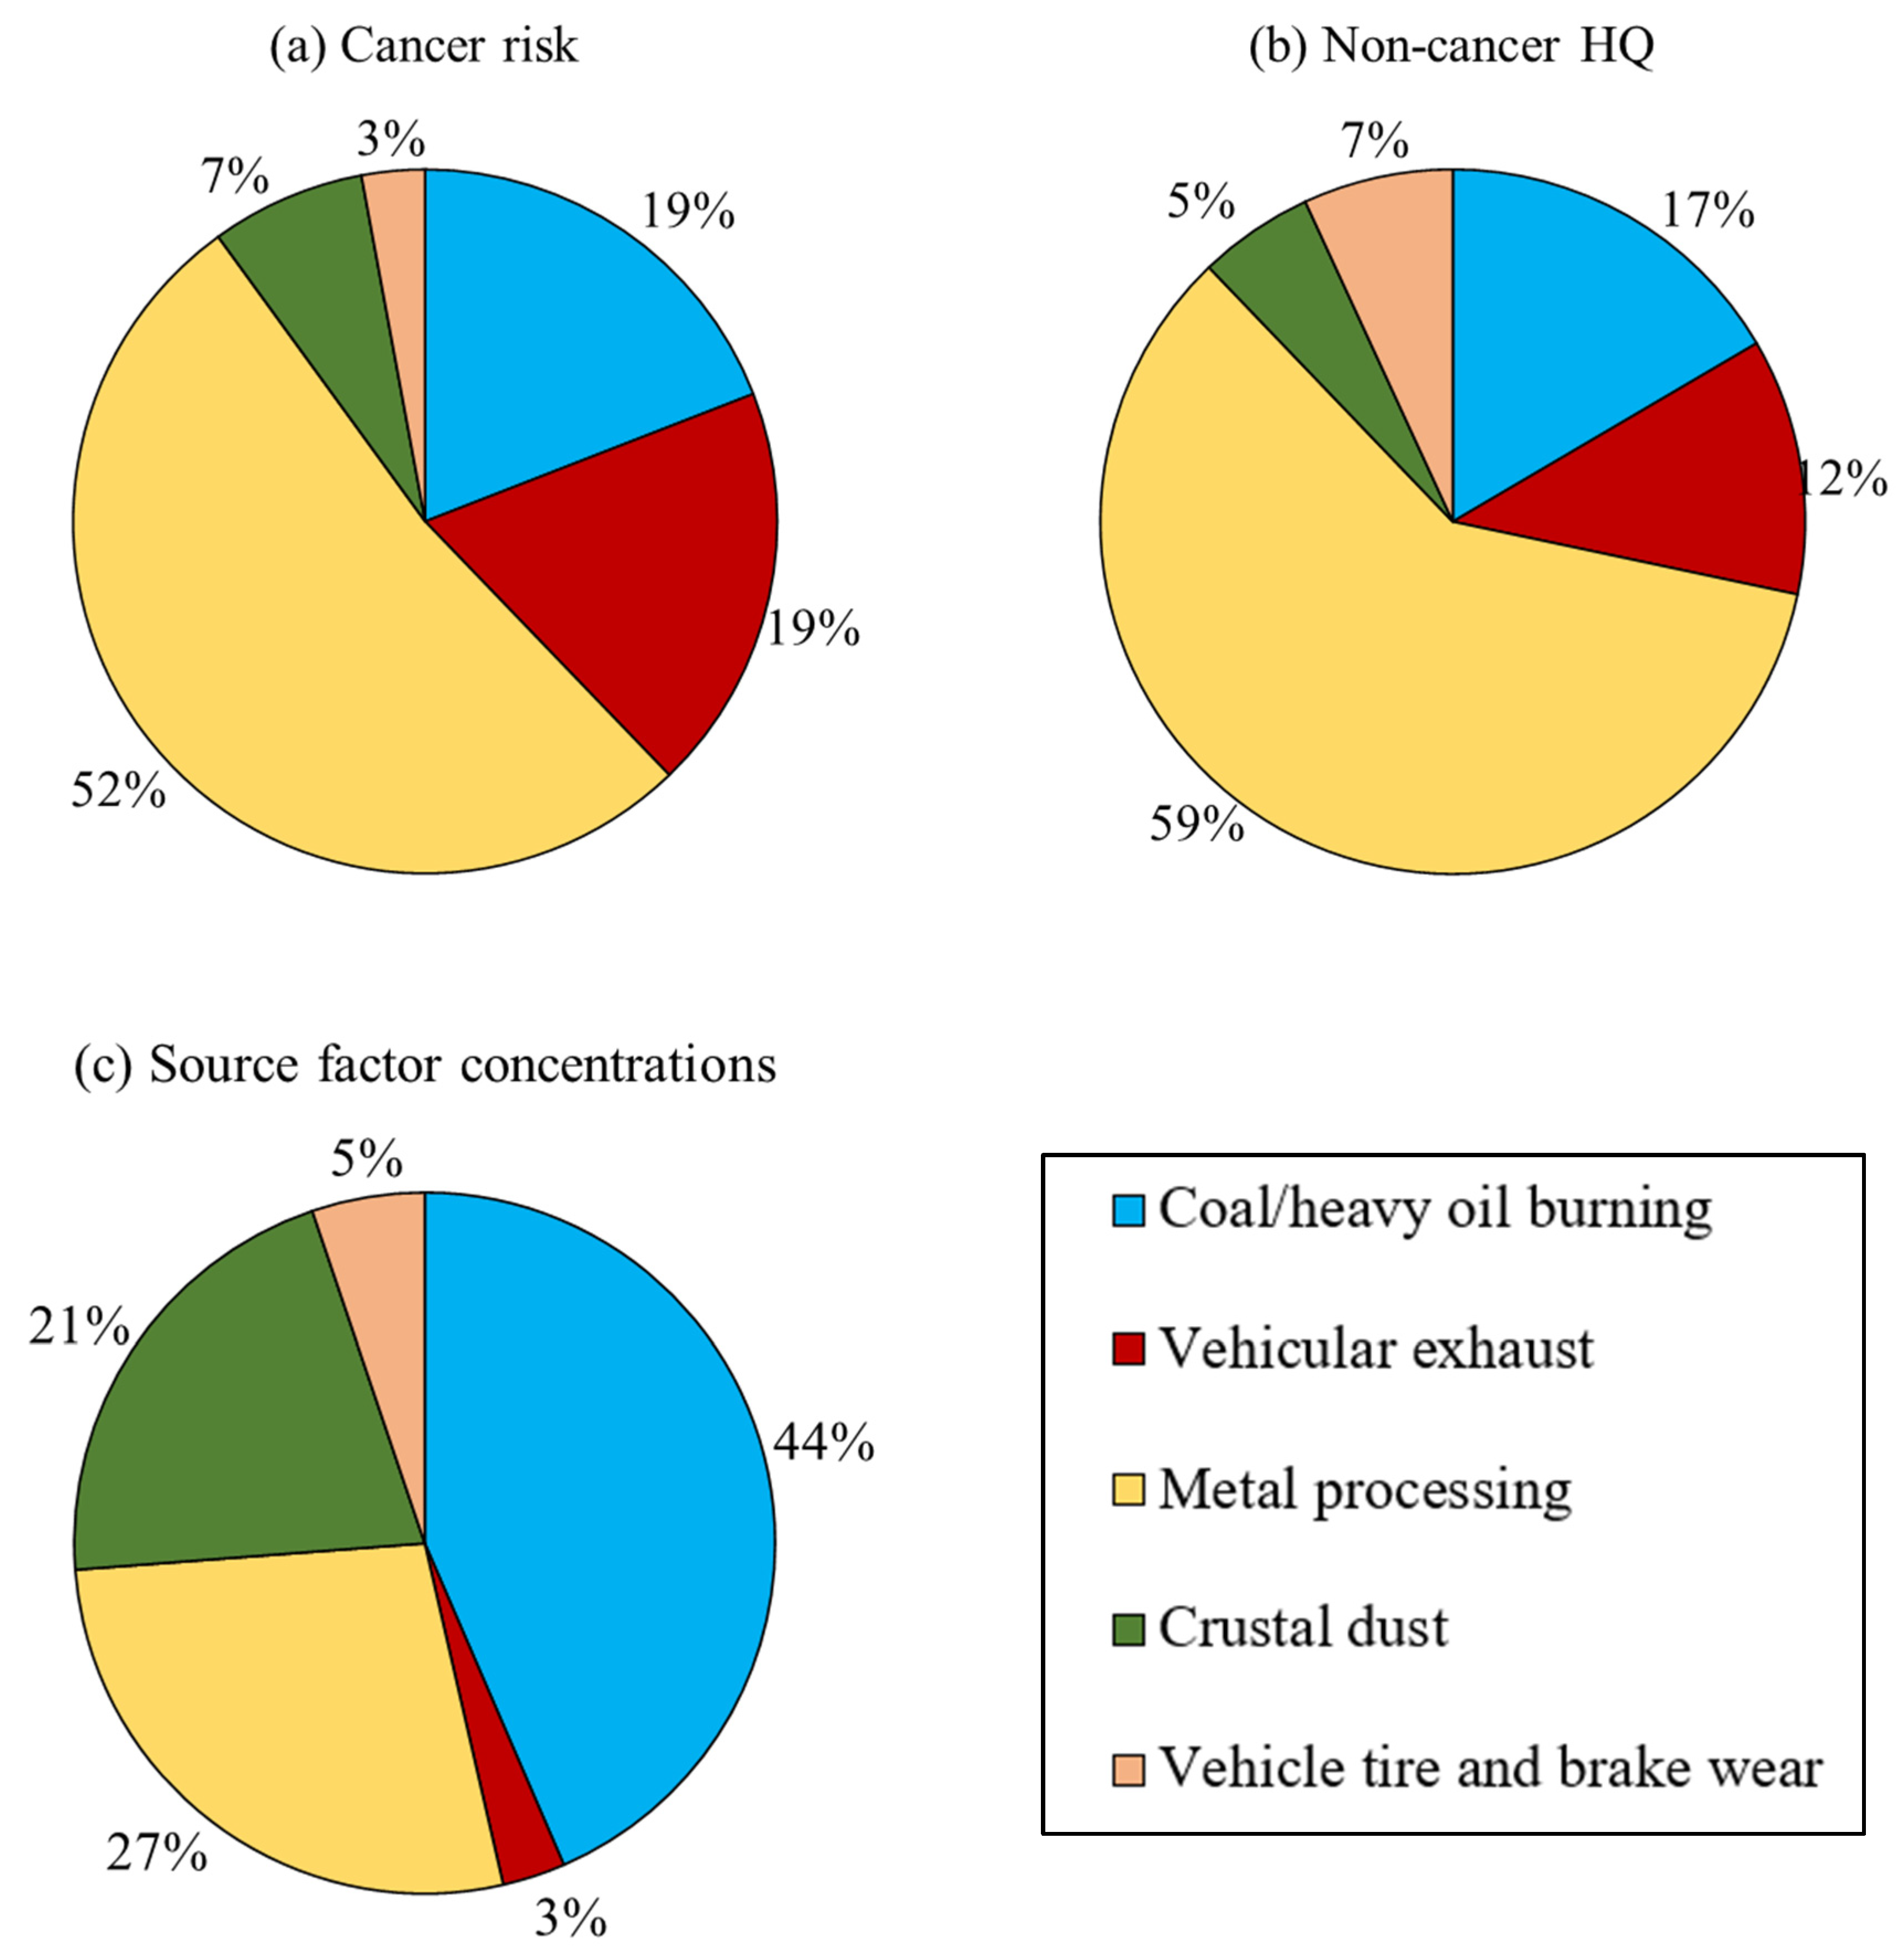
The total incremental lifetime CR from inhalation exposure was apportioned to the five identified sources in Windsor by summing risks of all available risk-posing elements in a particular source. Among the five PMF apportioned sources, metal processing was the largest contributor to the total incremental lifetime CR (52%, Figure 3a). This is because 71% of Cd concentration and 82% of Co concentration were apportioned to the metal processing factor [28]. In addition, elements Cd and Co were first and third largest contributors to the total CR, respectively (Figure 2a). The next two largest contributing sources were coal/heavy oil burning and vehicular exhaust, each contributing 19% and 19% of the CR, respectively. The last two sources, i.e., crustal dust and vehicle tire and brake wear, each contributed 7% and 3%, respectively, to the total incremental lifetime CR. This finding indicates that reducing Cd emissions from metal processing sources could substantially lower the total incremental lifetime CR in Windsor. Therefore, additional emission control measures for the metal processing industry in Windsor and the surrounding areas are warranted.
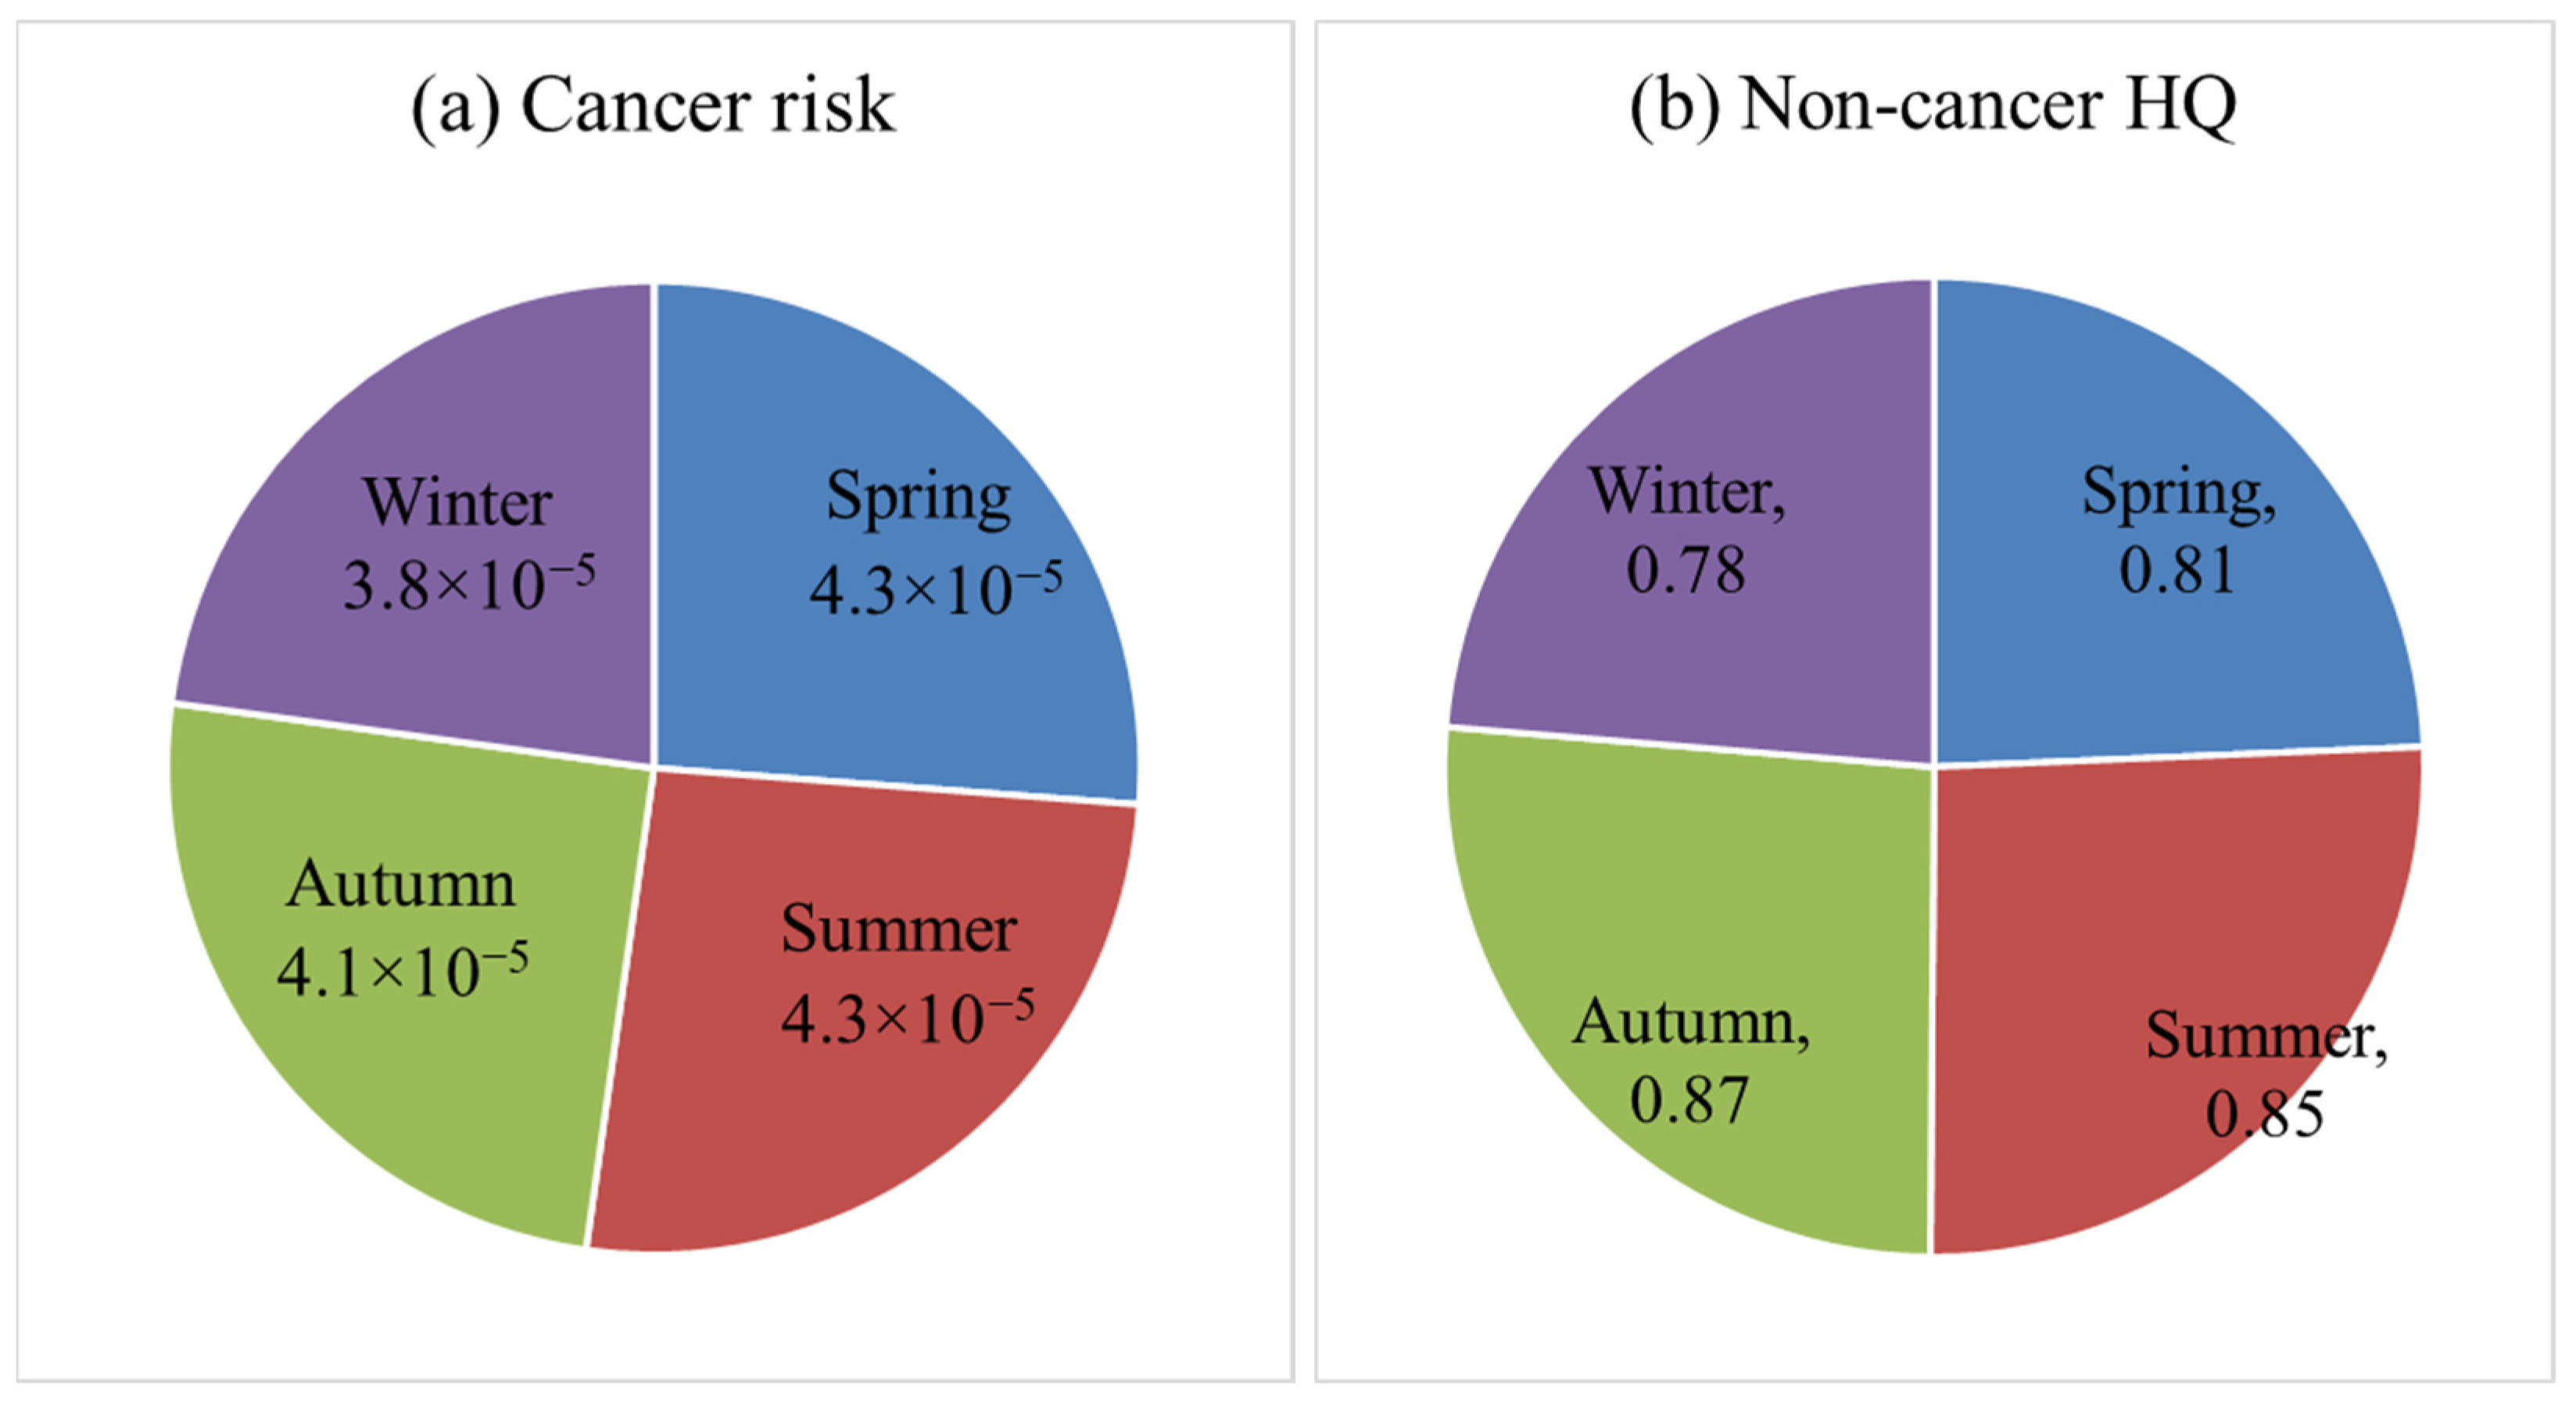
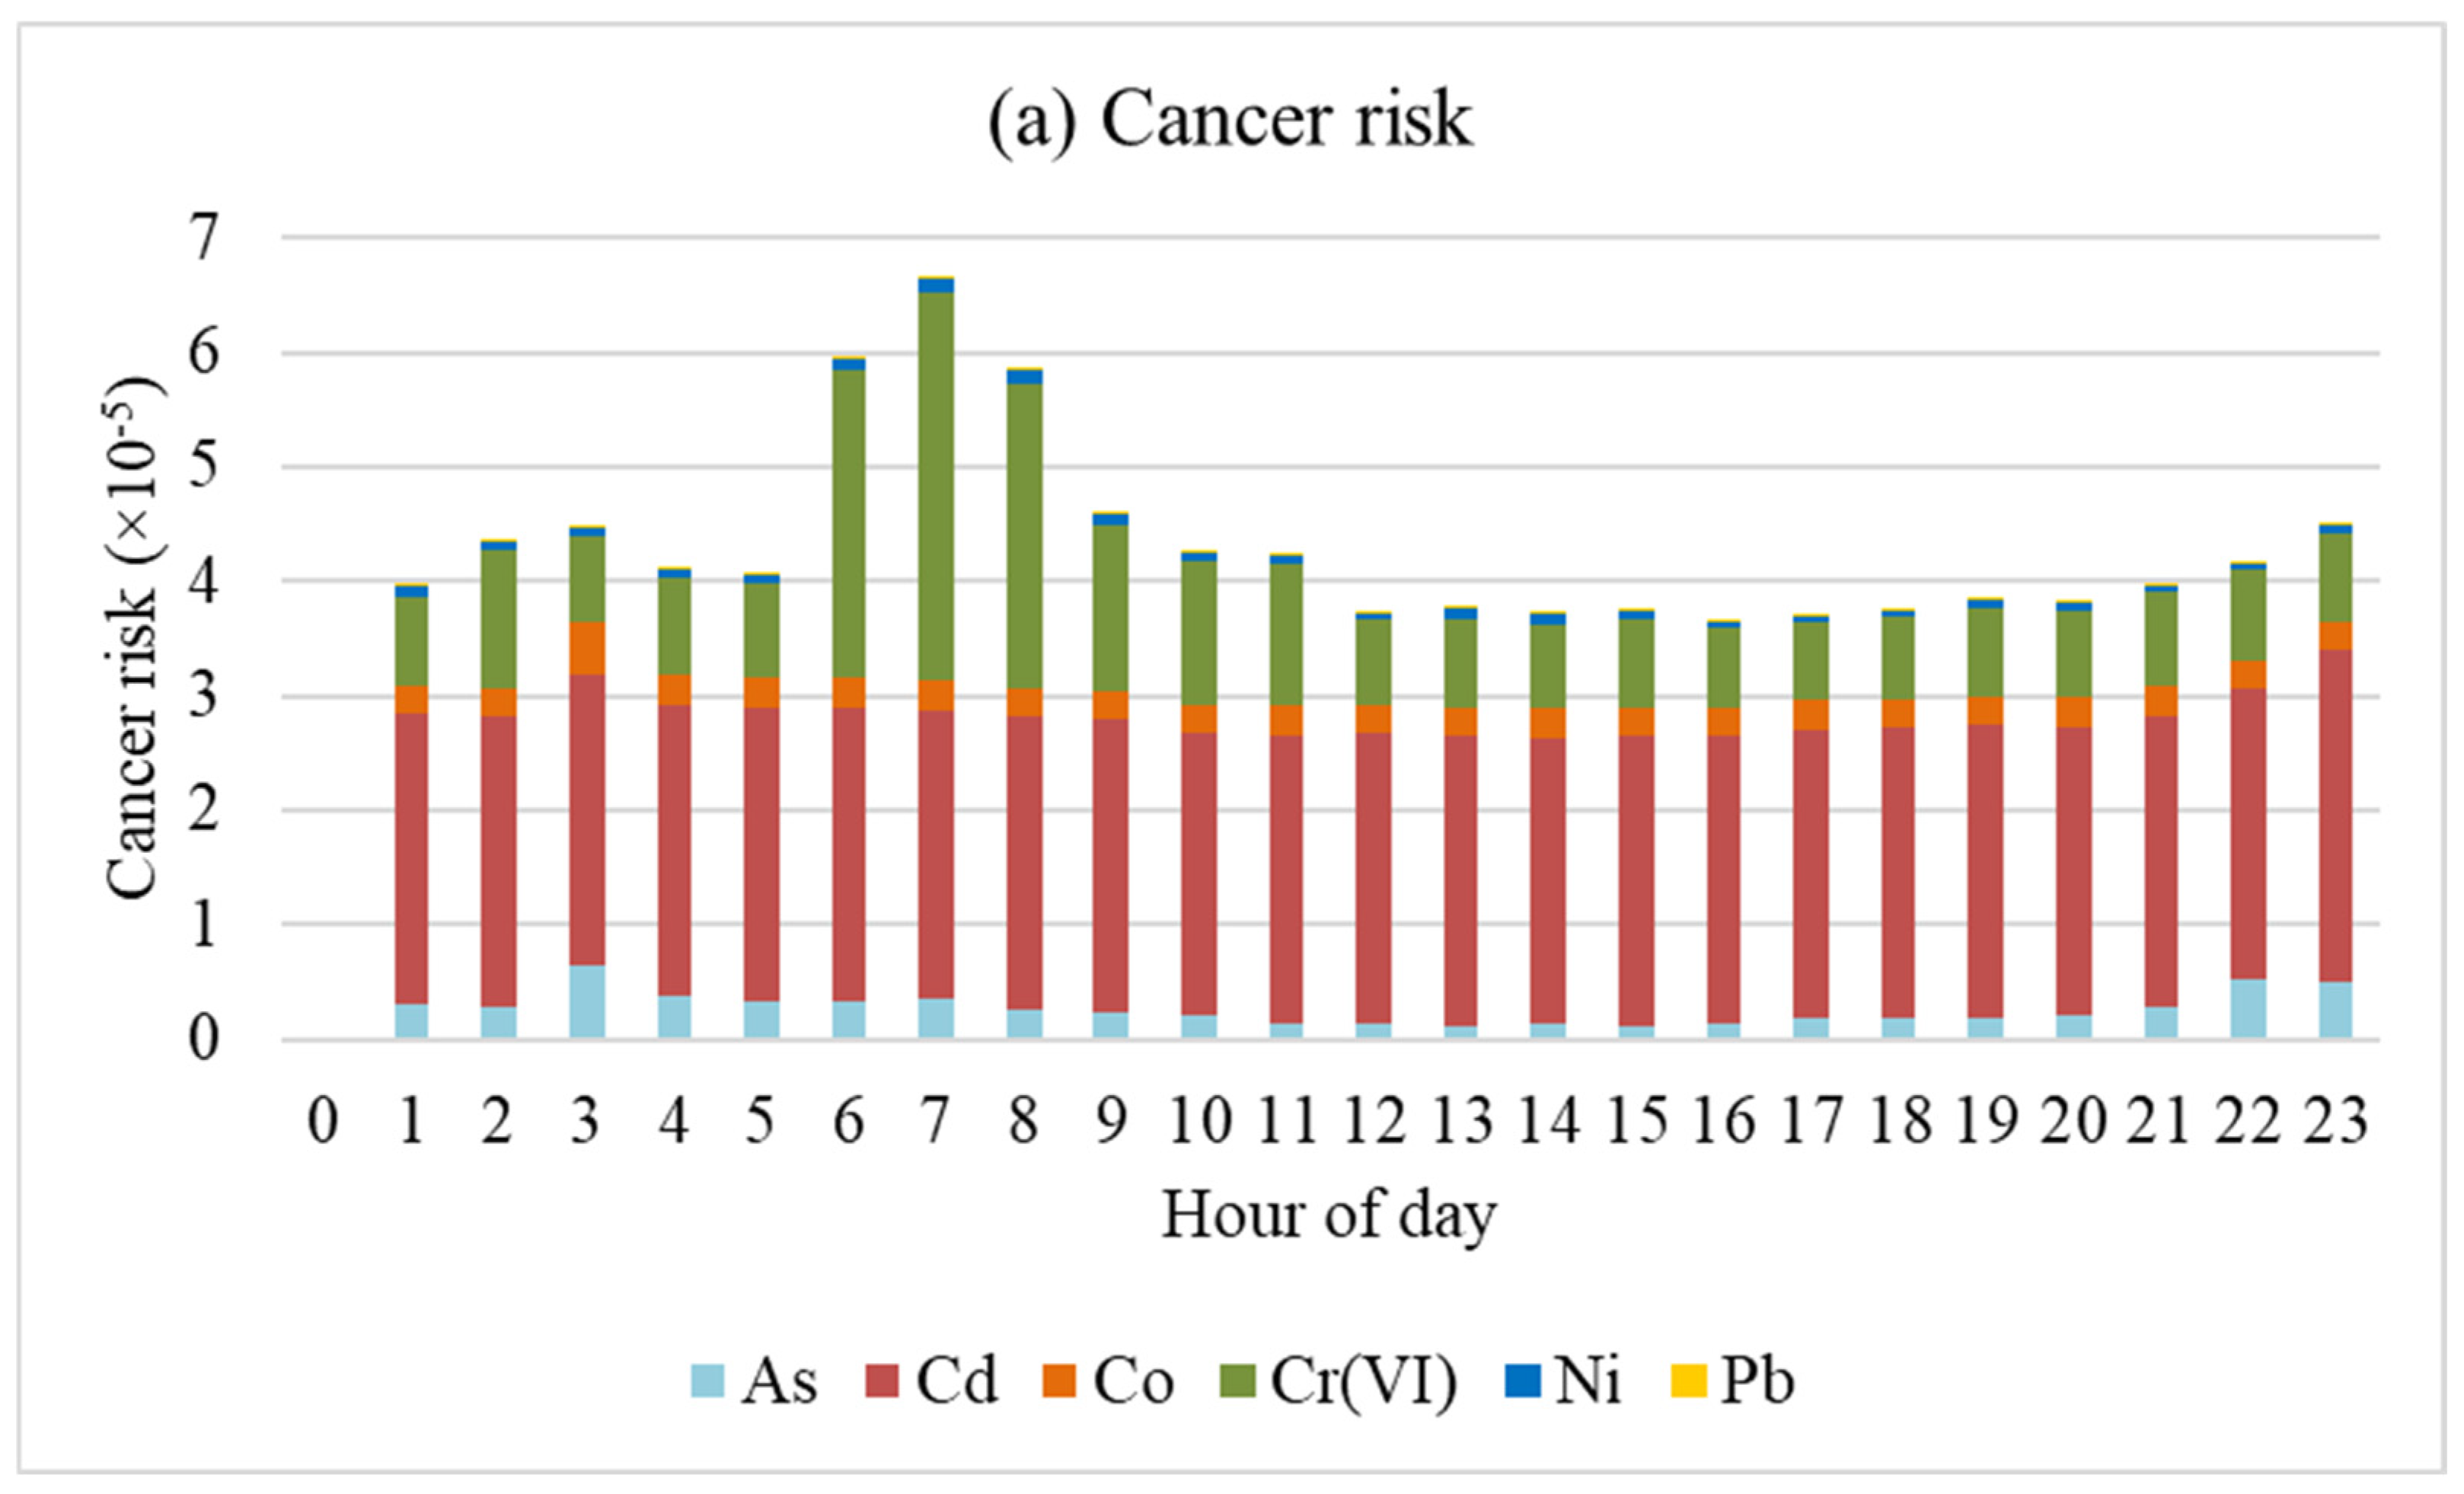
Overall, total CRs are comparable among the four seasons with slightly higher values in summer (4.3 × 10⁻⁵), spring (4.3 × 10⁻⁵), and autumn (4.1 × 10⁻⁵) than in winter (3.8 × 10⁻⁵), as illustrated in Figure 4a. Figure 5a and Figure S6 depict diurnal variability of total and individual incremental lifetime CRs in Windsor calculated from 95% UCL of mean concentrations for selected elements. None of hour-of-day averaged total CRs exceeded the USEPA’s tolerate level of 1 × 10⁻⁴, suggesting an acceptable risk [48]. The total CRs were higher during the morning rush hours of 6:00–8:00 (average = 6.2 × 10⁻⁵) and lower during daytime from 12:00 to 20:00 (average = 3.8 × 10⁻⁵). This is consistent with the diurnal concentration pattern of most elements owing to traffic/industrial activities and evolution of atmospheric mixing heights [28]. The higher total CRs during the morning rush hours are due to elevated concentrations of As, Cr(VI), and Ni (Figure S3), associated with peak traffic. The minor peak of total CRs in the late night (23:00–3:00) were mainly caused by elevated concentrations of As, Cd, and Ni. Among the six elements, CRs of As and Cr(VI) showed stronger hour-of-day variability, with coefficient of variance of CR being 50% and 64%, respectively. The remaining four elements (i.e., Cd, Co, Ni, and Pb) showed much weaker diurnal variations (coefficient of variance ranging from 3% to 26%). This is not unexpected because a large portion of ambient As and Cr(VI) were more likely from vehicular exhaust [28], which are strongly associated with traffic volumes and human activities throughout the day, leading to strong diurnal variability.

3.2.2. Chronic Non-Cancer HQs

The range of total HQs from chronic inhalation exposure to the 11 PM2.5-bound elements (i.e., As, Ba, Cd, Co, Cr, Hg, Mn, Ni, Pb, Se, and V) in Windsor was between 0.41 and 0.82, which is lower than the USEPA acceptable level of 1, suggesting exposure to these elements has insignificant non-cancer health effects to humans [51]. The upper and lower ranges of HQs differ by a factor of two. The ratios between the upper and lower HQs for the 11 elements ranged from 1 to 10 (Table S6). Higher ratios were observed for Hg (10) and Mn (6), due to a large difference in upper and lower RfCs from different agencies for each of the two elements. These total HQ values in Windsor are much lower than total HQ reported in Jinan, China (5.17, [38]), but higher than total HQ values reported in central Taiwan (0.26, [61]), Beijing (0.2, [62]), and Agri Valley, Southern Italy (0.15, [63]). These differences in total HQ values likely reflect variations in local industrial activities, emission control measures, meteorological conditions, and elements included in health risk assessments.
For the precautionary purpose, the discussion of chronic non-cancer HQs focuses on results computed with low reference concentrations, i.e., elements with high toxicity. Among the 11 PM2.5-bound elements, Cd was the largest contributor (73%) of the chronic HQ, followed by Mn (11%), Ni (6.3%), Pb (2.8%), As (2.8%) and Hg (2.0%) (Figure 2b). The summed HQ of the remaining five elements (i.e., Ba, Co, Cr(VI), Se, and V) contributed to less than 2%. Similar to the total CR, top contributors to the total HQ are not necessarily top contributors to the total concentrations. Ni contributed more to the total HQ (6.3%) than to the total concentrations (2.6%, Figure S5b) because Ni poses greater non-cancer health risks. This is indicated by lower reference concentrations, compared to other elements. Conversely, Pb contributed little to the total HQ (2.8%) but was the third-largest contributor to the total concentrations (18%, Figure S5b). This is primarily due to Pb’s lower non-cancer health effects, indicated by higher reference concentrations, compared to other elements (Table S3).
Among the five PMF apportioned sources, the metal processing factor was the top contributor (60%) of the total HQ (Figure 3b) owing to high fraction of Cd concentration being apportioned in this source ([28]; Table S3). The coal/heavy oil burning factor contributed 16% of the total HQ, followed by vehicular exhaust (12%), vehicle tire and brake wear (7%), and crustal dust (5%). The ranking order of HQs per source aligns with the ranking order of CRs (Table S7) for the top three contributors. However, the order reverses for the last two sources: crustal dust and vehicle tire and brake wear. Overall, our results suggest that reducing air emissions especially Cd from metal processing sources could significantly lower the incremental lifetime CR and chronic non-cancer HQ in Windsor area.
As shown in Figure 3, metal processing contributed more to the total CR (52%, Figure 3a) and total HQ (60%, Figure 3b) than to the total concentrations (27%, Figure 3c). This is because the elements enriched in this factor (e.g., Cd) are more toxic, causing both cancer and non-cancer health effects, indicated by high IUR and low RfC (Tables S3 and S4). A similar pattern of high contributions to the total CR and HQ, but low contributions to the total concentration, was observed for the vehicle exhaust factor. Conversely, coal/heavy oil burning contributed 19% to the total CR and 16% to the total HQ, but was the largest contributor to the total concentrations (44%). This discrepancy is mainly due to some dominant elements (e.g., S) in this factor causing negligible cancer or non-cancer health effects (Table S5). Similar characteristics of low contributions to the total CR and HQ, but high contributions to the total concentrations were found for the crustal dust factor. For the vehicle tire and brake wear factor, contributions to the total CR, total HQ, and concentrations were similar at 5%, 3%, and 7%, respectively.
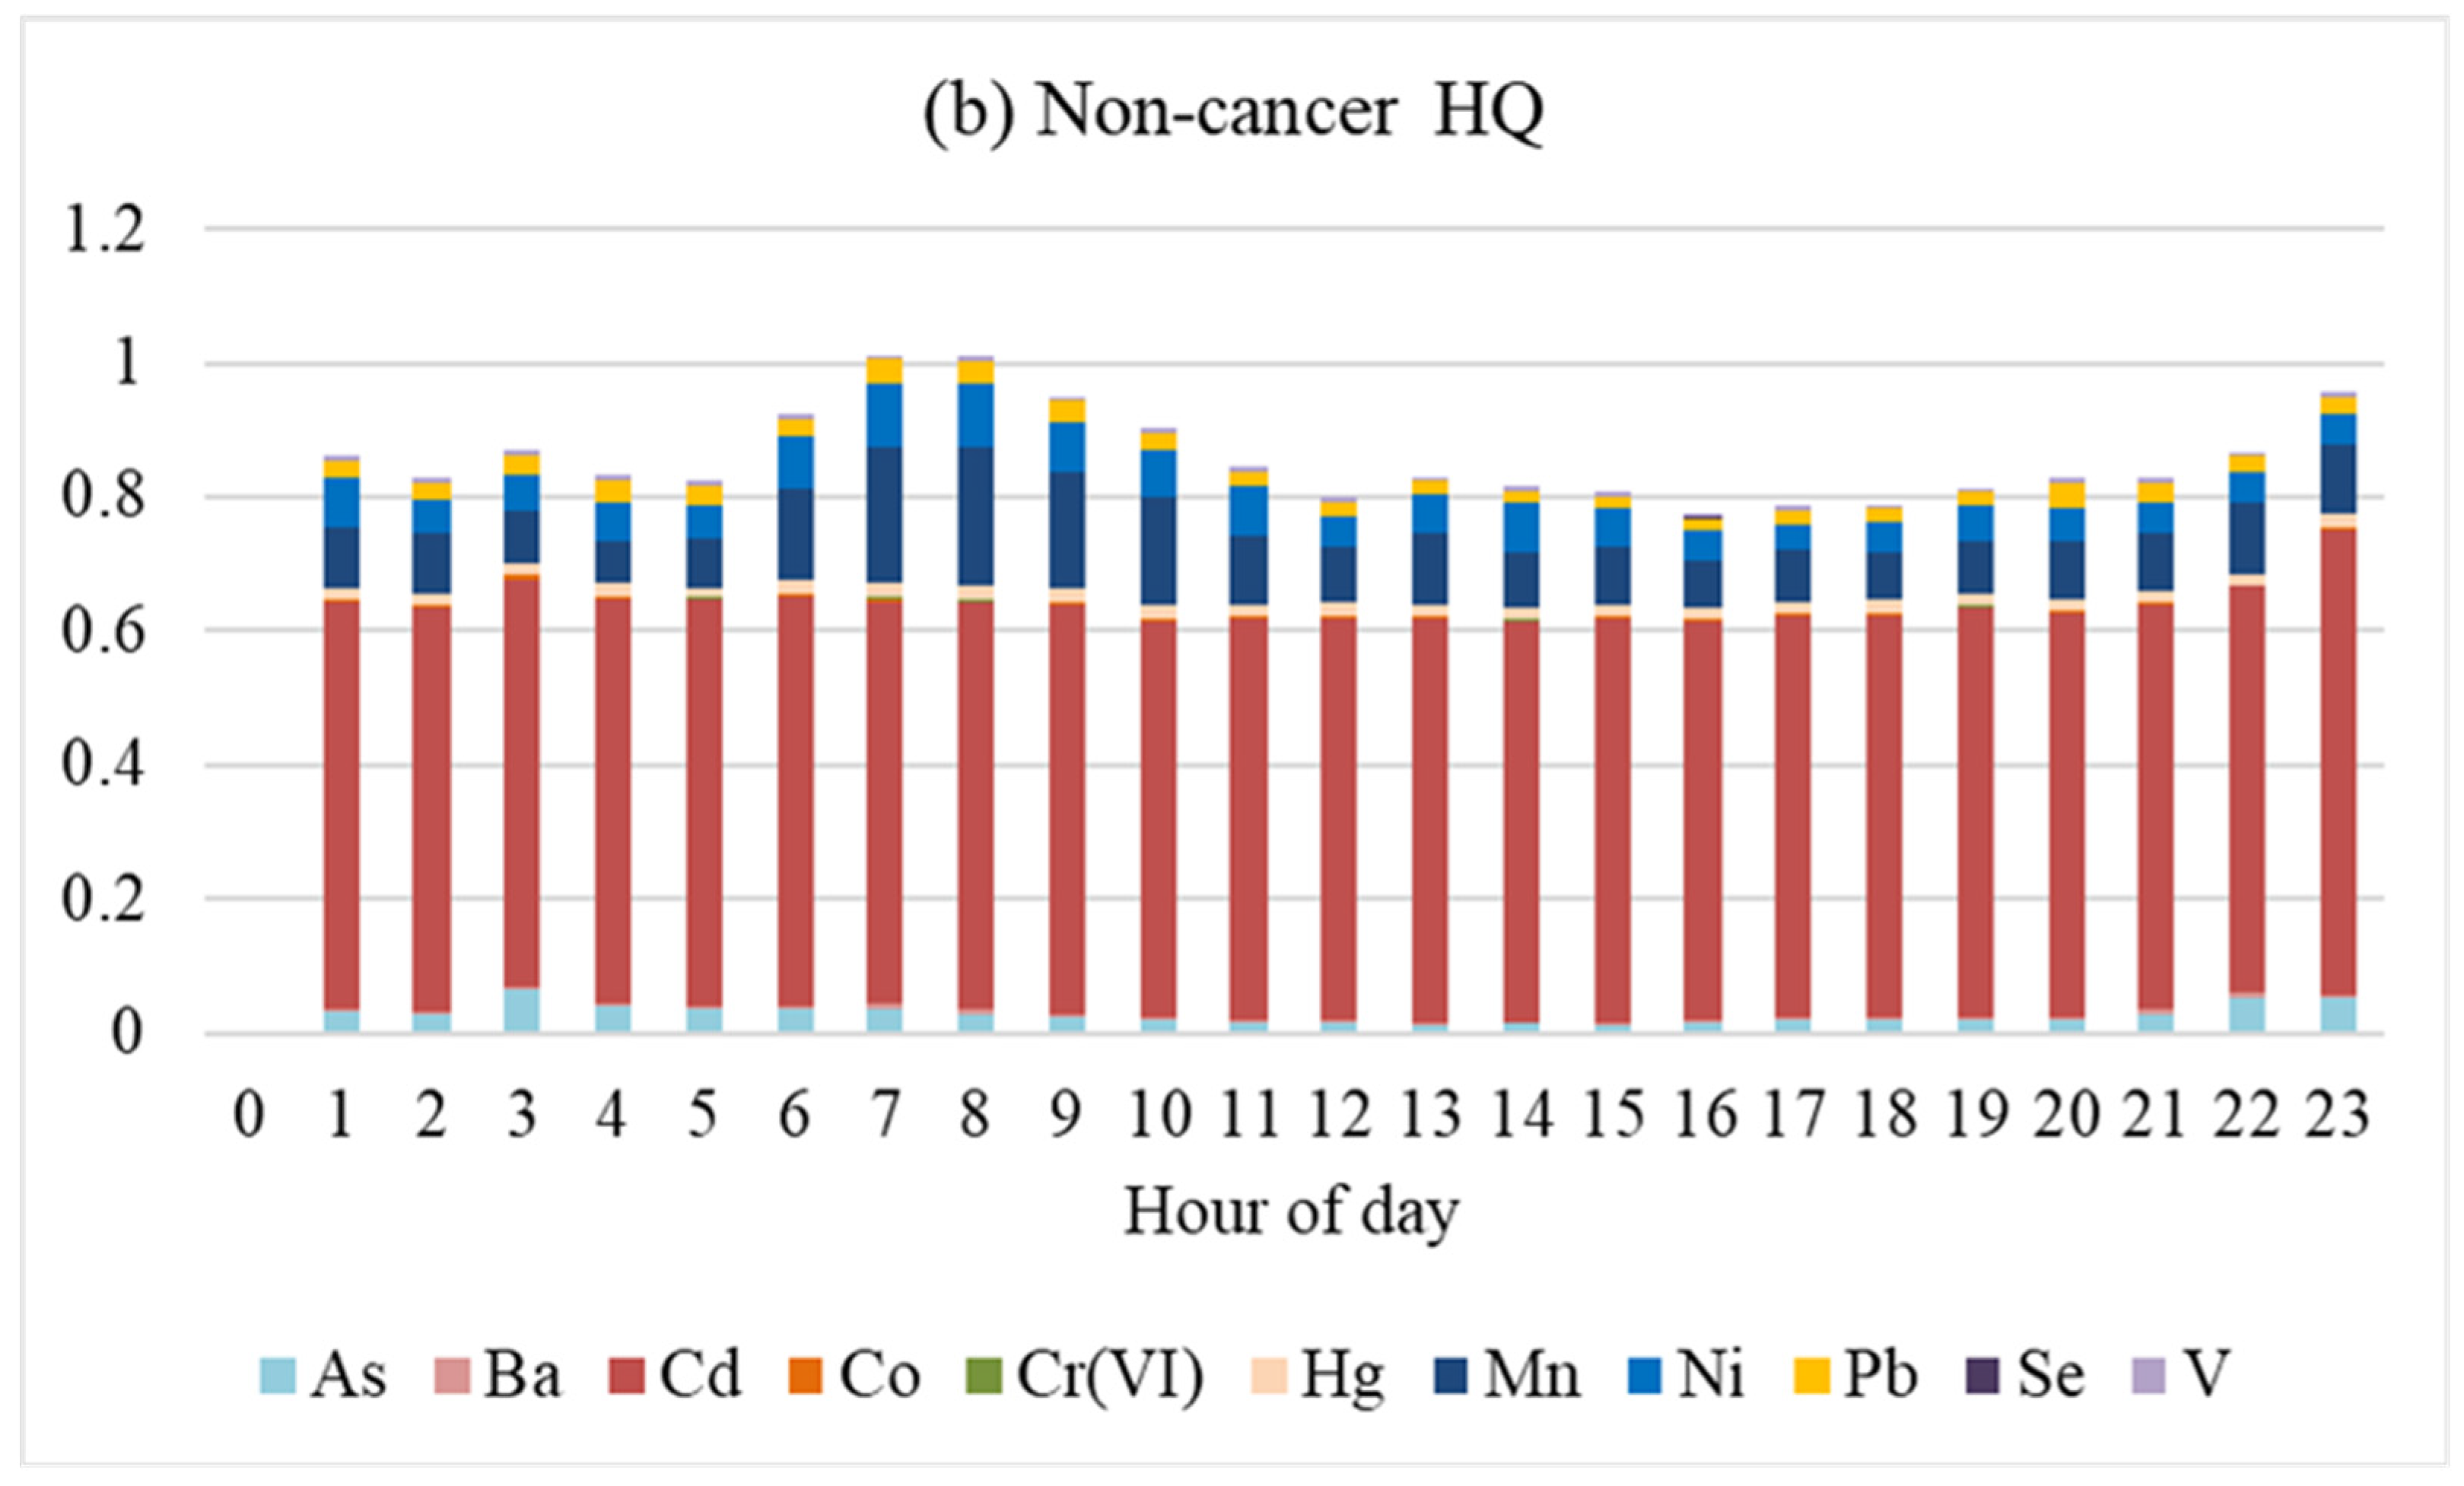
Seasonal chronic non-cancer HQs are shown in Figure 4b. Similar to CRs, the seasonal variation in HQs was small. HQs are slightly higher in summer (0.87) and autumn (0.85) than in spring (0.81) and winter (0.78). Figure 5b and Figure S7 show the diurnal variability of HQs. HQ from 0:00 h was not available because of the instrument-automated daily quality assurance checks from 0:00 to 0:30. The remaining hour-of-day averaged HQs ranged from 0.77 to 1.01, and all are below USEPA’s criteria of 1, except for the HQs in 7:00 (1.01) and 8:00 (1.01) in the morning. The marginal exceedances in 7:00 and 8:00 may pose short-term risks but do not necessarily indicate chronic health risks. Similar to the diurnal variability of lifetime CRs, non-cancer HQs were higher in the morning rush hours of 6:00–8:00 (average = 0.98) and at late night of 23:00 (0.95) than during the daytime of 12:00–20:00 (average = 0.78). Based on the diurnal patterns of CRs and HQs in Windsor (Figure 5), reducing outdoor exposure during the morning rush hours and in late night may minimize health risks associated with exposure to PM2.5-bound elements. However, residents in Windsor are encouraged to enjoy outdoor activities given the low levels of CRs and HQs posed by the elements.

3.3. Limitations

This study bears several limitations. First, this study did not monitor all harmful elements in the air and assumed absence of synergistic or antagonistic interactions, which could potentially lead to an underestimation of CRs and HQs. Second, applying factor profiles derived from a 10-month dataset in the previous study [28] to represent factor profiles over the 2-year period may introduce uncertainties due to inter-annual changes in emission sources, seasonal variability in chemical compositions, and the influence of meteorological variability. However, close examination of the diurnal and seasonal patterns of key elements showed general comparability between the 10-month and 2-year periods. In addition, correlation coefficients among elements remained consistent across the two periods. These observations suggest that the factor profiles were reasonably stable. Third, the PMF source apportionment itself introduces additional 10% uncertainty from random noise in the data and from rotational ambiguity inherent in the modeling solutions. Therefore, the source-resolved results presented here should be interpreted with these uncertainties in mind. Fourth, while hourly PM2.5-bound element measurements are advantageous, the short sampling duration results in a high percentage of data points below the MDLs for some elements. This presents a challenge because it may bias the estimation of concentrations in the ambient environment, thereby introducing uncertainties in health risk assessment. Future studies may benefit from continuous PM2.5-bound element measurements with lower MDLs to further mitigate uncertainties associated with health risk assessment.

4. Conclusions

Hourly concentrations of ambient PM2.5 mass and PM2.5-bound elements were monitored from April 2021 to April 2023 in Windsor, Canada, during the MOOSE study. Over the 2-year period, the average PM2.5 concentration was 9.2 ± 5.9 µg/m3, which is slightly higher than Ontario’s Ambient Air Quality Criteria for PM2.5 of 8.8 µg/m3 [53]. PM2.5 mass and PM2.5-bound elements showed apparent temporal variabilities. PM2.5 concentrations were higher in winter followed by summer and lower in spring and fall. Conversely, majority of PM2.5-bound elements showed higher concentrations in warm seasons of summer and fall than in cold seasons of spring and winter. PM2.5 mass and 18 out of 23 PM2.5-bound elements also exhibited dissimilar diurnal variability. The discrepancy in temporal variations between PM2.5 and PM2.5-bound element concentrations highlights the significance of monitoring PM2.5-bound elements.
The cumulative lifetime incremental CRs from inhalation exposure to all six elements of As, Cd, Co, Cr(VI), Ni, and Pb were below the upper limit of the USEPA’s acceptable level of 1 × 10⁻⁴. The total chronic non-cancer HQs associated with inhalation exposure to all the 11 PM2.5-bound elements (i.e., As, Ba, Cd, Co, Cr, Hg, Mn, Ni, Pb, Se, and V) fell below the USEPA’s acceptable level of 1. Cd was the dominant contributor to the total CR and HQ owing to its high ambient concentrations and high toxicity. Results of source apportionment further showed metal processing was the largest contributor to the total CR and HQ, followed by coal/heavy oil burning, vehicular exhaust, crustal dust and vehicle tire and brake wear. Both the total CR and HQ showed a weak seasonal variation, but a strong diurnal variation, i.e., elevated risks during morning rush hours when traffic volume peaks, and reduced risks during the daytime when atmospheric mixing are enhanced.
Although both the lifetime incremental CRs and chronic non-cancer HQs from inhalation exposure to PM2.5-bound elements were found to be below USEPA acceptable levels, they were elevated during the morning rush hours in the Windsor area. Efforts to mitigate ambient Cd emissions from metal processing sources will help reduce exposure and protect the environment and human health as Cd emerged as the primary contributor to the total CR and HQ. Overall, the top contributors to element concentrations are not necessarily the top contributors to health risks. Therefore, future emission control strategies should consider health risks of various sources in addition to their contributions to ambient concentrations.

Supplementary Materials

The following supporting information can be downloaded at https://www.mdpi.com/article/10.3390/atmos17030328/s1, Table S1. Total sample size and percentages of concentrations ≥ MDL for PM2.5 and 24 PM2.5-bound elements in Windsor during 19 April 2021–30 April 2023. Table S2. The mean concentrations and their 95% upper confidence levels (UCL) of PM2.5 (µg/m3) and 24 PM2.5-bound elements (ng/m3) in Windsor during 19 April 2021–30 April 2023, for the two scenarios. Scenario 1 (S1): replaced concentrations below MDLs with MDLs. Scenario 2 (S2): replaced concentrations below MDLs using the data distribution of the remaining values, i.e., the Kaplan-Meier (KM) method. Table S3. Carcinogen classification and inhalation unit risks (µg/m3)−1 of the 24 elements. Table S4. Reference concentrations (RfC) or equivalent toxic values for PM2.5-bound elements. Table S5. Factor profiles (% of PM2.5-bound element concentrations being assigned to that factor) of PM2.5-bound elements in Windsor based on data collected in 2021 [28]. Bold values are percentages ≥ 40%. Table S6. Ratios and upper and lower ranges of (a) incremental lifetime CRs and (b) chronic non-cancer HQs, per elements in Windsor during 2021–2023. Table S7. Contributions of each source to PM2.5-bound elemental concentrations, CRs, and non-cancer HQs. Figure S1. Seasonal variability of PM2.5 mass and PM2.5-bound element concentrations (solid circles) and 95% confidence interval (error bars) in Windsor during April 2021–April 2023. The letters indicate Tukey’s grouping. Figure S2. Scatter plots and Spearman correlation coefficients among concentrations of hourly PM2.5 mass (µg/m3) and 16 selected elements (ng/m3). Figure S3. Diurnal variability of PM2.5 mass and PM2.5-bound element concentrations (solid circles) and 95% confidence interval (error bars) in Windsor during April 2021–April 2023. Figure S4. Scatter plots and Spearman correlation coefficients of hour-of-day mean concentration among PM2.5 mass (µg/m3) and 23 elements (ng/m3). Figure S5. Concentration contributions of (a) six elements used to calculate cancer risks, and (b) 11 elements used to calculate non-cancer hazard quotients. Figure S6. Diurnal variability of incremental lifetime CRs of Pb. Figure S7. Diurnal variability of chronic non-cancer HQs for As, Cr(VI), Pb and V. References [12,28,42,43,45,46,53,64,65,66,67,68] are cited in Supplementary Materials.

Author Contributions

Conceptualization, methodology, and supervision, Y.S. and X.X.; data curation, J.D., M.N., A.M. and C.C.; formal analysis and visualization, T.Z.; writing—original draft preparation, T.Z., Y.S. and X.X.; writing—review and editing, T.Z., Y.S., J.G. and X.X.; funding acquisition, Y.S. and X.X. All authors have read and agreed to the published version of the manuscript.

Funding

This research was funded by Environment and Climate Change Canada, the Natural Sciences and Engineering Research Council of Canada, and University of Windsor’s Ignite Program.

Institutional Review Board Statement

Not applicable.

Informed Consent Statement

Not applicable.

Data Availability Statement

Hourly concentrations of PM2.5 and PM2.5-bound elements between April 2021 and April 2023 are available upon request from the corresponding authors.

Acknowledgments

We would like to thank all who maintained the air instruments at Windsor West station and Environment and Climate Change Canada’s National Air Pollution Surveillance Program for providing the air instrument. We also would like to acknowledge Jason Horn at the University of Windsor for his editorial assistance.

Conflicts of Interest

The authors declare no conflicts of interest.

References

  1. IARC. Outdoor Air Pollution a Leading Environmental Cause of Cancer Deaths. 2013. Available online: https://www.iarc.who.int/wp-content/uploads/2018/07/pr221_E.pdf (accessed on 16 January 2025).
  2. World Health Organization (WHO). Air Pollution. 2024. Available online: https://www.who.int/health-topics/air-pollution#tab=tab_2 (accessed on 16 January 2025).
  3. Health Canada (HC). Health Impacts of Air Pollution in Canada in 2018. 2024. Available online: https://www.canada.ca/content/dam/hc-sc/documents/services/publications/healthy-living/health-impacts-air-pollution-2018/health-impacts-air-pollution-2018.pdf (accessed on 16 January 2025).
  4. Xing, Y.F.; Xu, Y.H.; Shi, M.H.; Lian, Y.X. The impact of PM2.5 on the human respiratory system. J. Thorac. Dis. 2016, 8, E69. [Google Scholar]
  5. Zanobetti, A.; Dominici, F.; Wang, Y.; Schwartz, J.D. A national case-crossover analysis of the short-term effect of PM2.5 on hospitalizations and mortality in subjects with diabetes and neurological disorders. Environ. Health 2014, 13, 38. [Google Scholar] [CrossRef] [PubMed]
  6. Brook, R.D.; Rajagopalan, S.; Pope, C.A., III; Brook, J.R.; Bhatnagar, A.; Diez-Roux, A.V.; Holguin, F.; Hong, Y.; Luepker, R.V.; Mittleman, M.A.; et al. Particulate matter air pollution and cardiovascular disease: An update to the scientific statement from the American Heart Association. Circulation 2010, 121, 2331–2378. [Google Scholar] [CrossRef]
  7. Li, R.; Navab, K.; Hough, G.; Daher, N.; Zhang, M.; Mittelstein, D.; Lee, K.; Pakbin, P.; Saffari, A.; Bhetraratana, M.; et al. Effect of exposure to atmospheric ultrafine particles on production of free fatty acids and lipid metabolites in the mouse small intestine. Environ. Health Perspect. 2015, 123, 34–41. [Google Scholar] [CrossRef]
  8. Morgan, T.E.; Davis, D.A.; Iwata, N.; Tanner, J.A.; Snyder, D.; Ning, Z.; Kam, W.; Hsu, Y.-T.; Winkler, J.W.; Chen, J.-C.; et al. Glutamatergic neurons in rodent models respond to nanoscale particulate urban air pollutants in vivo and in vitro. Environ. Health Perspect. 2011, 119, 1003–1009. [Google Scholar] [CrossRef]
  9. Peters, A.; Hampel, R.; Cyrys, J.; Breitner, S.; Geruschkat, U.; Kraus, U.; Zareba, W.; Schneider, A. Elevated particle number concentrations induce immediate changes in heart rate variability: A panel study in individuals with impaired glucose metabolism or diabetes. Part. Fibre Toxicol. 2015, 12, 7. [Google Scholar] [CrossRef] [PubMed]
  10. Chen, L.C.; Lippmann, M. Effects of metals within ambient air particulate matter (PM) on human health. Inhal. Toxicol. 2009, 21, 1–31. [Google Scholar] [CrossRef] [PubMed]
  11. United States Environmental Protection Agency (USEPA). Overview of Airborne Metals Regulations, Exposure Limits, Health Effects, and Contemporary Research. 2010. Available online: https://www3.epa.gov/ttnemc01/prelim/otm31appC.pdf (accessed on 16 January 2025).
  12. World Health Organization (WHO). IARC Monographs on the Identification of Carcinogenic Hazards to Humans. 2024. Available online: https://monographs.iarc.who.int/list-of-classifications (accessed on 16 January 2025).
  13. Agency for Toxic Substances and Disease Registry (ATSDR). What Are the Physiologic Effects of Arsenic Exposure? 2023. Available online: https://archive.cdc.gov/www_atsdr_cdc_gov/csem/arsenic/physiologic_effects.html (accessed on 16 January 2025).
  14. Charkiewicz, A.E.; Omeljaniuk, W.J.; Nowak, K.; Garley, M.; Nikliński, J. Cadmium toxicity and health effects—A brief summary. Molecules 2023, 28, 6620. [Google Scholar] [CrossRef]
  15. Shin, D.Y.; Lee, S.M.; Jang, Y.; Lee, J.; Lee, C.M.; Cho, E.M.; Seo, Y.R. Adverse human health effects of chromium by exposure route: A comprehensive review based on toxicogenomic approach. Int. J. Mol. Sci. 2023, 24, 3410. [Google Scholar] [CrossRef]
  16. Genchi, G.; Carocci, A.; Lauria, G.; Sinicropi, M.S.; Catalano, A. Nickel: Human health and environmental toxicology. Int. J. Environ. Res. Public Health 2020, 17, 679. [Google Scholar] [CrossRef]
  17. Agency for Toxic Substances and Disease Registry (ATSDR). What Are Possible Health Effects from Lead Exposure? 2023. Available online: https://archive.cdc.gov/www_atsdr_cdc_gov/csem/leadtoxicity/physiological_effects.html (accessed on 16 January 2025).
  18. Tian, F.; Qi, J.; Wang, L.; Yin, P.; Qian, Z.M.; Ruan, Z.; Liu, J.; Liu, Y.; McMillin, S.E.; Wang, C.; et al. Differentiating the effects of ambient fine and coarse particles on mortality from cardiopulmonary diseases: A nationwide multicity study. Environ. Int. 2020, 145, 106096. [Google Scholar] [CrossRef]
  19. United States Environmental Protection Agency (USEPA). The NRC Risk Assessment Paradigm. 2016. Available online: https://www.epa.gov/fera/nrc-risk-assessment-paradigm (accessed on 16 January 2025).
  20. Macey, G.P.; Breech, R.; Chernaik, M.; Cox, C.; Larson, D.; Thomas, D.; Carpenter, D.O. Air concentrations of volatile compounds near oil and gas production: A community-based exploratory study. Environ. Health 2014, 13, 82. [Google Scholar] [CrossRef]
  21. Netherlands National Institute of Public Health and the Environment (RIVM). Re-Evaluation of Human-Toxicological Maximum Permissible Risk Levels. 2001. Available online: https://www.rivm.nl/bibliotheek/rapporten/711701025.pdf (accessed on 16 January 2025).
  22. United States Environmental Protection Agency (USEPA). Conducting a Human Health Risk Assessment. 2022. Available online: https://www.epa.gov/risk/conducting-human-health-risk-assessment (accessed on 16 January 2025).
  23. United States Environmental Protection Agency (USEPA). Chapter 7. Characterizing Risk and Hazard. 2005. Available online: https://archive.epa.gov/epawaste/hazard/tsd/td/web/pdf/05hhrap7.pdf (accessed on 16 January 2025).
  24. United States Environmental Protection Agency (USEPA). Human Health Risk Assessment. 2023. Available online: https://www.epa.gov/risk/human-health-risk-assessment#tab-1 (accessed on 16 January 2025).
  25. Bari, M.A.; Kindzierski, W.B. Ambient fine particulate matter (PM2.5) in Canadian oil sands communities: Levels, sources and potential human health risk. Sci. Total Environ. 2017, 595, 828–838. [Google Scholar] [CrossRef]
  26. Iakovides, M.; Iakovides, G.; Stephanou, E.G. Atmospheric particle-bound polycyclic aromatic hydrocarbons, n-alkanes, hopanes, steranes and trace metals: PM2.5 source identification, individual and cumulative multi-pathway lifetime cancer risk assessment in the urban environment. Sci. Total Environ. 2021, 752, 141834. [Google Scholar] [CrossRef]
  27. Wu, Y.; Lu, B.; Zhu, X.; Wang, A.; Yang, M.; Gu, S.; Wang, X.; Leng, P.; Zierold, K.M.; Li, X.; et al. Seasonal variations, source apportionment, and health risk assessment of heavy metals in PM2.5 in Ningbo, China. Aerosol Air Qual. Res. 2019, 19, 2083–2092. [Google Scholar] [CrossRef]
  28. Zhang, T.; Su, Y.; Debosz, J.; Noble, M.; Munoz, A.; Xu, X. Continuous Measurements and Source Apportionment of Ambient PM2.5-Bound Elements in Windsor, Canada. Atmosphere 2023, 14, 374. [Google Scholar] [CrossRef]
  29. Jeong, C.H.; Traub, A.; Huang, A.; Hilker, N.; Wang, J.M.; Herod, D.; Dabek-Zlotorzynska, E.; Celo, V.; Evans, G.J. Long-term analysis of PM2.5 from 2004 to 2017 in Toronto: Composition, sources, and oxidative potential. Environ. Pollut. 2020, 263, 114652. [Google Scholar] [CrossRef]
  30. Health Canada (HC). Guidance for Evaluating Human Health Impacts in Environmental Assessment: Air Quality. 2016. Available online: https://iaac-aeic.gc.ca/050/documents/p80054/119376E.pdf (accessed on 16 January 2025).
  31. Olaguer, E.P.; Su, Y.; Stroud, C.A.; Healy, R.M.; Batterman, S.A.; Yacovitch, T.I.; Chai, J.; Huang, Y.; Parsons, M.T. The Michigan–Ontario Ozone Source Experiment (MOOSE): An Overview. Atmosphere 2023, 14, 1630. [Google Scholar] [CrossRef]
  32. Kelly, T.; Dindal, A.; McKernan, B. Pall Corporation Xact 625 Particulate Metals Monitor. 2012. Available online: https://sci-monitoring.com/wp-content/uploads/2023/06/ETV-Full-Report.pdf (accessed on 16 January 2025).
  33. Malvern Panalytical. The Basics of Elemental Analysis with XRF—Q&A. 2023. Available online: https://www.materials-talks.com/the-basics-of-elemental-analysis-with-xrf-qa/#:~:text=XRF%20is%20an%20elemental%20analysis%20technique%20and%20therefore%20quantifies%20the,down%20to%20sub%2Dppm%20level (accessed on 16 January 2025).
  34. California Air Resources Board (CARB). Continuous Determination of Metals in Ambient Air Using an Xact 625i Ambient Metals Monitor. 2018. Available online: https://ww2.arb.ca.gov/sites/default/files/2019-04/SOP450%20for%20XACT625I%20XRF.pdf (accessed on 16 January 2025).
  35. Ontario Ministry of the Environment, Conservation and Parks (MECP). Operations Manual for Air Quality Monitoring in Ontario. 2016. Available online: https://www.ontario.ca/document/operations-manual-air-quality-monitoring-ontario-0/standard-operating-procedures-sops (accessed on 16 January 2025).
  36. United States Environmental Protection Agency (USEPA). Calculating Upper Confidence Limits for Exposure Point Concentrations at Hazardous Waste Sites. 2002. Available online: https://www.epa.gov/sites/default/files/2016-03/documents/upper-conf-limits.pdf (accessed on 16 January 2025).
  37. Luo, H.; Wang, Q.; Guan, Q.; Ma, Y.; Ni, F.; Yang, E.; Zhang, J. Heavy metal pollution levels, source apportionment and risk assessment in dust storms in key cities in Northwest China. J. Hazard. Mater. 2022, 422, 126878. [Google Scholar] [CrossRef] [PubMed]
  38. Du, L.; Wang, Y.; Wu, Z.; Hou, C.; Mao, H.; Li, T.; Nie, X. PM2.5-bound toxic elements in an Urban City in East China: Concentrations, sources, and health risks. Int. J. Environ. Res. Public Health 2019, 16, 164. [Google Scholar] [CrossRef] [PubMed]
  39. United States Environmental Protection Agency (USEPA). ProUCL Software. 2023. Available online: https://www.epa.gov/land-research/proucl-software (accessed on 16 January 2025).
  40. Singh, A.; Maichle, R.; Lee, S. On the Computation of a 95% Upper Confidence Limit of the Unknown Population Mean Based upon Data Sets with Below Detection Limit Observations; EPA/600/R-06/022; U.S. Environmental Protection Agency: Washington, DC, USA, 2006. [Google Scholar]
  41. United States Environmental Protection Agency (USEPA). Hazard Assessment of Chemicals; Taylor & Francis: Washington, DC, USA, 1993; Volume 8. [Google Scholar]
  42. United States Environmental Protection Agency (USEPA). IRIS Assessments. 2019. Available online: https://cfpub.epa.gov/ncea/iris_drafts/atoz.cfm?list_type=alpha (accessed on 16 January 2025).
  43. United States Department of Health and Human Service (DHHS). 15th Report on Carcinogens. 2021. Available online: https://ntp.niehs.nih.gov/sites/default/files/ntp/roc/content/listed_substances_508.pdf (accessed on 16 January 2025).
  44. United States Environmental Protection Agency (USEPA). Guidelines for Carcinogen Risk Assessment. 2005. Available online: https://www.epa.gov/sites/default/files/2013-09/documents/cancer_guidelines_final_3-25-05.pdf (accessed on 16 January 2025).
  45. California Office of Environmental Health Hazard Assessment (OEHHA). Chemicals. 2024. Available online: https://oehha.ca.gov/chemicals (accessed on 16 January 2025).
  46. Health Canada (HC). Federal Contaminated Site Risk Assessment in Canada: Toxicological Reference Values (TRVs). 2021. Available online: https://publications.gc.ca/collections/collection_2021/sc-hc/H129-108-2021-eng.pdf (accessed on 16 January 2025).
  47. Perišić, M.; Rajšić, S.; Šoštarić, A.; Mijić, Z.; Stojić, A. Levels of PM10-bound species in Belgrade, Serbia: Spatio-temporal distributions and related human health risk estimation. Air Qual. Atmos. Health 2017, 10, 93–103. [Google Scholar] [CrossRef]
  48. United States Environmental Protection Agency (USEPA). AirToxScreen Frequent Questions. 2024. Available online: https://www.epa.gov/AirToxScreen/airtoxscreen-frequent-questions#background6 (accessed on 16 January 2025).
  49. Agency for Toxic Substances and Disease Registry (ATSDR). Evaluate the Evidence to Examine Cancer Effects. 2022. Available online: https://www.atsdr.cdc.gov/pha-guidance/conducting_scientific_evaluations/indepth_toxicological_analysis/EvaluateEvidenceCancerEffects.html (accessed on 16 January 2025).
  50. European Chemical Agency (ECA). Guidance on Information Requirements and Chemical Safety Assessment. 2012. Available online: https://echa.europa.eu/documents/10162/13632/information_requirements_r8_en.pdf/e153243a-03f0-44c5-8808-88af66223258?msclkid=0601d579b33511ecb9e3bdc7f6589955 (accessed on 15 March 2026).
  51. United States Environmental Protection Agency (USEPA). Risk Characterization Handbook; EPA 100-B-00-002; United States Environmental Protection Agency: Washington, DC, USA, 2000. [Google Scholar]
  52. Ontario Ministry of the Environment, Conservation and Parks (MECP). Air Quality in Ontario 2021 Report. 2023. Available online: https://www.ontario.ca/document/air-quality-ontario-2021-report (accessed on 16 January 2025).
  53. Ontario Ministry of the Environment, Conservation and Parks (MECP). Ambient Air Quality Criteria. 2020. Available online: https://files.ontario.ca/mecp-ambient-air-quality-criteria-list-en-2020-05-01.pdf (accessed on 16 January 2025).
  54. Jin, Q.; Liu, Y.; Feng, M.; Huang, C. High-resolution temporal metallic elements in PM2.5 in Chengdu, Southwest China: Variations, extreme events, and effects of meteorological parameters. Air Qual. Atmos. Health 2021, 14, 1893–1909. [Google Scholar] [CrossRef]
  55. Han, Y.J.; Kim, H.W.; Cho, S.H.; Kim, P.R.; Kim, W.J. Metallic elements in PM2.5 in different functional areas of Korea: Concentrations and source identification. Atmos. Res. 2015, 153, 416–428. [Google Scholar] [CrossRef]
  56. Rattigan, O.V.; Civerolo, K.L.; Felton, H.D.; Schwab, J.J.; Demerjian, K.L. Long term trends in New York: PM2.5 mass and particle components. Aerosol Air Qual. Res. 2016, 16, 1191–1205. [Google Scholar] [CrossRef]
  57. Bozkurt, Z.; Gaga, E.O.; Taşpınar, F.; Arı, A.; Pekey, B.; Pekey, H.; Döğeroğlu, T.; Üzmez, Ö.Ö. Atmospheric ambient trace element concentrations of PM10 at urban and sub-urban sites: Source apportionment and health risk estimation. Environ. Monit. Assess. 2018, 190, 168. [Google Scholar] [CrossRef] [PubMed]
  58. Liu, X.; Wang, Z.; Bai, H.; Zhang, S.; Mu, L.; Peng, L. Characteristics and health risk assessments of heavy metals in PM2.5 in Taiyuan and Yuci college town, China. Air Qual. Atmos. Health 2020, 13, 909–919. [Google Scholar] [CrossRef]
  59. Liu, Y.; Yang, Z.; Liu, Q.; Qi, X.; Qu, J.; Zhang, S.; Wang, X.; Jia, K.; Zhu, M. Study on chemical components and sources of PM2.5 during heavy air pollution periods at a suburban site in Beijing of China. Atmos. Pollut. Res. 2021, 12, 188–199. [Google Scholar] [CrossRef]
  60. Hieu, N.T.; Lee, B.K. Characteristics of particulate matter and metals in the ambient air from a residential area in the largest industrial city in Korea. Atmos. Res. 2010, 98, 526–537. [Google Scholar] [CrossRef]
  61. Chen, C.R.; Lai, H.C.; Liao, M.I.; Hsiao, M.C.; Ma, H.W. Health risk assessment of trace elements of ambient PM2.5 under monsoon patterns. Chemosphere 2021, 264, 128462. [Google Scholar] [CrossRef]
  62. Wei, X.; Gao, B.; Wang, P.; Zhou, H.; Lu, J. Pollution characteristics and health risk assessment of heavy metals in street dusts from different functional areas in Beijing, China. Ecotoxicol. Environ. Saf. 2015, 112, 186–192. [Google Scholar] [CrossRef]
  63. Caggiano, R.; Sabia, S.; Speranza, A. Trace elements and human health risks assessment of finer aerosol atmospheric particles (PM 1). Environ. Sci. Pollut. Res. 2019, 26, 36423–36433. [Google Scholar] [CrossRef] [PubMed]
  64. Agency for Toxic Substances and Disease Registry (ATSDR). Minimal Risk Levels (MRLs) for Hazardous Substances. 2024. Available online: https://wwwn.cdc.gov/TSP/MRLS/mrlslisting.aspx (accessed on 16 January 2025).
  65. United States Environmental Protection Agency (USEPA). Health Effects Assessment Summary Tables, FY 1997 Update. 1997. Available online: https://rais.ornl.gov/documents/HEAST1997.pdf (accessed on 16 January 2025).
  66. United States Environmental Protection Agency (USEPA). NAAQS Table. 2024. Available online: https://www.epa.gov/criteria-air-pollutants/naaqs-table (accessed on 16 January 2025).
  67. California Office of Environmental Health Hazard Assessment (OEHHA). Air Toxics Hot Spots Program Risk Assessment Guidelines. 1999. Available online: https://oehha.ca.gov/media/downloads/crnr/acuterel.pdf (accessed on 16 January 2025).
  68. California Office of Environmental Health Hazard Assessment (OEHHA). Air Assessment of Air Contaminants. 2021. Available online: https://www.sdapcd.org/content/dam/sdapcd/documents/capp/meetings/portside-csc/032119/032119-OEHHA-Risk-Assessments.pdf (accessed on 16 January 2025).
Figure 1. Map of the Windsor West air monitoring station (42°17′34″ N, 83°4′23″ W) in southwestern Ontario.
Atmosphere 17 00328 g001
Figure 2. Contributions of individual elements to (a) the total CR and (b) the total HQ in Windsor.
Atmosphere 17 00328 g002
Figure 3. Contributions by each individual sources to (a) the total CR, (b) the total HQ, and (c) total element concentrations in Windsor.
Atmosphere 17 00328 g003
Figure 4. Seasonal (a) incremental lifetime CRs and (b) chronic non-cancer HQs in Windsor.
Atmosphere 17 00328 g004
Figure 5. Diurnal variability of (a) incremental lifetime CRs and (b) chronic non-cancer HQs in Windsor, Canada.
Atmosphere 17 00328 g005aAtmosphere 17 00328 g005b
Table 1. Statistics of hourly concentrations for PM2.5 mass (µg/m3) and PM2.5-bound elements (ng/m3) between April 2021 and April 2023 (Ntotal = 18,009 for PM2.5, Ntotal = 9059 for elements).
VariableMeanStDevCoefficient of Variance (%) Minimum25th Percentile50th Percentile75th PercentileMaximum
PM2.59.205.8664 0581248
Ag1.761.7499001.572.7134
As0.2341.29549000075
Ba1.533.65239000.691.72116
Br2.722.358601.382.243.4762
Ca7099141019.239.080.71612
Cd3.302.507601.143.284.9717
Co0.0210.3671751000034
Cr0.2311.98857000.0290.193110
Cu3.545.631590.4592.142.743.7394
Fe103199194030.8551107516
Hg0.4060.590146000.1730.61610.0
K74.072.99904463.1892206
Mn4.359.2421200.5491.413.70148
Ni0.4291.2328700.1090.2320.4141
Pb3.365.8417401.562.553.98343
Rb0.1370.175128000.0830.2262.52
S490421864.802163766245298
Se0.6351.3120700.110.2760.60424.1
Si336414123019728839510,166
Sn0.00550.5189390000049
Sr0.9201.8019600.4280.6831.0073
Ti3.407.3121501.202.183.73185
V0.4121.09264000.0680.35231
Zn24.856.72280.0305.059.94211642
Disclaimer/Publisher’s Note: The statements, opinions and data contained in all publications are solely those of the individual author(s) and contributor(s) and not of MDPI and/or the editor(s). MDPI and/or the editor(s) disclaim responsibility for any injury to people or property resulting from any ideas, methods, instructions or products referred to in the content.