1. Introduction
The boreal summer intraseasonal oscillation (BSISO, after Wang and Xie [
1]) exhibits greater complexity in structure and propagation than the Madden–Julian Oscillation (MJO [
2,
3]), which is most prominent during boreal winter. A key feature of the BSISO is its bimodal spectrum composition, consisting of distinct low-frequency (LF, ~25–90 days) and high-frequency (HF, ~10–25 days) components. Over the Asian summer monsoon region, the LF- and HF-BSISO activities are well captured by and operationally monitored through the BSISO1 and BSISO2 indices, respectively [
4].
The LF- and HF-BSISO components, typically studied via the traditional Empirical Orthogonal Function (EOF) method (often combined with respective bandpass filtering), are characterized as symmetrically evolving modes, wherein the development and decay phases of convective anomalies largely mirror each other (e.g., [
4,
5,
6,
7,
8,
9,
10]). However, the use of a relatively narrow bandpass filter, along with the constraints of orthogonality and linearity inherent to EOF analysis [
11], may limit the detection of interactions between LF and HF components in the BSISO and the phase asymmetries arising from them.
Recent studies employing nonlinear statistical methods such as Self-Organizing Maps (SOM) and cluster analysis have revealed intrinsic asymmetries in the MJO/BSISO. For instance, SOM-based analyses of the MJO [
11,
12] identified amplitude asymmetry across its phases and described its life cycle as succession of quasi-stationary states interrupted by rapid transitions, implying the occurrence of phase “jumps” [
13]. Similarly, applying SOM to the BSISO, Chu et al. [
14] documented a phase asymmetry in the eastern equatorial Indian Ocean, characterized by slow development and rapid decay of wet phases (and vice versa for dry phases). In contrast, Li et al. [
15], using hierarchical clustering over the western North Pacific (WNP), found an opposite asymmetric pattern for slow BSISO events (which resemble the LF component), with wet phases exhibiting rapid development but slow decay. These results confirm robust yet diverse asymmetries within tropical intraseasonal oscillations. Therefore, a comprehensive characterization of these asymmetries, along with an understanding of specific processes driving them, calls for further research.
Following the discovery of BSISO asymmetry, a subsequent question arises regarding its climatic impacts. By using the real-time BSISO indices [
4], the influence of BSISO on precipitation and air temperature anomalies over East Asia has been extensively studied [
16,
17,
18,
19,
20,
21,
22,
23,
24,
25,
26]. It is, therefore, not surprising that the intraseasonal climate anomalies associated with the near-symmetric BSISO1 and BSISO2 modes themselves also evolve in a nearly symmetric way. However, as demonstrated by Li et al. [
15], an asymmetric BSISO evolution can lead to abrupt transitions between drought and flood conditions over eastern China. This contrast highlights a critical gap: while the climate impacts of symmetric BSISO modes are well documented, the specific influences exerted by the asymmetric evolutions remain largely unexamined.
This study focuses on the WNP region to address the aforementioned issues—namely, the comprehensive characterization of BSISO asymmetries and the climatic impacts of its asymmetric modes. The WNP is selected for its role as one of the primary BSISO centers. The intraseasonal oscillation in this region is characterized by pronounced complexity and diversity [
27,
28,
29] and exerts direct influence on the East Asian climate. We introduce an objective index that quantifies asymmetry in BSISO phase evolution. Using this asymmetry index jointly with life cycle duration in a clustering analysis, three distinct evolution modes are identified: symmetric evolution and asymmetric modes characterized by either rapid development/slow decay or slow development/rapid decay of wet phases. A detailed analysis is then performed to examine how these modes modulate precipitation over eastern China.
The remainder of this paper is organized as follows.
Section 2 describes the data and methods.
Section 3 presents the three BSISO modes over the WNP distinguished by their symmetry, as identified through objective cluster analysis. The modulation of precipitation over eastern China by these modes is examined in
Section 4. Concluding remarks and discussions are given in
Section 5.
2. Data and Methods
2.1. Data and Preprocessing
The datasets used in this study include: (i) satellite-observed daily outgoing longwave radiation (OLR) from the National Oceanic and Atmospheric Administration (NOAA) ([
30]); (ii) the ERA5 reanalysis from the European Centre for Medium-Range Weather Forecasts [
31]; and (iii) the CPC Unified Gauge-Based Analysis of Global Daily Precipitation [
32]. The OLR data is daily with a 2.5° × 2.5° spatial resolution. The raw ERA5 reanalysis is hourly with a 0.25° × 0.25° spatial resolution and has been preprocessed to a daily 2.5° × 2.5° resolution by using temporal and area averaging. The precipitation data is daily with a 0.5° × 0.5° spatial resolution, and cover land areas only. The extended boreal summers (May–September) from 1979 to 2022 were used in the research.
The intraseasonal components at different frequency bands were obtained as follows. First, the climatological background was obtained by retaining the annual mean and the first three Fourier harmonics of the climatological annual cycle. This background was then subtracted from the original data to obtain the raw anomalies. Subsequently, Lanczos bandpass filters [
33] were applied to the raw anomalies to extract the high-frequency (10–25-day), low-frequency (25–90-day), and full-band (10–90-day) intraseasonal components, respectively.
2.2. Identification of BSISO Events and the Cluster Analysis
The BSISO events over the WNP (hereafter WNP BSISO) were selected using the following procedure:
A WNP target region was defined as 110–135° E, 7.5–22.5° N, where BSISO convective activity is most pronounced, as indicated by OLR [
10,
29].
The area-averaged, 10–90-day bandpass-filtered OLR time series within the WNP target region was computed, and its standard deviation was calculated.
A candidate event was identified around each local minimum in the series. The time of this minimum, corresponds to the peak convective (wet) phase of the event, is designated as Day 0.
The life cycle duration of the event was then defined as the time interval between the preceding and succeeding local maxima.
For each event, the convective development time (
) is defined as the interval from the preceding zero-crossing (from positive to negative OLR anomaly) to Day 0, and the convective decay time (
) as the interval from Day 0 to the succeeding zero-crossing (from negative to positive anomaly). An asymmetry index
A for the event is then computed as
where a positive value of
A indicates an asymmetry characterized by slower convective development relative to decay during the wet phase, and a negative value indicates faster development relative to decay.
A candidate event was retained as a BSISO event in the study only if it satisfied three criteria: (i) its life cycle duration was greater than 10 days, (ii) the amplitude at Day 0 exceeded one standard deviation, and (iii) the amplitude difference between adjacent maxima and the central minimum was greater than 0.4 standard deviation. The criterion (iii) helps to exclude events with only minor, high-frequency perturbations near the peak phase, thereby ensuring the selection of BSISO events with a well-defined convective life cycle.
Based on the above procedure, a total of 257 qualified WNP BSISO events were identified during the extended boreal summers (May–September) from 1979 to 2022. These events were then subjected to a cluster analysis using two standardized variables (zero mean, unit variance): life cycle duration and the asymmetry index.
A hierarchical clustering [
34,
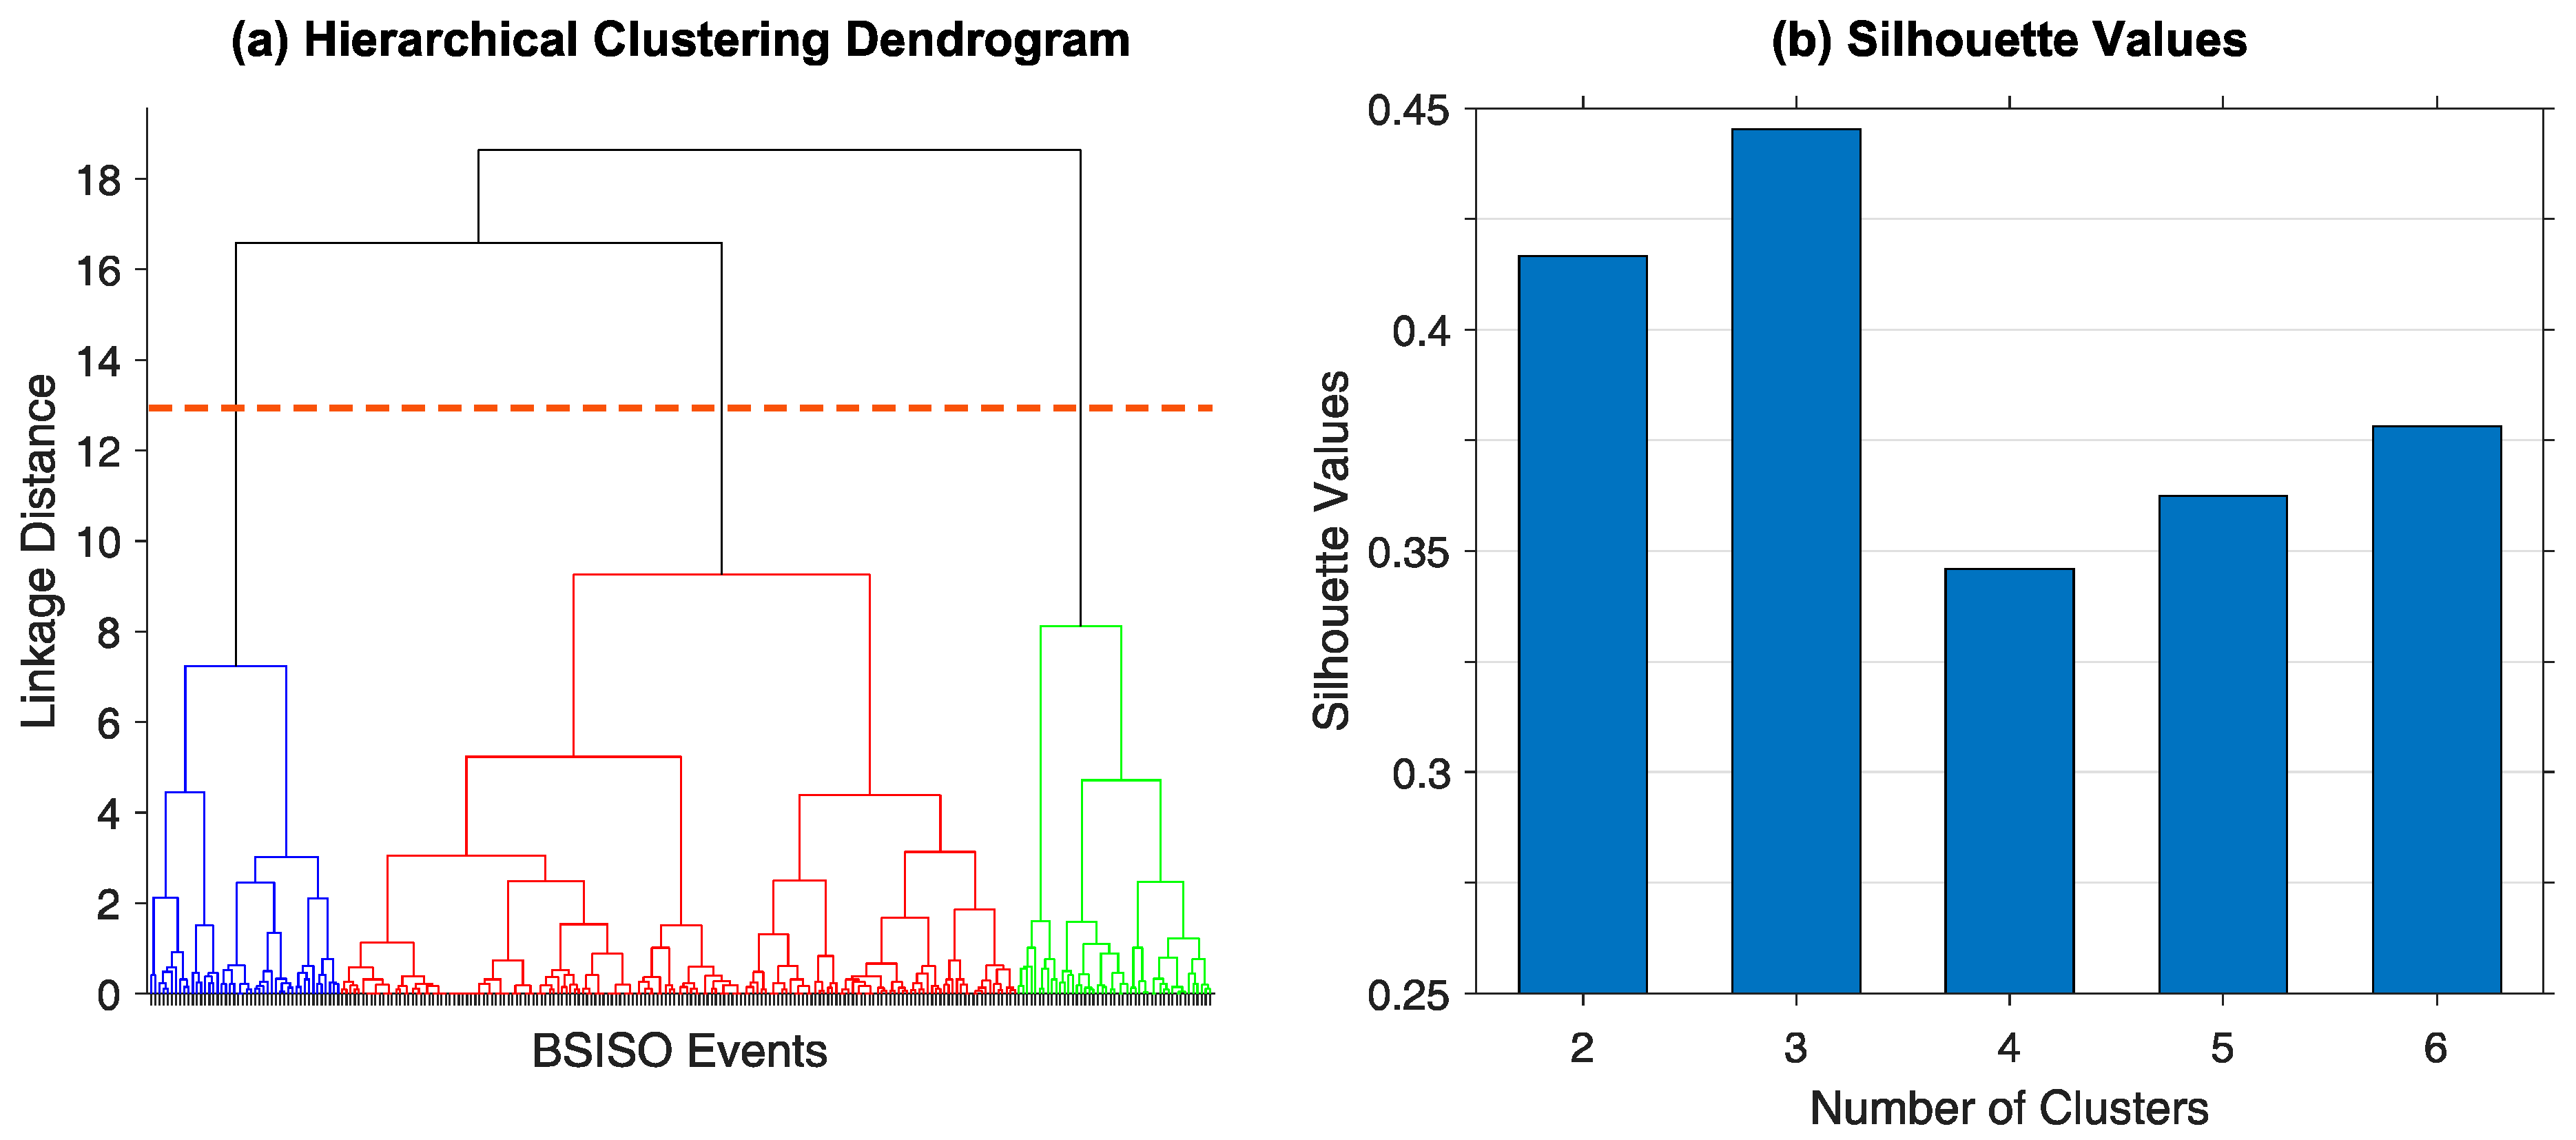
35] was performed using Euclidean as the distance metric and Ward’s method for linkage. The resulting dendrogram (
Figure 1a) suggests that three is the most appropriate number of clusters. This choice is corroborated by the average silhouette value across different cluster numbers (
Figure 1b): the average silhouette value reaches its maximum at three clusters and remains notably higher than values obtained with more clusters. To refine the classification, events with silhouette values below 0.02 were excluded. The final three clusters contain 155, 43, and 39 events, respectively, amounting to 237 events in total. The robustness of the three-cluster result was further tested using the k-means algorithm with the squared Euclidean distance, which produced a highly similar grouping, thereby confirming the reliability of the classification.
A lead/lag composite analysis was applied to the three WNP BSISO clusters. The resulting propagation patterns and associated precipitation anomalies over eastern China serve as the basis for the discussion in the following sections.
3. Results
3.1. Propagation Patterns of Symmetric and Asymmetric WNP BSISO
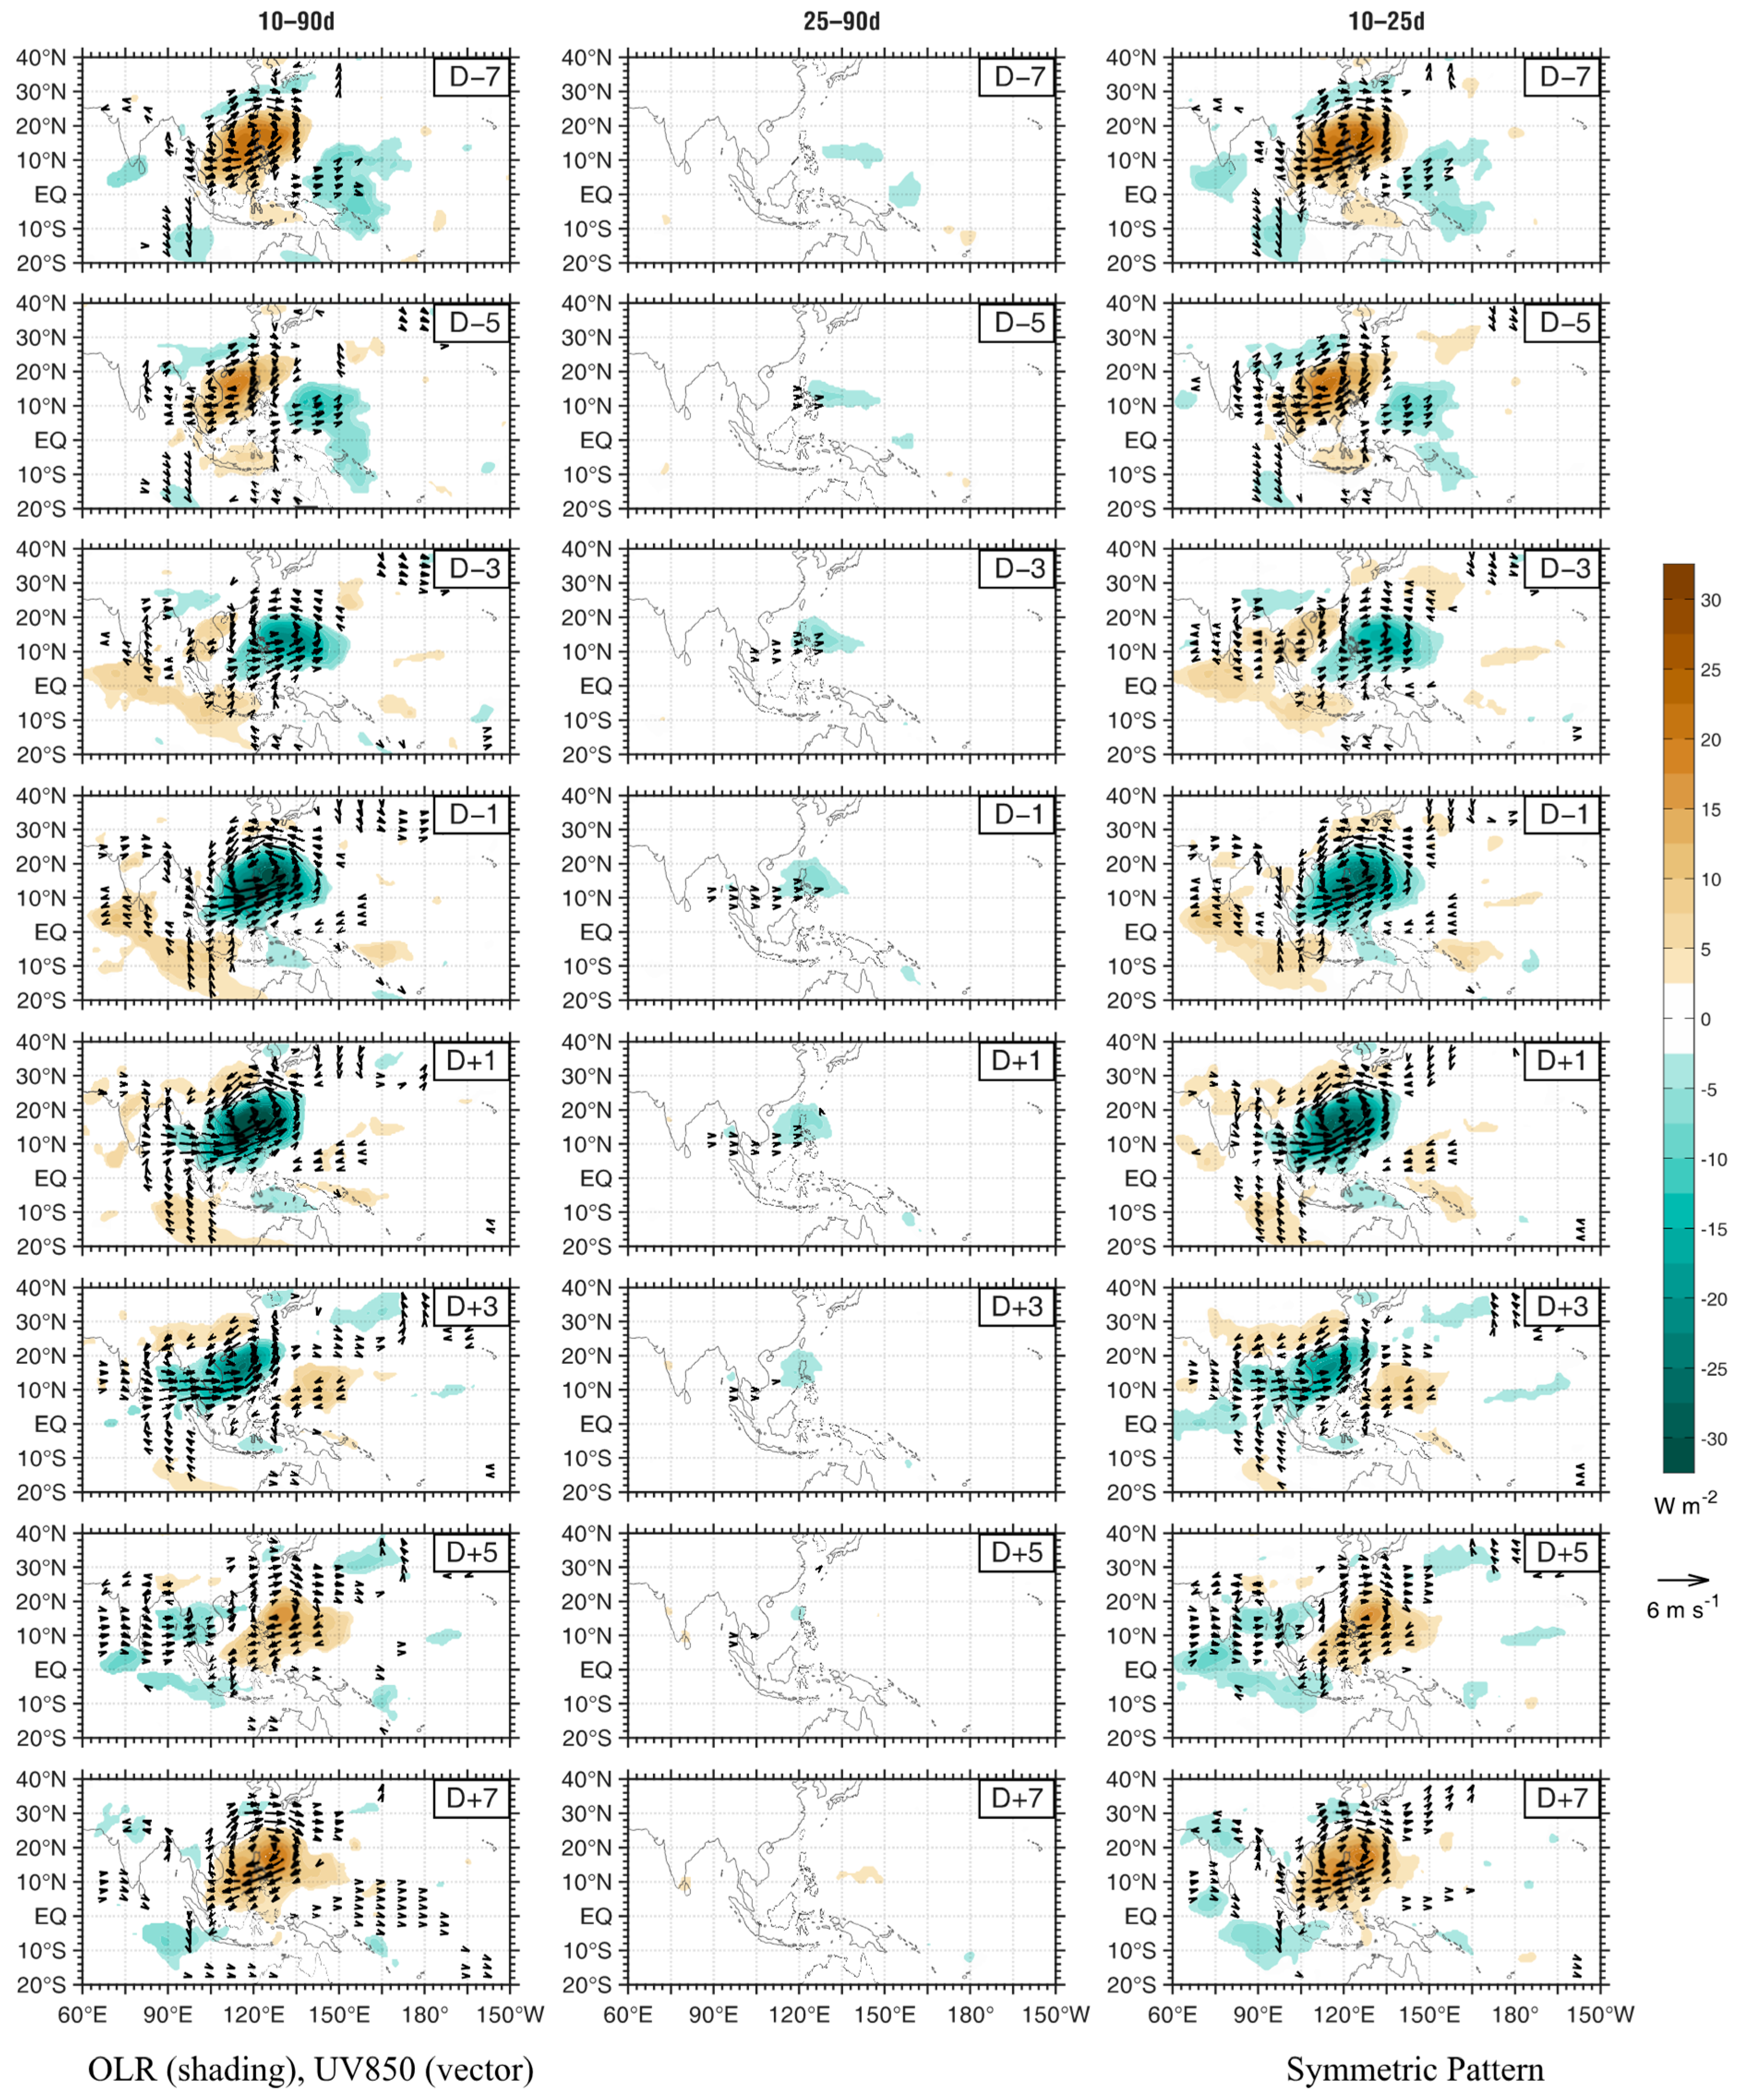
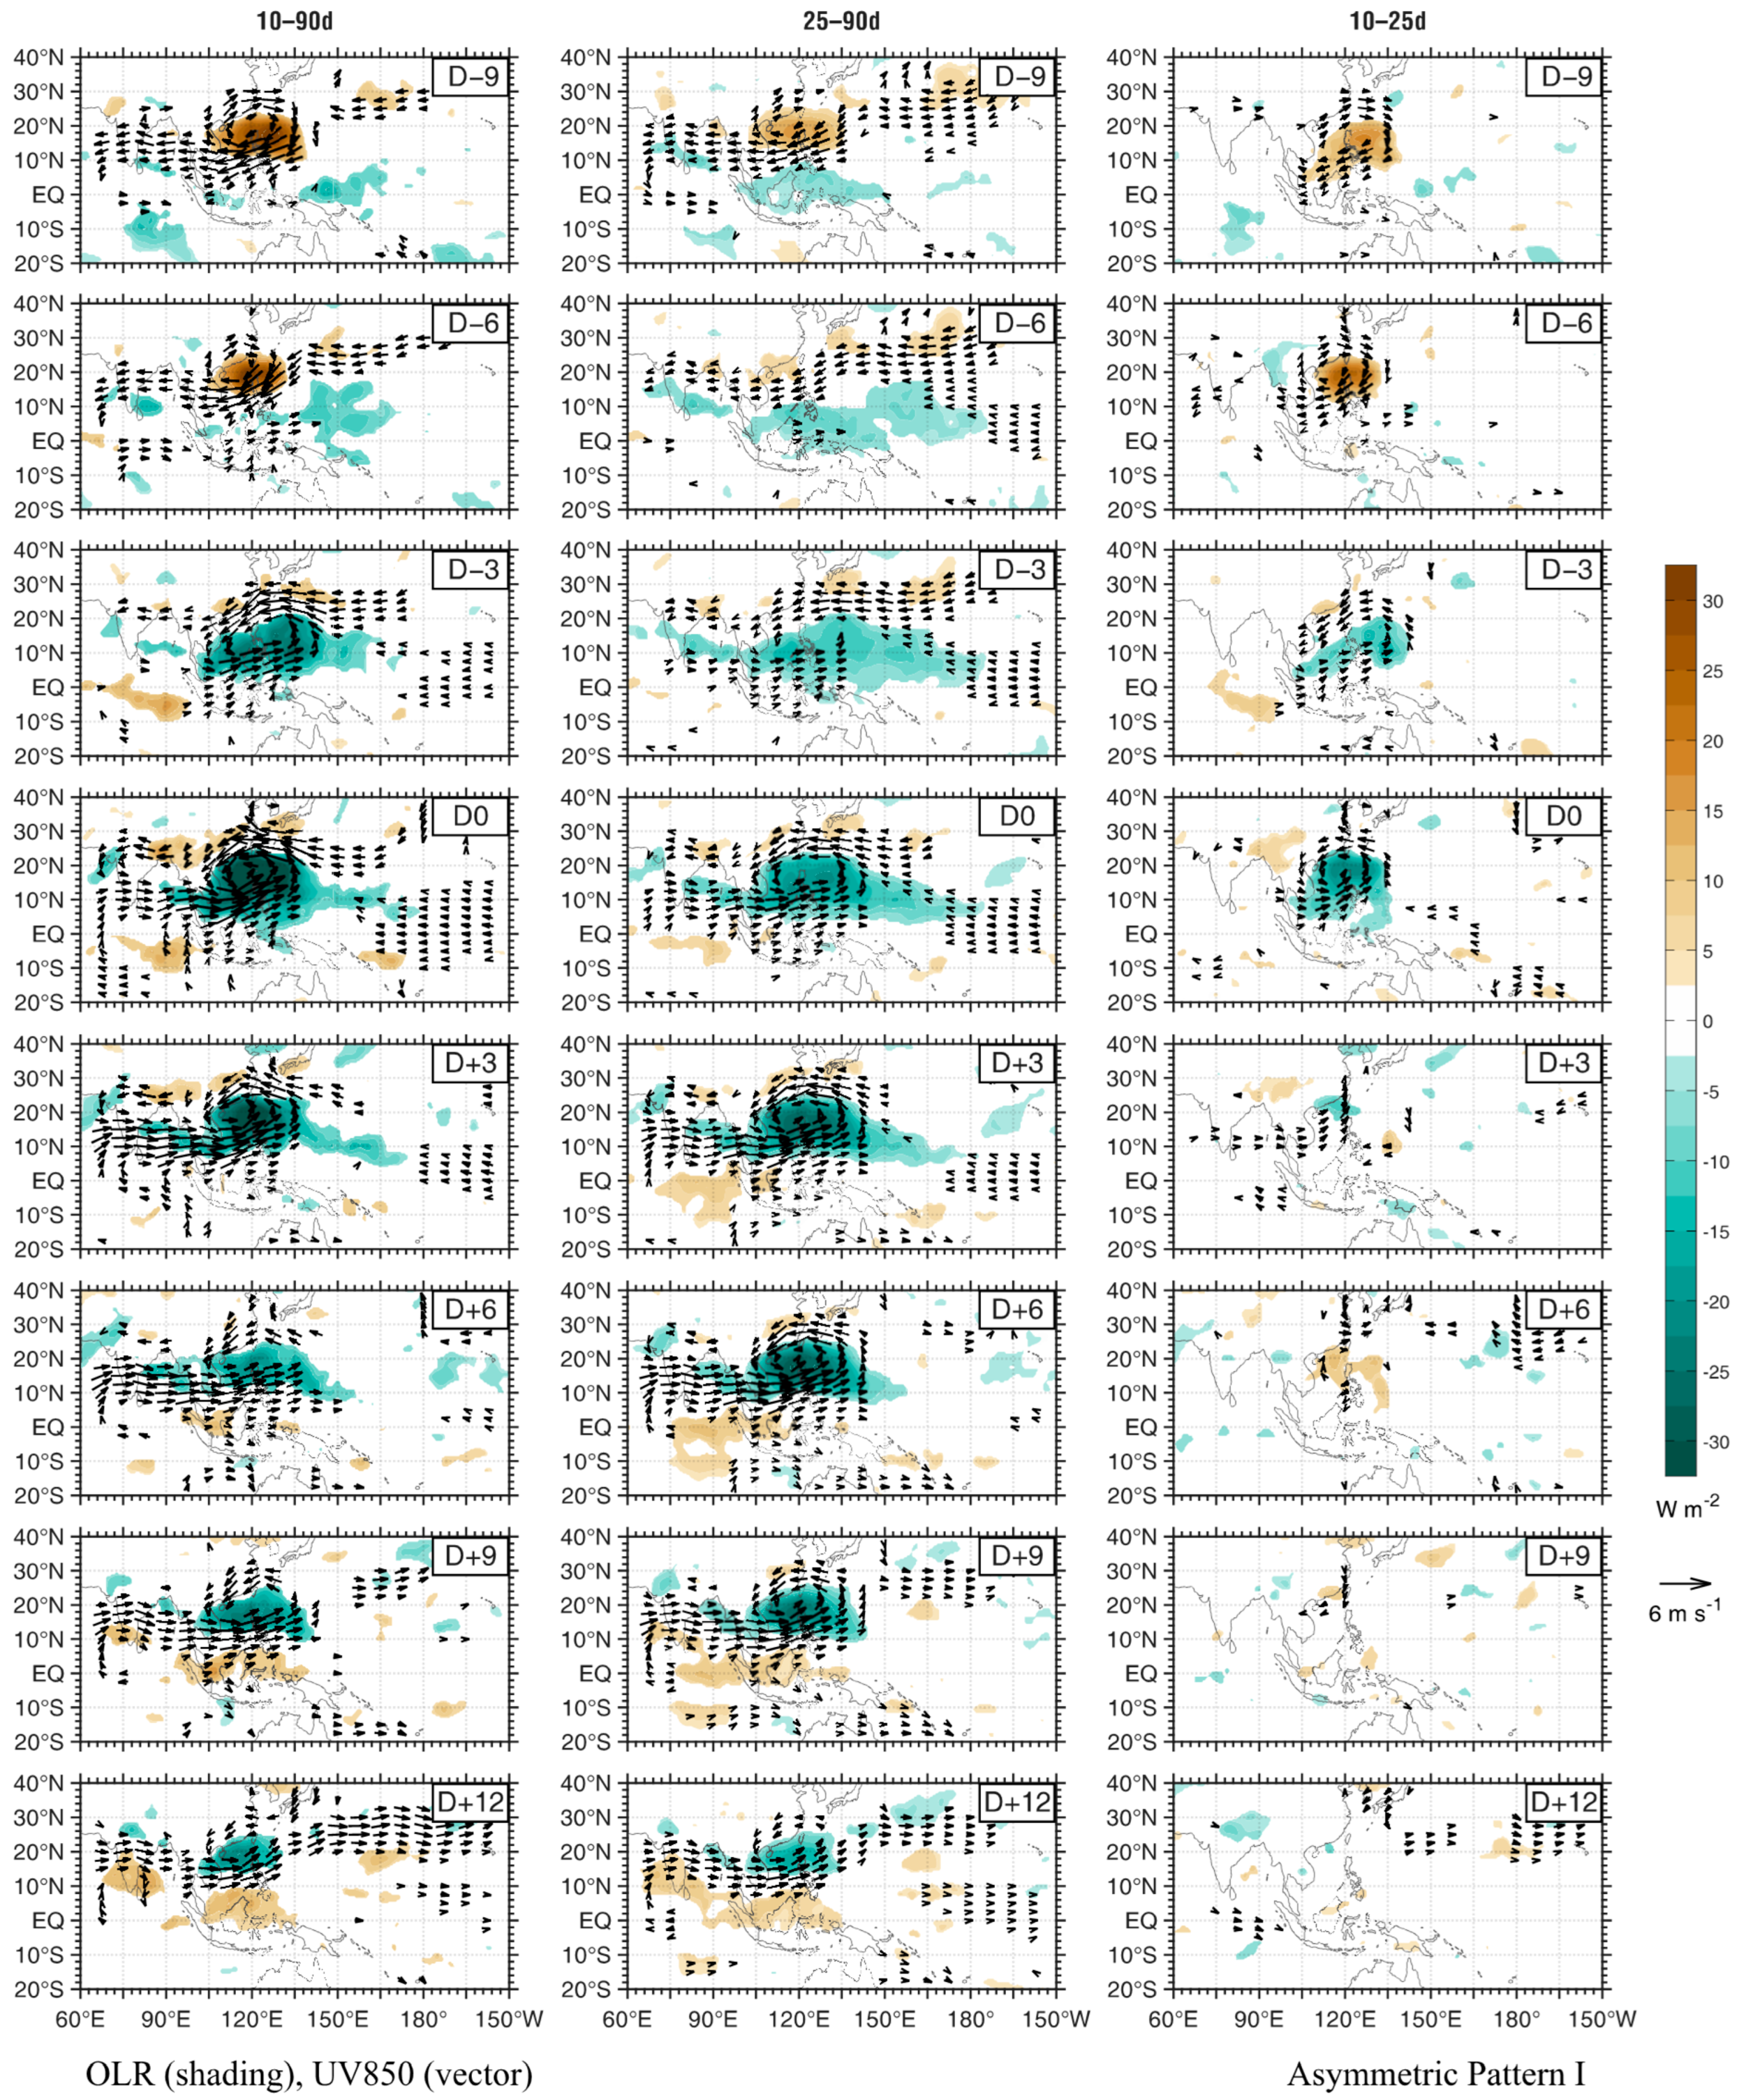
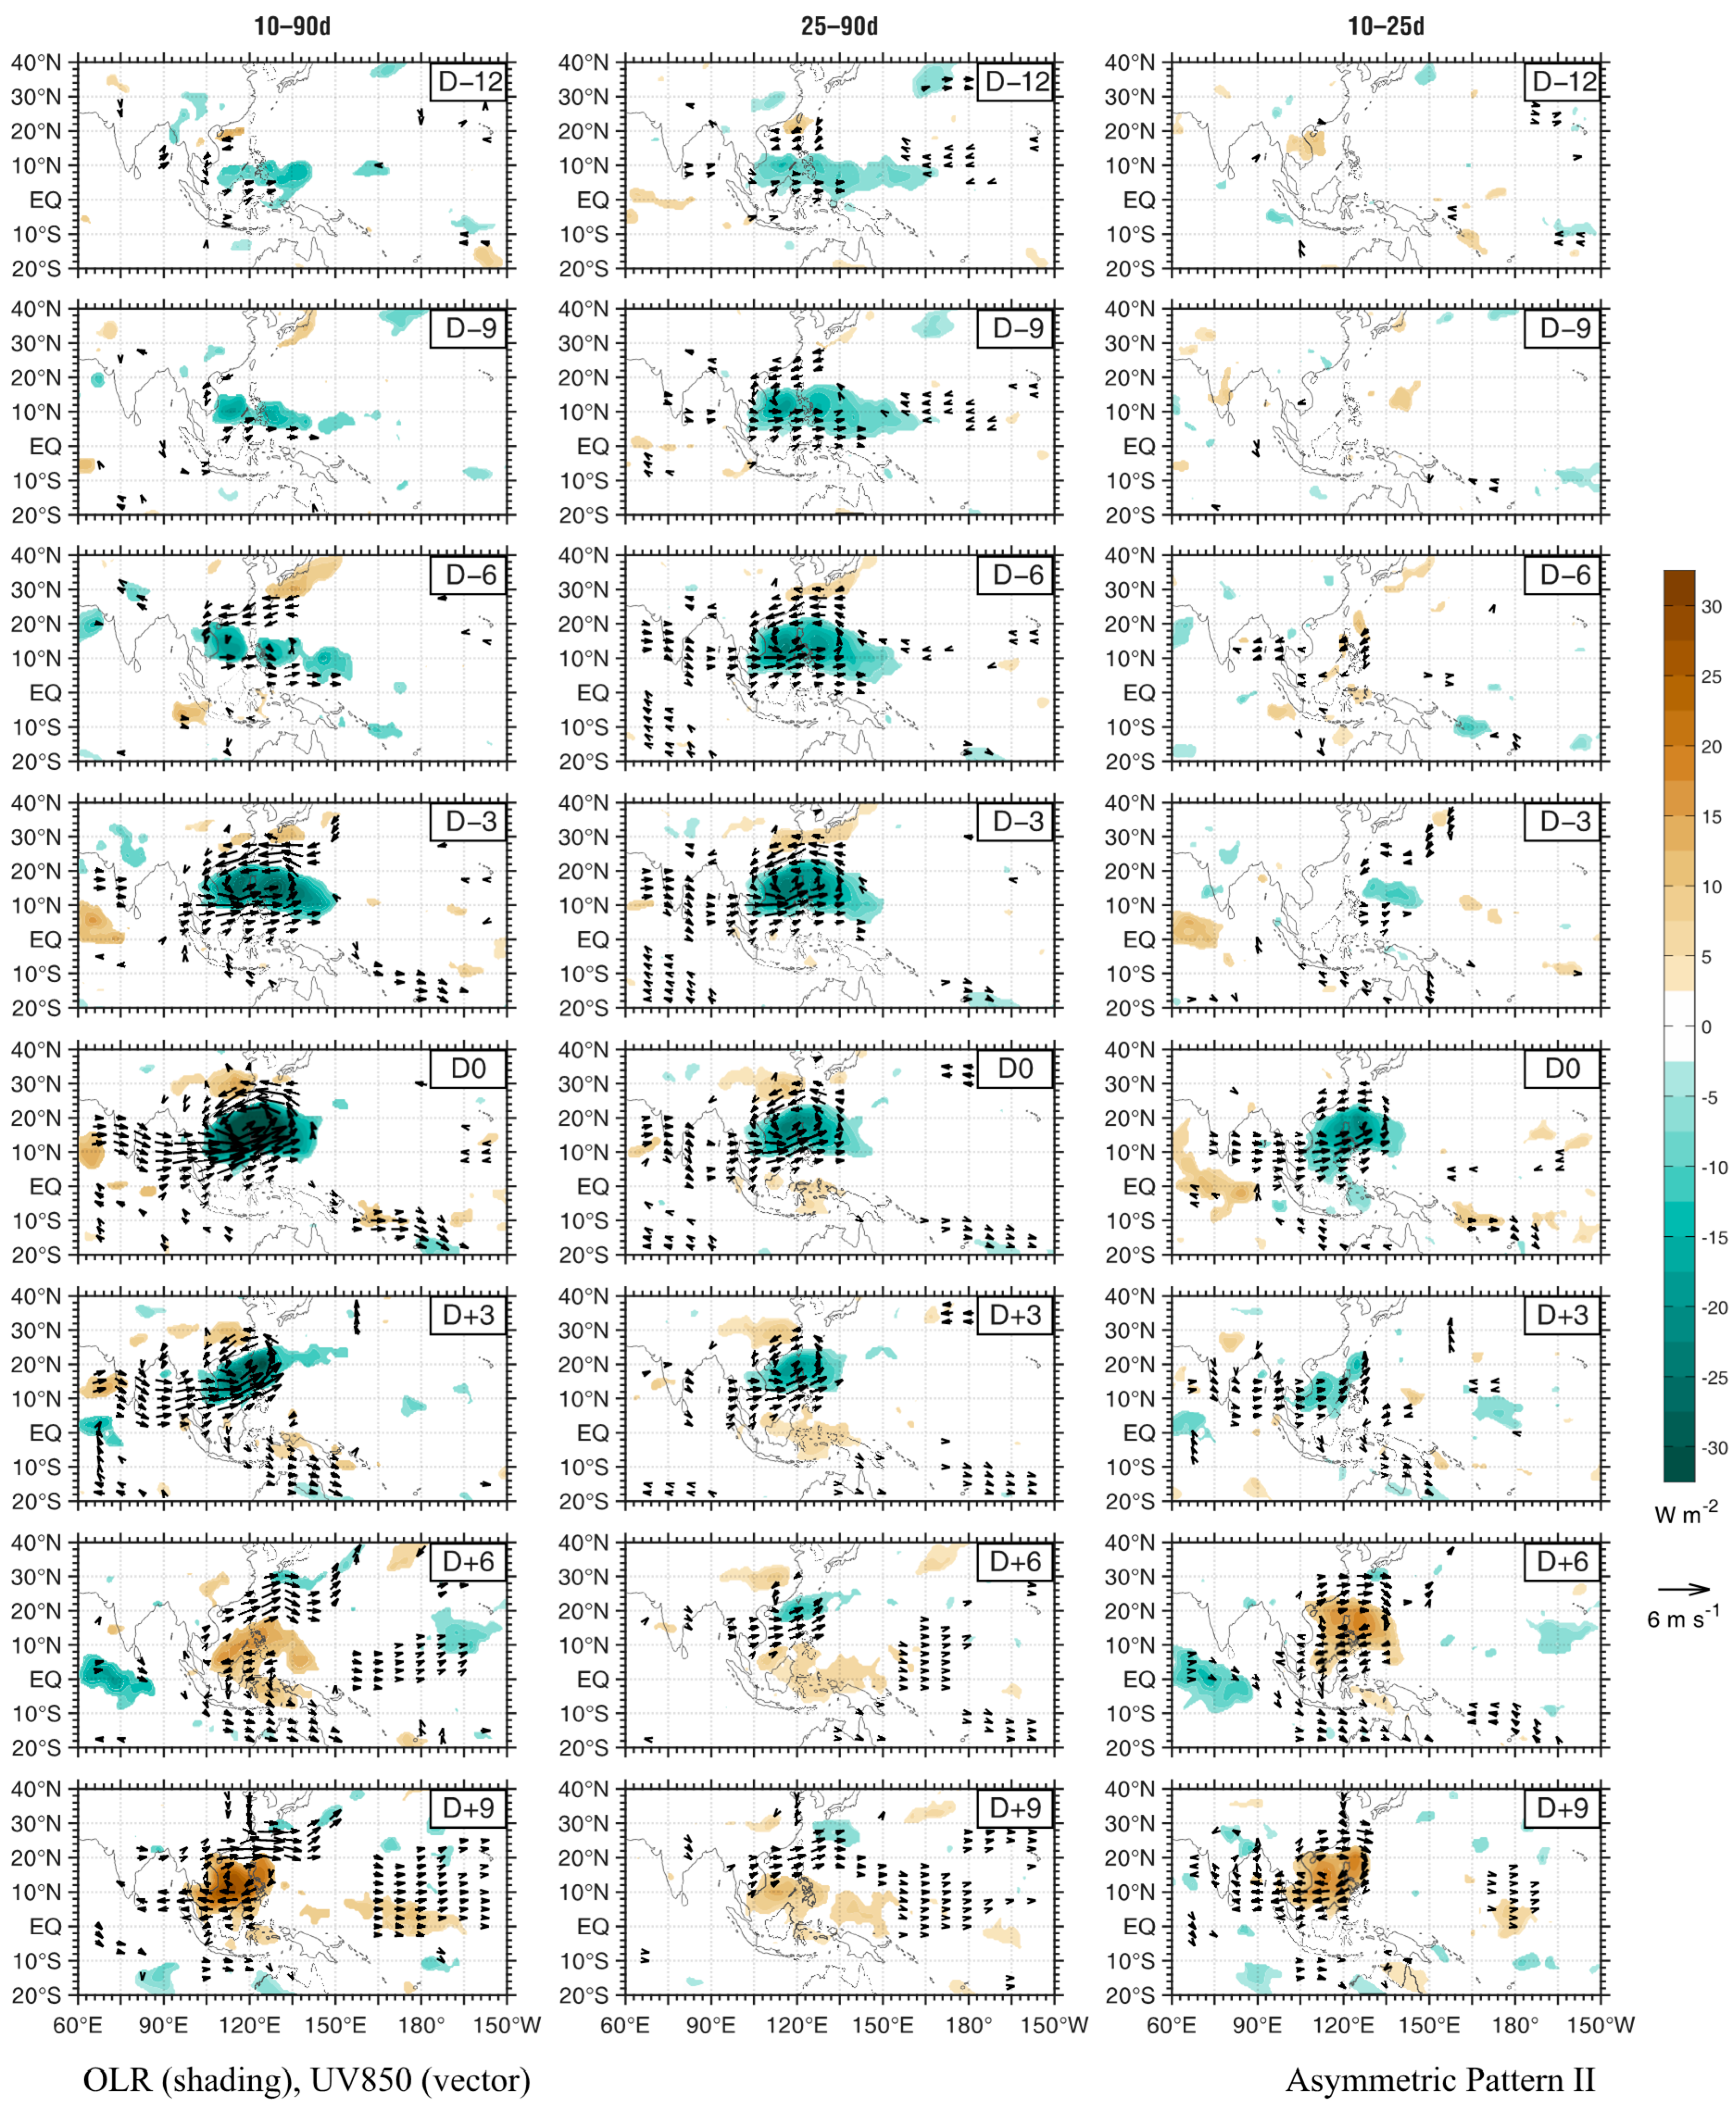
Based on life cycle duration and asymmetry, the WNP BSISO events are objectively classified into three clusters: one short-lived Symmetric Pattern (155 events, hereafter the Symmetric Pattern) and two long-lived asymmetric patterns. The asymmetric clusters are distinguished by opposite wet phase evolution asymmetries: one with rapid development but slow decay (43 events, termed Asymmetric Pattern I), and the other with slow development and rapid decay (39 events, termed Asymmetric Pattern II). Composite intraseasonal OLR and circulation anomalies for the three patterns—based on the 10–25-day (HF), 25–90-day (LF), and 10–90-day (full-band) filtered components—are presented in
Figure 2,
Figure 3 and
Figure 4 and are used in the following subsections to discuss the propagation characteristics of each mode.
3.1.1. The Symmetric Pattern
The Symmetric Pattern exhibits a canonical northwestward propagation (
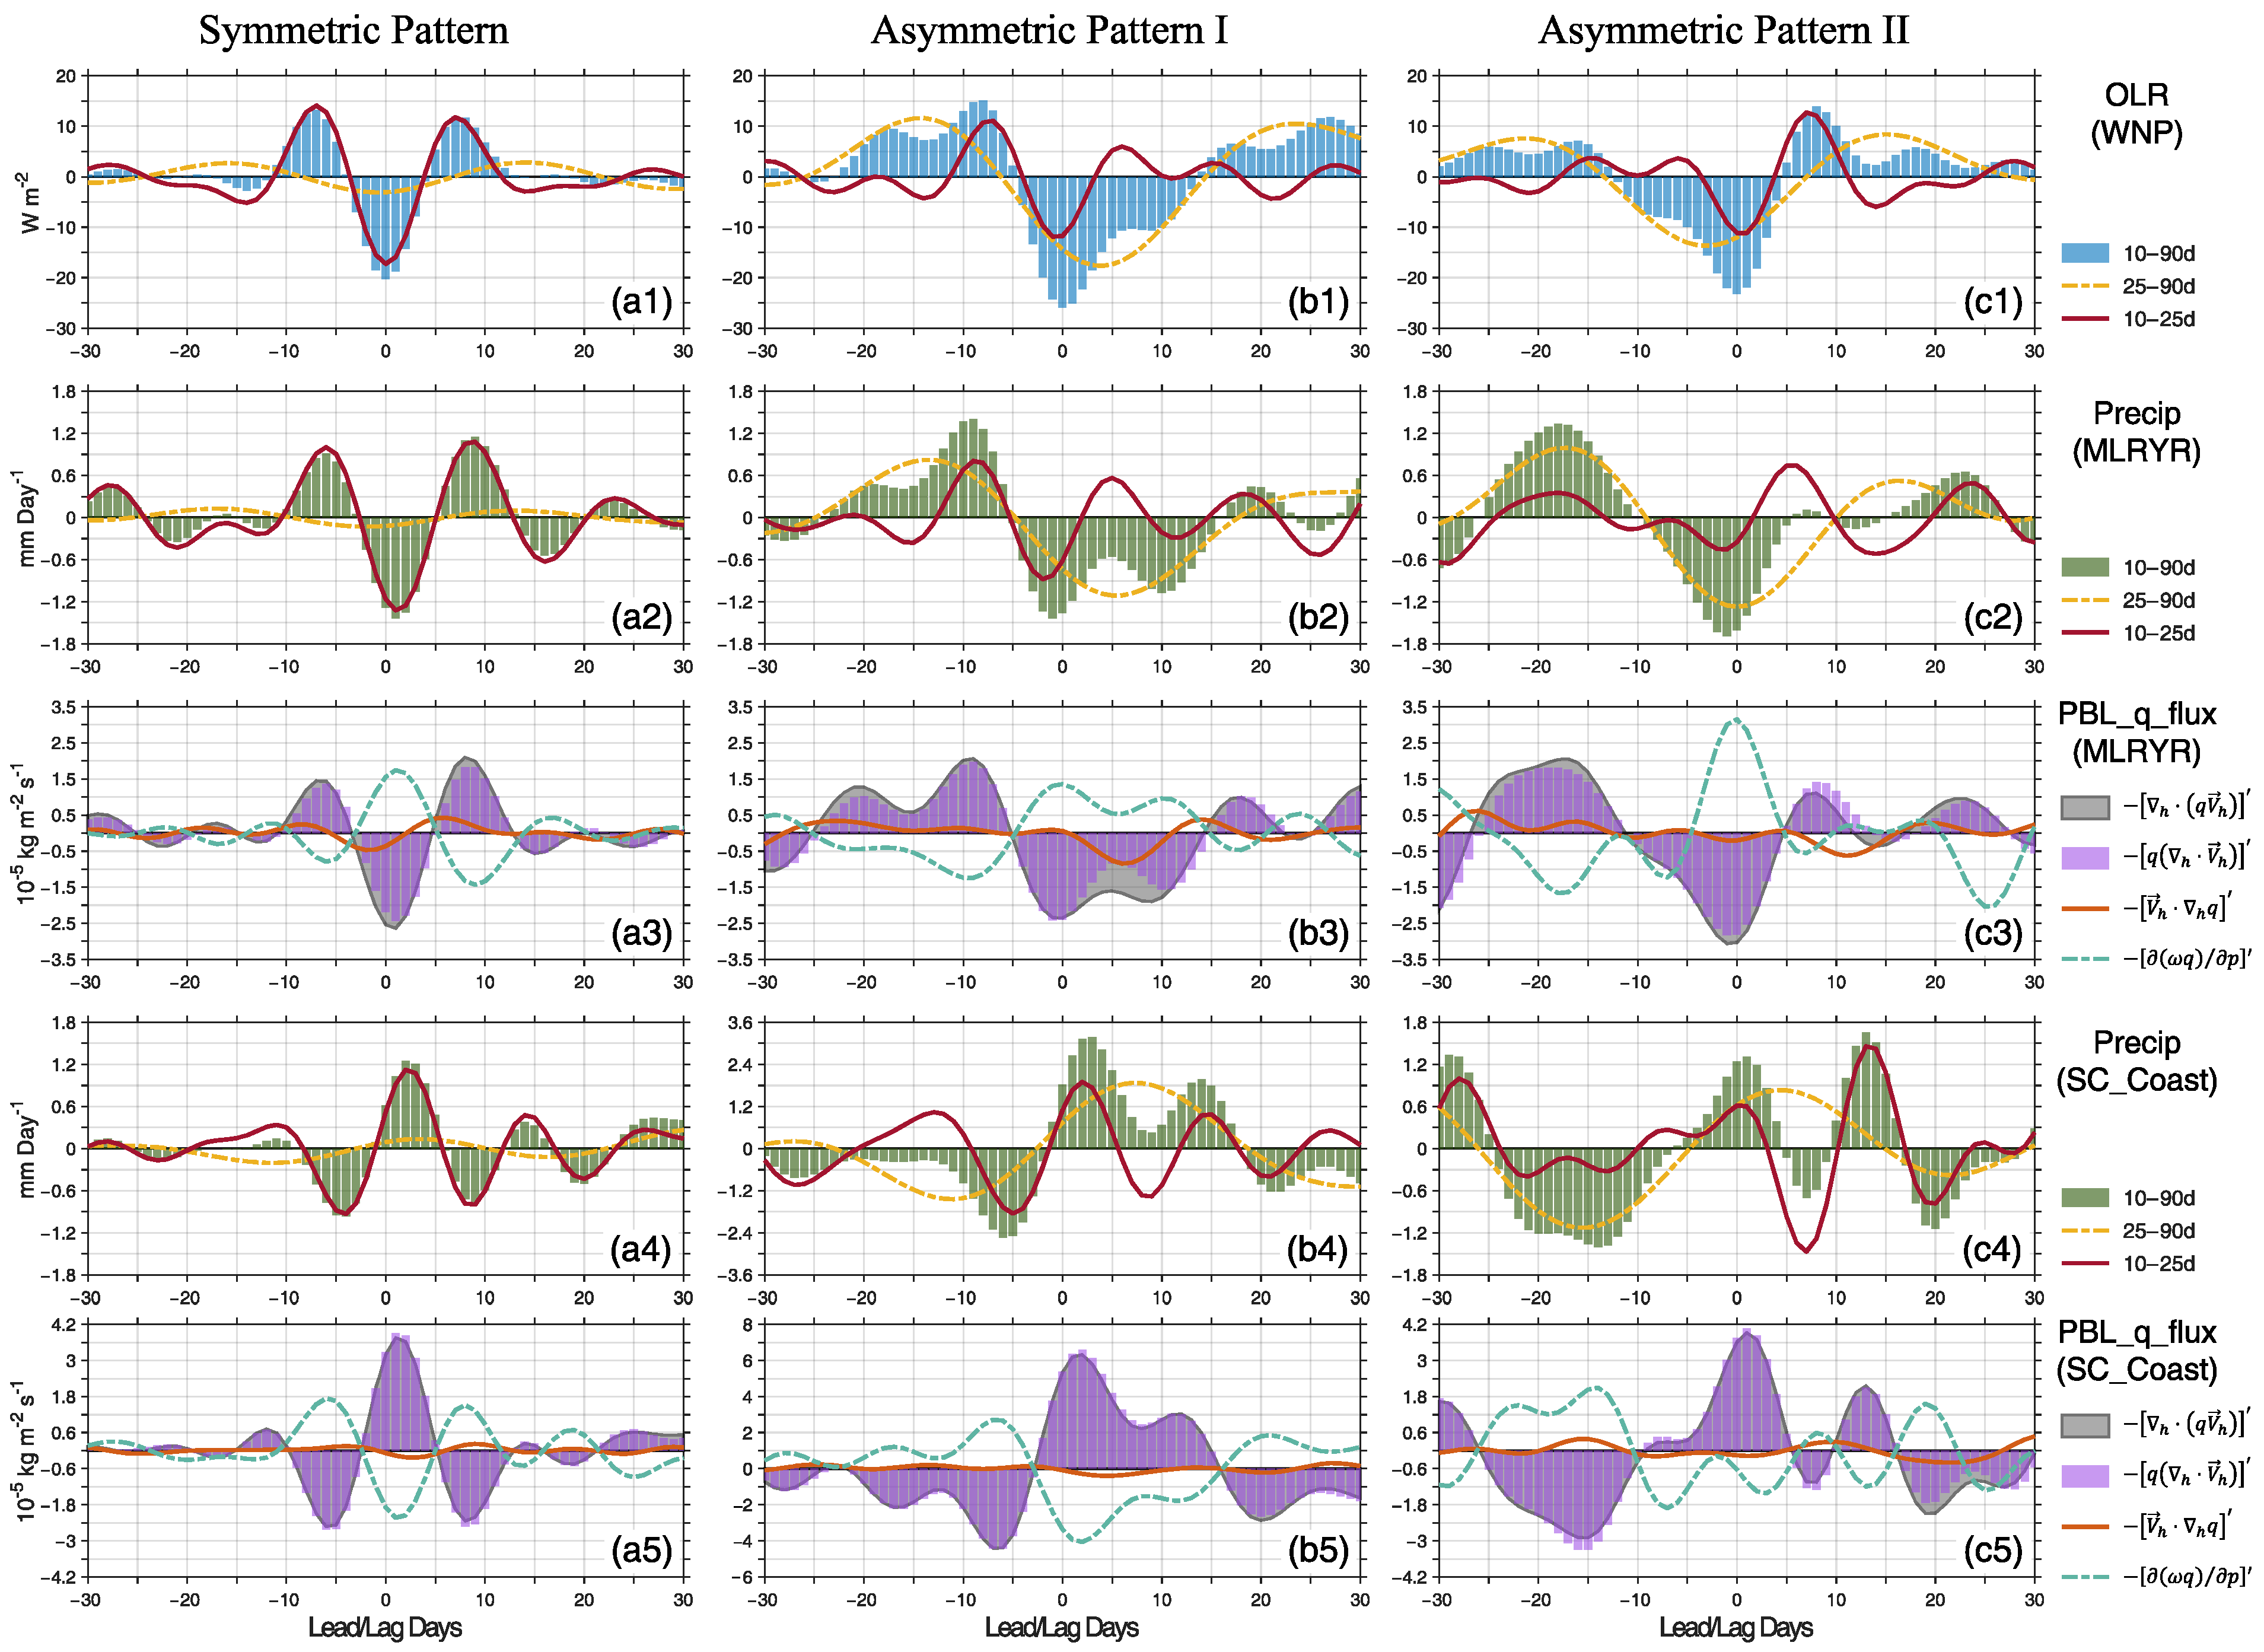
Figure 2). Anomalous convection initiates around Day 7 over the equatorial western Pacific east of New Guinea, then develops and propagates northwestward. The convective center reaches its peak intensity east of Luzon by Day 0, subsequently enters the South China Sea, and decays within a few days. The entire evolution of convection and associated circulation anomalies is nearly symmetric. This symmetry is more clearly illustrated by the evolution of the area-averaged OLR anomaly over the WNP (
Figure 5(a1)).
The pattern is dominated by the high-frequency (10–25-day) component and exhibits a relatively short life cycle, with almost no signal in the 25–90-day band. These characteristics—its high-frequency (short-lived) nature and canonical northwestward propagation over the WNP—align it with the classic quasi-biweekly oscillation (QBWO) over the WNP [
8,
36,
37,
38]. Its trajectory closely resembles the “NW-propagating I” pattern identified by Wang and Wang [
29] as one of four diverse HF-BSISO modes, consistent with its peak convection located east of the Philippines.
3.1.2. Asymmetric Pattern I: Rapid Development and Slow Decay
This pattern (
Figure 3 and
Figure 5(b1)) exhibits a notably longer life cycle than the Symmetric Pattern. Its propagation is characterized primarily by the northward movement of large-scale convection within the WNP target region (South China Sea–Philippine Sea). As in the Symmetric Pattern, the initial convective signal originates from the equatorial western Pacific east of New Guinea and propagates northwestward. During the development stage, the rainband and its accompanying lower-tropospheric cyclonic anomalies become zonally elongated, extending westward to the Bay of Bengal. The anomalous convection ultimately decays along the South China coast.
The most prominent feature of this pattern is the marked asymmetry between convective development and decay. The development phase is notably rapid: convective signals emerge around Day 9 over the equatorial western Pacific, whereas dry anomalies persist over the South China Sea until after Day 6; convection then rapidly intensifies as it propagates northward, reaching its peak within about one pentad. In contrast, the decay phase is prolonged as the active convection persists over the WNP target region for more than 10 days before eventually weakening and dissipating.
This asymmetry is likely closely tied to the interactions between the HF and LF components of BSISO. While the isolated 25–90-day evolution appears largely symmetric, a pronounced 10–25-day dry-to-wet transition signal dominates the WNP target region during the development stage, driving a rapid reversal of the convective phase. Subsequently, the 10–25-day signal weakens considerably, allowing convection to decay in accordance with the slower rhythm of the LF-BSISO.
3.1.3. Asymmetric Pattern II: Slow Development and Rapid Decay
Similar to the Asymmetric Pattern I, this pattern (
Figure 4 and
Figure 5(c1)) is also long-lived and characterized primarily by northward propagation, but exhibits the opposite asymmetry—namely, slow development followed by rapid decay. Active convection emerges around Day 12 in the vicinity of Mindanao, then develops slowly and propagates northward without the pronounced zonal extension seen in the Asymmetric Pattern I. It reaches peak intensity around Day 0 and then decays rapidly; the WNP target region is taken over by dry anomalies within about one pentad.
This mode also involves pronounced HF–LF interactions linked to its asymmetry. During the development stage (before Day 0), the 10–25-day signal is nearly absent. Subsequently, a strong 10–25-day wet-to-dry phase transition signal emerges over the WNP target region, accelerating the convective decay.
3.2. Impacts on Eastern China Precipitation from Distinct WNP BSISO Modes
3.2.1. Phase Relationships
Previous studies have shown that summer precipitation over southeastern China is abundant and exhibits pronounced intraseasonal variability, which is modulated significantly by both the LF- and HF-BSISO (e.g., [
16,
18,
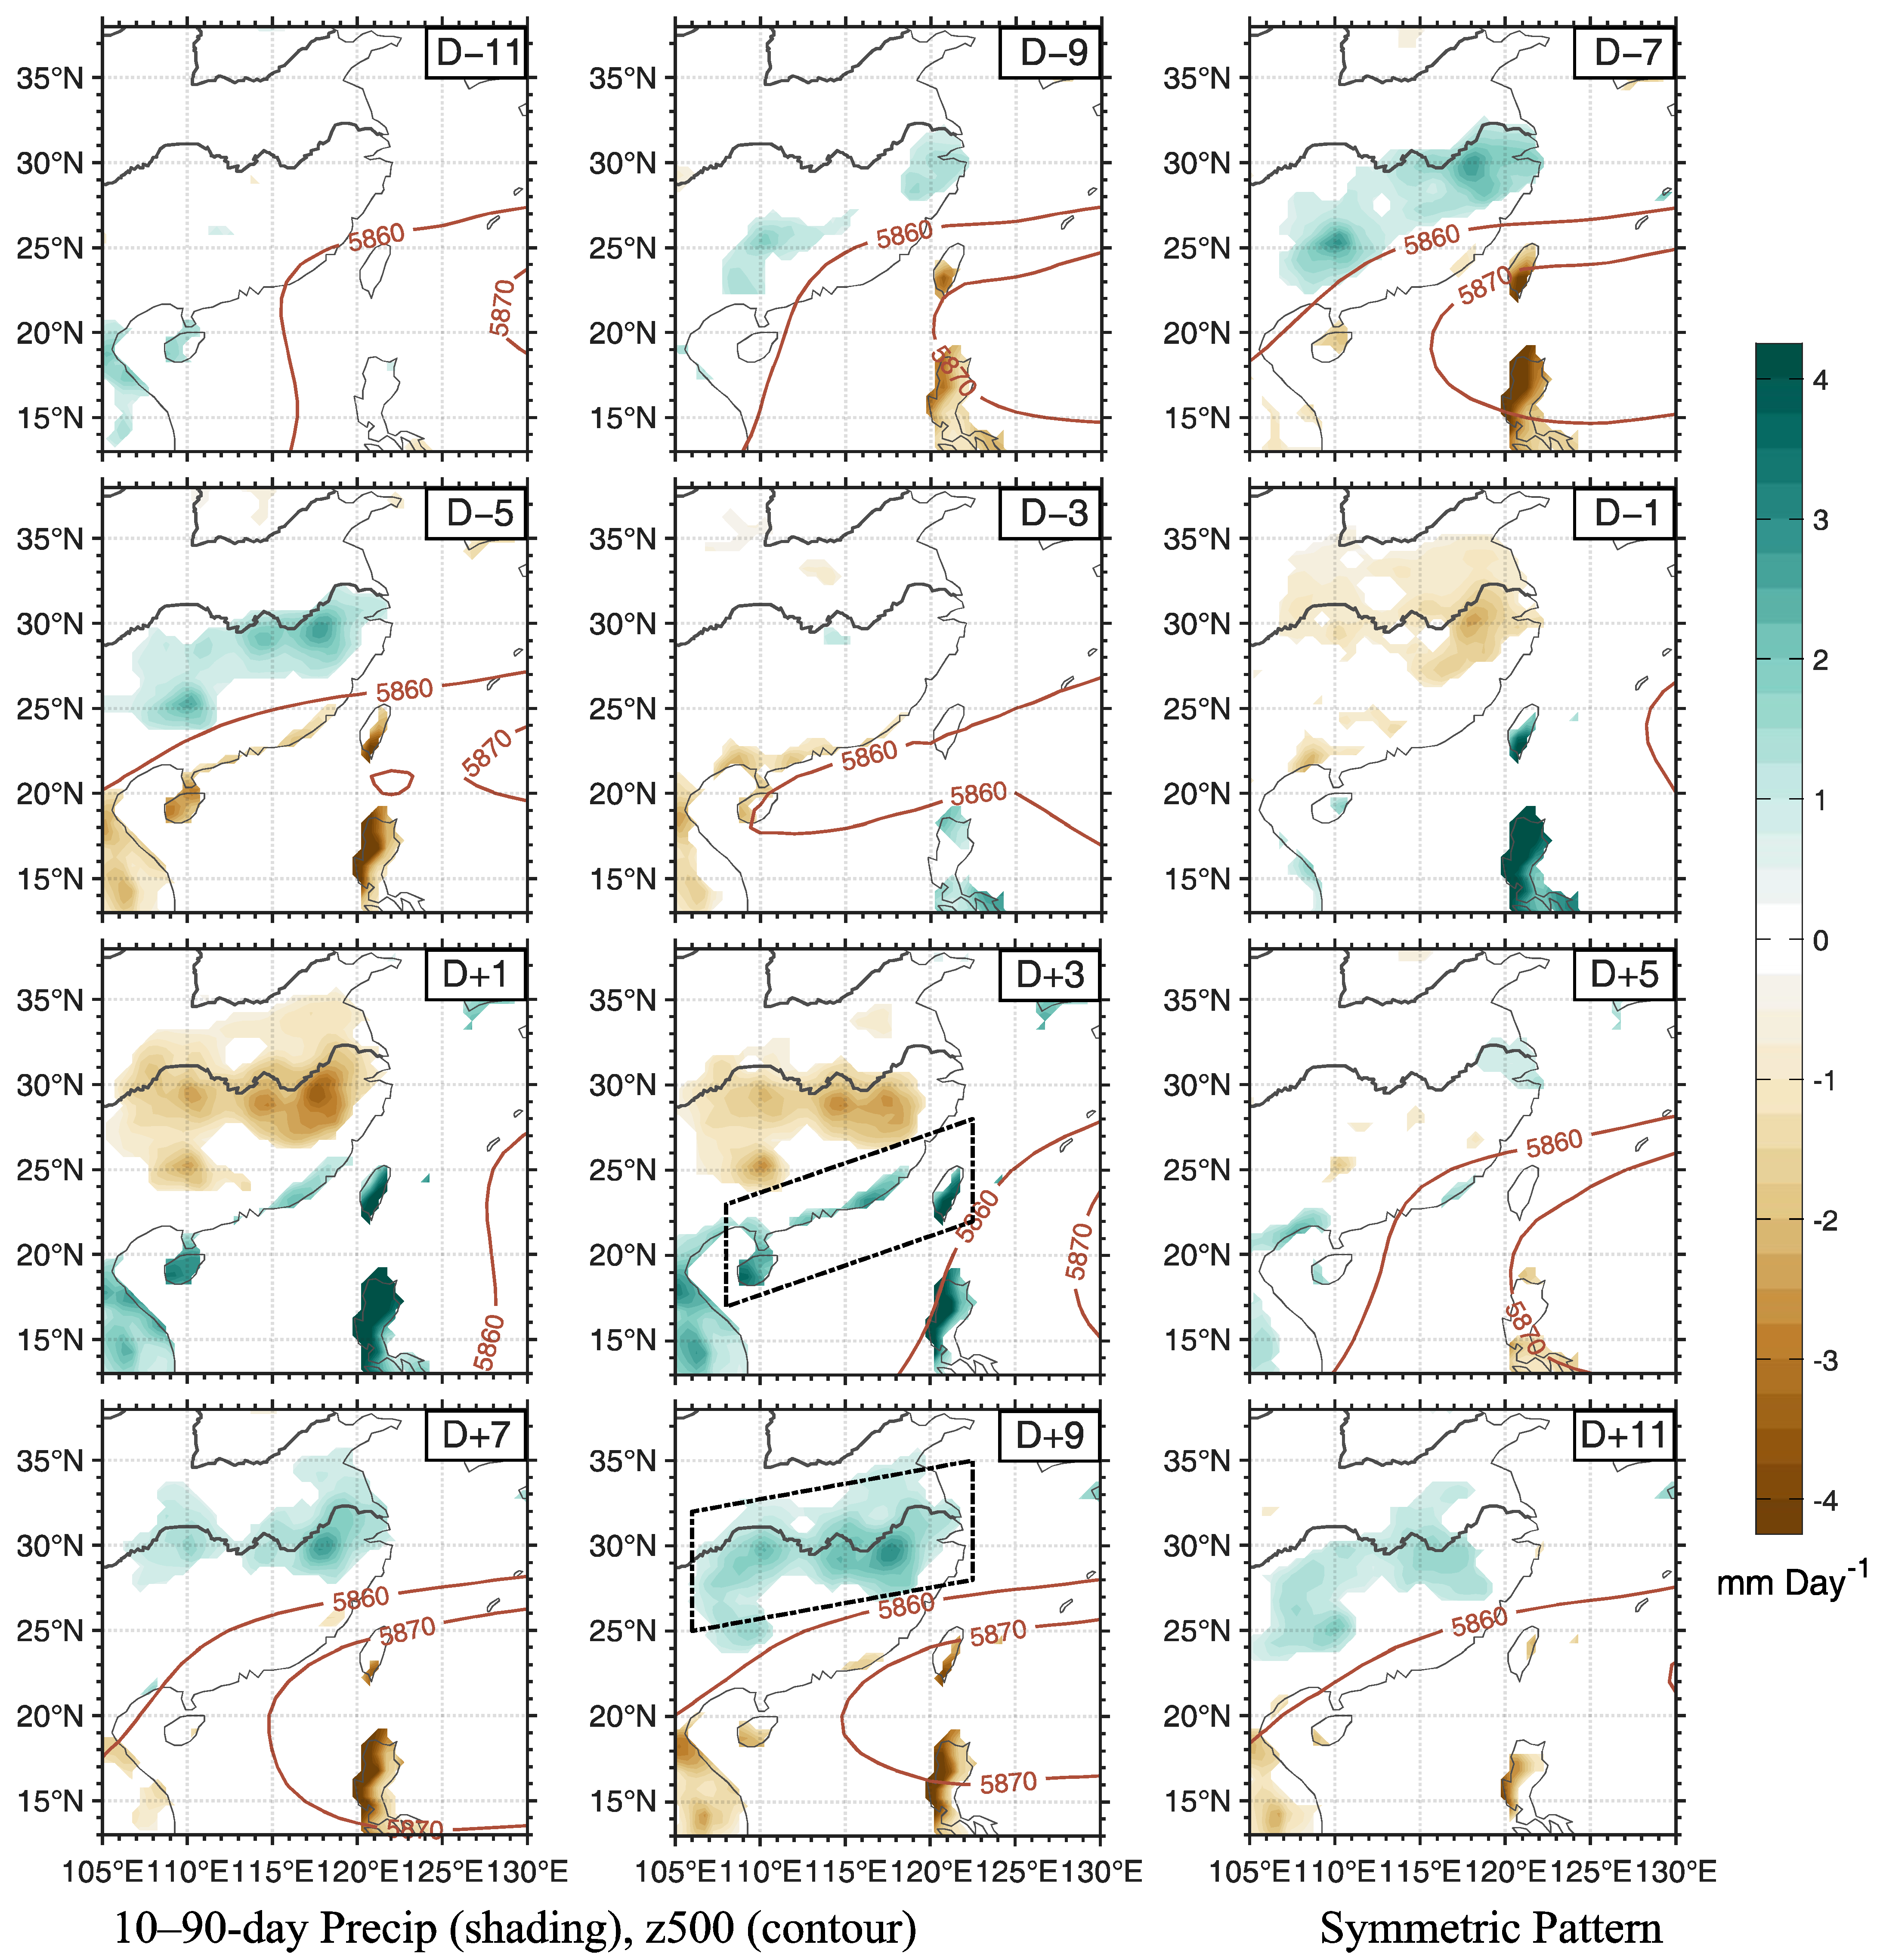
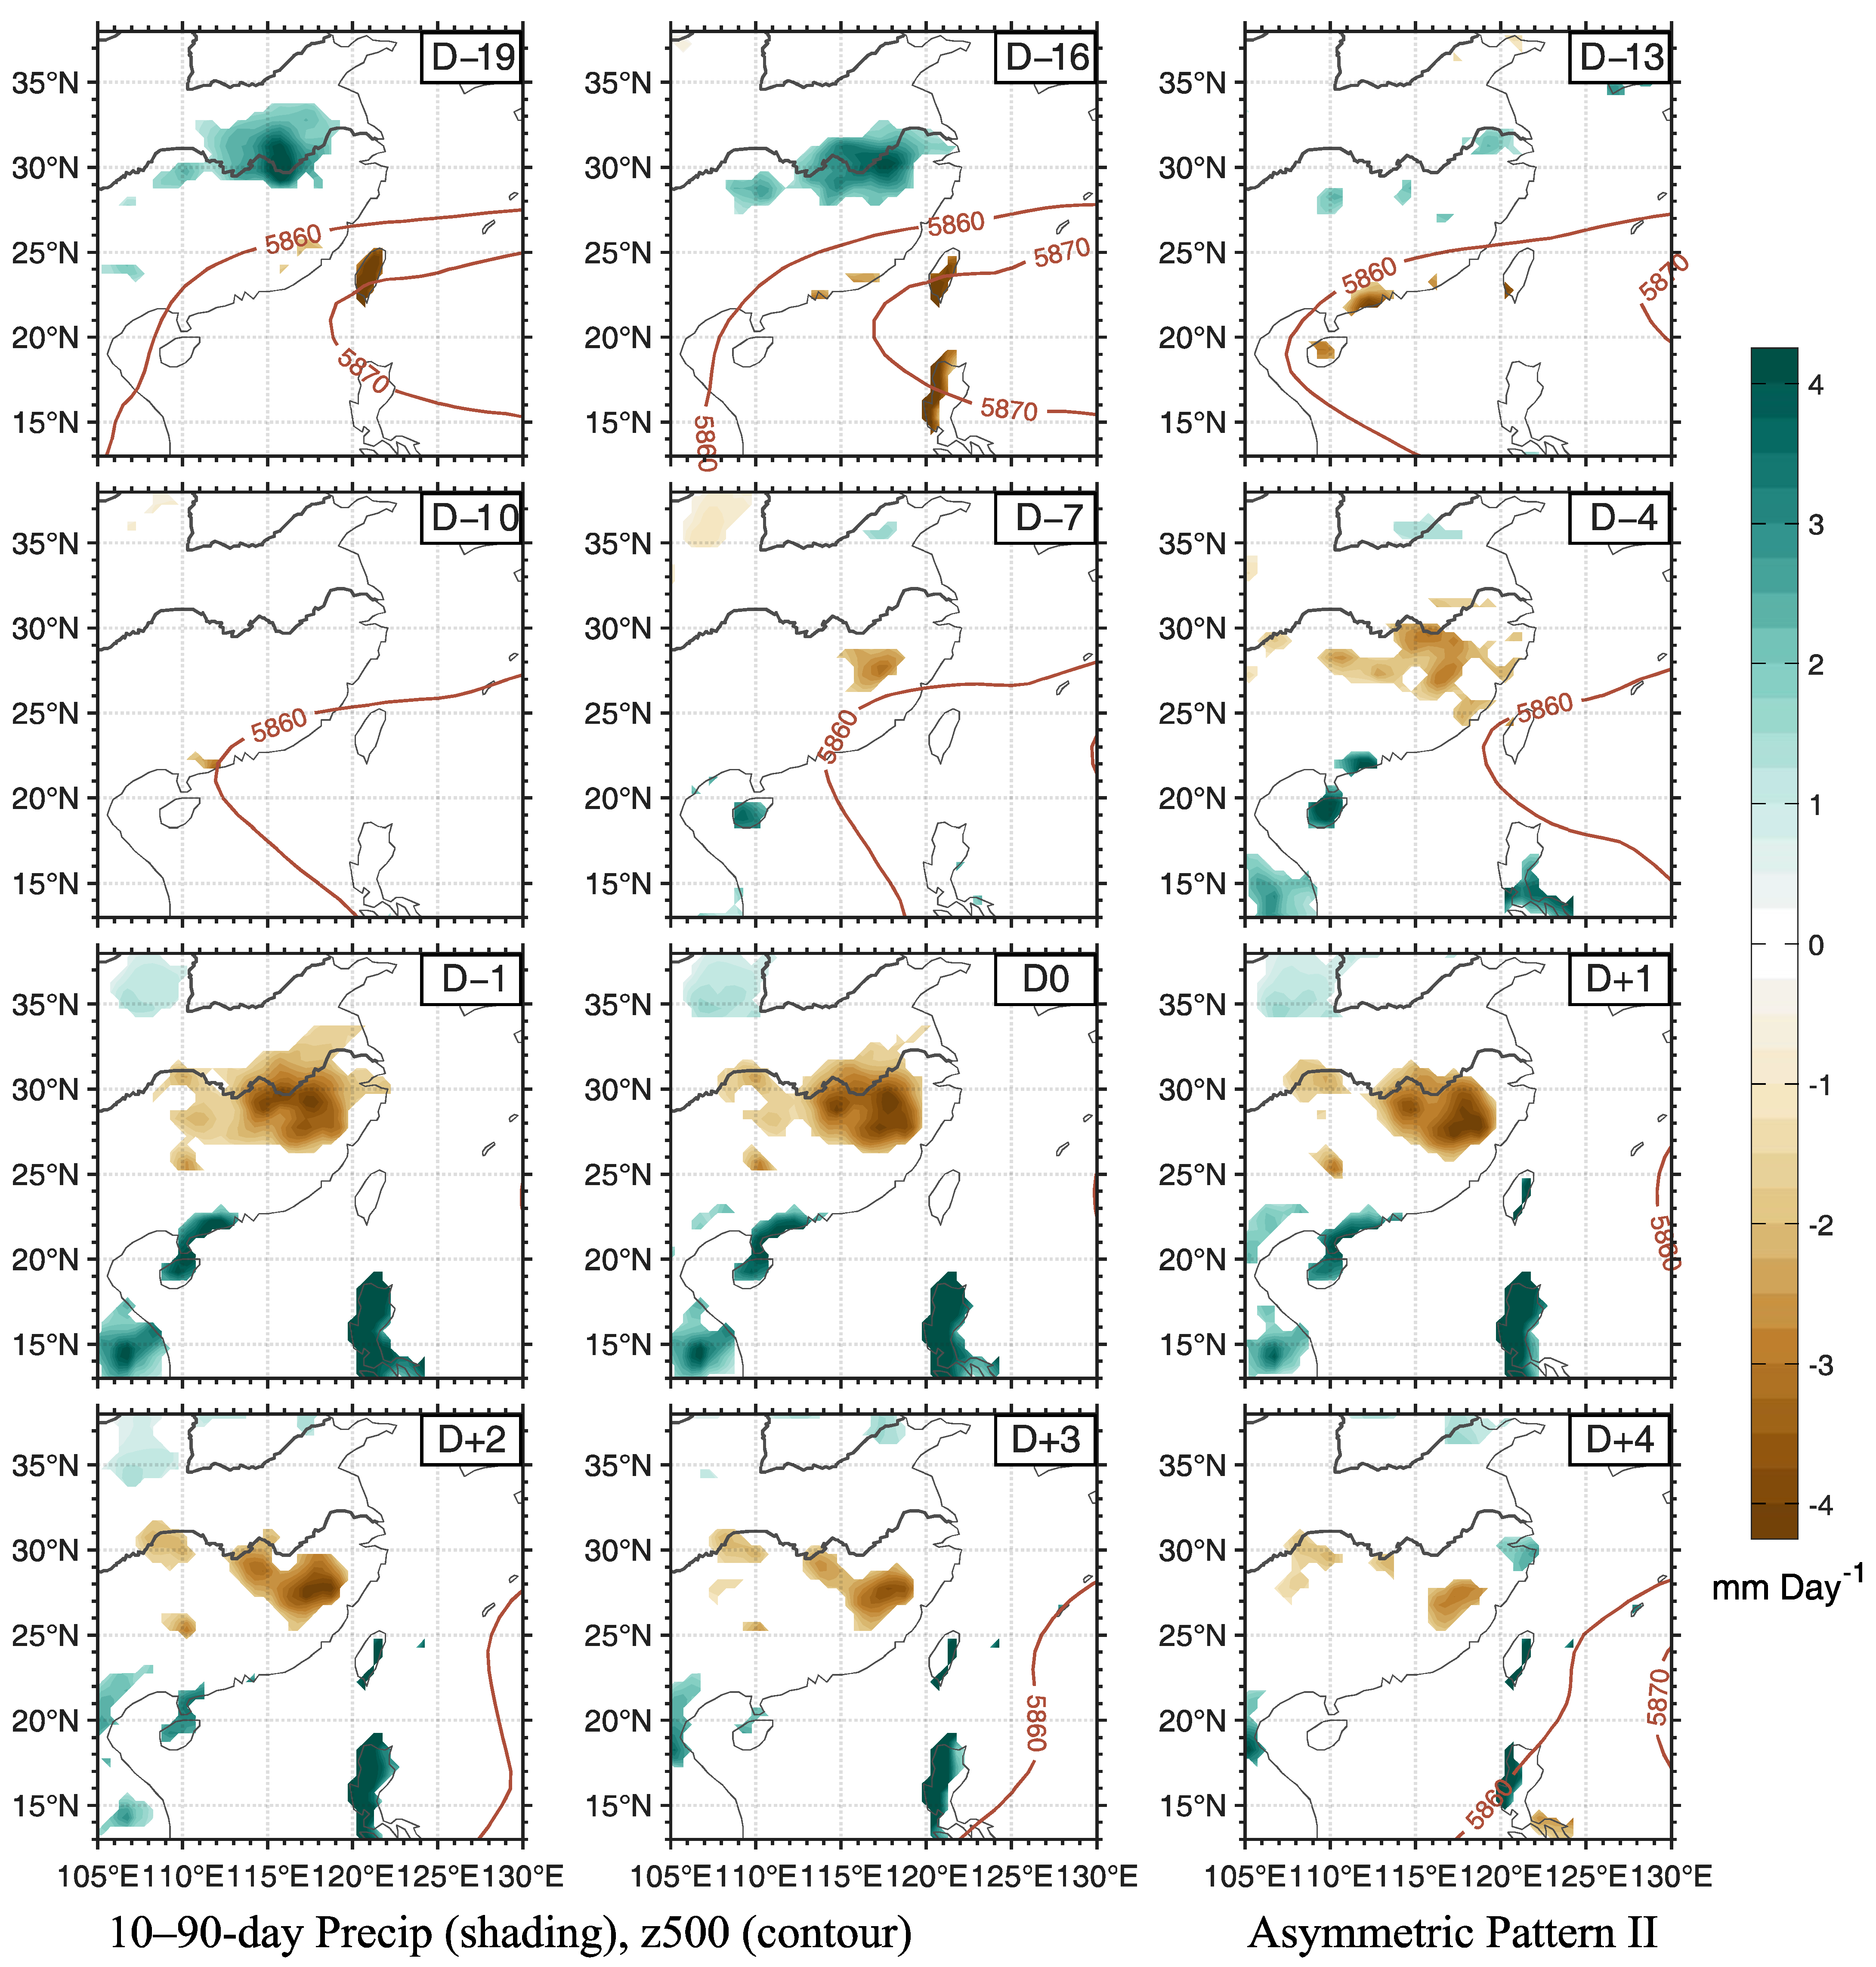
20]). BSISO-related rainfall anomalies are concentrated primarily in two regions: the middle and lower reaches of the Yangtze River (MLRYR) and the South China coastal area (SC_Coast). To examine these influences, lead-lag composite maps of precipitation anomalies were constructed for each of the three WNP BSISO modes identified in this work (
Figure 6,
Figure 7 and
Figure 8). The composites confirm the two key regions of BSISO modulation, as marked by boxes in
Figure 6 (subfigures D + 9 and D + 3).
3.2.2. Moisture Diagnosis
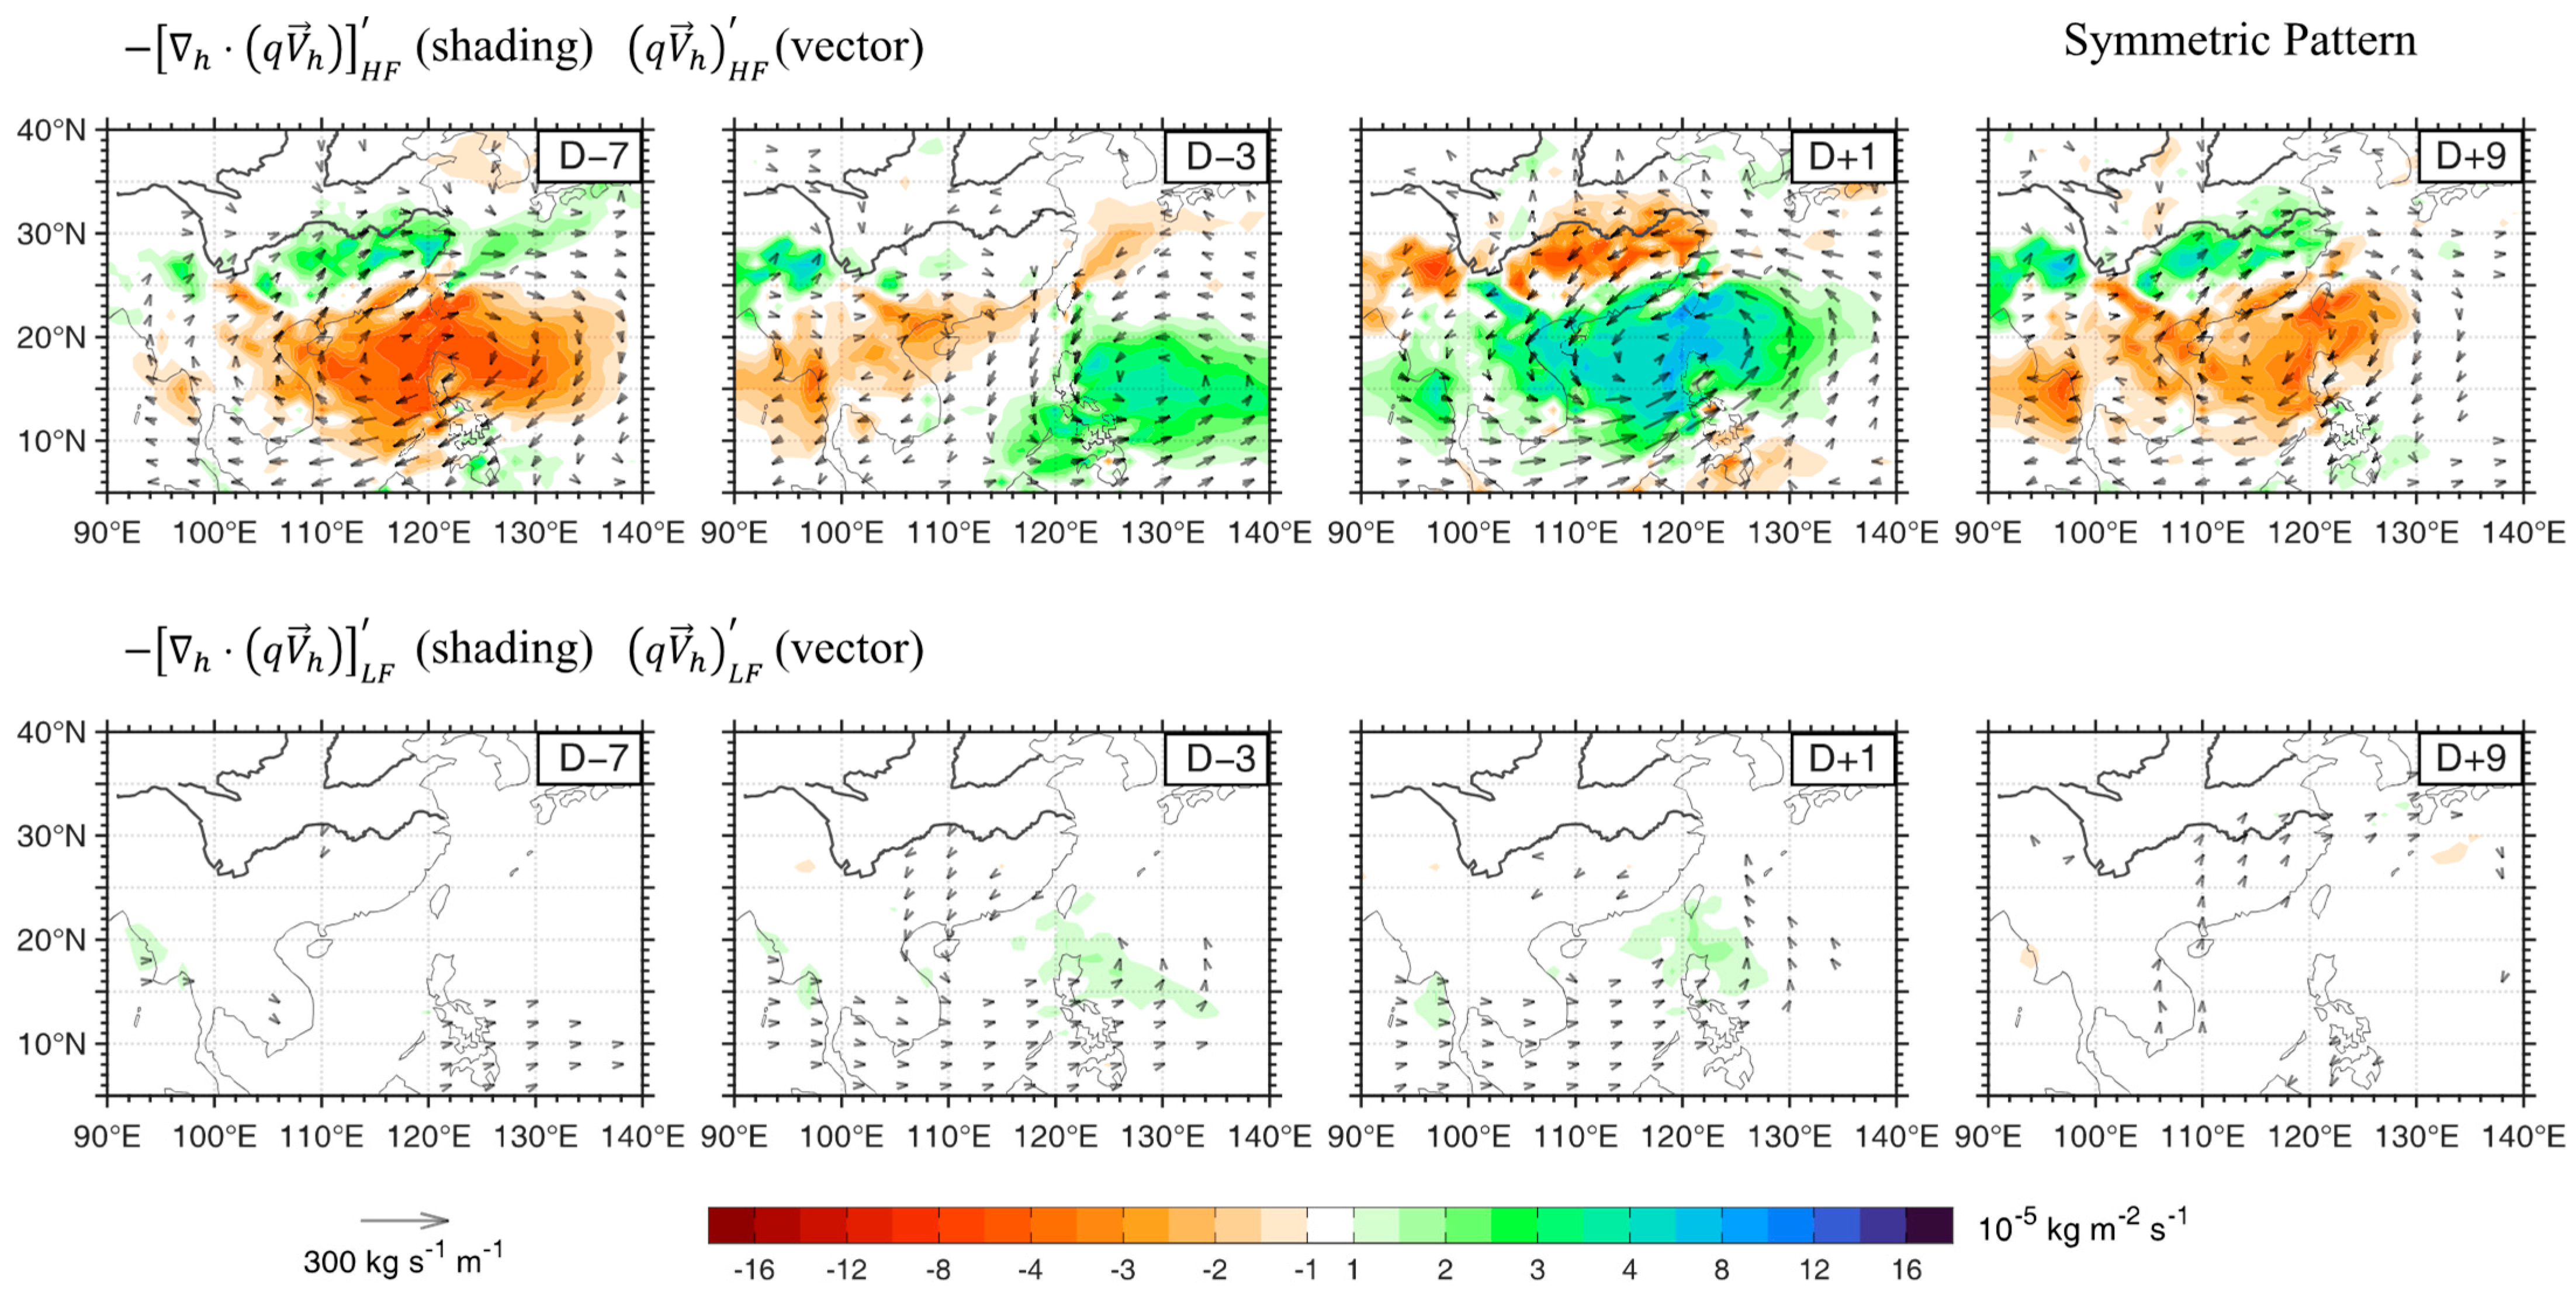
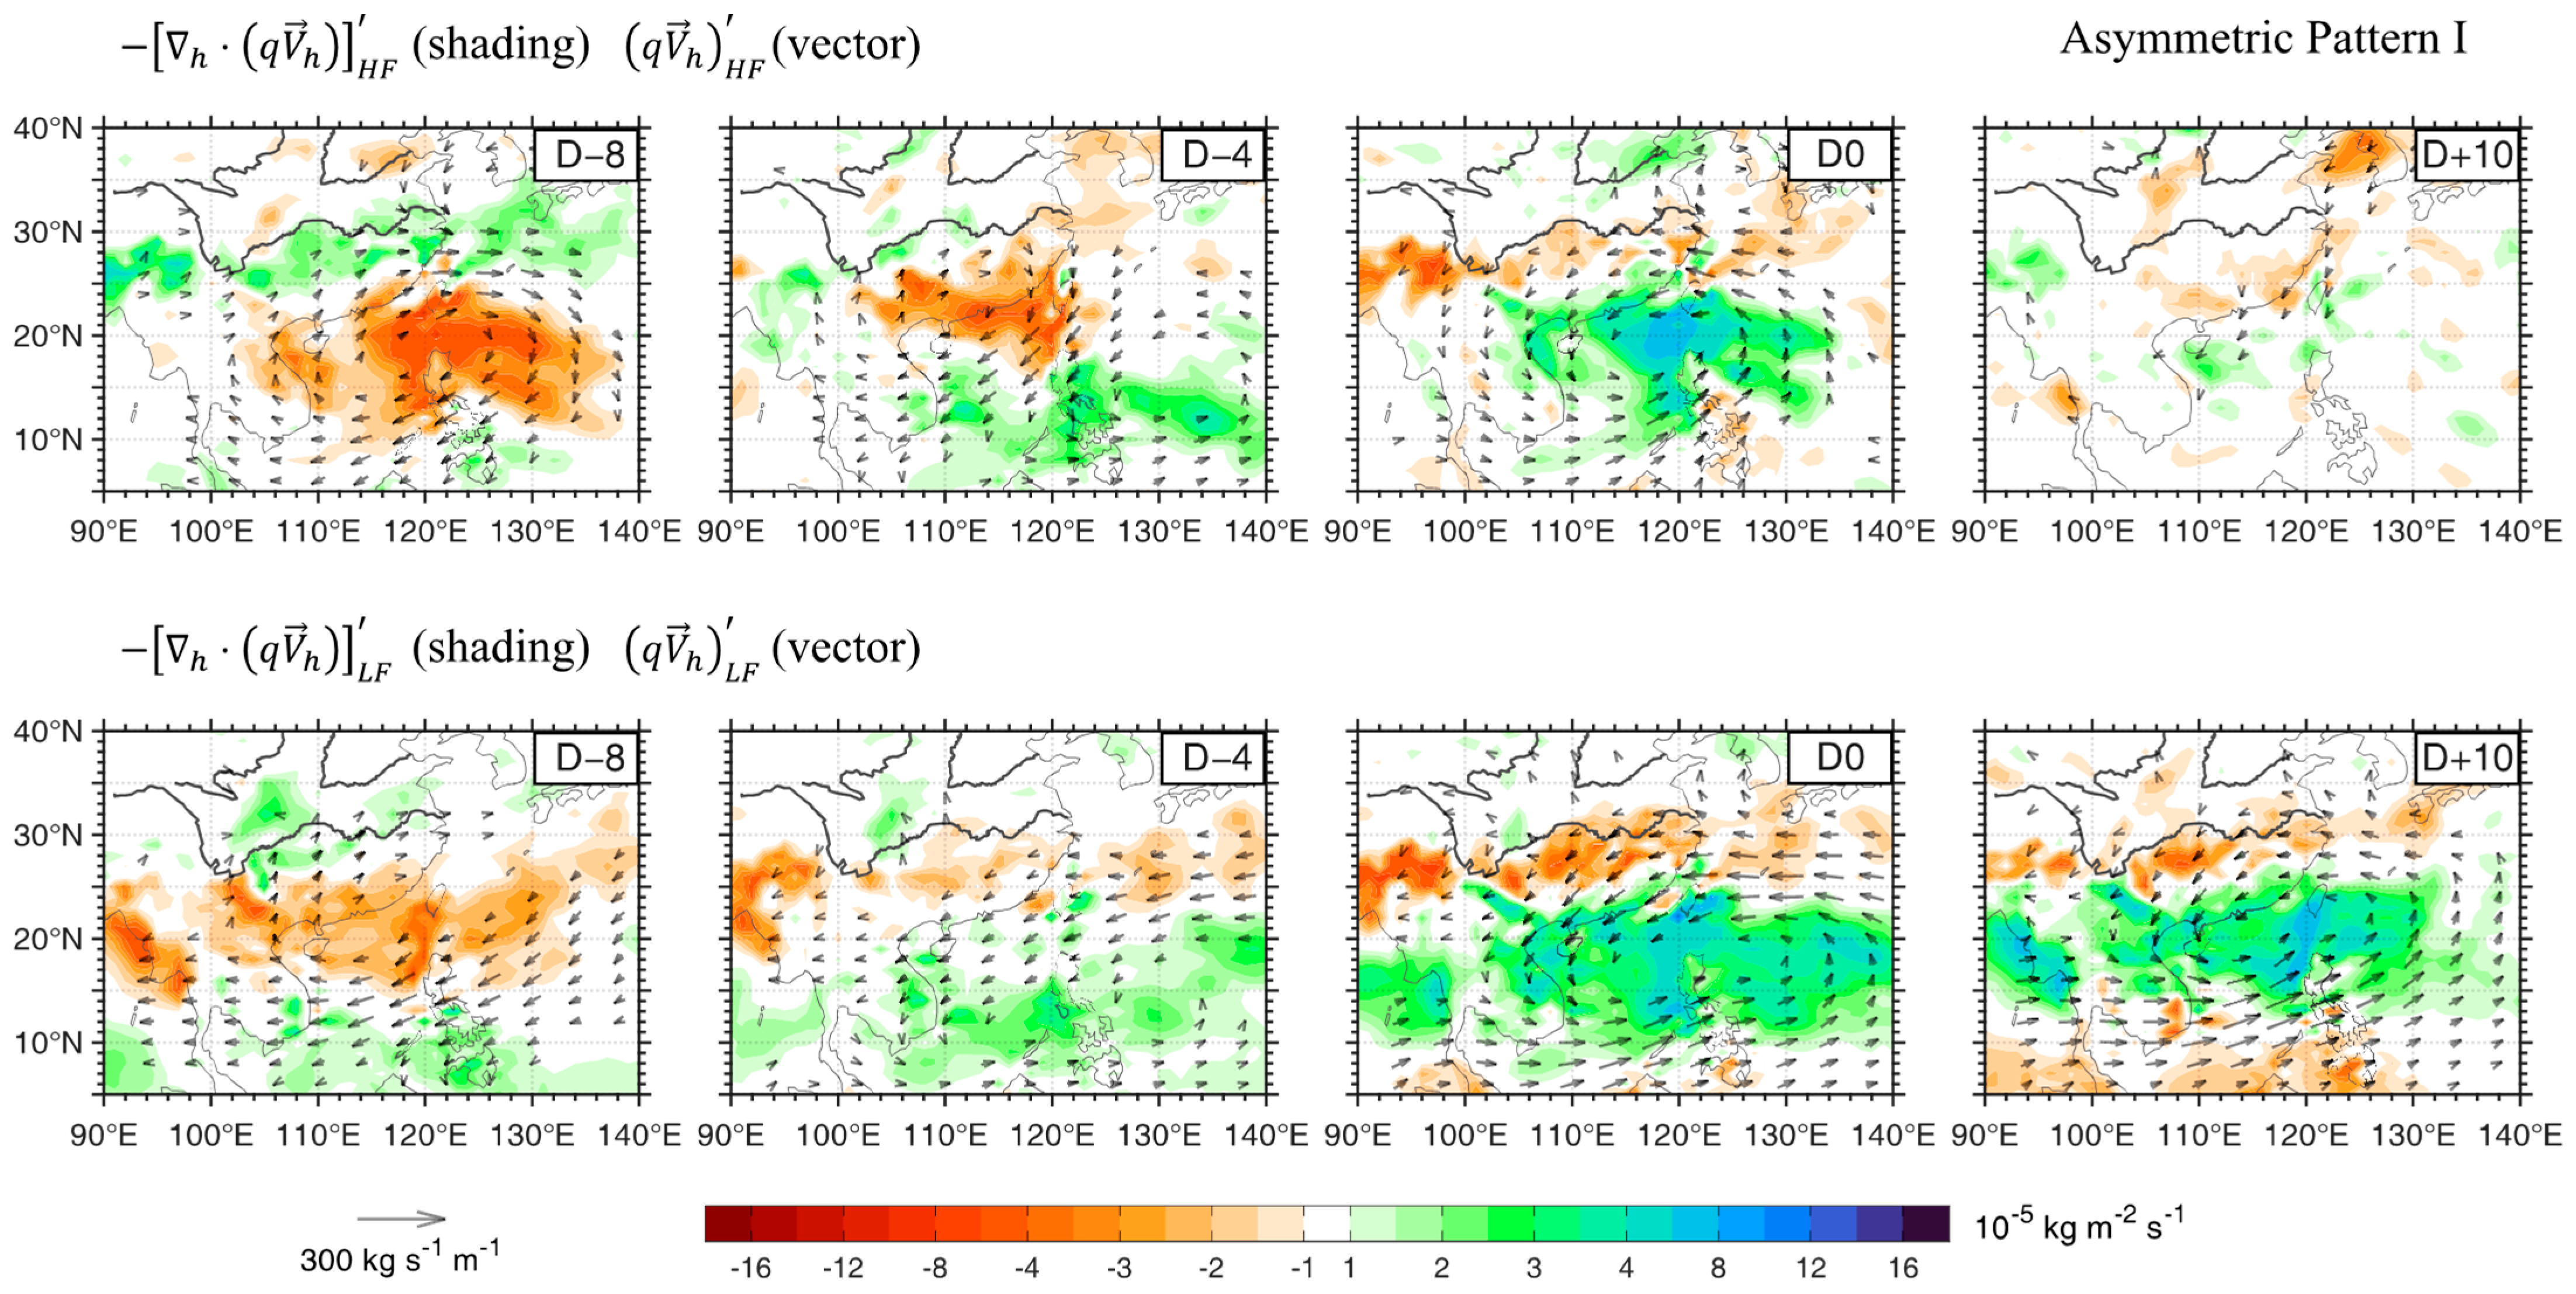
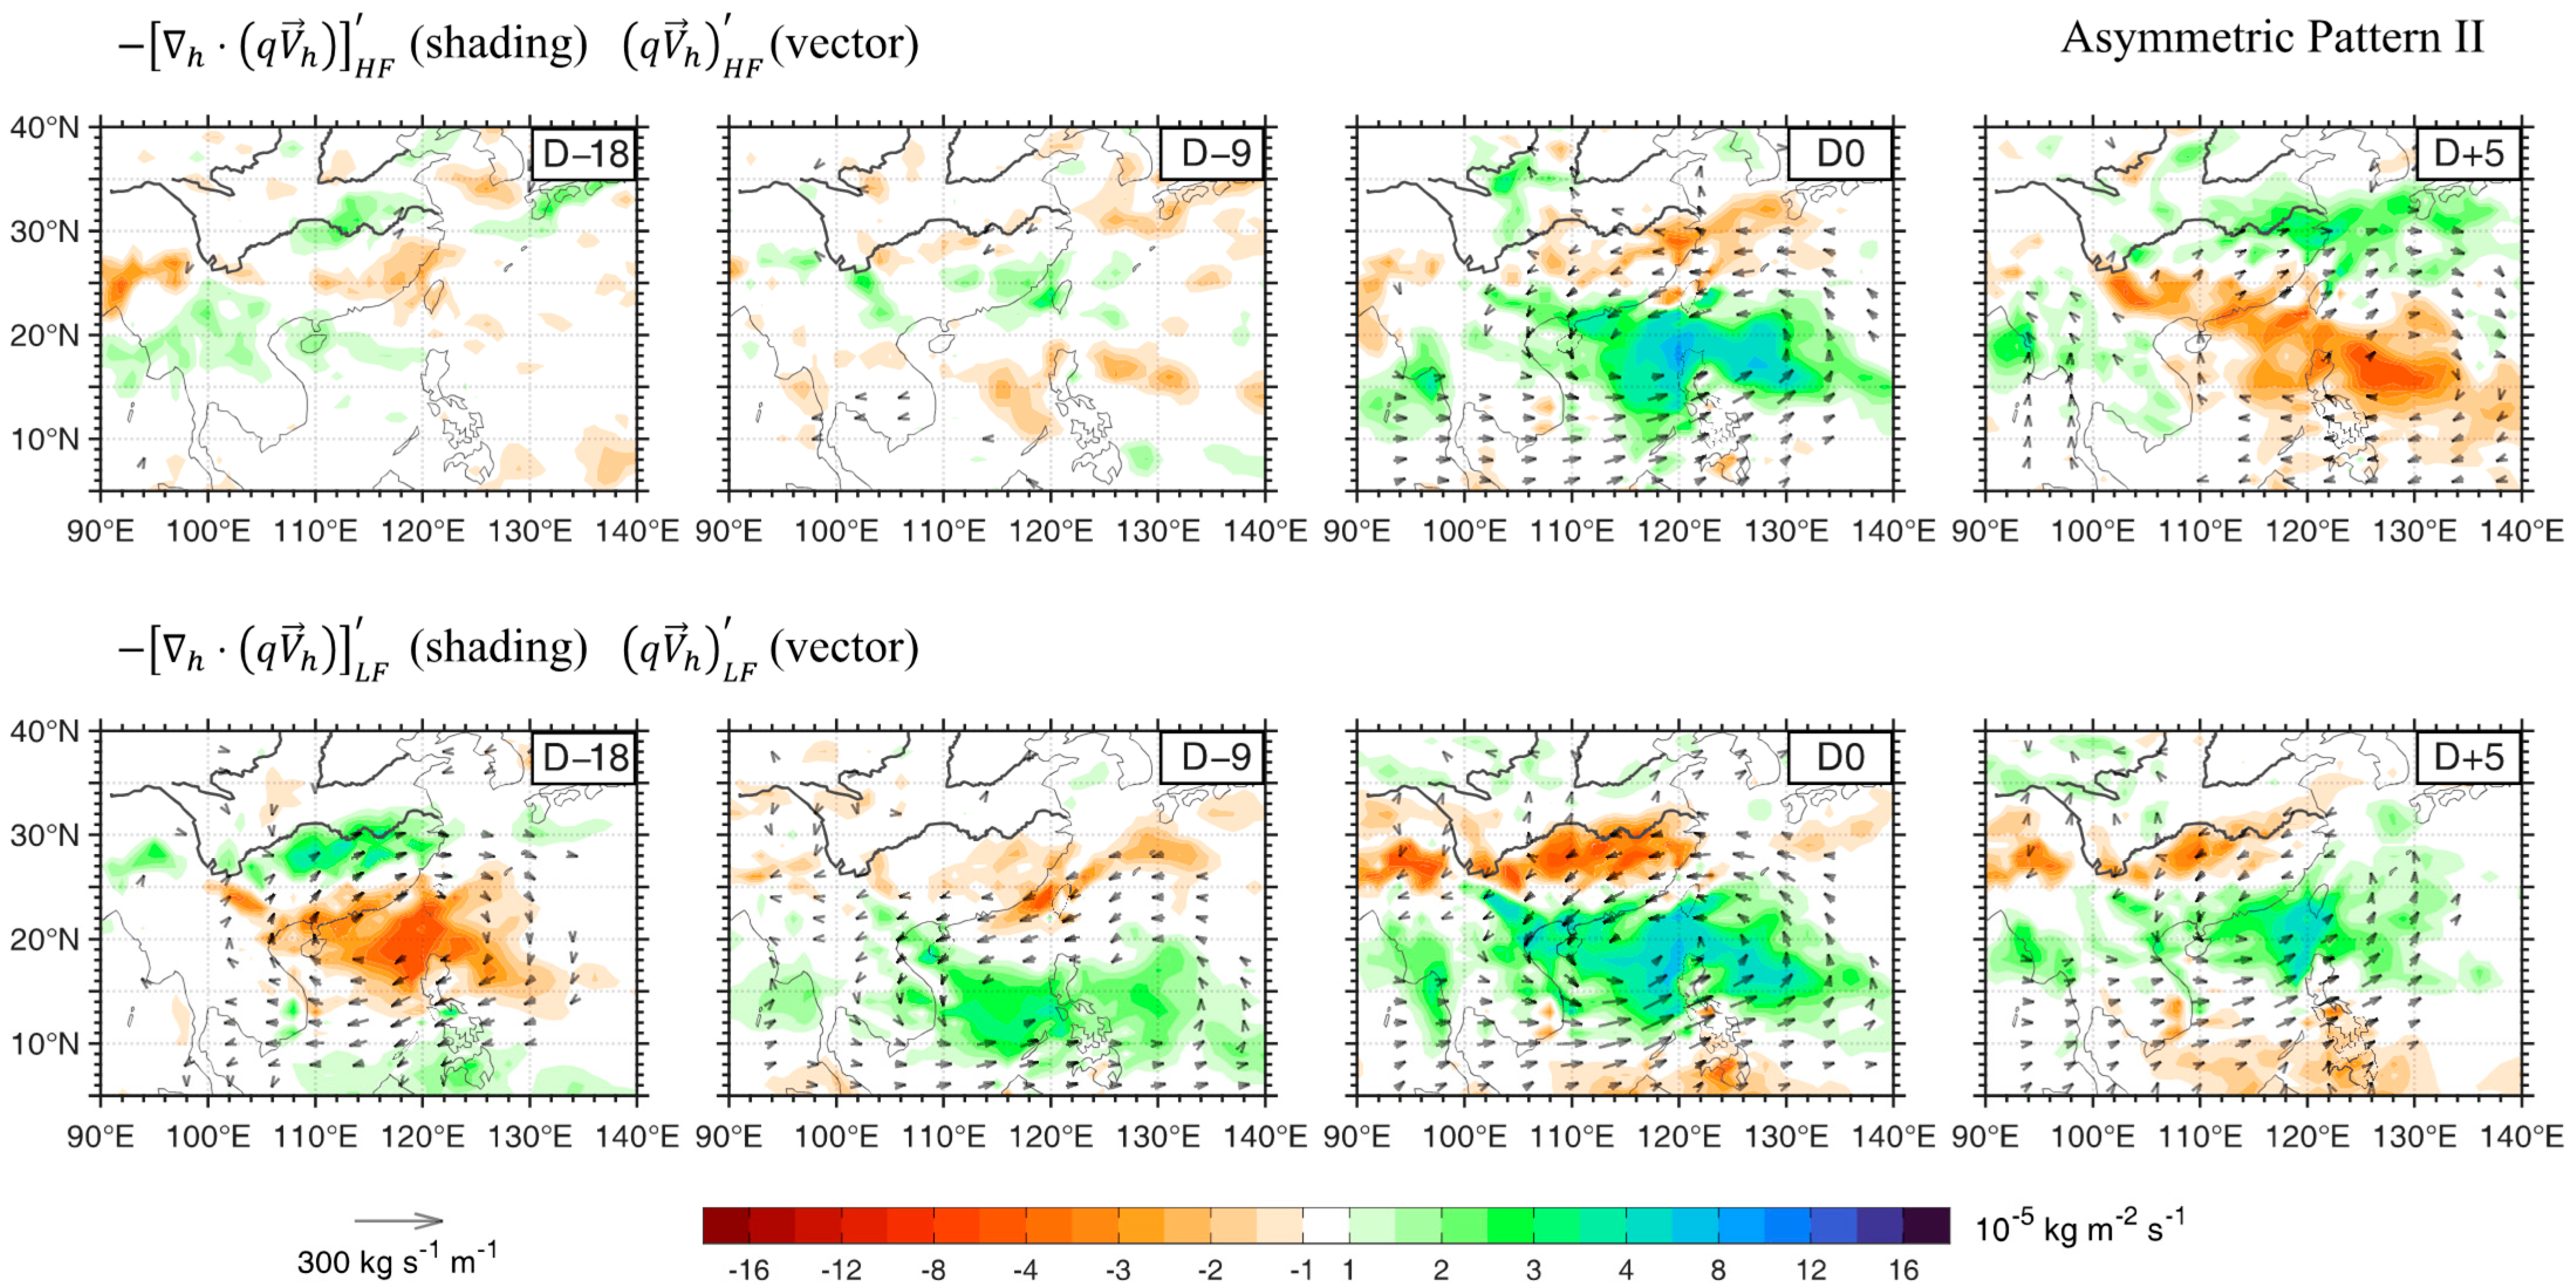
The above-mentioned phase relationships can be understood through the evolution of BSISO convection and the associated low-level moisture transport induced by the accompanying circulation anomalies (
Figure 9,
Figure 10 and
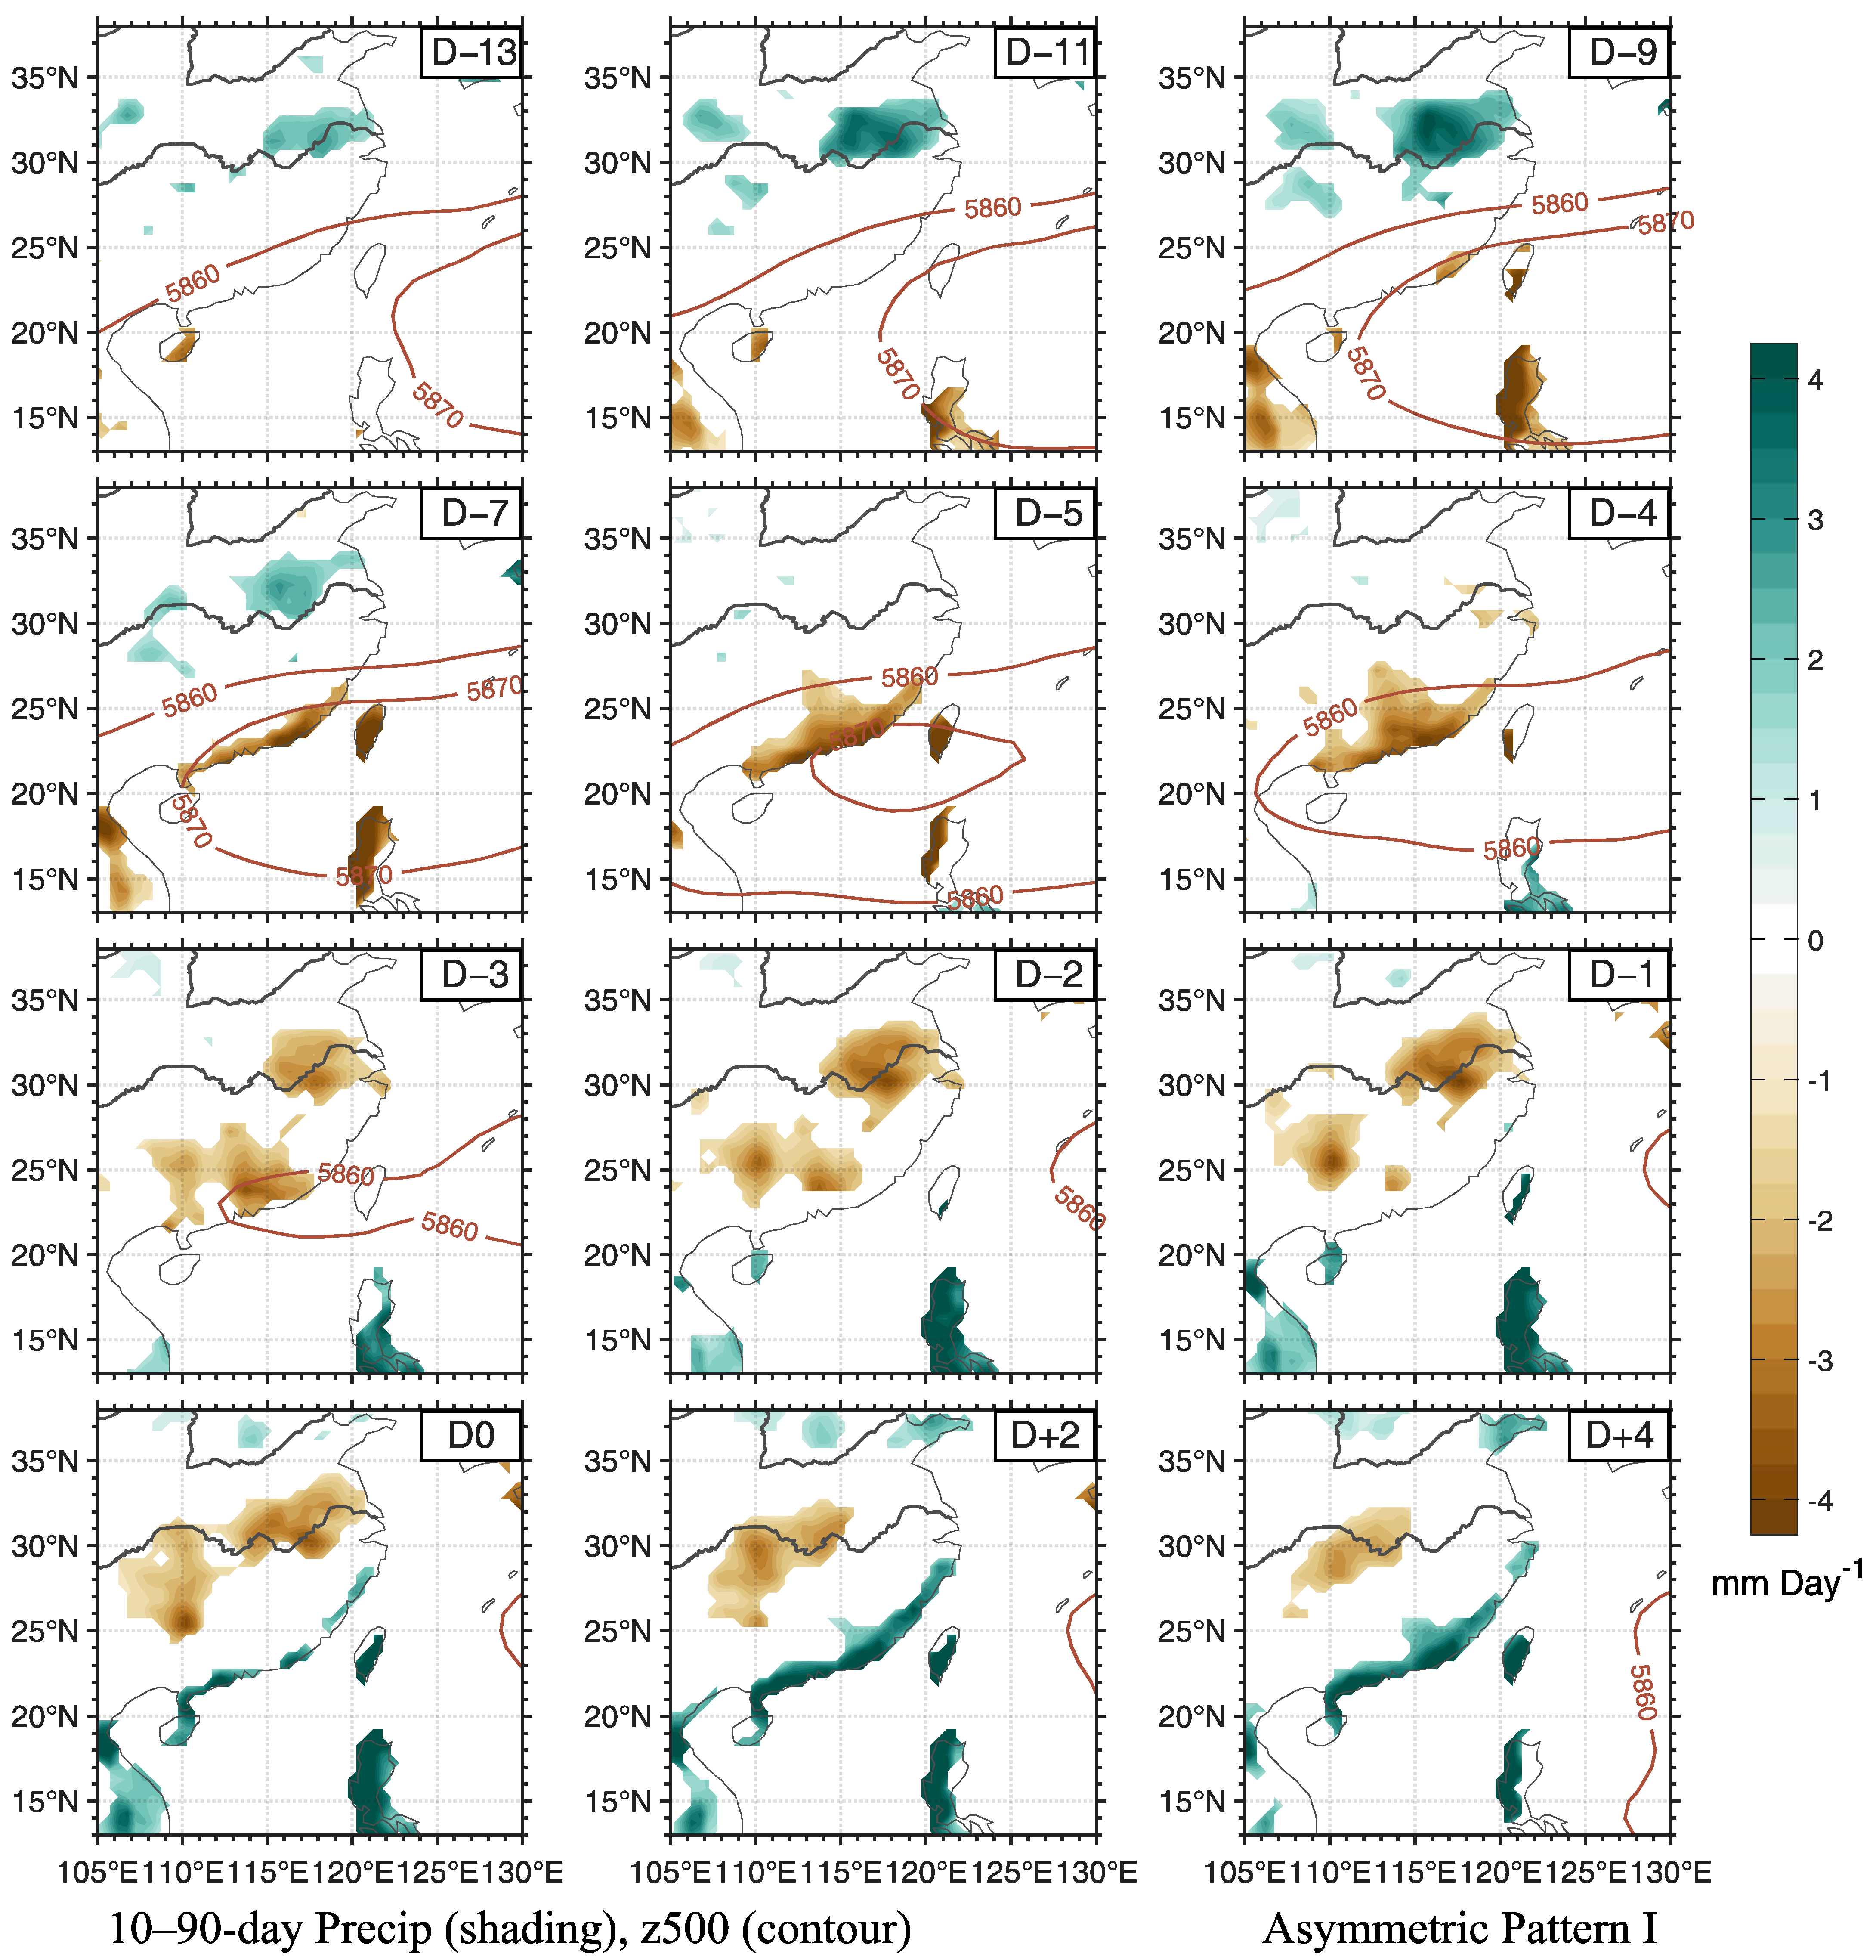
Figure 11). When positive OLR anomalies (suppressed BSISO convection) prevail over the WNP target region, they are accompanied by low-level anticyclonic anomalies that promote a westward extension of the western Pacific subtropical high (WPSH). The extended WPSH covers the SC_Coast and suppresses rainfall there (e.g., upper two rows in
Figure 7). Concurrently, southwesterly anomalies on the northwestern flank of the WPSH transport moisture toward the MLRYR, leading to convergence and enhanced rainfall (e.g.,
Figure 10, Day 8).
Conversely, when negative OLR anomalies (enhanced BSISO convection) dominate the WNP target region, low-level cyclonic anomalies prevail, inducing an eastward retreat of the WPSH. This retreat weakens moisture transport to the MLRYR, resulting in drier conditions there. Meanwhile, the northward-propagating BSISO convection directly influences the SC_Coast, bringing enhanced rainfall (e.g., bottom row in
Figure 7 and
Figure 10, Day 0). The slight lag (about one to two days) of the SC_Coast precipitation peak behind the maximum negative OLR anomaly over the WNP reflects the time needed for the BSISO convection, while centered within the WNP target region, to propagate farther north and fully influence the SC_Coast.
To further diagnose the moisture processes, the low-level moisture flux convergence is decomposed as follows:
where
is the horizontal wind vector,
the specific humidity, and
the horizontal gradient operator. Square brackets denote vertical integration over the 1000–700 hPa layer, and primes indicate 10–90-day bandpass-filtered anomalies. The intraseasonal low-level moisture flux convergence term
can be decomposed into two components: the advection term
, which reflects moisture inhomogeneity, and the convergence term
, which reflects wind-field inhomogeneity. Diagnostic results show that the convergence term plays the dominant role in both the MLRYR and SC_Coast regions (
Figure 5, rows 3 and 5).
Spatially, the patterns of the moisture flux vectors suggest distinct convergence mechanisms between the two regions. Over the MLRYR, convergence is driven primarily by southwesterly moisture transport on the northwestern flank of the WPSH. These southwesterlies weaken rapidly north of the region, leading to wind convergence and moisture accumulation. Over the SC_Coast, convergence results mainly from the direct intrusion of low-level cyclonic circulation anomalies associated with the BSISO convection, which organizes convergent flow and moisture supply.
3.2.3. Distinct Impacts of the Three BSISO Patterns
The precipitation impacts on eastern China exerted by the three WNP BSISO modes identified earlier differ most distinctly in the pace of dry–wet transition processes:
Symmetric Pattern. Dry and wet precipitation anomalies over the MLRYR and SC_Coast alternate rapidly. Each phase is short-lived, persisting only about one pentad. The overall evolution resembles a symmetric, nearly harmonic oscillation.
Asymmetric Pattern I. This mode is distinguished by rapid transitions between prolonged dry and wet precipitation phases. Over the MLRYR, persistent wet conditions (~20 days) are followed by a sharp transition to an equally extended dry phase. Conversely, over the SC_Coast, a prolonged dry phase shifts rapidly to a persistent wet phase. The transition, which involves the disappearance of significant positive anomalies and the emergence of negative ones (or vice versa) in precipitation patterns, typically completes within one pentad (
Figure 7). Correspondingly, the anomalous moisture flux and its convergence during this transition exhibit a strong, in-phase HF signal superimposed on the LF background (
Figure 10), consistent with the rapid convective development of this BSISO pattern over the WNP (
Figure 3).
Asymmetric Pattern II. In contrast to the abrupt transitions of Asymmetric Pattern I, this mode is characterized by gradual dry–wet transitions. An initial prolonged wet (MLRYR) or dry (SC_Coast) phase slowly decays and shifts to the opposite phase over more than 10 days, after which the subsequent phase decays relatively faster (
Figure 8). Correspondingly, the anomalous moisture flux field shows a distinct HF–LF coupling: the HF signal emerges only after the phase shift and tends to oppose the LF anomaly after Day 0, thereby accelerating the decay of the precipitation anomaly (
Figure 11). This moisture flux evolution aligns with the slow development and rapid decay of BSISO convection over the WNP (
Figure 4).
The short-lived Symmetric Pattern (QBWO) is well documented; its shorter time scale and transient dry/wet anomalies pose a lower risk of triggering major, sustained disasters. In contrast, both asymmetric modes produce long-lived precipitation anomalies. Asymmetric Pattern II largely reproduces the eastern China precipitation characteristics typical of LF-BSISO influence: the HF signal is nearly absent in the initial and transition stages, allowing the evolution to adhere to the slower LF rhythm; the HF component emerges only after the phase transition, accelerating the decay of the subsequent anomalous precipitation.
Asymmetric Pattern I warrants special attention. It combines prolonged dry/wet phases with rapid transitions—a configuration that heightens the risk of “drought–flood abrupt alternation” [
39,
40,
41], a phenomenon associated with severe agricultural and infrastructural impacts. The concurrence of persistence and abruptness makes this pattern a potential driver of compound hydrological extremes, underscoring the need for focused research on its dynamics and impacts within the climate community.
4. Discussion
This study systematically investigated the phase asymmetry and associated climatic impacts of the BSISO over the WNP. Our introduction of an objective asymmetry index, combined with life cycle duration, allowed for the classification of WNP BSISO events into three distinct modes: a short-lived Symmetric Pattern and two long-lived asymmetric patterns (Asymmetric Pattern I with rapid development/slow decay, and Asymmetric Pattern II with slow development/rapid decay). This classification moves beyond the conventional linear, symmetric view of BSISO and explicitly captures the robust phase asymmetries arising from interactions between its HF and LF components.
Composite analyses reveal fundamentally different propagation and evolution characteristics among these modes. The Symmetric Pattern resembles the canonical northwestward-propagating HF-BSISO (QBWO). In contrast, the two asymmetric patterns are both rooted in the LF-BSISO but are critically modulated by a transient HF signal. The opposing asymmetries are determined by the timing of this HF-LF coupling: early coupling accelerates the development phase (Pattern I), whereas late coupling accelerates the decay phase (Pattern II). This mechanistic insight advances the understanding of diversity in BSISO evolution beyond the descriptions provided by nonlinear statistical methods alone.
The impacts of these modes on eastern China precipitation are equally distinct, governed by a consistent large-scale circulation framework centered on the WPSH and its modulation of low-level moisture transport and convergence. This framework establishes an anti-phase relationship between precipitation anomalies in the MLRYR and SC_Coast. While the Symmetric Pattern induces rapidly alternating, short-lived dry/wet anomalies, both asymmetric modes generate prolonged precipitation anomalies. Crucially, the pace of dry–wet transitions differs markedly: Asymmetric Pattern I exhibits abrupt transitions between long-lasting phases, whereas Asymmetric Pattern II undergoes gradual shifts.
The Asymmetric Pattern I merits special emphasis due to its high-impact characteristics. Its combination of prolonged precipitation anomalies and abrupt transitions heightens the risk of “drought–flood abrupt alternation,” a phenomenon linked to severe socio-economic impacts. Notably, this pattern—characterized by long-lasting wet conditions over the MLRYR followed by a rapid switch to drought—aligns with the long-period BSISO events recently documented by Li et al. [
15]. Building on that recognition, the present study further reveals that such long-period BSISO events are not a single, uniform type but consist of at least two distinct asymmetric modes (Patterns I and II). This distinction is essential. It connects different BSISO phase mechanisms to specific climate impacts, clarifying why only certain long-period events result in sudden natural disasters.
This work highlights that the phase asymmetry of WNP BSISO is not simply a statistical artifact but has clear and varied impacts on regional climate. The asymmetric modes identified in this study are empirically derived from observed phase evolution characteristics. As such, they do not necessarily have a one-to-one correspondence with specific, isolated dynamical mechanisms. Extracting clear dynamical meaning from such empirical classifications requires careful interpretation, acknowledging that random interference between signals at different timescales could contribute to individual events. Nevertheless, the robust composite structures and distinct regional impacts presented in
Section 3 demonstrate that these modes represent recurrent and systematic configurations of the BSISO system. The objective classification method introduced here offers a practical tool for analyzing this complexity in both models and observations.
Future work will need to focus on the formation mechanisms of the identified asymmetric modes, which likely involve two types of drivers. The first is systematic physical forcing, requiring a deeper investigation into specific nonlinear air–sea interaction processes and the modulating role of background states such as sea surface temperature. The second potential driver is stochastic coupling between high- and low-frequency signals. A crucial step is to develop methods to disentangle and separately analyze events dominated by these different origins. Furthermore, evaluating how well current models simulate and forecast these distinct BSISO types remains a critical task for improving subseasonal prediction skill in East Asia. Ultimately, developing real-time algorithms to classify evolving BSISO events based on this framework is essential for translating these research insights into actionable guidance for operational forecasting. A clearer mechanistic understanding combined with such practical tools will significantly enhance our ability to anticipate and manage subseasonal climate risks in the region.
5. Conclusions
By applying an objective classification based on phase asymmetry and life cycle duration, this study identifies three distinct evolution modes of the boreal summer intraseasonal oscillation over the western North Pacific: a canonical symmetric mode and two asymmetric modes with opposite development–decay asymmetries.
The core findings are: (1) The asymmetry is mechanistically driven by the timing of a transient high-frequency signal’s coupling with the low-frequency BSISO background. (2) These modes exert fundamentally different influences on summer precipitation over eastern China, primarily through the modulation of the western Pacific subtropical high and associated moisture processes. (3) Most notably, Asymmetric Pattern I, characterized by rapid development and slow decay, poses a heightened risk of drought–flood abrupt alternation due to its combination of persistent and abruptly terminating precipitation anomalies.
This study provides a refined physical framework by objectively classifying asymmetric BSISO modes. By linking evolutionary pathways to regional impacts, it offers key insights for predicting subseasonal climate extremes in East Asia. In practice, this framework can help forecasters by providing a possible early signal for high-impact events, such as drought–flood abrupt alternation. The asymmetry index and classification method we introduce also offer a way to check how well climate models can simulate the different BSISO types. These steps are important for improving early warnings and risk management.
Author Contributions
Conceptualization and methodology, T.W.; software and visualization, S.Z., P.Q. and D.W.; writing—original draft preparation, T.W.; writing—review and editing, Y.T. All authors have read and agreed to the published version of the manuscript.
Funding
This research was funded by the National Natural Science Foundation of China (Grant No. 42576019) and the Zhejiang Provincial College Student Science and Technology Innovation Plan (Xinmiao Talent Program) (Grant No. 2025R411A002).
Institutional Review Board Statement
Not applicable.
Informed Consent Statement
Not applicable.
Data Availability Statement
Acknowledgments
During the preparation of this manuscript, the authors used DeepSeek,
https://www.deepseek.com/en/ accessed on 21 January 2026, (by deepseek.ai) for the purposes of text refinement. The authors have reviewed and edited the output and take full responsibility for the content of this publication.
Conflicts of Interest
The authors declare no conflicts of interest. The funders had no role in the design of the study; in the collection, analyses, or interpretation of data; in the writing of the manuscript; or in the decision to publish the results.
Abbreviations
The following abbreviations are used in this manuscript:
| BSISO | Boreal summer intraseasonal oscillation |
| WNP | western North Pacific |
| MJO | Madden–Julian Oscillation |
| LF | Low-frequency |
| HF | High-frequency |
| EOF | Empirical Orthogonal Function |
| OLR | Outgoing longwave radiation |
| QBWO | Quasi-biweekly oscillation |
| MLRYR | Middle and lower reaches of the Yangtze River |
| SC_Coast | South China coastal area |
| WPSH | western Pacific subtropical high |
References
- Wang, B.; Xie, X. A Model for the Boreal Summer Intraseasonal Oscillation. J. Atmos. Sci. 1997, 54, 72–86. [Google Scholar] [CrossRef]
- Madden, R.A.; Julian, P.R. Detection of a 40–50 Day Oscillation in the Zonal Wind in the Tropical Pacific. J. Atmos. Sci. 1971, 28, 702–708. [Google Scholar] [CrossRef]
- Madden, R.A.; Julian, P.R. Description of Global-Scale Circulation Cells in the Tropics with a 40–50 Day Period. J. Atmos. Sci. 1972, 29, 1109–1123. [Google Scholar] [CrossRef]
- Lee, J.E.Y.; Wang, B.; Wheeler, M.; Fu, X.; Waliser, D.; Kang, I.S. Real-time multivariate indices for the boreal summer intraseasonal oscillation over the Asian summer monsoon region. Clim. Dyn. 2013, 40, 493–509. [Google Scholar] [CrossRef]
- Hsu, H.H.; Weng, C.H. Northwestward Propagation of the Intraseasonal Oscillation in the Western North Pacific during the Boreal Summer: Structure and Mechanism. J. Clim. 2001, 14, 3834–3850. [Google Scholar] [CrossRef]
- Annamalai, H.; Sperber, K.R. Regional Heat Sources and the Active and Break Phases of Boreal Summer Intraseasonal (30–50 Day) Variability. J. Atmos. Sci. 2005, 62, 2726–2748. [Google Scholar] [CrossRef]
- Kikuchi, K.; Wang, B. Global Perspective of the Quasi-Biweekly Oscillation. J. Clim. 2009, 22, 1340–1359. [Google Scholar] [CrossRef]
- Chen, G.; Sui, C.H. Characteristics and origin of quasi-biweekly oscillation over the western North Pacific during boreal summer. J. Geophys. Res. 2010, 115, D14113. [Google Scholar] [CrossRef]
- Kikuchi, K.; Wang, B.; Kajikawa, Y. Bimodal representation of the tropical intraseasonal oscillation. Clim. Dyn. 2012, 38, 1989–2000. [Google Scholar] [CrossRef]
- Wang, T.; Yang, X.Q.; Fang, J.; Sun, X.; Ren, X. Role of Air–Sea Interaction in the 30–60-Day Boreal Summer Intraseasonal Oscillation over the Western North Pacific. J. Clim. 2018, 31, 1653–1680. [Google Scholar] [CrossRef]
- Oettli, P.; Tozuka, T.; Izumo, T.; Engelbrecht, F.; Yamagata, T. The self-organizing map, a new approach to apprehend the Madden–Julian Oscillation influence on the intraseasonal variability of rainfall in the southern African region. Clim. Dyn. 2014, 43, 1557–1573. [Google Scholar] [CrossRef]
- Chattopadhyay, R.; Vintzileos, A.; Zhang, C. A Description of the Madden–Julian Oscillation Based on a Self-Organizing Map. J. Clim. 2013, 26, 1716–1732. [Google Scholar] [CrossRef]
- Wang, L.; Li, T. Reexamining the MJO Moisture Mode Theories with Normalized Phase Evolutions. J. Clim. 2020, 33, 8523–8536. [Google Scholar] [CrossRef]
- Chu, J.E.; Wang, B.; Lee, J.E.Y.; Ha, K.J. Boreal Summer Intraseasonal Phases Identified by Nonlinear Multivariate Empirical Orthogonal Function–Based Self-Organizing Map (ESOM) Analysis. J. Clim. 2017, 30, 3513–3528. [Google Scholar] [CrossRef]
- Li, W.; Yang, X.Q.; Fang, J.; Tao, L.; Sun, X. Asymmetric Boreal Summer Intraseasonal Oscillation Events over the Western North Pacific and Their Impacts on East Asian Precipitation. J. Clim. 2023, 36, 2645–2661. [Google Scholar] [CrossRef]
- Hsu, P.C.; Lee, J.E.Y.; Ha, K.J. Influence of boreal summer intraseasonal oscillation on rainfall extremes in southern China. Int. J. Climatol. 2016, 36, 1403–1412. [Google Scholar] [CrossRef]
- Hsu, P.C.; Lee, J.E.Y.; Ha, K.J.; Tsou, C.H. Influences of Boreal Summer Intraseasonal Oscillation on Heat Waves in Monsoon Asia. J. Clim. 2017, 30, 7191–7211. [Google Scholar] [CrossRef]
- Chen, Y.; Zhai, P. Simultaneous modulations of precipitation and temperature extremes in Southern parts of China by the boreal summer intraseasonal oscillation. Clim. Dyn. 2017, 49, 3363–3381. [Google Scholar] [CrossRef]
- Lee, S.S.; Moon, J.Y.; Wang, B.; Kim, H.E.J. Subseasonal Prediction of Extreme Precipitation over Asia: Boreal Summer Intraseasonal Oscillation Perspective. J. Clim. 2017, 30, 2849–2865. [Google Scholar] [CrossRef]
- Ren, P.; Ren, H.L.; Fu, J.X.; Wu, J.; Du, L. Impact of Boreal Summer Intraseasonal Oscillation on Rainfall Extremes in Southeastern China and its Predictability in CFSv2. J. Geophys. Res.-Atmos. 2018, 123, 4423–4442. [Google Scholar] [CrossRef]
- Diao, Y.; Li, T.; Hsu, P.C. Influence of the Boreal Summer Intraseasonal Oscillation on Extreme Temperature Events in the Northern Hemisphere. J. Meteorol. Res. 2018, 32, 534–547. [Google Scholar] [CrossRef]
- Muhammad, F.R.; Lubis, S.W. Impacts of the boreal summer intraseasonal oscillation on precipitation extremes in Indonesia. Int. J. Climatol. 2023, 43, 1576–1592. [Google Scholar] [CrossRef]
- Hao, L.; Li, T.; Zhang, L.; Ma, N. Influence of boreal summer intraseasonal oscillation on summer precipitation in North China. Int. J. Climatol. 2023, 43, 4816–4834. [Google Scholar] [CrossRef]
- Xavier, P.; Diong, J.Y.; Bin Abdullah, M.F.A.; Permana, D.; Pura, A.; Lam, H. The influence of boreal summer intraseasonal oscillations on precipitation extremes and their characteristics in Southeast Asia. NPJ Clim. Atmos. Sci. 2024, 7, 112. [Google Scholar] [CrossRef]
- Pan, H.; Ren, H.L.; Ma, J.; Wang, Y. Contrasting northward and southward propagations of intraseasonal precipitation under the southern China summer rainfall pattern. Atmos. Res. 2025, 314, 107808. [Google Scholar] [CrossRef]
- Jung, Y.O.R.; Lee, W.O.S. Influence of the boreal summer intraseasonal oscillation on temperature and precipitation in South Korea. Atmos. Sci. Lett. 2025, 26, e1282. [Google Scholar] [CrossRef]
- Wang, H.; Liu, F.; Wang, B.; Chen, G.; Dong, W. Diversity of intraseasonal oscillation over the western North Pacific. Clim. Dyn. 2021, 57, 1881–1893. [Google Scholar] [CrossRef]
- Chen, G.; Wang, B. Diversity of the Boreal Summer Intraseasonal Oscillation. J. Geophys. Res.-Atmos. 2021, 126, e2020JD034137. [Google Scholar] [CrossRef]
- Wang, T.; Wang, B. Diversity of High-Frequency (10–25-Day) Boreal Summer Intraseasonal Oscillation over the Western North Pacific. J. Clim. 2024, 37, 6841–6862. [Google Scholar] [CrossRef]
- Liebmann, B.; Smith, C.A. Description of a Complete (Interpolated) Outgoing Longwave Radiation Dataset. Bull. Amer. Meteorol. Soc. 1996, 77, 1275–1277. [Google Scholar]
- Hersbach, H.; Bell, B.; Berrisford, P.; Hirahara, S.; Horányi, A.; Muñoz-Sabater, J.; Nicolas, J.; Peubey, C.; Radu, R.; Schepers, D.; et al. The ERA5 global reanalysis. Q. J. R. Meteorol. Soc. 2020, 146, 1999–2049. [Google Scholar] [CrossRef]
- Xie, P.; Chen, M.; Yang, S.; Yatagai, A.; Hayasaka, T.; Fukushima, Y.; Liu, C. A Gauge-Based Analysis of Daily Precipitation over East Asia. J. Hydrometeorol. 2007, 8, 607–626. [Google Scholar] [CrossRef]
- Duchon, C.E. Lanczos Filtering in One and Two Dimensions. J. Appl. Meteorol. 1979, 18, 1016–1022. [Google Scholar] [CrossRef]
- Kaufman, L.; Rousseeuw, P.J. Finding Groups in Data: An Introduction to Cluster Analysis; John Wiley & Sons: Hoboken, NJ, USA, 2009. [Google Scholar]
- Wilks, D.S. Chapter 16—Cluster Analysis. In Statistical Methods in the Atmospheric Sciences, 4th ed.; Wilks, D.S., Ed.; Elsevier: Amsterdam, The Netherlands, 2019; pp. 721–738. [Google Scholar]
- Chen, T.C.; Chen, J.M. The 10–20-Day Mode of the 1979 Indian Monsoon: Its Relation with the Time Variation of Monsoon Rainfall. Mon. Weather Rev. 1993, 121, 2465–2482. [Google Scholar] [CrossRef]
- Fukutomi, Y.; Yasunari, T. 10–25 day Intraseasonal Variations of Convection and Circulation over East Asia and Western North Pacific during Early Summer. J. Meteorol. Soc. Jpn. 1999, 77, 753–769. [Google Scholar] [CrossRef]
- Wang, B.; Huang, F.; Wu, Z.; Yang, J.; Fu, X.; Kikuchi, K. Multi-scale climate variability of the South China Sea monsoon: A review. Dyn. Atmos. Oceans 2009, 47, 15–37. [Google Scholar] [CrossRef]
- Hu, G.; Xu, K.; Ge, F.; Huang, Q.L.; Leung, J.C.H.; Jin, Z.; Wang, P. Diversity of the Drought–Flood Abrupt Alternation: Dynamic Processes during the Preflood Season over South China. J. Clim. 2025, 38, 6227–6243. [Google Scholar] [CrossRef]
- Duan, J.; Yang, N.; Yue, Y.; Jiao, Y.; Wu, B.; Li, H. Investigating the Mechanisms of Hydrological Impact due to Drought–Flood Abrupt Alternation in the Upper Hanjiang River Basin, China. J. Hydrometeorol. 2025, 26, 1493–1509. [Google Scholar] [CrossRef]
- Tang, R.; Yuan, S.; Qin, T.; Yuan, Z.; Liu, Y.; Jin, J.; Zhu, L.; Xu, B.; Tian, S.; Ji, F.; et al. North–South Opposition of Drought–Flood Abrupt Alteration in the Middle and Lower Reaches of Yangtze River Basin. J. Hydrometeorol. 2026, 27, 17–34. [Google Scholar] [CrossRef]
| Disclaimer/Publisher’s Note: The statements, opinions and data contained in all publications are solely those of the individual author(s) and contributor(s) and not of MDPI and/or the editor(s). MDPI and/or the editor(s) disclaim responsibility for any injury to people or property resulting from any ideas, methods, instructions or products referred to in the content. |