1. Introduction
The climate regulation of aerosols encompasses both direct and indirect effects, which collectively influence the Earth’s radiation balance and hydrological cycle [
1,
2]. The direct effect modulates the surface–atmosphere energy balance by scattering and absorbing shortwave radiation, with sulfate and other aerosols commonly exerting a net cooling impact [
3]. Indirect effects operate through modifications to cloud droplet number concentration and microphysics, influencing cloud droplet spectra, cloud albedo, cloud lifetime, and precipitation efficiency, thus altering regional energy and water cycles [
4,
5]. In Asia, the summer monsoon—driven by land–sea thermal contrasts—is highly sensitive to the coupling between radiation and clouds. Aerosol–radiation–cloud interactions are widely regarded as capable of altering monsoon intensity, precipitation distribution, and regional energy and water cycles [
6,
7]. Under a warming climate, shifts in regional emission structures further modify aerosol climate responses, changing the response patterns and local climate states of the East Asia–South Asia summer monsoon [
8]. Understanding these processes is scientifically important and has practical relevance for anticipating future regional climate changes and extreme precipitation.
Evidence from global and regional studies shows that pollution controls reducing sulfate and other aerosol emissions weaken direct radiative forcing [
9], while indirect effects exhibit regional differences in cloud and precipitation responses [
10]; the East Asia–South Asia region in particular displays pronounced and spatially varying responses [
11,
12]. Indirect effects operate mainly via changes to cloud formation and properties. Aerosols act as cloud condensation nuclei, promoting more numerous clouds and enhanced cloud albedo, potentially prolonging cloud lifetimes. They can also suppress precipitation, yielding more persistent cloudiness and complex climate implications. In East Asia, reduced aerosol emissions coupled with rising emissions in South Asia contribute to an anomalous regional radiative forcing, producing notable nonuniform warming across Asia’s monsoon zone and underscoring the importance of regional aerosol emission patterns for monsoon dynamics. Future scenarios will modify regional radiation fields and aerosol distributions, thereby affecting cloud microphysics, precipitation patterns, and monsoon strength in space and time [
13]. Although extensive work has illuminated potential aerosol–cloud–precipitation coupling mechanisms [
14,
15], uncertainties persist under global warming, owing to enhanced climate system thermodynamics and faster energy and water cycles [
16,
17]. Quantifying regional cloud microphysics controls on precipitation efficiency and the pathways by which spatial aerosol heterogeneity propagates through multi-scale feedbacks to the monsoon remains a priority for multi-model synthesis.
This study uses the latest version of the Community Earth System Model (CESM2) and conducts three sets of comparative experiments—historical (HIST), Shared Socioeconomic Pathway 1–2.6 (SSP1–2.6, strong mitigation), and Shared Socioeconomic Pathway 5–8.5 (SSP5–8.5, high-emission)—to systematically investigate the spatiotemporal evolution of aerosol–radiation–cloud coupling processes over East Asia–South Asia and their impacts on regional climate, with particular focus on the key monsoon regions encompassing China and India. The overarching hypothesis of this study is that regional differences in anthropogenic aerosol emissions, particularly sulfate aerosols, will exert significant and nonlinear influences on the radiation–cloud–climate system of the East Asia–South Asia summer monsoon region. Through the combined effects of direct radiative forcing and indirect modulation of cloud properties, these coupled processes are expected to result in spatially heterogeneous changes in regional temperature and precipitation patterns. More specifically, the following core scientific hypotheses are proposed: (1) sulfate aerosol concentrations will substantially alter shortwave direct radiation over East Asia, while adjustments in cloud macro- and microphysical properties play a critical moderating role, such that the net effect of these processes on the radiation budget may exceed that of direct effects alone; (2) the integrated outcome of these processes will trigger nonlinear multi-scale feedbacks that significantly shape the regional differentiation and long-term evolution of the monsoon system under future warming conditions.
Compared with existing studies on aerosol impacts in the Asian monsoon region, the main innovations of this work are as follows: it applies CESM2 to systematically decompose the direct and indirect aerosol effects over East Asia–South Asia, a region that is both densely populated and highly climate-sensitive; it evaluates the magnitude and uncertainty range of climate responses under two contrasting future emission pathways, SSP1–2.6 (substantial emission reductions) and SSP5–8.5 (high emissions); it provides an in-depth analysis of the key role played by cloud macrophysical properties (cloud fraction, cloud-top height) and microphysical characteristics (cloud droplet number concentration, liquid water path, effective radius) in modulating aerosol-induced perturbations; it examines the mechanisms linking the regional emission dipole structure—characterized by marked emission reductions in East Asia versus sustained or increasing emissions in South Asia—to cross-regional nonlinear monsoon responses; and it elucidates the complete coupled chain from emission changes to cloud adjustments and subsequently to large-scale circulation changes through multi-scale feedback analysis.
2. Materials and Methods
2.1. Mode and Experimental Setup
The Community Earth System Model version 2 (CESM2), developed by the National Center for Atmospheric Research (NCAR, Boulder, CO, USA), is designed for coupled simulations of the Earth’s climate system. From a scientific and technical standpoint, CESM2 offers multiple configuration options. Users can tailor the states and resolutions of its component models by selecting specific physics schemes and parameterizations and by coupling different sub-ensembles to meet experimental needs, providing considerable flexibility [
18,
19]. A large body of prior work has evaluated its performance for atmospheric processes and aerosol-related climate effects [
20,
21,
22].
In this study, we use CESM2 to perform land–atmosphere coupling simulations. The CAM6 module incorporates the following key parameterizations: MG2 cloud microphysics [
23], CLUBB turbulence scheme [
24], and MAM4 aerosol generation and evolution [
25]. The ocean component is driven by observed sea surface temperatures. CAM6’s standard horizontal resolution is 1.25° × 0.9°, with 32 vertical levels and a model top at about 2.26 hPa (roughly 40 km).
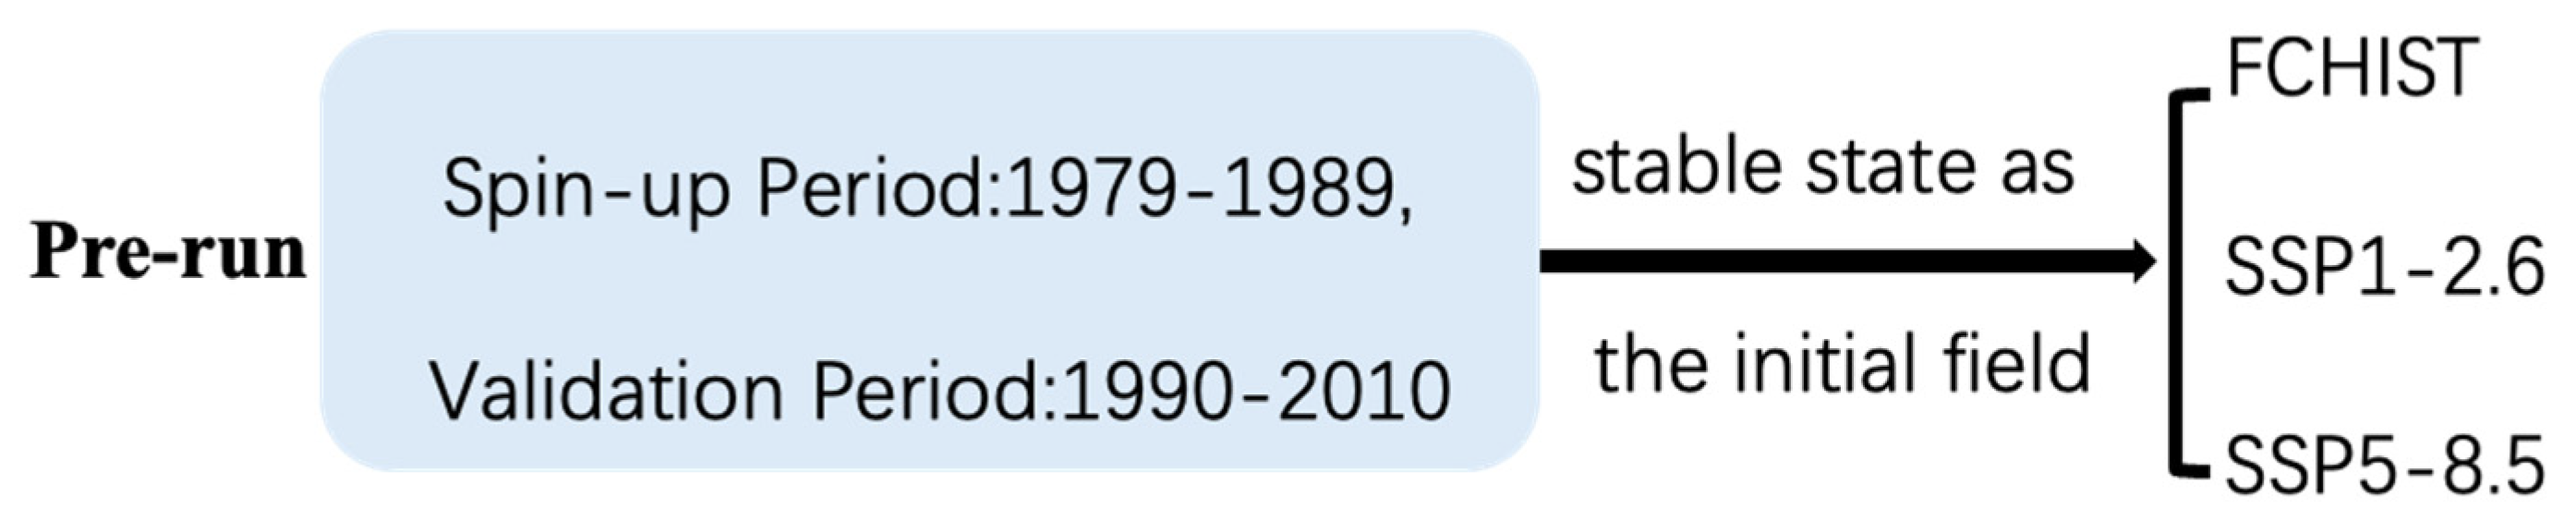
To validate the model’s accuracy, a pre-run (Pre_run) was conducted. The Pre_run spans 1979–2010, with the first 12 years treated as spin-up to allow the system to approach dynamic balance under the prescribed forcing. The 1990–2010 portion of the Pre_run is then compared against reanalysis data to assess the model’s ability to reproduce key meteorological fields. Statistics such as correlation coefficients and root mean square error are computed to quantify agreement between the simulations and the reanalysis. The stable state achieved in the Pre_run serves as the initial field for the three experimental runs in this study (
Figure 1).
The purpose of this experiment is to simulate the dissolved concentration distribution of anthropogenic sulfate in Asia in the early stage of different development scenarios in the future and its impact on the local climate. There are three groups of simulations (
Table 1), in which the anthropogenic emission of SO
2 in HIST is the actual emission from the Regional Emission Inventory in Asia database from 1979 to 2010. SSP1–2.6 and SSP5–8.5 replace the data of anthropogenic emissions of SO
2 with the emission data of SSP1–2.6 and SSP5–8.5 from 2010 to 2040, respectively. The latter two disturbance experiments are different from HIST, which is the response of the climate to sulfate concentration in different scenarios. The specific experimental setups are as follows:
2.2. Emission Data
Historical emissions were drawn from the Regional Emission Inventory in Asia (REAS) database, specifically the REASv3.2.1 emissions inventory. REAS is an Asia-focused emission inventory database that provides detailed emissions for a range of pollutants, including greenhouse gases, aerosols, and other air pollutants [
26]. REASv3.2.1 covers pollutant emissions from 1950 to 2015 for East Asia, Southeast Asia, and South Asia, and includes species such as SO
2, NO
x, CO, NMVOCs, PM
10, PM
2.5, BC, OC, NH
3, and CO
2. Major emission sources comprise power generation, industry, transportation (excluding aviation and shipping), residential fuel combustion, agricultural activities, and other sources. The dataset has a spatial resolution of 0.25° × 0.25° and a temporal resolution of monthly values.
For future simulations, emissions were sourced from CMIP6 (Coupled Model Intercomparison Project Phase 6), an international collaborative initiative intended to advance understanding of climate change through intercomparison of climate model results, supported by the WMO (World Meteorological Organization) and the IPCC (Intergovernmental Panel on Climate Change). Emission inputs for the future runs are taken from CMIP6 ScenarioMIP datasets, specifically SSP1–2.6 and SSP5–8.5 [
27].
3. Results
3.1. Aerosol Load and Radiative Flux Variation Characteristics
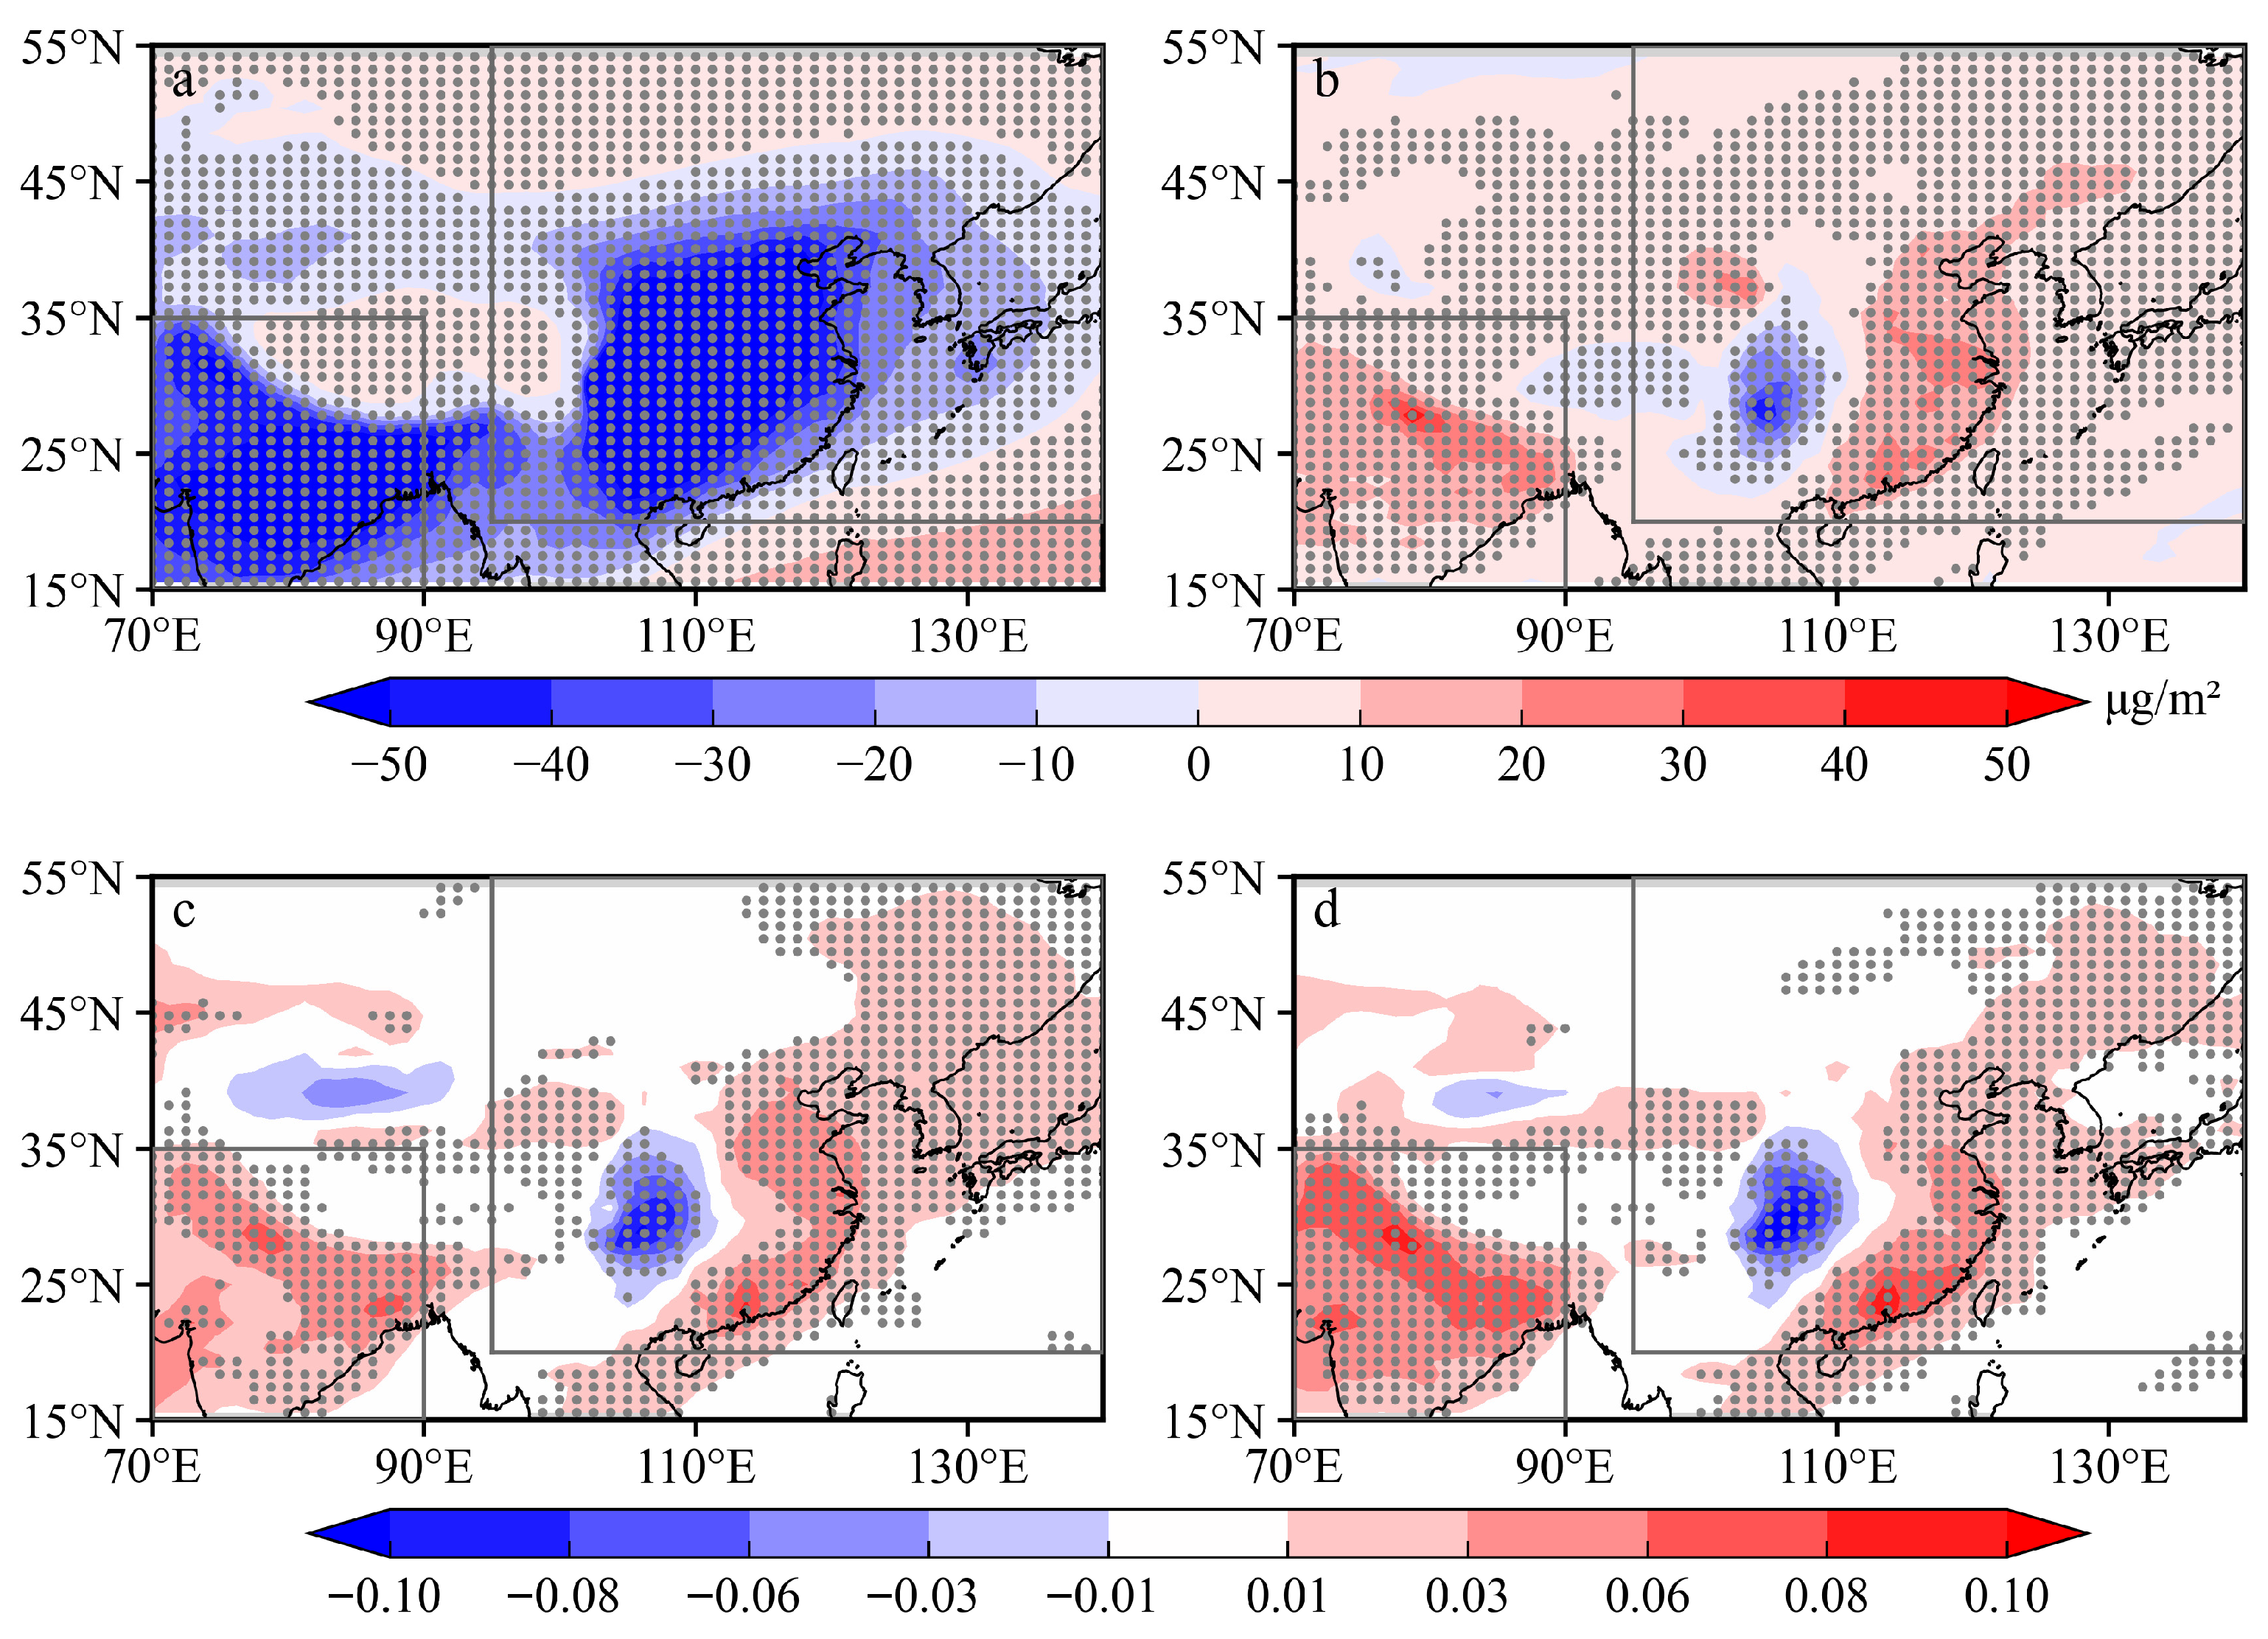
We assess the radiative implications of future aerosol scenarios by differencing the simulations under SSP5–8.5 and SSP1–2.6 from the HIST, focusing on the spatial distribution of sulfate concentration and its direct radiative effect over Asia. The results identify two regions where sulfate changes are most pronounced: East Asia (EA, 95–140° E, 20–55° N) and South Asia (SA, 70–90° E, 15–35° N).
Figure 2a,b show the spatial distribution of sulfate concentration in two scenarios. Under SSP1–2.6 minus HIST, both regions show clear declines in sulfate, reflecting aggressive emission controls under a weaker warming scenario. EA exhibits an average decrease of 18.50 μg/m
2, with a maximum drop of 205.858 μg/m
2. SA shows an average decrease of 36.10 μg/m
2, with a maximum drop of 74.994 μg/m
2. The sulfate concentration in the Qinghai–Tibet Plateau generally shows a slight increase. Under SSP5–8.5 minus HIST, EA shows a regional mean increase of 4.06 μg/m
2, with a pronounced maximum increase of 45.09 μg/m
2 in southwestern China and a rise along the eastern Chinese coastline (maximum 33.36 μg/m
2). SA shows a mean increase of 9.79 μg/m
2 and a coherent across-region rise, with a maximum of 53.19 μg/m
2. These patterns indicate a pronounced and regionally uneven sulfate enhancement in EA–SA under SSP5–8.5.
Figure 2d shows the spatial pattern of aerosol optical depth (AOD) under SSP5–8.5–HIST broadly mirrors the sulfate changes, whereas under SSP1–2.6–HIST (
Figure 2c) the SA region experiences an overall AOD increase (mean ~0.026), the eastern coast of China shows elevated AOD with a maximum of 0.088, and the southwestern region weakens (minimum around −0.107). These results imply that AOD responses do not map one-to-one onto sulfate mass changes and are modulated by regional cloud–radiation fields, surface conditions, and broader atmospheric circulation.
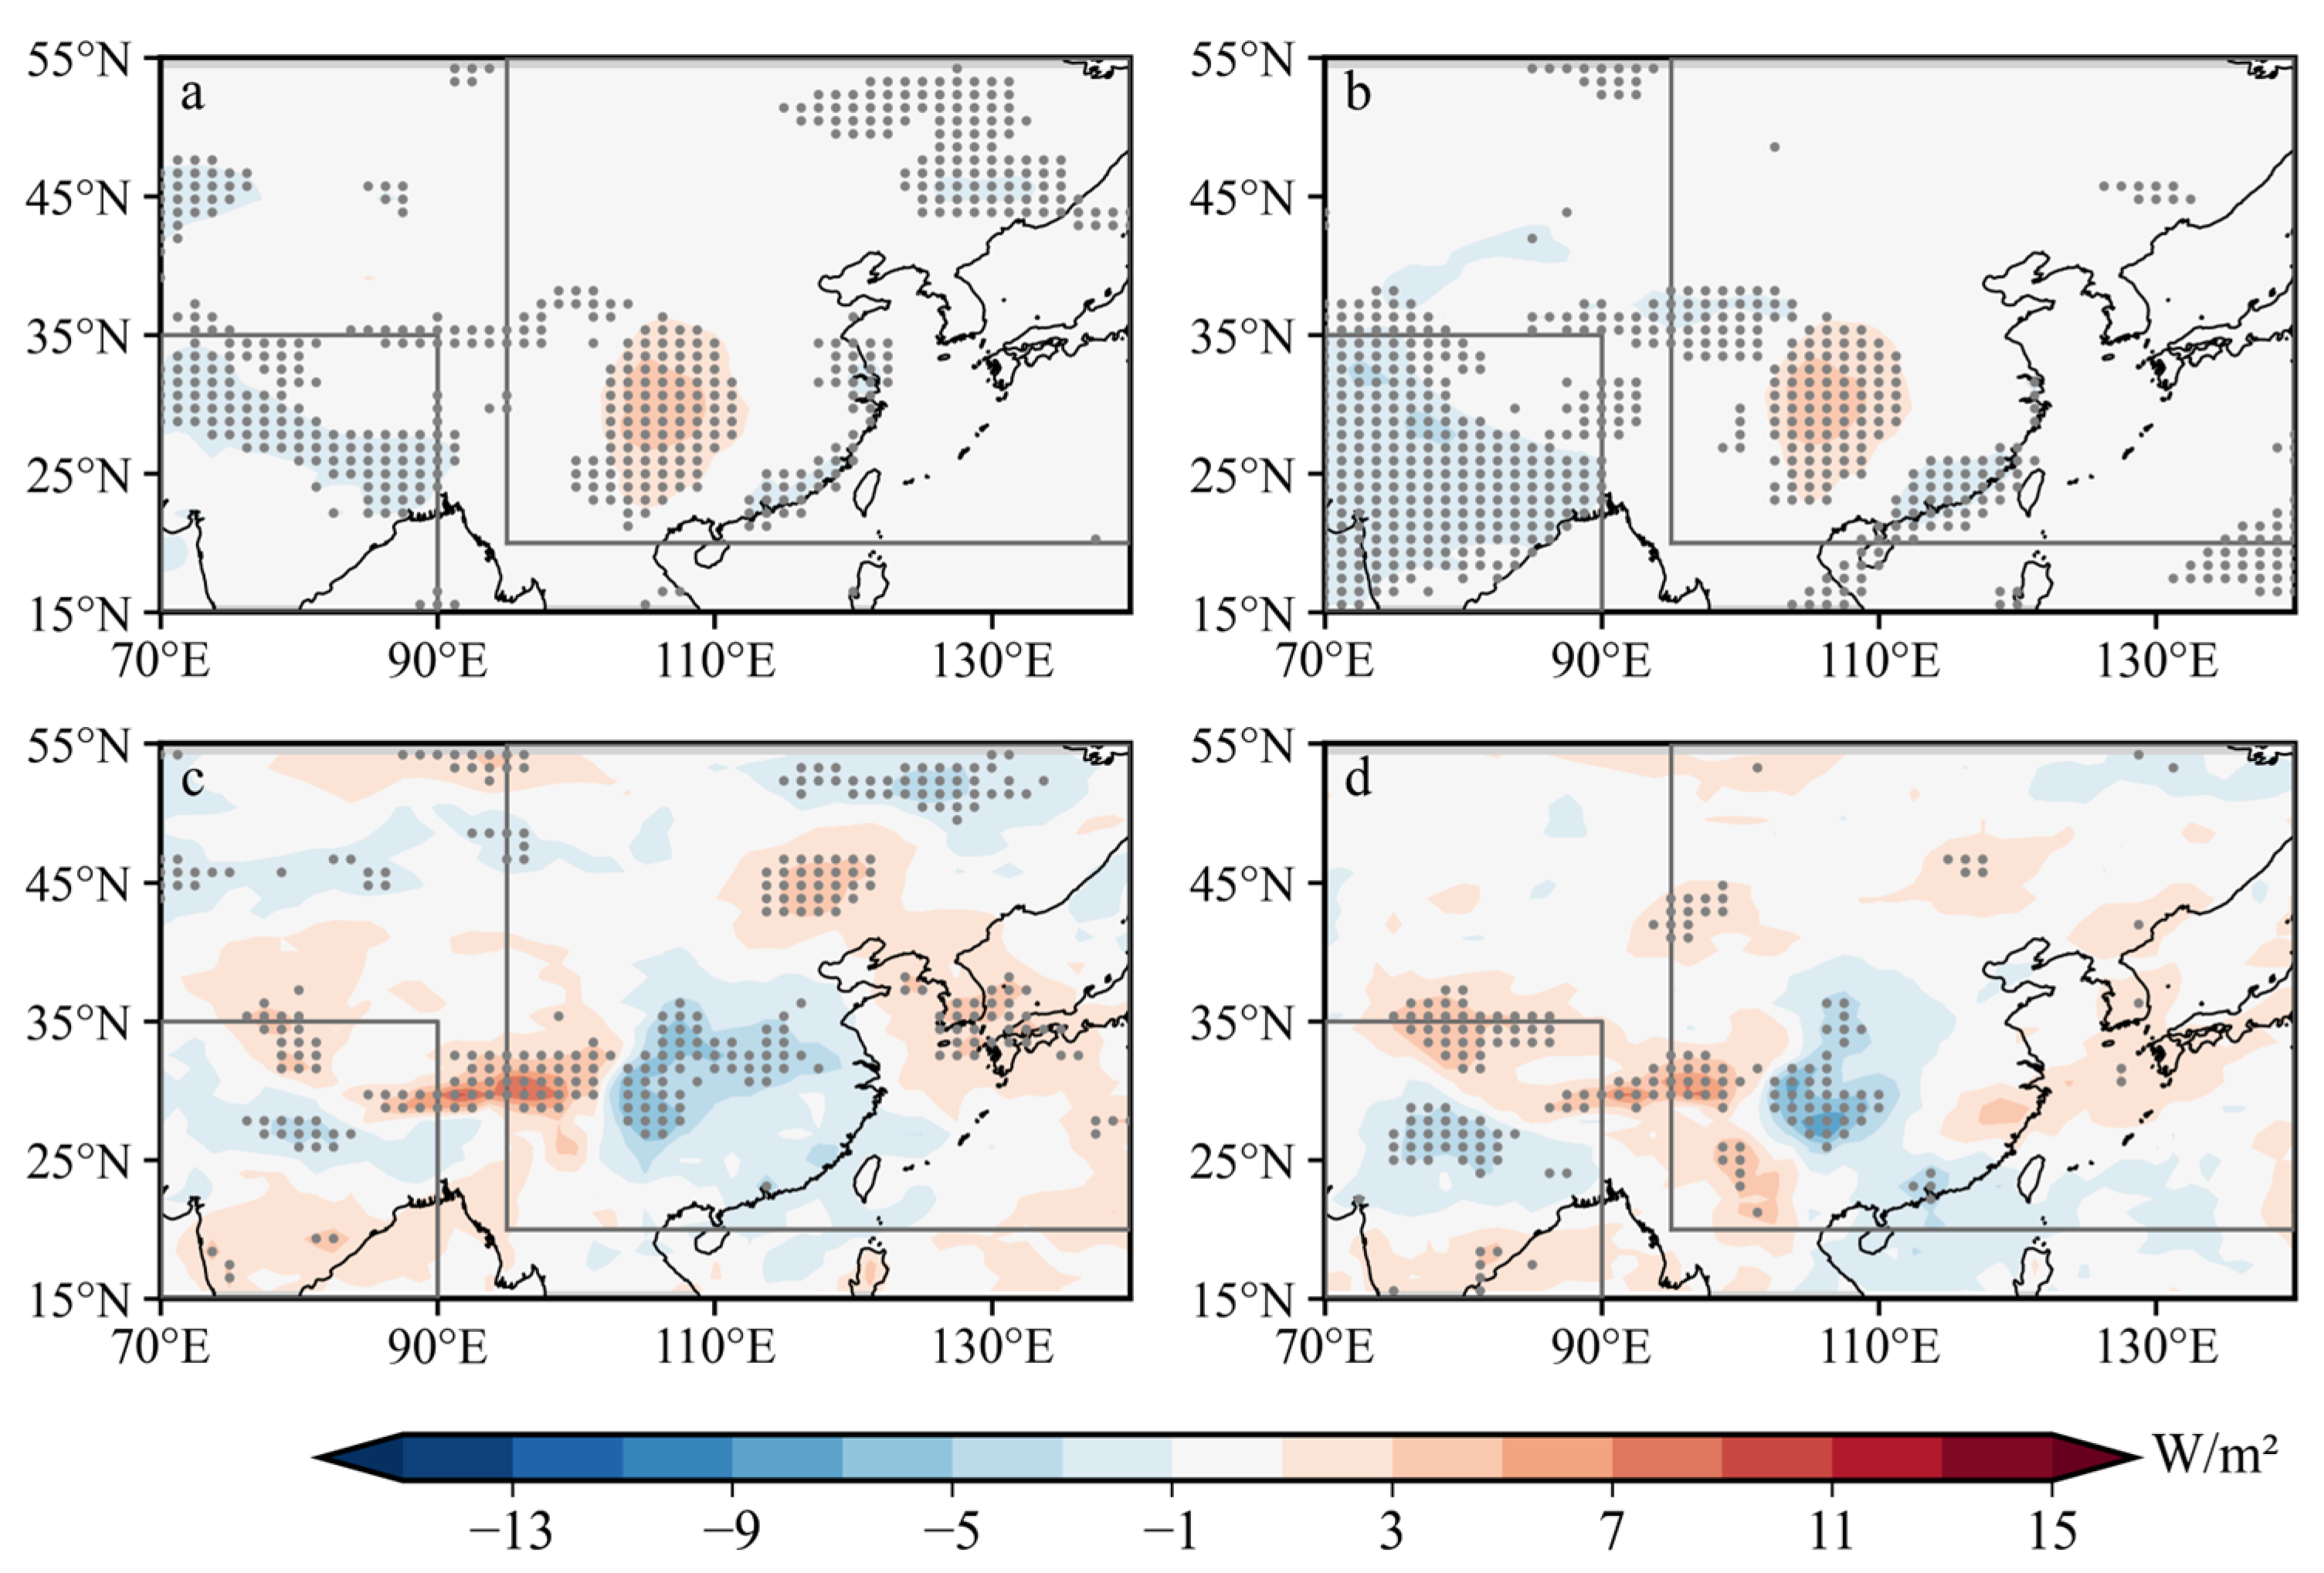
This radiation analysis adopts a coherent decomposition of aerosol effects into direct radiative effect (DRE) and indirect radiative effect (IRE), distinguishing clear-sky (cloud-free) and cloudy conditions to isolate direct sulfate scattering/absorption from cloud–radiation interactions, and it compares EA and SA. The DRE is evaluated from clear-sky differences between future SSP scenarios and HIST (
Figure 3a,b), with shortwave radiation as the dominant driver and robust regional contrasts evident. Under clear skies, EA shows an upward swing in downward surface shortwave radiation, reaching a maximum of about +4.3 W/m
2 (mean +0.05 W/m
2) under SSP5–8.5, whereas EA exhibits suppression, with a maximum of −3.88 W/m
2 (mean −1.30 W/m
2). Under the SSP1–2.6 scenario, the maximum value in EA is 4.29 W/m
2 (mean −0.03 W/m
2), and the minimum value in SA is −2.99 W/m
2 (mean −0.64 W/m
2). Corresponding clear skies surface radiative changes under SSP5–8.5 relative to HIST are modest on average (EA ≈ −0.28 W/m
2, EA ≈ −1.25 W/m
2), and SSP1–2.6 relative to HIST yields similar small mean shifts (EA ≈ −0.38 W/m
2, EA ≈ −0.26 W/m
2). Quantitatively, the pointwise ranges for surface total radiation differences under SSP5–8.5 show EA from −10.14 to +10.79 W/m
2 (mean −0.42 W/m
2) and SA from −5.55 to +16.25 W/m
2 (mean +0.14 W/m
2); under SSP1-2.6, EA ranges from −8.73 to +6.27 W/m
2 (mean −0.65 W/m
2) and EA −6.11 to +13.89 W/m
2 (mean +0.73 W/m
2). Longwave responses under clear skies are comparatively smaller and variable, with regional spreads but near-zero to modest means, indicating a secondary role relative to shortwave in shaping the DRE.
In contrast, the IRE—captured under cloudy conditions—exhibits stronger regional differentiation: in EA, the positive downwelling shortwave under clear skies can flip to negative with clouds (
Figure 3c,d), attaining maxima of about −9.15 W/m
2 (SSP5–8.5) and −7.40 W/m
2 (SSP1–2.6); SA shows a shift from a broadly reduced shortwave under clear skies to a north–south contrast under clouds, with northern suppression and southern enhancement. These patterns demonstrate that regional aerosol–cloud–radiation coupling can amplify or damp the surface radiative response to direct sulfate forcing and that IRE can dominate the total radiative change in certain regions and seasons.
Table 2 lists in detail the maximum, minimum and average values of different radiation of SA and EA in four scenarios. Given the strong influence of clouds on the regional shortwave response, the forthcoming analysis centers on cloud fraction, cloud microphysics, and cloud–radiation coupling to determine whether clouds amplify or offset the direct radiative effects and how the ensuing thermodynamic structure reorganizes in the EA–SA climate under SSP5–8.5 and SSP1–2.6. In addition, the sulfate concentration analysis confirms that AOD responses do not map one-to-one onto sulfate mass changes, because cloud fields, surface conditions, and large-scale circulation modulate the radiative outcome; thus, a systematic DRE–IRE decomposition is essential to attribute the observed regional differences and to interpret the relative importance of direct versus indirect forcing pathways.
3.2. The Effect of Aerosols on Cloud
These cloud radiative and microphysical diagnostics are provided for reference to aid the interpretation of the radiation analysis; they are not intended as definitive quantifications, given known CESM2 cloud biases and the absence of observational benchmarking in the current study. As shown in
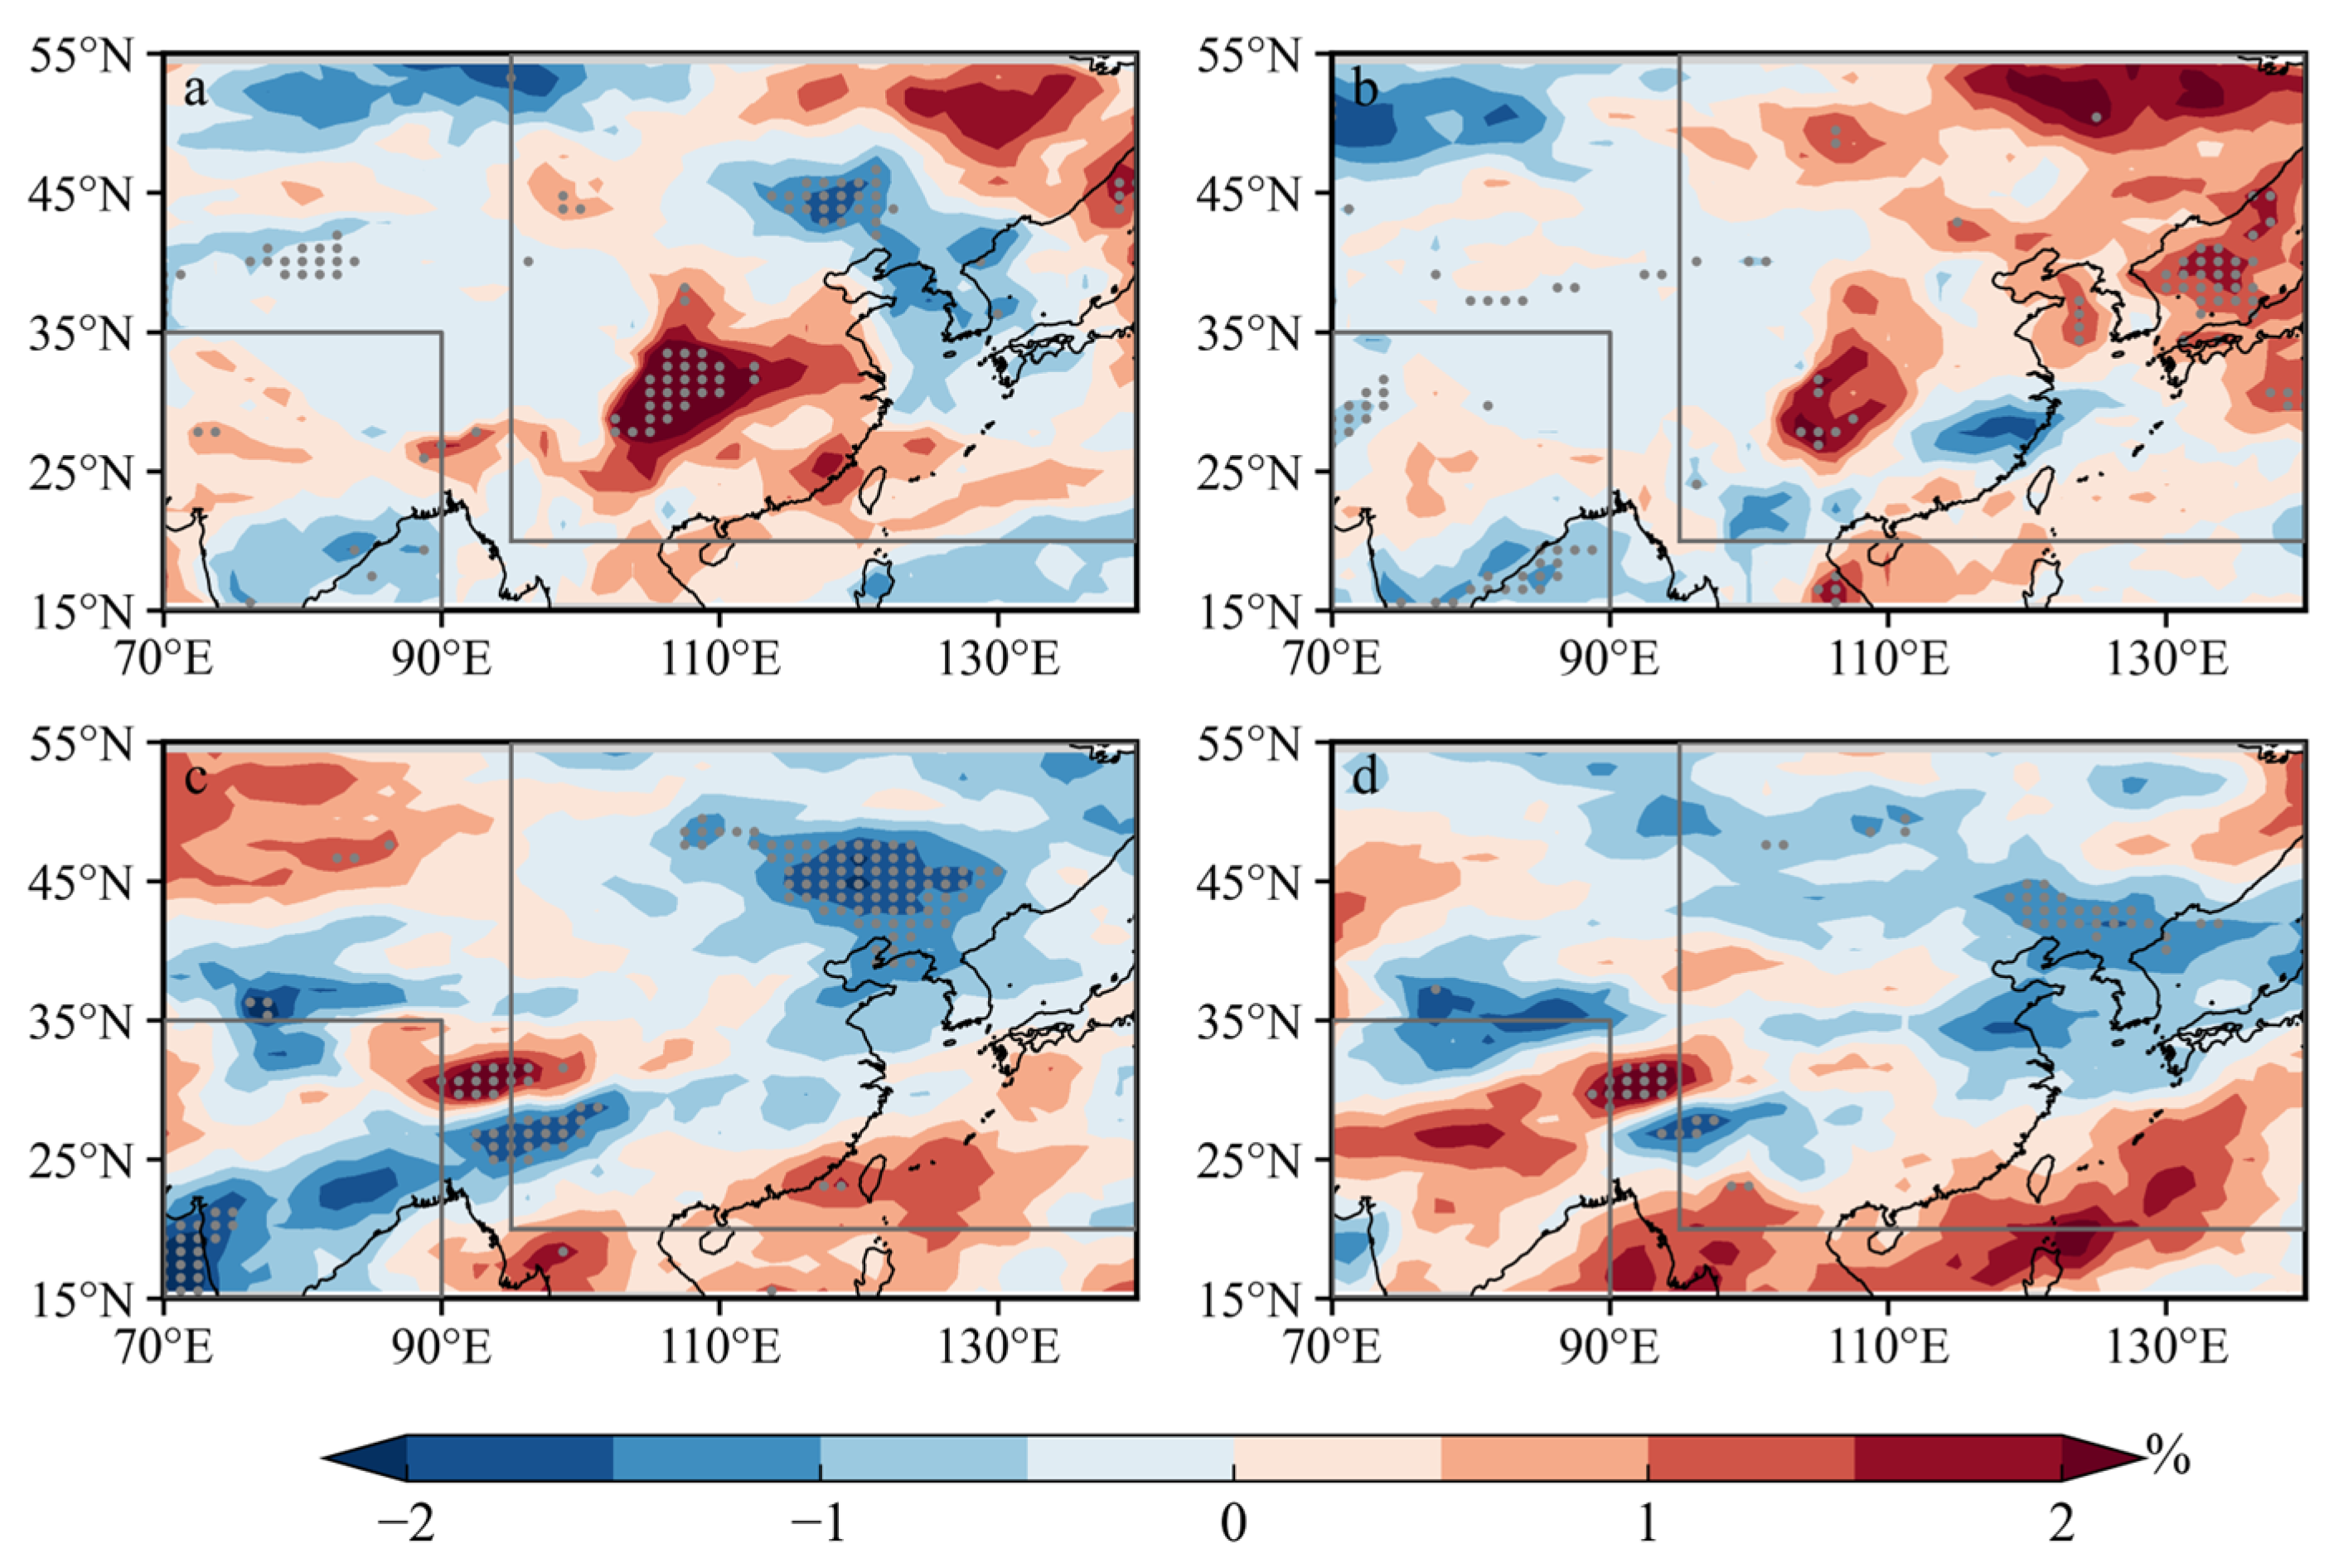
Figure 4, as aerosol burden declines in EA under both future scenarios, low-cloud amount increases markedly, with the enhancement under SSP1–2.6 exceeding that under SSP5–8.5. This intensified low-cloud regime yields a stronger shortwave attenuation, producing a reduction in surface downward net shortwave radiation. Across both scenarios, the contribution of low-cloud blocking to shortwave fluxes peaks in EA, reaching about 9.25 W/m
2 for SSP1–2.6 and 9.83 W/m
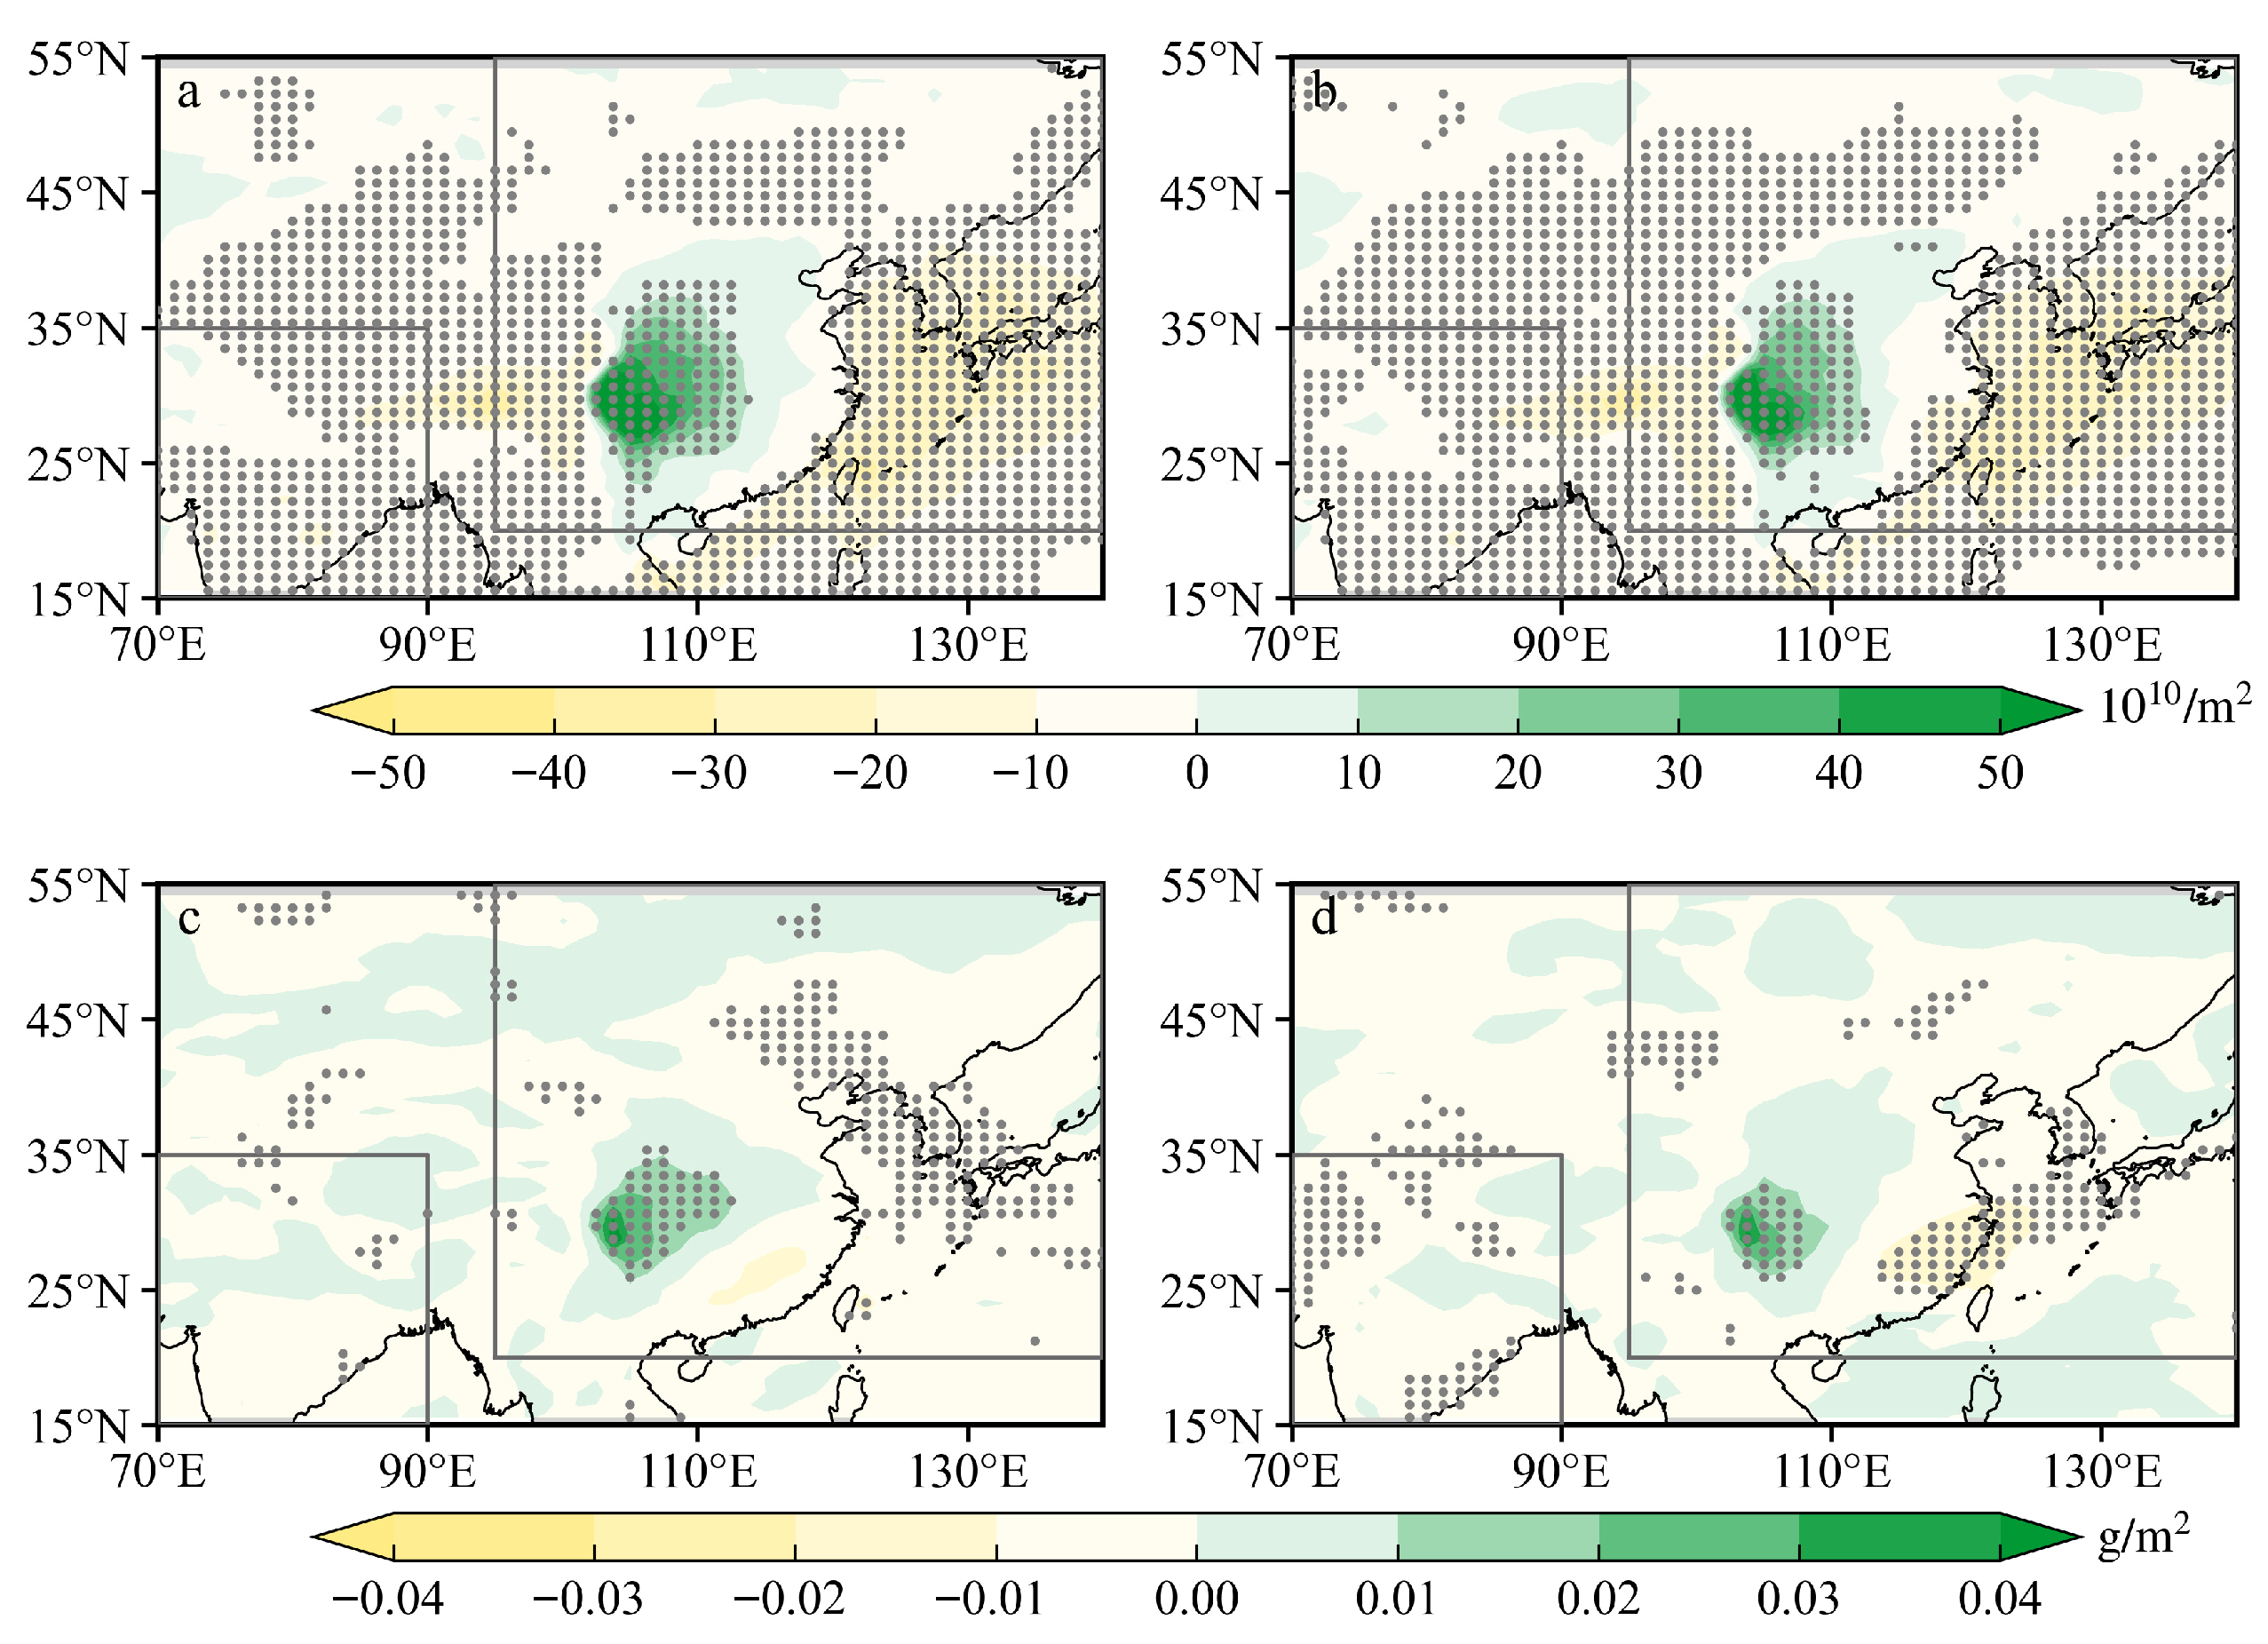
2 for SSP5–8.5. At the same time, high clouds in EA decline slightly, weakening the greenhouse effect and further contributing to a loss of surface net radiation. Cloud microphysical diagnostics show a pronounced rise in vertical cloud droplet number concentration (CDNC) within the low-cloud enhanced region in EA (
Figure 5a,b), with maximum differences of 87.91 × 10
10/m
2 for SSP1-2.6 and 82.23 × 10
10/m
2 for SSP5–8.5. The liquid water path (LWP) also increases, and the liquid-phase fraction accounts for more than 90% of the total, underscoring the dominant role of liquid-phase clouds in driving the low-cloud attenuation [
28].
In SA, the low-cloud changes exhibit a symmetric pattern between the northern and southern parts, with the low-cloud response showing a “north enhancement, south reduction” structure under both future scenarios (
Figure 4a,b). The high-cloud response differs between scenarios: overall weakening under SSP1–2.6 and a slight overall increase under SSP5–8.5, but changes in LWP and CDNC are weak, and no pronounced extremal regions emerge (
Figure 4c,d). This indicates milder cloud microphysical adjustments in SA compared with EA.
Overall, the aerosol–cloud–radiation coupling exhibits a strong regional structure. Building on the direct-radiation results from the first part, the cloud field’s macro-adjustments provide an amplification or buffering pathway for surface shortwave radiation. EA exhibits a more evident negative net radiative signal, whereas SA shows a more complex spatial pattern. The macroscopic redistribution of the cloud field acts as a key amplifier and an important vehicle for regional energy-budget reallocation under the two scenarios. The regional modulation of cloud microphysics jointly determines the net radiative effect of clouds, with the EA pathway—“low-cloud dominated plus enhanced liquid CDNC”—being the principal mechanism driving the decrease in surface net shortwave radiation. The sum of direct cloud blocking and indirect effects (CDNC, LWP, and cloud albedo changes) yields a significant modulation of surface shortwave radiation, while longwave effects exhibit regional differences mediated by modest greenhouse-effect changes and adjustments in cloud-top height. Finally, the coupled cloud macro-–micro processes represent the plausible amplification/buffering mechanism for the radiative changes described above, and it is likely that the cloud-driven thermodynamic structure adjustments will have important impacts on regional precipitation distribution and convective organization [
29,
30]. However, these conclusions are based on a single-model analysis (CESM2) and should be treated as model-specific patterns pending future multi-model or perturbed-physics evaluations. Partitioning radiative, dynamical, and surface-albedo contributions requires targeted diagnostics or dedicated experiments beyond the scope of the present study. These results are provided to guide interpretation and to motivate future observationally constrained, multi-model studies.
3.3. Climate Response and Feedback
Due to the intrinsic complexity of atmospheric processes and their interactions with the underlying surface, local climate responses exhibit strong nonlinearity.
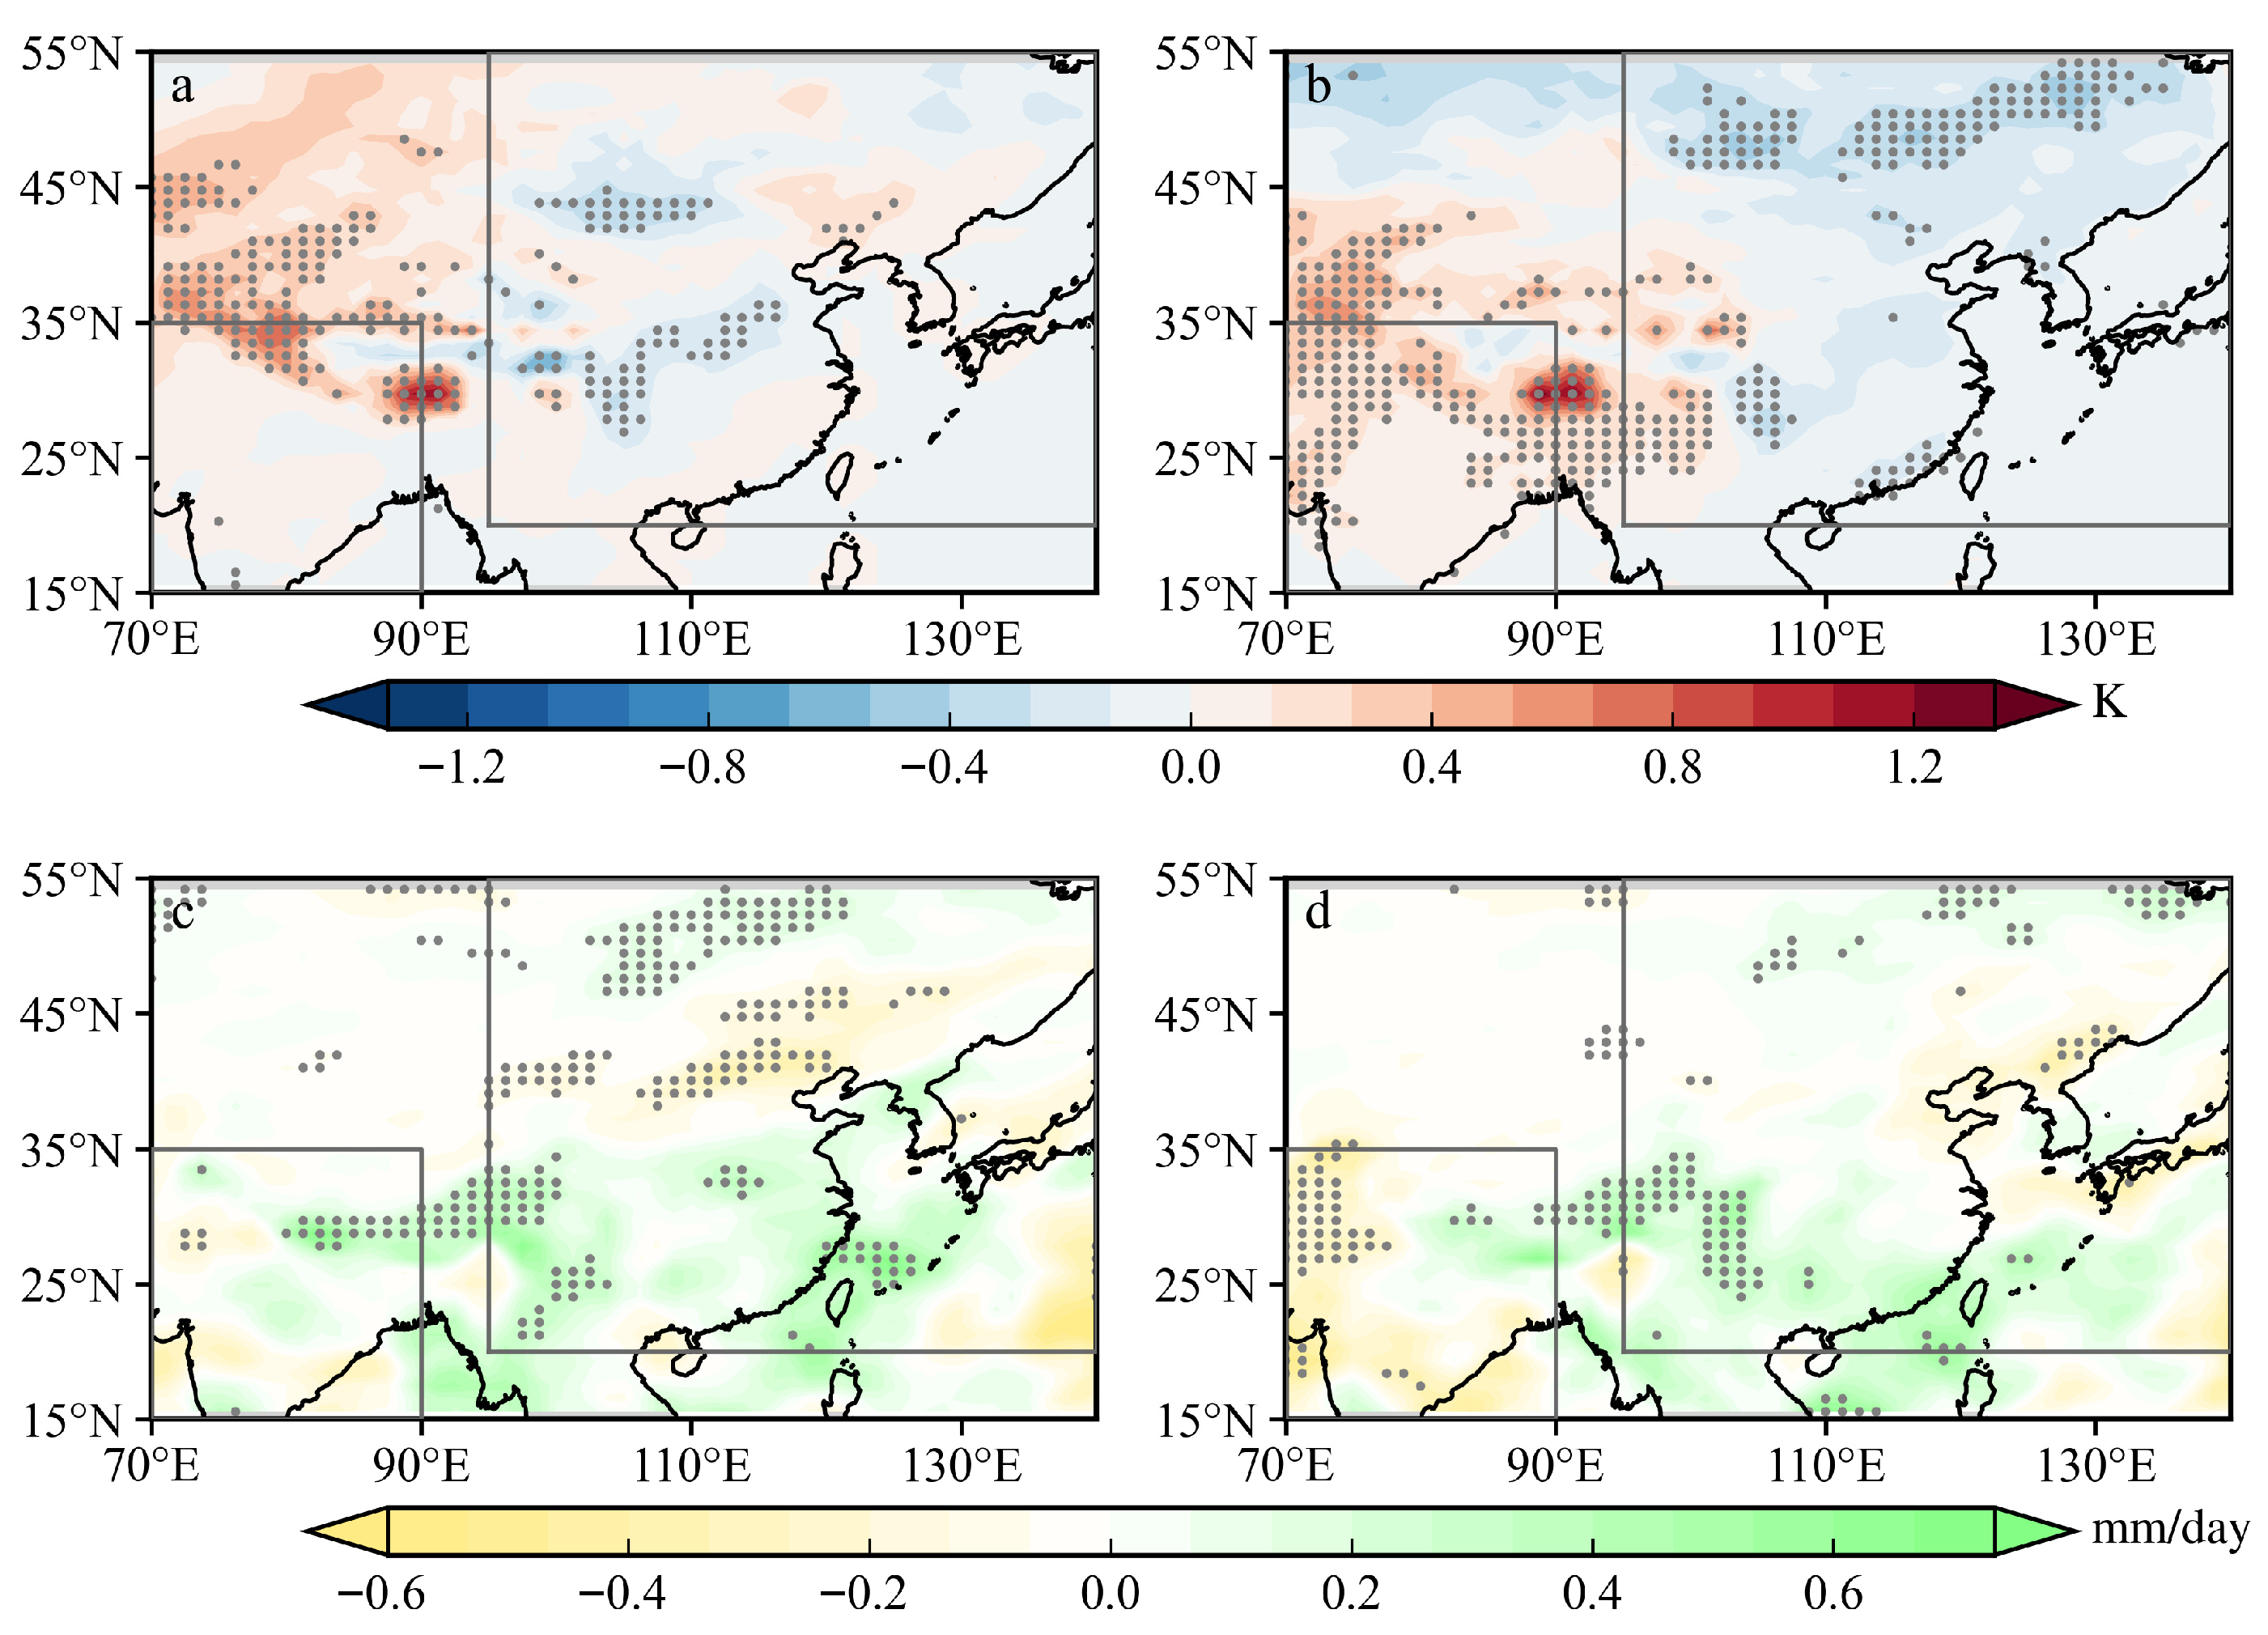
Figure 6a,b illustrate the spatial patterns of temperature and precipitation changes under the two scenarios. In EA, both scenarios produce overall cooling, with stronger cooling under SSP5–8.5, consistent with the pronounced low-cloud shortwave attenuation and surface net radiation deficit described above. By contrast, the Tibetan Plateau (TP) shows marked warming in both cases, reflecting its well-documented high sensitivity to climate perturbations [
31]. This plateau warming is plausibly linked to increases in high-cloud amount (especially under SSP5–8.5), vertical redistribution of cloud radiative effects, and regional circulation adjustments that enhance downward longwave radiation and surface heat fluxes. However, given the complexity of plateau processes and the model’s coarse resolution, cleanly separating radiative, dynamical, and surface albedo contributions remains difficult; the present interpretation should thus be viewed as a working hypothesis requiring further process-oriented diagnostics or higher-resolution experiments for robust attribution.
In South Asia, an overall warming tendency emerges under both scenarios (
Figure 6a,b), driven by strengthened warm advection and spatially heterogeneous changes in the regional radiative-energy balance, in qualitative agreement with the more complex cloud radiative patterns and milder microphysical adjustments documented previously.
Precipitation changes arise from the combined influence of surface evaporation, large-scale circulation, moisture, and cloud processes, with surface temperature changes—driving evaporation—being a critical component. Hence, to some extent, there is coherence among aerosol concentration changes, temperature changes, and precipitation responses; however, precipitation feedback onto aerosol concentration is highly nonlinear [
32]. In East Asia, regions with substantial sulfate reductions generally experience increased precipitation (
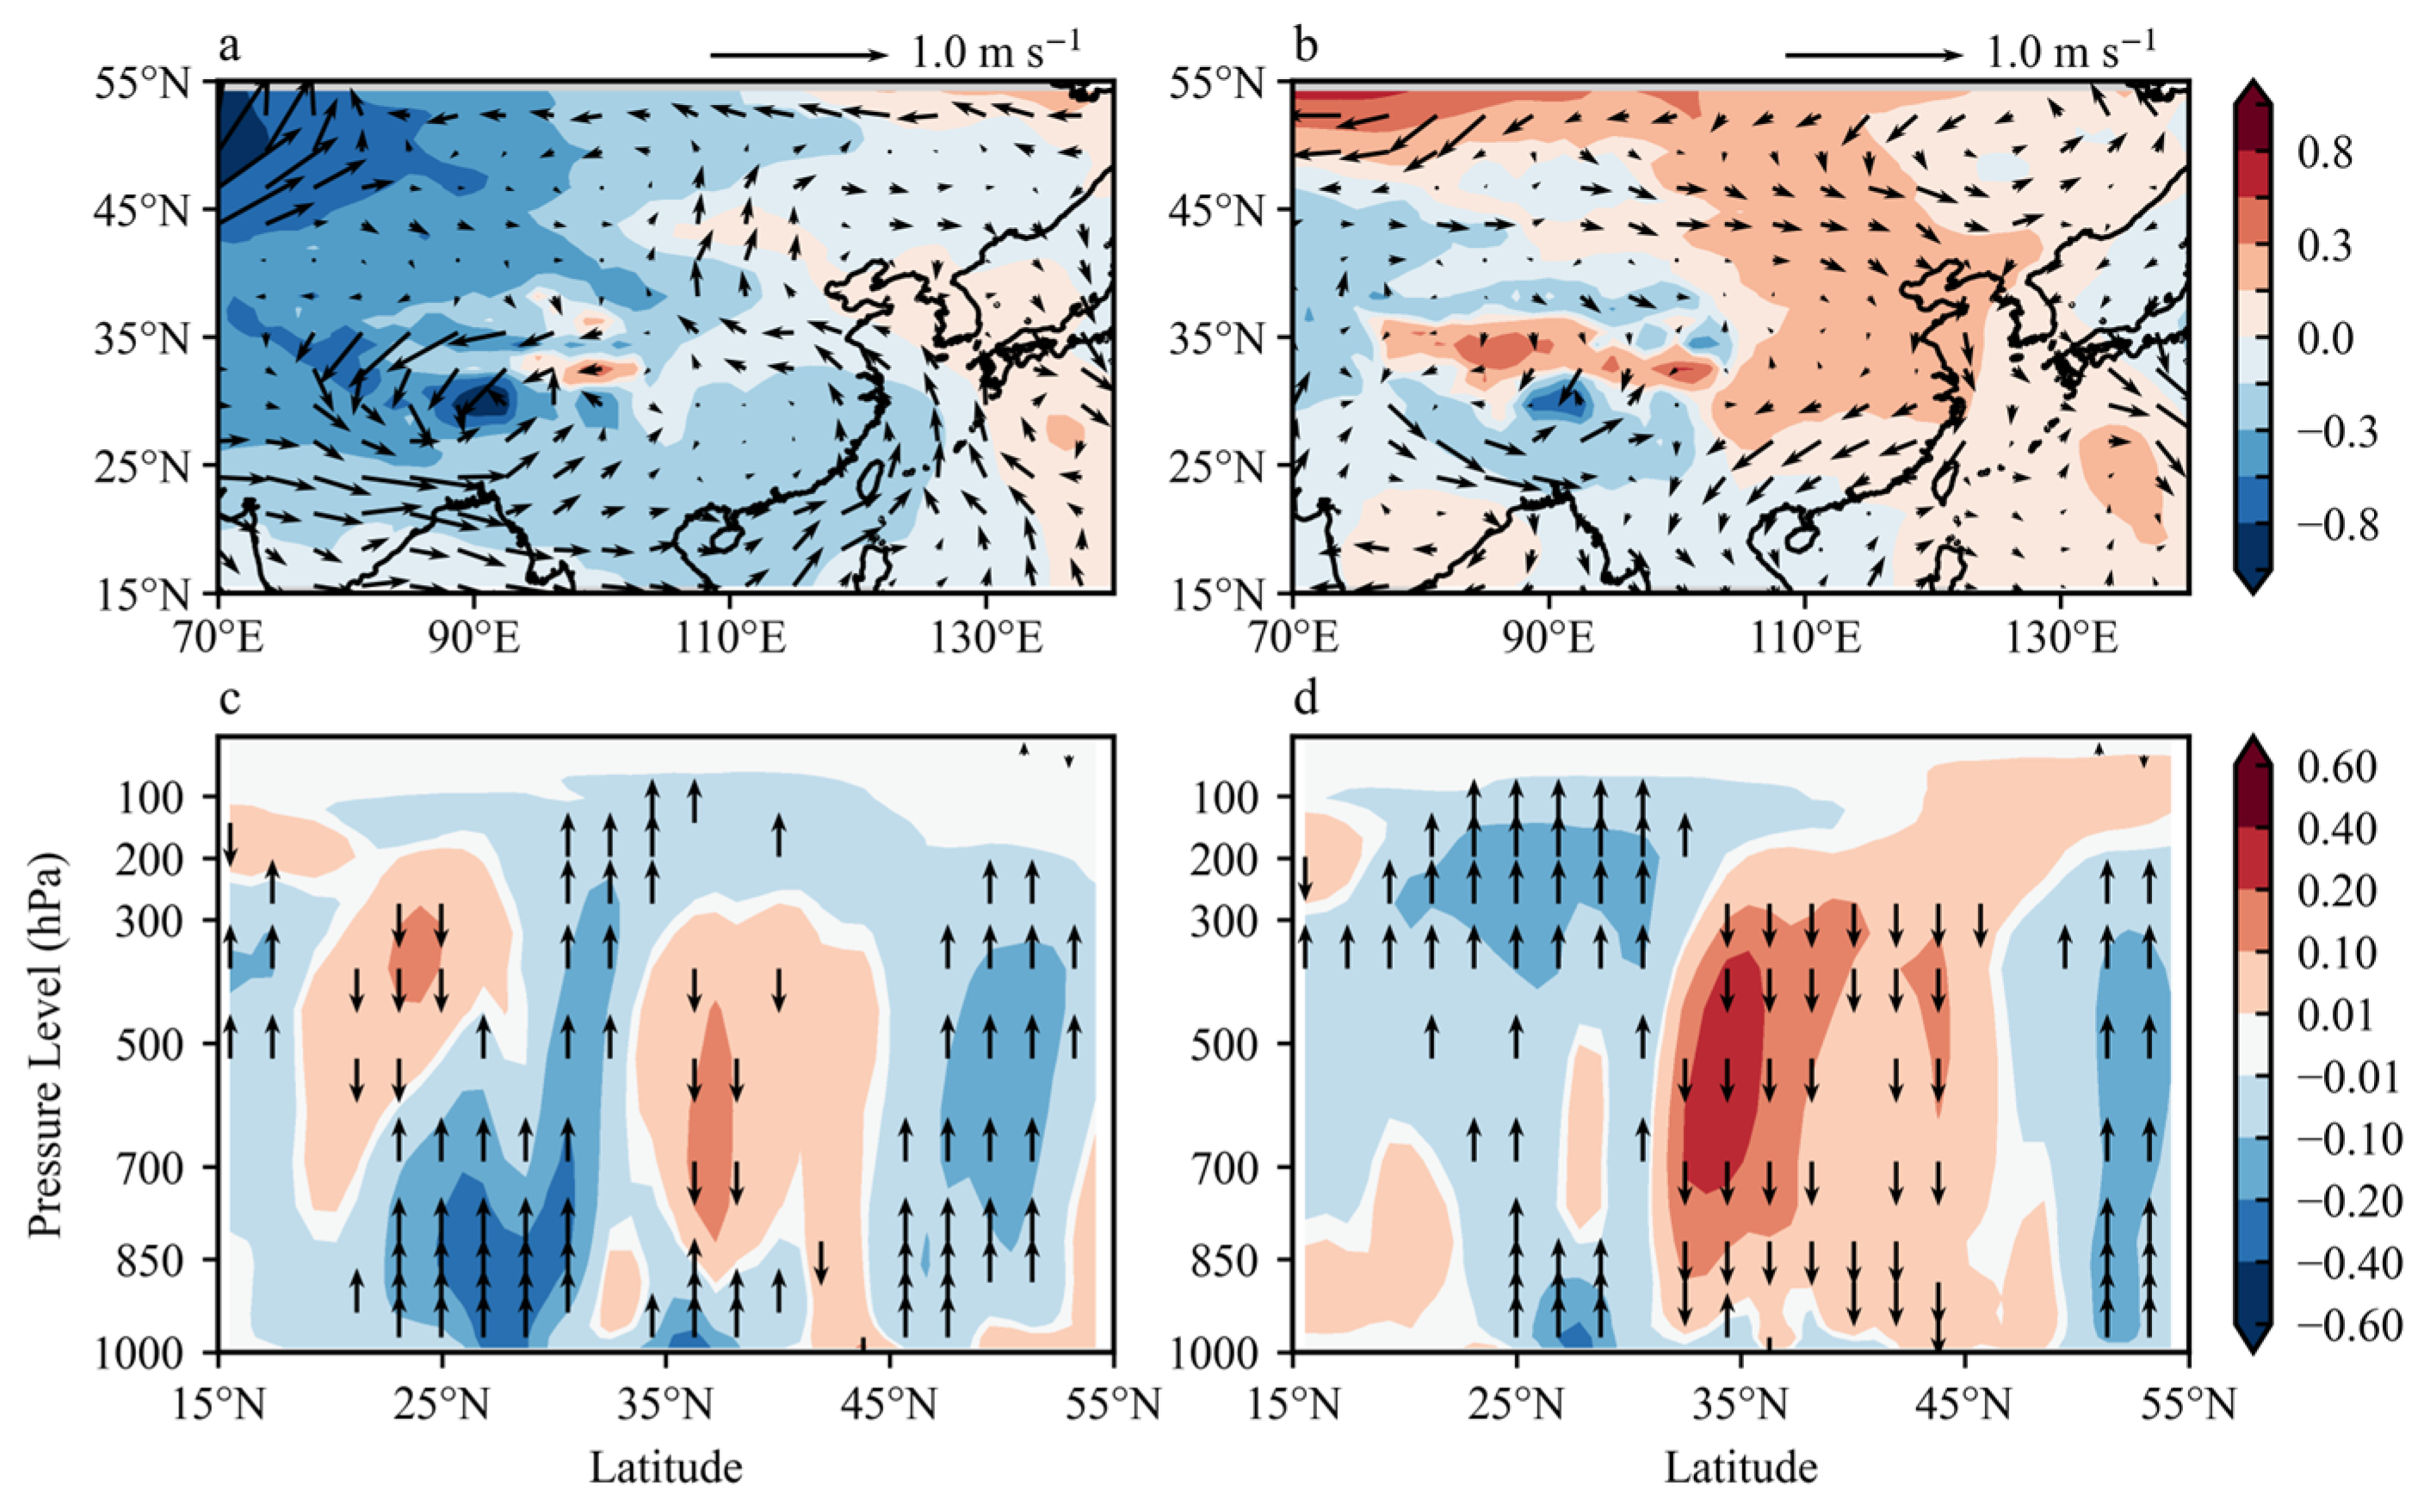
Figure 6c,d), more coherently and strongly under SSP1–2.6, accompanied by enhanced low-level ascent (up to ~850 hPa,
Figure 7) consistent with surface radiative cooling and relative upper-level warming. Under SSP5–8.5, the pattern becomes more heterogeneous, with localized precipitation increases coexisting alongside upper- and mid-tropospheric (500–700 hPa,
Figure 7) descent in some areas, suggesting nonlinear circulation reorganization. Northern East Asia shows precipitation reduction under both scenarios, linked to suppressed vertical motion and the radiation budget deficit from low-cloud enhancement. In South Asia, precipitation exhibits pronounced north–south contrasts, with more evident drought under SSP5–8.5, aligning with weakened near-surface ascent and altered thermodynamic/dynamic pathways.
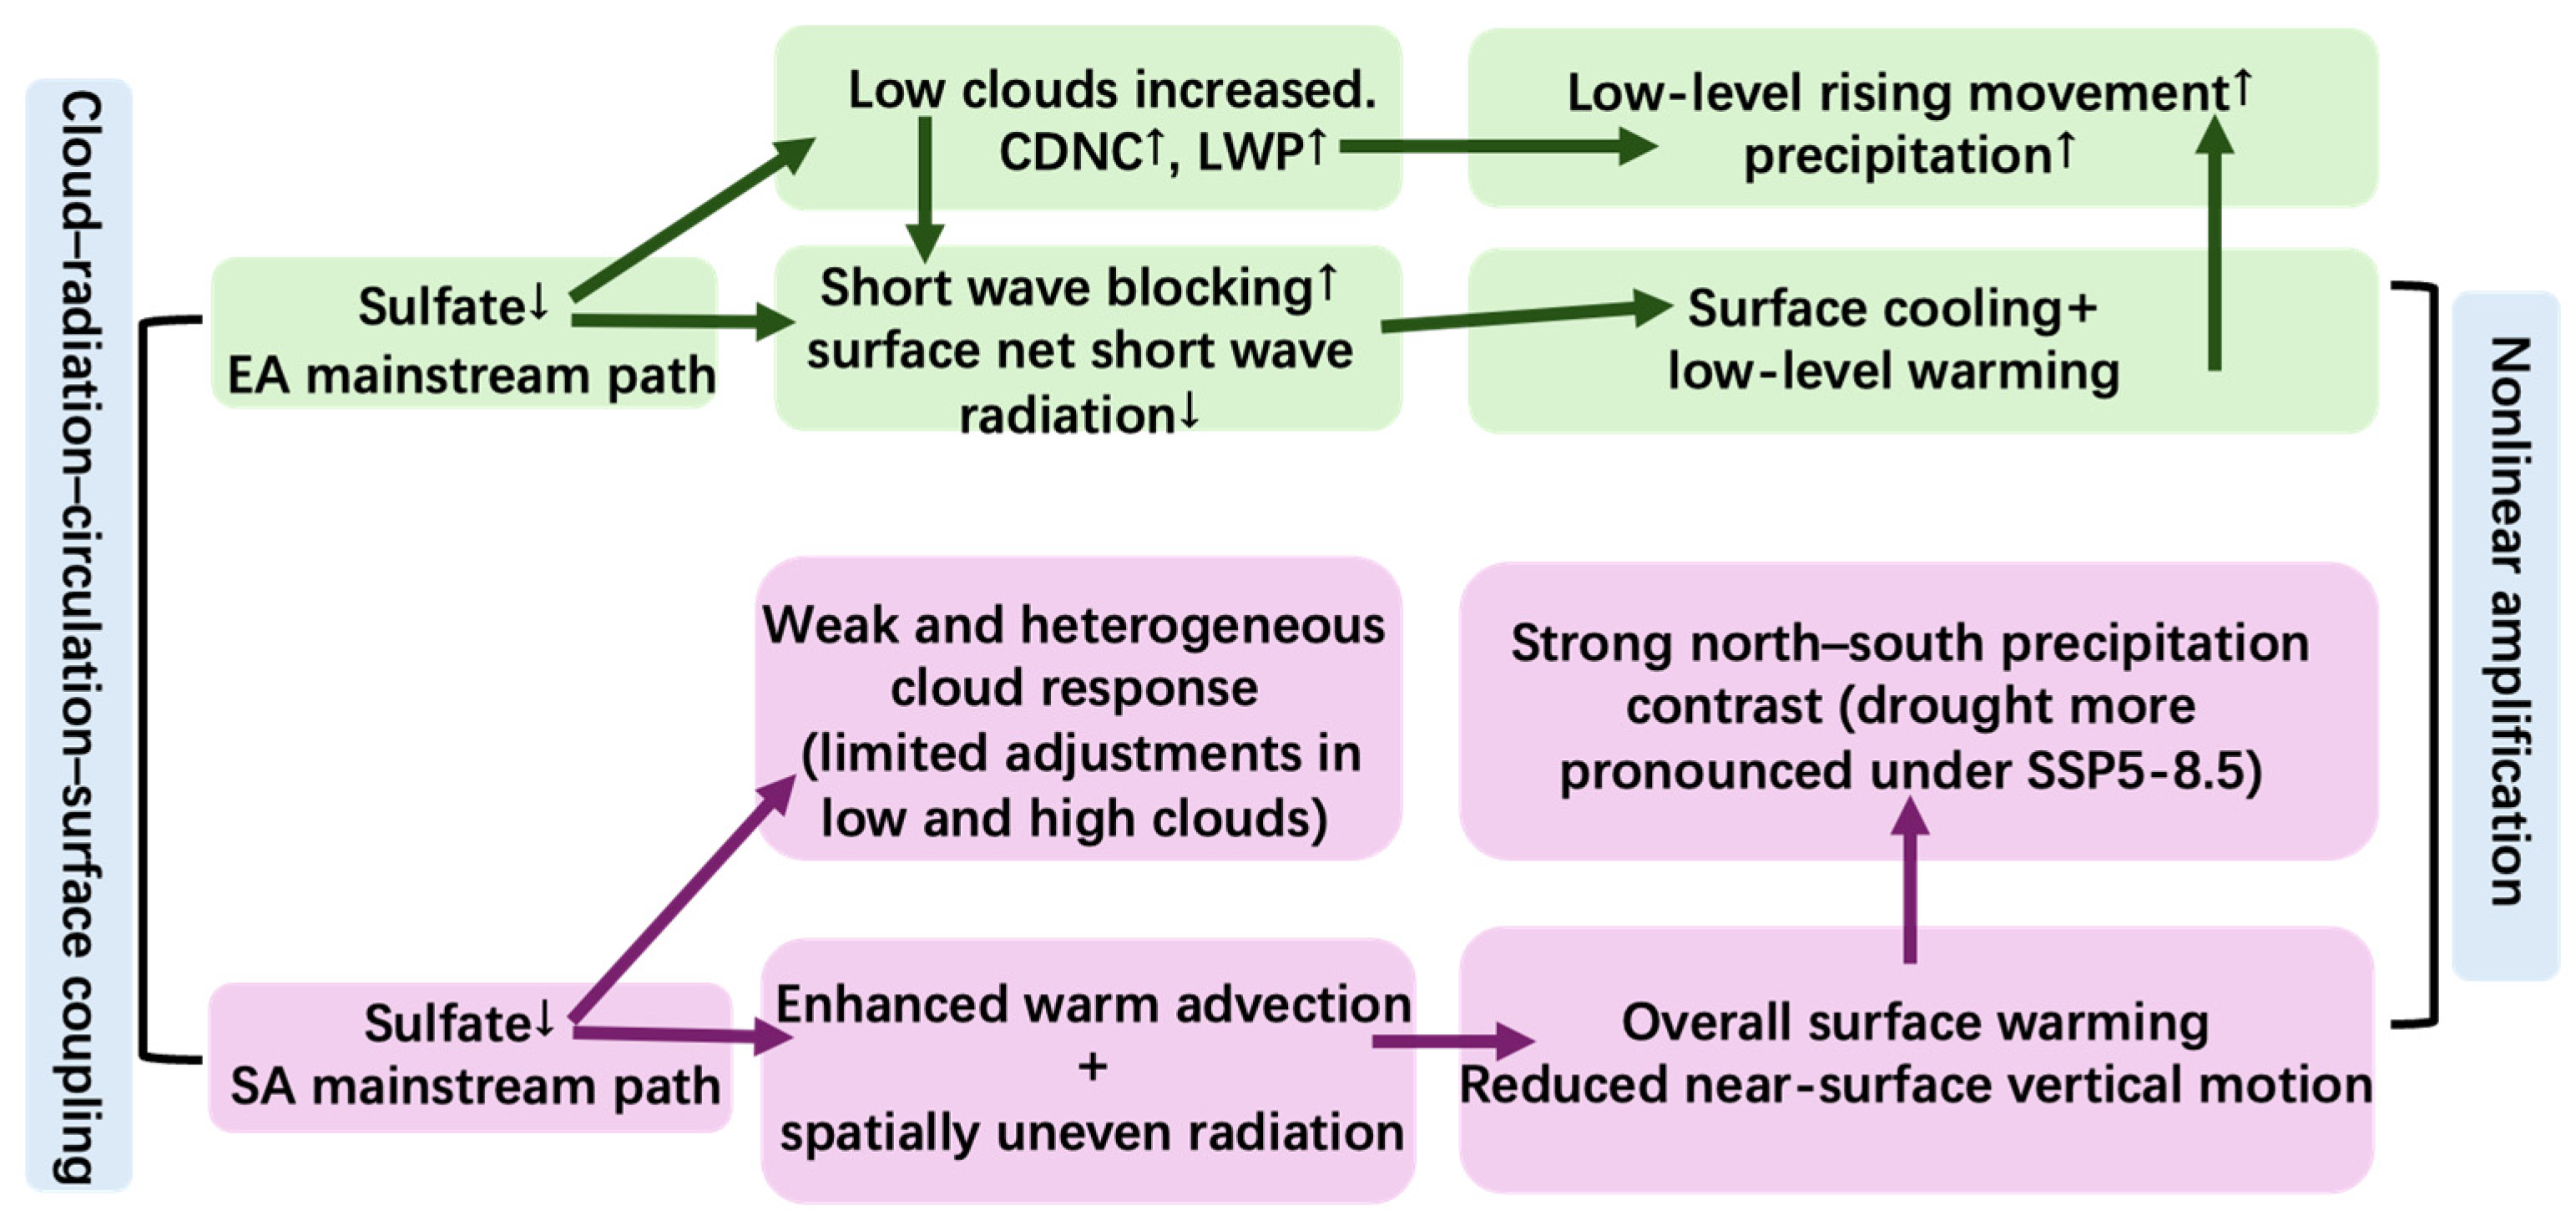
Overall, aerosol-induced cloud–radiation–circulation changes display strong regional nonlinearity. In East Asia, the coupling of low-cloud enhancement, shortwave blocking, and liquid-phase microphysical adjustments constitutes an important amplification pathway for surface radiative changes and regional precipitation intensification in key areas. Over the plateau and in South Asia, terrain effects and circulation adjustments introduce greater spatial disparities. However, the coarse model resolution limits confidence in simulating deep convection, orographic precipitation, and fine-scale cloud–circulation interactions, particularly over the Tibetan Plateau and monsoon margins. Therefore, while the diagnosed large-scale patterns are informative, quantitative claims regarding precipitation efficiency, convective reorganization, and vertical motion control should be interpreted with caution. Targeted moisture budget decomposition, energetic analyses, and higher-resolution or process-oriented modeling are needed to strengthen these interpretations. The cloud macro–micro processes outlined earlier provide a plausible primary mechanism linking radiative perturbations to regional thermodynamic and hydrological adjustments under future aerosol scenarios.
4. Discussion
This study highlights the strong regional heterogeneity and nonlinearity in aerosol–cloud–radiation thermo-hydrological responses over EA–SA arising from contrasting anthropogenic emission trajectories. The simulated patterns reveal that, while direct radiative forcing from aerosol burden changes acts in a relatively uniform manner, the dominant control on surface energy balance and regional temperature emerges from cloud macro- and microphysical adjustments. In EA, the net surface shortwave cooling is primarily driven by enhanced low-cloud amount and associated increases in cloud albedo and liquid-phase microphysical properties, outweighing the direct aerosol clear-sky effect. Over the TP, a plausible combination of high-cloud increases, vertical redistribution of cloud radiative heating, and regional circulation modulations contributes to enhanced net surface radiation and amplified warming. In SA, more spatially complex cloud responses and weaker microphysical signals result in heterogeneous thermodynamic and hydrological outcomes.
These regional contrasts underscore the critical role of cloud processes in mediating aerosol-induced climate impacts [
33,
34,
35]. However, several important caveats must be emphasized. First, all findings are derived from a single global model (CESM2) employing fixed parameterizations of cloud microphysics (MG2), turbulence (CLUBB), and aerosol–cloud interactions. Multiple independent evaluation studies have documented systematic biases in CESM2 cloud properties [
36], including potential overestimation of low-cloud liquid water path adjustments and difficulties in capturing the radiative effects of high-level clouds over elevated terrain. Such biases introduce quantitative uncertainty in the magnitude of diagnosed CDNC, LWP, and cloud radiative effects, even though the large-scale patterns of relative response and the directional signs of key mechanisms often exhibit greater robustness across models.
Second, the relatively coarse horizontal resolution of the present simulations limits confidence in processes that operate on smaller scales, such as deep convection, orographic precipitation enhancement, fine-scale cloud–circulation coupling, and topographic modulation of boundary-layer clouds—particularly over the Tibetan Plateau and along monsoon margins. Consequently, quantitative statements about convective reorganization, precipitation efficiency, vertical motion control, and the precise partitioning of radiative, dynamical, and surface albedo contributions to plateau warming should be treated as model-specific indications rather than definitive attributions. The absence of moisture budget decomposition, detailed energetic constraint analyses, and perturbed-physics ensembles further restricts our ability to rigorously rank the relative importance of different pathways or to rule out alternative explanations (e.g., circulation-driven moisture convergence changes dominating over cloud microphysical effects in certain subregions).
Third, the study does not include direct quantitative benchmarking against satellite-based cloud and radiation products (e.g., MODIS [Santa Barbara Remote Sensing, Santa Barbara, CA, USA], FY-4A/AGRI cloud products [China Aerospace Science and Technology Corporation, Beijing, China], CloudSat/CALIPSO [Ball Aerospace, Boulder, CO, USA] joint retrievals) or ground-based measurements in high-sensitivity regions. While broad directional consistency exists between the diagnosed low-cloud enhancement in East Asia and some satellite-observed signals [
37], regional model biases and the inherent complexity of aerosol–cloud–precipitation interactions prevent firm claims of universal representativeness. Potential discrepancies with the existing literature—particularly regarding the strength of indirect effects in monsoon regions and the sign/magnitude of high-cloud feedbacks over the plateau—cannot be fully resolved within the current single-model framework.
Taken together, the present results should be interpreted primarily as illustrating physically plausible mechanisms and highlighting pronounced regional contrasts in aerosol-driven climate sensitivity under different future emission pathways, rather than as precise predictions of absolute response magnitudes. The nonlinear amplification provided by coupled cloud macro–micro processes constitutes a central pathway through which aerosol changes can project onto regional temperature, precipitation, and circulation patterns, yet the quantitative expression of these pathways remains model-dependent and subject to substantial uncertainty. These limitations motivate a more cautious framing of the conclusions and emphasize the need for complementary approaches in subsequent work.
5. Conclusions
This study demonstrates that future changes in anthropogenic aerosol emissions exert a profound influence on regional climate through strongly nonlinear aerosol–cloud–radiation thermo-hydrological couplings over EA and SA (
Figure 8). The most robust large-scale signal is the critical mediating role of cloud macro- and microphysical adjustments in determining the net surface radiative response. In EA, enhanced low-cloud amount and liquid-phase microphysical properties (increased CDNC and LWP) dominate the surface shortwave cooling despite reduced aerosol direct forcing, leading to regional-scale thermodynamic stabilization and spatially coherent precipitation intensification in areas of strong sulfate decline. Over the TP, a plausible combination of high-cloud increases and circulation-modulated radiative redistribution contributes to significant surface warming. In SA, weaker and more heterogeneous cloud responses result in complex north–south contrasts in both temperature and precipitation fields. These findings underscore that cloud processes—rather than direct aerosol radiative effects alone—constitute the primary amplification pathway through which regional emission trajectories project onto differential thermo-hydrological outcomes under low- versus high-emission futures.
Scientifically, the work highlights the essential nonlinearity and regional specificity of aerosol indirect effects in monsoon-influenced environments, reinforcing the need to move beyond clear-sky direct forcing when assessing aerosol-driven climate impacts. The pronounced EA low-cloud pathway and the contrasting behaviors between subregions provide a physically based framework for interpreting divergent model projections of Asian climate sensitivity under aerosol mitigation scenarios.
Nevertheless, important limitations temper the strength of these conclusions. All results stem from a single global model (CESM2) at relatively coarse resolution, with known regional cloud biases and parameterized representations of aerosol–cloud interactions, deep convection, and orographic processes. The lack of moisture budget decomposition, detailed energetic partitioning, perturbed-physics ensembles, and direct observational benchmarking precludes definitive attribution of individual contributions (radiative versus dynamical versus surface albedo) and reduces confidence in quantitative magnitudes, especially for convective organization, orographic precipitation, and fine-scale cloud–circulation feedbacks over complex terrain. Consequently, while the diagnosed large-scale patterns and directional mechanisms appear physically plausible, the absolute response amplitudes and precise spatial details should be regarded as model-specific indications rather than robust predictions.
Future research can strengthen and extend these findings through several targeted directions:
Conducting convection-permitting or high-resolution regional simulations to better resolve aerosol influences on deep convection, orographic precipitation enhancement, and mesoscale cloud–circulation interactions, particularly over the Tibetan Plateau and monsoon margins.
Performing coordinated multi-model intercomparison experiments (ideally within frameworks such as CMIP or AerChemMIP) to quantify structural uncertainty arising from different cloud microphysical schemes, aerosol aging parameterizations, and aerosol–cloud coupling representations.
Integrating longer-term satellite retrievals (e.g., MODIS, CERES, CloudSat/CALIPSO) and ground-based measurements (e.g., AERONET, SKYNET, ARM mobile facilities in Asia) to provide stricter observational constraints on simulated CDNC, LWP, cloud radiative effects, and precipitation responses, thereby narrowing the range of plausible model behaviors.
Extending the analysis to other rapidly decarbonizing or emission-transitioning regions (e.g., SA, Southeast Asia, parts of Africa) to assess the generalizability of the identified low-cloud versus high-cloud pathways under diverse emission and dynamical regimes.
While the present single-model results offer valuable mechanistic insight into possible regional climate sensitivities under contrasting aerosol futures, robust support for decision-making in water-resource planning, extreme-event risk assessment, or air-quality co-benefit strategies will require the combined advances outlined above—particularly multi-model consensus, observational constraint, and improved representation of hydrological coupling. Until such efforts are completed, care should be exercised when interpreting these findings as direct guidance for policy in highly vulnerable monsoon regions.
Author Contributions
Conceptualization, C.Z. and H.Y.; methodology, C.Z. and Z.L.; software, Z.L.; formal analysis, C.Z. and R.L.; writing—original draft preparation, C.Z.; writing—review and editing, S.L. and L.C.; supervision, H.Y. All authors have read and agreed to the published version of the manuscript.
Funding
This research was funded by the Natural Science Foundation of Inner Mongolia Autonomous Region of China (2025MS04004, 2023MS04008, 2025MS04015), Inner Mongolia Central guidance of local science and technology development funds (2022ZY0178), Natural National Science Foundation of China (52360028, 42165003), the Inner Mongolia Autonomous Region Key R&D and Achievement Transformation Program (2025YFDZ0068), Science and Technology Innovation Project of Inner Mongolia Meteorological Service (nmqxkjcx202577).
Institutional Review Board Statement
Not applicable.
Informed Consent Statement
Not applicable.
Data Availability Statement
Data are available from the corresponding author.
Acknowledgments
The authors sincerely thank the developers of the Earth System Model CESM, the National Center for Atmospheric Research (NCAR), for their contributions to creating and maintaining this openly accessible modeling framework; they also thank CMIP6 and the World Climate Research Programme (WCRP) for providing open-access data that made this study possible.
Conflicts of Interest
The authors declare no conflicts of interest.
Abbreviations
| CESM2 | Community Earth System Model, version two |
| NCAR | The National Center for Atmospheric Research |
| SSP1-2.6 | Shared Socioeconomic Pathway 1–2.6 |
| SSP5-8.5 | Shared Socioeconomic Pathway 5–8.5 |
| REAS | The Regional Emission inventory in Asia |
| AOD | Aerosol Optical Depth |
| DRE | Direct Radiative Effect |
| IRE | Indirect Radiative Effect |
| CDNC | Cloud Droplet Number Concentration |
| LWP | Liquid Water Path |
| CRI | Cloud–Radiation Interaction |
| EA | East Asia |
| SA | South Asia |
| TP | The Tibetan Plateau |
References
- Charlson, R.J.; Schwartz, S.E.; Hales, J.M.; Cess, R.D.; Coakley, J.A., Jr.; Hansen, J.E.; Hofmann, D.J. Climate forcing by anthropogenic aerosols. Science 1992, 255, 423–430. [Google Scholar] [CrossRef] [PubMed]
- Intergovernmental Panel on Climate Change. Climate Change 2021—The Physical Science Basis: Working Group I Contribution to the Sixth Assessment Report of the Intergovernmental Panel on Climate Change, 1st ed.; Cambridge University Press: Cambridge, UK, 2023; ISBN 978-1-009-15789-6. [Google Scholar]
- Yang, Y.; Wang, H.; Smith, S.J.; Easter, R.; Ma, P.-L.; Qian, Y.; Yu, H.; Li, C.; Rasch, P.J. Global source attribution of sulfate concentration and direct and indirect radiative forcing. Atmos. Chem. Phys. 2017, 17, 8903–8922. [Google Scholar] [CrossRef]
- Lohmann, U.; Feichter, J. Global indirect aerosol effects: A review. Atmos. Chem. Phys. 2005, 5, 715–737. [Google Scholar] [CrossRef]
- Rosenfeld, D.; Sherwood, S.; Wood, R.; Donner, L. Climate effects of aerosol–cloud interactions. Science 2014, 343, 379–380. [Google Scholar] [CrossRef]
- Li, X.; Ting, M.; Lee, D.E. Fast adjustments of the Asian summer monsoon to anthropogenic aerosols. Geophys. Res. Lett. 2018, 45, 1001–1010. [Google Scholar] [CrossRef]
- Shao, Z.; Wang, H.; Geng, Y.-F.; Diao, C.; Xu, Y.; Zheng, X.-T. East Asian summer monsoon response to anthropogenic aerosols redistribution: Contrasting 1950–1980 and 1980–2010 to understand the role of non-Asian forcing. Clim. Dyn. 2024, 62, 2187–2205. [Google Scholar] [CrossRef]
- Recchia, L.G.; Lucarini, V. Modelling the effect of aerosol and greenhouse gas forcing on the South Asian and East Asian monsoons with an intermediate-complexity climate model. Earth Syst. Dyn. 2023, 14, 697–722. [Google Scholar] [CrossRef]
- Hong, C.; Zhang, Q.; Zhang, Y.; Davis, S.J.; Zhang, X.; Tong, D.; Guan, D.; Liu, Z.; He, K. Weakening aerosol direct radiative effects mitigate climate penalty on Chinese air quality. Nat. Clim. Change 2020, 10, 845–850. [Google Scholar] [CrossRef]
- Herbert, R.J.; Williams, A.I.L.; Weiss, P.; Watson-Parris, D.; Dingley, E.; Klocke, D.; Stier, P. Regional variability of aerosol impacts on clouds and radiation in global kilometer-scale simulations. Atmos. Chem. Phys. 2025, 25, 7789–7814. [Google Scholar] [CrossRef]
- Shao, Z.; Wang, H.; Zheng, X.; Han, Z.; Zhang, Y. Response of Asian summer monsoon to the dipole pattern of anthropogenic aerosol forcing and its mechanism. J. Mar. Meteorol. 2023, 43, 32–44. [Google Scholar] [CrossRef]
- Herbert, R.; Wilcox, L.J.; Joshi, M.; Highwood, E.; Frame, D. Nonlinear response of Asian summer monsoon precipitation to emission reductions in South and East Asia. Environ. Res. Lett. 2022, 17, 014005. [Google Scholar] [CrossRef]
- Levy, H., II; Horowitz, L.W.; Schwarzkopf, M.D.; Ming, Y.; Golaz, J.-C.; Naik, V.; Ramaswamy, V. The roles of aerosol direct and indirect effects in past and future climate change. J. Geophys. Res. Atmos. 2013, 118, 4521–4532. [Google Scholar] [CrossRef]
- Fan, J.; Rosenfeld, D.; Zhang, Y.; Giangrande, S.E.; Li, Z.; Machado, L.A.T.; Martin, S.T.; Yang, Y.; Wang, J.; Artaxo, P.; et al. Substantial convection and precipitation enhancements by ultrafine aerosol particles. Science 2018, 359, 411–418. [Google Scholar] [CrossRef] [PubMed]
- Zhao, C.; Li, J.; Yang, Y. A short review of microphysical effects of aerosols on clouds and precipitation. Chin. J. Atmos. Sci. 2025, 49, 949–963. [Google Scholar]
- Watson-Parris, D.; Smith, C.J. Large uncertainty in future warming due to aerosol forcing. Nat. Clim. Change 2022, 12, 1111–1113. [Google Scholar] [CrossRef]
- Yoshioka, M.; Regayre, L.A.; Pringle, K.J.; Johnson, J.S.; Mann, G.W.; Partridge, D.G.; Sexton, D.M.H.; Lister, G.M.S.; Schutgens, N.; Stier, P.; et al. Ensembles of global climate model variants designed for the quantification and constraint of uncertainty in aerosols and their radiative forcing. J. Adv. Model. Earth Syst. 2019, 11, 3728–3754. [Google Scholar] [CrossRef]
- Hurrell, J.W.; Holland, M.M.; Gent, P.R.; Ghan, S.; Kay, J.E.; Kushner, P.J.; Lamarque, J.-F.; Large, W.G.; Lawrence, D.; Lindsay, K.; et al. The Community Earth System Model: A framework for collaborative research. Bull. Am. Meteorol. Soc. 2013, 94, 1339–1360. [Google Scholar] [CrossRef]
- Danabasoglu, G.; Lamarque, J.-F.; Bacmeister, J.; Bailey, D.A.; DuVivier, A.K.; Edwards, J.; Emmons, L.K.; Fasullo, J.; Garcia, R.; Gettelman, A.; et al. The Community Earth System Model Version 2 (CESM2). J. Adv. Model. Earth Syst. 2020, 12, e2019MS001916. [Google Scholar] [CrossRef]
- Zhao, A.; Stevenson, D.S.; Bollasina, M.A. Climate forcing and response to greenhouse gases, aerosols, and ozone in CESM1. J. Geophys. Res. Atmos. 2019, 124, 13876–13894. [Google Scholar] [CrossRef]
- Undorf, S.; Bollasina, M.A.; Booth, B.B.B.; Hegerl, G.C. Contrasting the effects of the 1850–1975 increase in sulphate aerosols from North America and Europe on the Atlantic in the CESM. Geophys. Res. Lett. 2018, 45, 11930–11940. [Google Scholar] [CrossRef]
- Glotfelty, T.; He, J.; Zhang, Y.I. Improving organic aerosol treatments in CESM/CAM5: Development, application, and evaluation. J. Adv. Model. Earth Syst. 2017, 9, 1506–1539. [Google Scholar] [CrossRef]
- Gettelman, A.; Hannay, C.; Bacmeister, J.T.; Neale, R.B.; Pendergrass, A.G.; Danabasoglu, G.; Lamarque, J.-F.; Fasullo, J.T.; Bailey, D.A.; Lawrence, D.M.; et al. High climate sensitivity in the Community Earth System Model version 2 (CESM2). Geophys. Res. Lett. 2019, 46, 8329–8337. [Google Scholar] [CrossRef]
- Bogenschutz, P.A.; Gettelman, A.; Morrison, H. Higher-order turbulence closure and its impact on climate simulations in the Community Atmosphere Model. J. Clim. 2013, 26, 9655–9676. [Google Scholar] [CrossRef]
- Liu, X.; Ma, P.-L.; Wang, H.; Tilmes, S.; Singh, B.; Easter, R.C.; Ghan, S.J.; Rasch, P.J. Description and evaluation of a new four-mode version of the Modal Aerosol Module (MAM4) within version 5.3 of the Community Atmosphere Model. Geosci. Model Dev. 2016, 9, 505–522. [Google Scholar] [CrossRef]
- Kurokawa, J.; Ohara, T. Long-term historical trends in air pollutant emissions in Asia: Regional Emission Inventory in Asia (REAS) version 3. Atmos. Chem. Phys. 2020, 20, 12761–12793. [Google Scholar] [CrossRef]
- Gidden, M.J.; Riahi, K.; Smith, S.J.; Fujimori, S.; Luderer, G.; Kriegler, E.; van Vuuren, D.P.; van den Berg, M.; Feng, L.; Klein, D.; et al. Global emissions pathways under different socioeconomic scenarios for use in CMIP6: A dataset of harmonized emissions trajectories through the end of the century. Geosci. Model Dev. 2019, 12, 1443–1475. [Google Scholar] [CrossRef]
- Zhao, X.; Liu, X.; Lin, L.; Qin, Y.; Zelinka, M.D.; Klein, S.A.; Zhang, M.; Zhang, K.; Ma, P.-L.; Zhu, J.; et al. Larger Cloud Liquid Water Enhances Both Aerosol Indirect Forcing and Cloud Radiative Feedback in Two Earth System Models. Geophys. Res. Lett. 2024, 51, e2023GL105529. [Google Scholar] [CrossRef]
- Song, C.; McCoy, D.T.; Eidhammer, T.; Gettelman, A.; McCoy, I.L.; Watson-Parris, D.; Wall, C.J.; Elsaesser, G.; Wood, R. Buffering of aerosol-cloud adjustments by coupling between radiative susceptibility and precipitation efficiency. Geophys. Res. Lett. 2024, 51, e2024GL108663. [Google Scholar] [CrossRef]
- McCoy, D.T.; Field, P.; Frazer, M.E.; Zelinka, M.D.; Elsaesser, G.S.; Mülmenstädt, J.; Tan, I.; Myers, T.A.; Lebo, Z.J. Extratropical Shortwave Cloud Feedbacks in the Context of the Global Circulation and Hydrological Cycle. Geophys. Res. Lett. 2022, 49, e2021GL097154. [Google Scholar] [CrossRef]
- Zhou, T.; Zhang, W. Anthropogenic warming of Tibetan Plateau and constrained future projection. Environ. Res. Lett. 2021, 16, 044039. [Google Scholar] [CrossRef]
- Ramanathan, V.; Crutzen, P.J.; Kiehl, J.T.; Rosenfeld, D. Aerosols, climate, and the hydrological cycle. Science 2001, 294, 2119–2124. [Google Scholar] [CrossRef]
- Zhao, M. An Investigation of the Connections among Convection, Clouds, and Climate Sensitivity in a Global Climate Model. J. Clim. 2014, 27, 1845–1862. [Google Scholar] [CrossRef]
- Stier, P.; van den Heever, S.C.; Christensen, M.W.; Gryspeerdt, E.; Dagan, G.; Saleeby, S.M.; Bollasina, M.; Donner, L.; Emanuel, K.; Ekman, A.M.L.; et al. Multifaceted aerosol effects on precipitation. Nat. Geosci. 2024, 17, 719–732. [Google Scholar] [CrossRef]
- McCoy, D.T.; Field, P.; Gordon, H.; Elsaesser, G.S.; Grosvenor, D.P. Untangling causality in aerosol–cloud adjustments. Atmos. Chem. Phys. 2020, 20, 4085–4103. [Google Scholar] [CrossRef]
- Duffy, M.L.; Medeiros, B.; Gettelman, A.; Eidhammer, T. Perturbing Parameters to Understand Cloud Contributions to Climate Change. J. Clim. 2023, 37, 213–227. [Google Scholar] [CrossRef]
- Cesana, G.; SEMI Chepfer, H. How well do climate models simulate cloud vertical structure? A comparison between CALIPSO-GOCCP satellite observations and CMIP5 models. Geophys. Res. Lett. 2012, 39, L20803. [Google Scholar] [CrossRef]
Figure 1.
Experimental design process.
Figure 1.
Experimental design process.
Figure 2.
Changes in sulfate concentration ((a). SSP1–2.6-HIST, (b). SSP5–8.5-HIST, unit: μg/m2) and distribution of AOD ((c). SSP1–2.6-HIST, (d). SSP5–8.5-HIST); dots indicate passing the 90% paired t-test. The gray line areas are SA and EA from left to right respectively.
Figure 2.
Changes in sulfate concentration ((a). SSP1–2.6-HIST, (b). SSP5–8.5-HIST, unit: μg/m2) and distribution of AOD ((c). SSP1–2.6-HIST, (d). SSP5–8.5-HIST); dots indicate passing the 90% paired t-test. The gray line areas are SA and EA from left to right respectively.
Figure 3.
Changes in clearsky downwelling surface solar ((a). SSP1–2.6-HIST, (b). SSP5–8.5-HIST, unit: W/m2) and all-sky downwelling surface solar ((c). SSP1–2.6-HIST, (d). SSP5–8.5-HIST, unit: W/m2); dots indicate passing the 90% paired t-test. The gray line areas are SA and EA from left to right respectively.
Figure 3.
Changes in clearsky downwelling surface solar ((a). SSP1–2.6-HIST, (b). SSP5–8.5-HIST, unit: W/m2) and all-sky downwelling surface solar ((c). SSP1–2.6-HIST, (d). SSP5–8.5-HIST, unit: W/m2); dots indicate passing the 90% paired t-test. The gray line areas are SA and EA from left to right respectively.
Figure 4.
Spatial distribution of low cloud cover ((a). SSP1–2.6-HIST, (b). SSP5–8.5-HIST, unit: %) and high cloud cover ((c). SSP1–2.6-HIST, (d). SSP5–8.5-HIST, unit: %) variations; dots indicate passing the 90% paired t-test. The gray line areas are SA and EA from left to right respectively.
Figure 4.
Spatial distribution of low cloud cover ((a). SSP1–2.6-HIST, (b). SSP5–8.5-HIST, unit: %) and high cloud cover ((c). SSP1–2.6-HIST, (d). SSP5–8.5-HIST, unit: %) variations; dots indicate passing the 90% paired t-test. The gray line areas are SA and EA from left to right respectively.
Figure 5.
Changes in vertically integrated droplet concentration ((a). SSP1–2.6-HIST, (b). SSP5–8.5-HIST, unit: 1010/m2) and total grid-box cloud water path ((c). SSP1–2.6-HIST, (d). SSP5–8.5-HIST, unit: g/m2); dots indicate passing the 90% paired t-test. The gray line areas are SA and EA from left to right respectively.
Figure 5.
Changes in vertically integrated droplet concentration ((a). SSP1–2.6-HIST, (b). SSP5–8.5-HIST, unit: 1010/m2) and total grid-box cloud water path ((c). SSP1–2.6-HIST, (d). SSP5–8.5-HIST, unit: g/m2); dots indicate passing the 90% paired t-test. The gray line areas are SA and EA from left to right respectively.
Figure 6.
Surface temperature ((a). SSP1–2.6-HIST, (b). SSP5–8.5-HIST, unit: K) and precipitation ((c). SSP1–2.6-HIST, (d). SSP5–8.5-HIST, unit: mm/day) responses to change; dots indicate passing the 90% paired t-test. The gray line areas are SA and EA from left to right respectively.
Figure 6.
Surface temperature ((a). SSP1–2.6-HIST, (b). SSP5–8.5-HIST, unit: K) and precipitation ((c). SSP1–2.6-HIST, (d). SSP5–8.5-HIST, unit: mm/day) responses to change; dots indicate passing the 90% paired t-test. The gray line areas are SA and EA from left to right respectively.
Figure 7.
Sea-level pressure and 850 hPa wind field response ((a). SSP1–2.6-HIST, (b). SSP5–8.5-HIST, the shaded area indicates sea-level pressure, unit: hPa, the arrows represent the wind field, unit: m/s). Meridional circulation response ((c). SSP1–2.6-HIST, (d). SSP5–8.5-HIST) and zonal average changes in vertical velocity (ω = dp/dt); negative values represent rising air (unit: 10−3 Pa/s).
Figure 7.
Sea-level pressure and 850 hPa wind field response ((a). SSP1–2.6-HIST, (b). SSP5–8.5-HIST, the shaded area indicates sea-level pressure, unit: hPa, the arrows represent the wind field, unit: m/s). Meridional circulation response ((c). SSP1–2.6-HIST, (d). SSP5–8.5-HIST) and zonal average changes in vertical velocity (ω = dp/dt); negative values represent rising air (unit: 10−3 Pa/s).
Figure 8.
Schematic diagram illustrating the dominant physical mechanisms of anthropogenic sulfate aerosol decline impacts on regional climate.
Figure 8.
Schematic diagram illustrating the dominant physical mechanisms of anthropogenic sulfate aerosol decline impacts on regional climate.
Table 1.
Overview of experimental runs.
Table 1.
Overview of experimental runs.
| Case ID | Time Period | SO2 Emission Scenario Description |
|---|
| FCHIST | 1979–2010 | Historical run using REASv3.2 emissions inventory for SO2. |
| SSP1–2.6 | 2010–2040 | Future scenario run with SO2 emissions based on the SSP1-2.6 pathway. |
| SSP5–8.5 | 2010–2040 | Future scenario run with SO2 emissions based on the SSP5-8.5 pathway. |
Table 2.
Detailed radiation variable change (unit: W/m2).
Table 2.
Detailed radiation variable change (unit: W/m2).
| Variable | EA SSP1–2.6−HIST
(Min; Max; Mean) | EA SSP5–8.5−HIST
(Min; Max; Mean) | SA SSP1–2.6−HIST
(Min; Max; Mean) | SA SSP5–8.5−HIST
(Min; Max; Mean) |
|---|
| Surface Clear-Sky Shortwave Radiation | −2.32; 4.29; −0.03 | −3.16; 4.32; 0.05 | −2.99; 0.70; −0.64 | −3.88; 0.35; −1.30 |
Surface Clear-Sky
Total Radiation | −8.90; 3.67; −0.38 | −6.05; 8.55; −0.28 | −6.12; 8.67; −0.26 | −5.21; 12.23; −1.25 |
Surface Total
Radiation | −8.73; 6.27; −0.64 | −10.14; 10.79; −0.42 | −6.11; 13.89; 0.73 | −5.55; 16.25; 0.14 |
Surface Shortwave
Radiation | −6.55; 5.87; −0.32 | −7.88; 7.80; −0.23 | −4.18; 11.03; 0.36 | −3.93; 12.38; 0.13 |
Surface Longwave
Radiation | −3.11; 2.19; −0.33 | −2.74; 2.99; −0.19 | −1.93; 3.38; 0.37 | −1.77; 3.87; 0.01 |
TOA Clear-Sky
Total Radiation | −7.42; 3.24; −0.29 | −4.56; 7.45; −0.60 | −4.92; 7.44; 0.20 | −4.17; 10.62; −0.31 |
| TOA Clear-Sky Shortwave Radiation | −6.20; 2.62; −0.28 | −33.84; 5.92; −0.34 | −4.24; 5.45; −0.33 | −3.99; 8.22; −0.50 |
| TOA Clear-Sky Longwave Radiation | −1.39; 0.76; −0.01 | −1.01; 1.53; −0.26 | −0.68; 1.99; 0.53 | −0.55; 2.40; 0.19 |
| TOA Total Radiation | −7.81; 5.14; −0.45 | −9.02; 8.38; −0.52 | −4.80; 10.55; 0.96 | −4.31; 12.47; 0.58 |
TOA Shortwave
Radiation | −7.62; 5.85; −0.25 | −8.45; 7.41; −0.14 | −3.87; 10.85; 0.50 | −3.21; 12.02; 0.61 |
TOA Longwave
Radiation | −2.75; 1.91; −0.19 | −3.09; 1.44; −0.38 | −1.48; 2.26; 0.46 | −1.78; 2.37; −0.03 |
Cloud Longwave
Radiation | −1.46; 2.37; 0.09 | −1.24; 2.31; 0.12 | −1.03; 2.28; 0.07 | −1.39; 2.26; 0.22 |
Cloud Shortwave
Radiation | −9.25; 6.65; 0.03 | −9.83; 5.71; 0.21 | −1.69; 5.39; 0.83 | −1.66; 4.14; 1.11 |
| Disclaimer/Publisher’s Note: The statements, opinions and data contained in all publications are solely those of the individual author(s) and contributor(s) and not of MDPI and/or the editor(s). MDPI and/or the editor(s) disclaim responsibility for any injury to people or property resulting from any ideas, methods, instructions or products referred to in the content. |