Abstract
This study utilizes ambient air quality monitoring data from 13 prefecture-level cities in Heilongjiang Province to systematically analyze the pollution characteristics and dynamic evolution of ozone (O3) and non-methane hydrocarbons (NMHCs). The findings reveal that overall air quality in Heilongjiang Province has improved substantially in recent years. The concentrations of SO2, NO2, PM10, PM2.5 and CO in 2023 decreased significantly compared with 2015, with an average reduction of 38.7%. However, O3 concentrations have continued to rise, indicating that O3 pollution has become an increasingly pressing environmental concern. On an annual scale, the monthly average O3 concentration in 2023 displayed a “clear single-peak” pattern, reaching its maximum in June, at a concentration of 139 μg/m3. In contrast, the monthly average NMHC concentration exhibited a “distinct double-peak” pattern, with elevated levels in January and December, at 59.4 and 48.35 μg/m3, respectively. From an hourly perspective, the highest O3 concentrations across the 13 cities occurred between 11:00 and 17:00, while NMHC concentrations showed an opposite trend. Furthermore, during the heating season (October to April of the following year), O3 and NMHC concentrations increased by 0.78 and 1.56 times, respectively, compared with the non-heating season. In terms of ambient air quality levels, both O3 and NMHC concentrations exhibited a gradual upward trend under conditions of “excellent”, “good”, and “light pollution”. However, under “moderate pollution”, “heavy pollution”, and “severe pollution” levels, O3 and NMHC concentrations exhibited irregular patterns, likely due to the interaction of multiple complex factors. O3 pollution follows a “central concentration and peripheral diffusion” pattern, reflecting the combined influence of human activities and natural conditions. In contrast, NMHC concentrations display pronounced spatial heterogeneity, with low levels in the west and high levels in the east, primarily driven by regional differences in industrial structure and environmental conditions. In summary, this study aims to elucidate the spatiotemporal distribution characteristics of O3 and NMHC pollution in Heilongjiang Province and their complex relationship with air quality levels, providing a scientific basis for future pollution prevention and control strategies. Subsequent research should focus on identifying the underlying causes of pollution to develop more precise and effective mitigation measures, thereby continuously improving ambient air quality in the province.
1. Introduction
In the context of global climate change, ambient air quality is not merely regional concern but a pressing global challenge [1,2,3,4]. Outdoor air pollution also affects indoor air, where humans spend extended periods, exerting significant impacts on human health [5]. To address this challenge, the Chinese government has implemented a series of policies and measures [6,7,8], including the formulation and execution of the Plan for Continuous Improvement of Air Quality and the Implementation Plan for Deepening Action to Eliminate Heavily Polluted Weather, strategies for preventing and controlling O3 pollution, measures to curb emissions from diesel trucks, promotion of energy structural adjustments [9], the strengthening of industrial pollution control [10], and the encouragement of new energy vehicle adoption [11,12]. These initiatives have successfully slowed the deterioration of air quality to some extent and have yielded initial improvements in certain regions. However, some pollutants, particularly O3, continue to show an increasing trend [13,14,15,16].
O3 is a major atmospheric pollutant that poses a substantial threat to both human health and environmental safety [17]. Ground-level ozone is a potent oxidant [17,18,19,20], elevated atmospheric ozone levels can infiltrate indoor environments, leading to chronic health effects [21,22]. Elevated ozone concentrations can directly damage the human respiratory system, causing airway inflammation [23], reduced lung function [23,24,25], and triggering asthma attacks [26,27]. Additionally, ozone’s strong oxidative properties can negatively affect agricultural productivity and ecosystem health [28]. NMHCs, which are primary precursors of ozone [29,30,31], play a key role in ozone formation and but can also impact human health directly or indirectly [32,33]. Certain NMHC compounds are hazardous, exhibiting carcinogenic, mutagenic, and reproductive toxicity effects [34,35,36]. Prolonged exposure to these compounds may increase the risk of cancer and other chronic diseases. Furthermore, NMHCs can generate secondary organic aerosols through photochemical reactions in the atmosphere [30,37,38,39,40]. These fine particulate matters can penetrate deep into the lungs, causing severe respiratory damage.
Heilongjiang Province is located in the northeastern border of China and exhibits distinct cold-region climatic characteristics [41,42], including long winters [43], short springs and autumns, and relatively brief summers. Such climatic conditions significantly influence the formation, diffusion, and deposition of atmospheric pollutants [44,45,46]. Moreover, the province’s industrial structure and energy consumption patterns further affect pollutant emissions [47,48,49,50]. The interplay of seasonal variations in pollution and energy consumption presents considerable health risks to local residents, making effective monitoring and control measures imperative. Statistical analyses indicate that overall air quality in Heilongjiang Province has improved over the past eight years, evidenced by a reduction in the number of days classified as ‘heavy pollution’ and ‘severe pollution’. Significant declines have been observed in the concentrations of PM10, PM2.5, SO2, NO2, and CO, while the concentration of O3 has shown an upward trend, with an increase in the number of days experiencing excessive O3 levels. This suggests that O3 pollution in the province remains a significant concern.
Currently, research on atmospheric pollution in cold regions remains limited, particularly with respect to O3 and NMHCs. Conducting a detailed investigation into the characteristics of O3 and NMHC pollution in Heilongjiang Province therefore of high scientific and practical significance. The objectives of this study are to elucidate pollution patterns and key influencing factors, evaluate the effectiveness of existing pollution control measures, and support sustainable regional development. The findings are expected to provide a scientific basis and technical guidance for air pollution prevention and control in Northeast China, as well as serve as an important reference for other cold region areas worldwide. Furthermore, this research aims to raise public awareness of O3 and its precursors, strengthen environmental protection consciousness, encourage global response to climate change, improve the living environments, and promote sustainable development.
2. Sources and Methods
2.1. Data Sources
Heilongjiang Province, China, was selected as the study area, encompassing all prefecture level in cities, including Harbin, Qiqihar, Mudanjiang, Jiamusi, Daqing, Jixi, Shuangyashan, Yichun, Qitaihe, Hegang, Heihe, Suihua, and Daxing’anling. The locations of the monitoring sites in each city are shown in Figure 1. The surroundings of each monitoring site are relatively open, with no tall trees or buildings obstructing airflow, and no fixed pollution sources nearby, thereby providing an accurate representation of urban air quality. Continuous 24 h monitoring was conducted throughout 2023. O3 and NMHC concentrations were measured in micrograms per cubic meter (μg/m3). For seasonal classification, March to May was defined as spring, June to August as summer, September to November as autumn, and January, February and December as winter. Additionally, the heating period was defined as January–April and October–December, and while May–September was designated as the non-heating period.
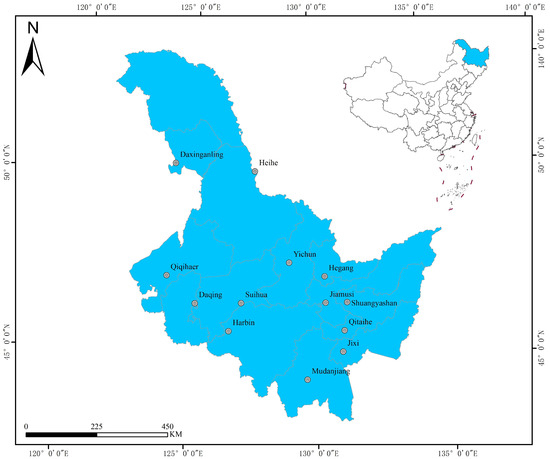
Figure 1.
Map of automatic monitoring sites in 13 cities in Heilongjiang Province.
2.2. Instruments and Methods
Online NMHC monitoring across the 13 cities was performed using EXPEC 2000-710F online gas chromatography analyzers (methane/non-methane total hydrocarbons) manufactured by Hangzhou Puyu Technology Development Co. (Hangzhou, China) The detectors were flame ionization detectors (FID) (Hangzhou Puyu Technology Development Co., Hangzhou, China) operating at 80 °C. Pre-column pressures were set at 90.0 kPa (No. 1) and 60.0 kPa (No. 2), with the column oven temperature at 80 °C and a programmed temperature ramp to 180 °C. The air flow rate was maintained at 300 mL/min, hydrogen flow at 35.0 mL/min, and the valve box temperature at 80.0 °C. O3 concentrations were measured using an automatic monitoring instrument based on the ultraviolet absorption method, which is a standard and widely accepted approach.
2.3. Quality Control
At each urban monitoring site, instruments were operated and maintained by trained professionals. Instrument status and monitoring data were checked remotely on a daily basis. On-site quality control measures were conducted weekly, monthly, quarterly, and semi-annually as required. Weekly calibration ensured the accuracy and reliability of the monitoring data.
2.4. Data Processing and Analysis
The monitoring data for O3 and NMHCs in ambient air were subjected to statistical analysis using the statistical software SPSS (Version: V26.0) and Origin (Version: 10.1).
3. Results and Discussion
3.1. Characteristics of Ambient Air Quality Changes in Heilongjiang Province
Beginning in 2015, the automatic monitoring indicators for ambient air in 13 cities of Heilongjiang Province were standardized to six pollutants: SO2, NO2, PM10, PM2.5, O3 and CO. Figure 2 illustrates the trends in pollutant concentrations from 2015 to 2023, showing a clear decline for all pollutants except O3. Specifically, in 2023, the concentrations of SO2, NO2, PM10, PM2.5 and CO decreased by 57.9%, 18.2%, 35.9%, 37.5% and 43.8%, respectively, resulting in an average reduction of 38.7%. This decline reflects a substantial improvement in ambient air quality in Heilongjiang Province. From 2015 to 2023, O3 concentrations exhibited an overall increasing trend, particularly from 2016 to 2021, during which annual rises were observed. In 2022, O3 levels showed a slight decrease compared to 2021, but in 2023, growth resumed, with a 9.2% increase relative to 2015. While the other five pollutants experienced an average decline of 38.7%, O3 concentrations increased instead of decreasing. This indicates that there has been a significant improvement in ambient air quality in Heilongjiang Province, suggesting that the O3 pollution situation in the province is serious and there is a risk of increasing pollution year by year. It is important to note that O3 is a secondary pollutant [51,52,53], not emitted directly, highlighting the necessity for focused research on O3 precursors and the development of targeted mitigation strategies.
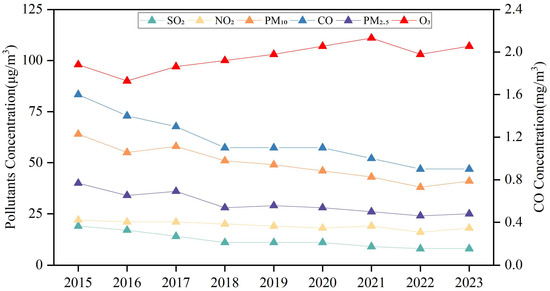
Figure 2.
Changes in concentrations of six pollutants in Heilongjiang Province, 2015–2023.
3.2. Overall Characterization of O3 and NMHC Concentrations in Heilongjiang Province
To facilitate a more in-depth investigation of ozone pollution characteristics in Heilongjiang Province and the temporal patterns of its precursors, monitoring data from the entire year of 2023 were analyzed. As shown in Figure 3, the monthly average concentration of O3 in the province ranged from 63 to 139 μg/m3 throughout the year, with an annual mean of 95 μg/m3. The maximum concentration occurred in June, while the minimum was recorded in December. Over the course of the year, O3 concentrations exhibited a distinct “single-peak” fluctuation pattern, with two clearly segmented phases: from January to June, O3 concentrations increased steadily, averaging 107 μg/m3, whereas from July to December, a downward trend was observed, with an average of 83 μg/m3.
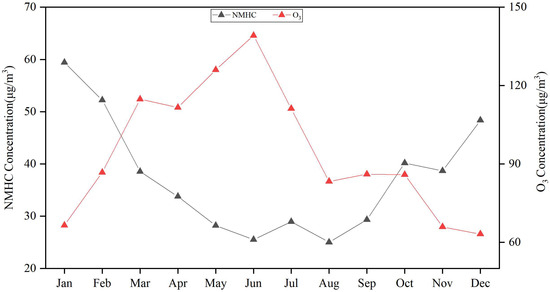
Figure 3.
Time series trend of monthly mean NMHCs and O3 in Heilongjiang Province in 2023.
The result was observed in the time series analysis of monthly average NMHC concentrations in Heilongjiang Province (Figure 3). Values ranged from 25.0 to 59.4 μg/m3, with an annual average of 37.4 μg/m3. The peak concentration was recorded in January, while the lowest value occurred in June, coinciding with the highest monthly average O3 concentration. Over the course of a year, NMHC concentrations exhibit a clear bimodal pattern. The highest levels are observed from January to March, averaging 50.1 μg/m3; the lowest concentrations occur from April to September, averaging 28.5 μg/m3. From October to December, NMHC concentrations rise again, with an average of 42.4 μg/m3.
Seasonal average NMHC concentrations were calculated accordingly. As illustrated in Figure 4, NMHCs exhibited a clear seasonal pattern, with higher levels in autumn and winter and lower levels in spring and summer; the autumn–winter concentrations were approximately 1.49 times those in spring–summer. A similar seasonal pattern was observed for O3, which showed higher concentrations in spring and summer and lower levels in autumn and winter, with spring–summer concentrations approximately 1.51 times those in autumn–winter.
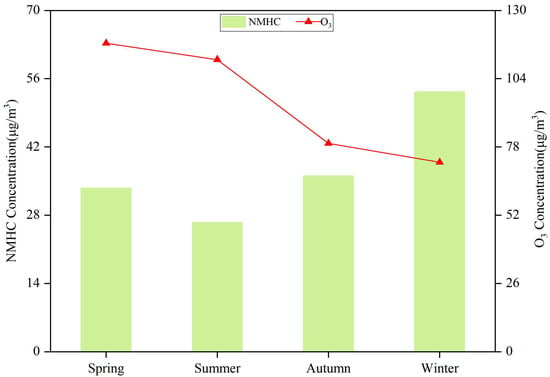
Figure 4.
Characteristics of NMHCs and O3 emissions in different seasons in Heilongjiang Province in 2023.
3.3. Characteristics of Temporal Distribution of NMHC and O3 Concentrations in Cities of Heilongjiang
3.3.1. Characteristics of Monthly Changes
The monthly trends of O3 and NMHCs across the 13 cities in Heilongjiang Province in 2023 are shown in Figure 5 and Figure 6. These trends are consistent with the overall provincial patterns and exhibit pronounced monthly variations. NMHCs, as known precursors of O3, show a clear negative correlation with O3 based on analysis of the monthly time-series data from the various cities. From April to September, high temperatures and intense sunlight create favorable conditions for ground level photochemical reactions, promoting substantial secondary reactions of NMHCs and resulting in O3 formation. Consequently, NMHC concentrations in urban areas across the province reach their lowest levels during spring and summer. In contrast, during autumn and winter, meteorological conditions in the northeast are less favorable for pollutant dispersion, facilitating accumulation. Under conditions of low light, low temperatures and high humidity, the photochemical reactivity of NMHCs, NOx and CO is reduced, leading to lower O3 production in secondary reactions and reduced NMHC consumption [54,55,56].
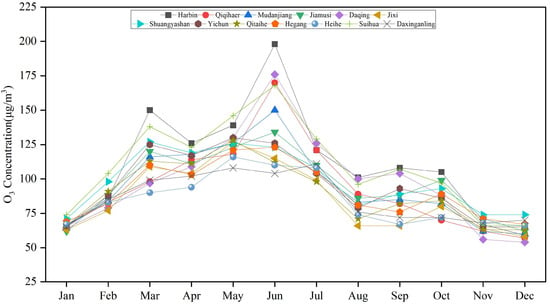
Figure 5.
Time series trend of monthly mean O3 values in cities of Heilongjiang Province in 2023.
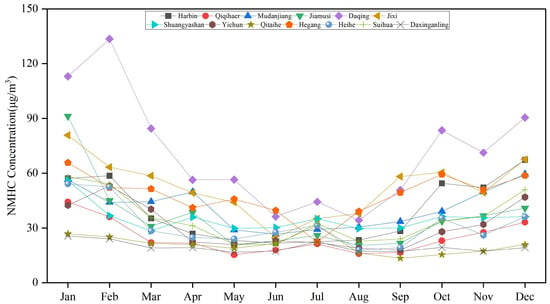
Figure 6.
Time series trend of monthly mean NMHC values in cities of Heilongjiang Province in 2023.
Furthermore, although overall NMHC concentrations remain relatively low from April to September, rising temperatures can enhance the formation of VOCs, such as aldehydes and ketones, through intensified photochemical reactions and the cumulative effect of increased emissions from human activities. The rate of increase in concentration will exceed the rate of consumption, and the NMHC concentration in the air will also show a slight upward trend to a certain extent. A similar phenomenon is expected to occur in July, when temperatures in urban areas across the province reach their annual peak.
3.3.2. Characteristics of Hourly Variations
As shown in Figure 7, the hourly trends of ozone concentrations across cities in Heilongjiang Province exhibit a consistent pattern: a gradual decline from 0:00 to 7:00, a rapid increase from 8:00 to 15:00, followed by a sharp decrease from 16:00 onward. Peak ozone concentrations in each city occur during the late morning to afternoon period [57,58], coinciding with the peak of solar radiation [59,60,61]. The heightened sunlight intensity during this period promotes photochemical reactions, which drive ozone formation. In contrast, the hourly concentrations of NMHCs, the primary precursor of ozone, display an opposite trend (Figure 8). Maximum NMHC levels are observed during nighttime or early morning hours. After 17:00, NMHC concentrations generally increase across all cities, indicating that the subsequent meteorological conditions are unfavorable for ozone formation, and the consumption of NMHCs is therefore incomplete. Furthermore, from 0:00 to 6:00, NMHC concentrations remain relatively stable despite a decline in human production activities, suggesting that anthropogenic emissions have a substantial impact on NMHC levels.
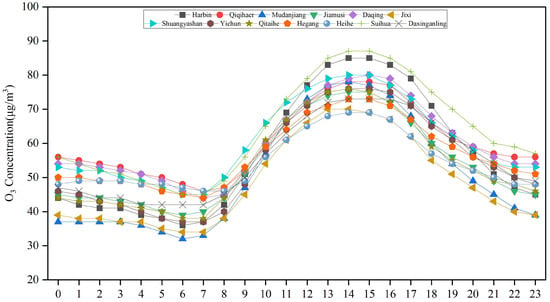
Figure 7.
Time series trend of O3 hourly values in cities of Heilongjiang Province in 2023.
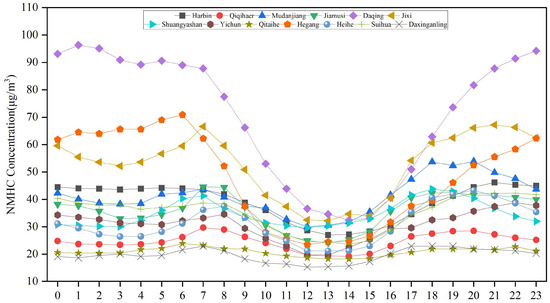
Figure 8.
Time series trend of NMHC hourly values by cities in Heilongjiang Province in 2023.
3.3.3. Characteristics of Changes in the Heating and Non-Heating Seasons
As shown in Figure 9, O3 concentrations across the 13 cities were higher during the non-heating season compared to the heating season, with the differences being statistically significant. The largest disparity was observed in Daqing, where O3 concentrations in the non-heating season were approximately 1.63 times those in the heating season. This was followed by Qiqihar and Harbin, where non-heating season concentrations were 1.48 and 1.42 times higher than in the heating season, respectively. In Shuangyashan, O3 concentrations in the non-heating season were only slightly higher, at approximately 1.12 times the heating season.
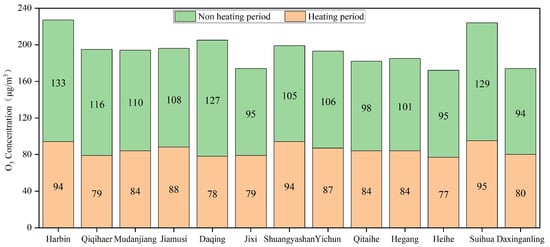
Figure 9.
Distribution of O3 concentration in heating and non-heating seasons in cities of Heilongjiang Province in 2023.
As shown in Figure 10, NMHC concentrations across the 13 cities were significantly higher during the heating season compared to the non-heating season. The most pronounced difference was observed in Harbin, where NMHC levels during the heating season were approximately 2.10 times those of the non-heating season. This was followed by Daqing and Jiamusi, where heating season concentrations were 2.03 and 2.02 times higher than in the non-heating season, respectively. In Qitaihe, the NMHC concentration in the heating season was marginally higher than that in the non-heating season, and the NMHC concentration in the heating season was approximately 1.04 times that in the non-heating season.
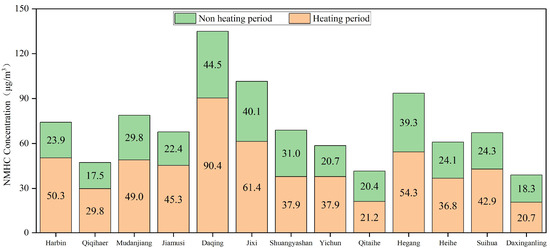
Figure 10.
Distribution of NMHC concentration in heating and non-heating seasons by cities in Heilongjiang Province in 2023.
These seasonal variations of O3 and NMHC indicate that the concentration differences between the two pollutants are more pronounced in cities with highly developed industries, such as Harbin and Daqing. This suggests that industrial emissions dominate the local emission structure, and that seasonal fluctuations in production intensity significantly amplify temporal variations in pollutant concentrations. Therefore, it is recommended to strengthen the management and control of industrial sources and to optimize production capacity on a seasonal basis in order to mitigate ozone pollution.
3.4. Changes in O3 and NMHC Concentrations at Different Air Quality Levels in Heilongjiang Province
3.4.1. Change in O3 Concentration
O3 concentrations across different air quality levels (excellent, good, lightly polluted, moderately polluted, heavily polluted, and severely polluted) in 13 cities of the province were analyzed. As shown in Figure 11, under excellent, good, and lightly polluted conditions, O3 concentrations display a clear upward trend with increasing pollution levels. This pattern is largely due to ozone being the dominant pollutant during the non-heating season in Heilongjiang Province, particularly within the good and lightly polluted categories. To some extent, ozone concentration influences variations in overall air quality. In contrast, moderately, heavily, and severely polluted conditions do not show a consistent increase in ozone concentration with rising pollution levels. These higher pollution categories mostly occur during the heating season, when low temperatures and other unfavorable conditions limit ozone formation. Nonetheless, some cities have experienced heavily and severely polluted episodes, with peak ozone levels primarily linked to straw burning, which is a significant contributor to these pollution peaks. During straw burning periods, large amounts of volatile organic compounds are emitted [62,63,64,65,66], which then react to generate ozone. In cases of severe pollution in Heilongjiang Province, PM2.5 and PM10 remain the primary pollutants, with ozone not playing a dominant role.
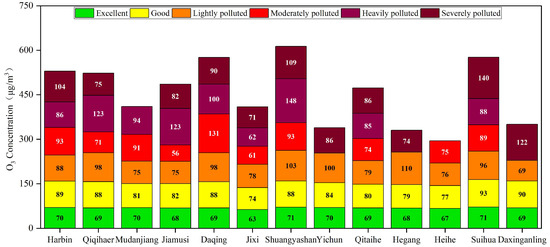
Figure 11.
Distribution of O3 concentration in cities under different pollution level conditions.
3.4.2. Change in NMHC Concentrations
As shown in Figure 12, NMHC concentrations under excellent, good and lightly polluted conditions follow a similar pattern to that of ozone, exhibiting a clear upward trend with increasing pollution levels. However, the total NMHC concentration is considerably lower than that of ozone, as NMHCs serve as common precursors for both ozone and particulate matter. When air quality reaches moderately, heavily, and severely polluted levels, NMHC concentrations decrease in some cities, and the positive correlation between NMHC levels and air quality is no longer evident. During the northern winter heating period, stable meteorological conditions characterized by and high humidity and stagnant air are more conducive to the formation of secondary inorganic matter. In such conditions, particulate matter is mainly composed of inorganic salts formed through the secondary transformation of gaseous pollutants (SO2, NOx, and NH3), while the proportion of organic aerosol ions derived from the secondary formation of NMHCs remains relatively small.
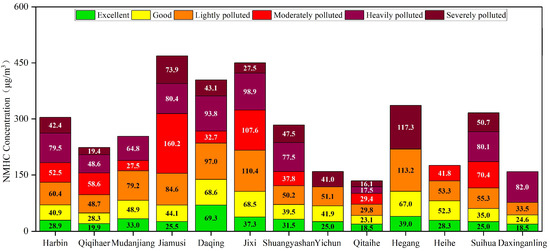
Figure 12.
Distribution of NMHC concentration in cities under different pollution level conditions.
From the variations in O3 and NMHC concentrations across different air quality levels, it can be observed that during moderate and higher pollution periods in Heilongjiang Province, the correlation between O3 and NMHC concentrations is relatively weak.
3.5. Characteristics Analysis of O3 and NMHC Pollution in Heilongjiang Province at Spatial Latitude
3.5.1. Change in O3 Concentration
Geospatial analyses revealed pronounced spatial heterogeneity in both O3 and NMHC pollution. As shown in Figure 13, O3 pollution displays a distribution pattern characterized by “central concentration and peripheral diffusion.” O3 concentrations in the central urban clusters of Harbin, Suihua and Daqing are markedly higher than those in cities with extensive ecological protection zones, such as Heihe and Daxinganling. This difference primarily results from the combined influence of anthropogenic activities and natural factors. Intensive industrial operations (e.g., the Daqing petrochemical industry), traffic emissions, and agricultural practices (e.g., straw burning, and fertilizer use) emit large quantities of ozone precursors such as nitrogen oxides (NOx) and volatile organic compounds (VOCs), which subsequently react under ultraviolet radiation to form ozone. The central region often experiences stagnant and stable meteorological conditions accompanied by inversion layers that restrict vertical dispersion of pollutants. Moreover, the flat topography of plains and basins, along with dense clusters of high-rise buildings, further limits horizontal diffusion [67,68,69], leading to the continuous accumulation of pollutants. In contrast, ecological areas such as Heihe and Daxinganling are characterized by minimal industrial activity, areas vegetation cover, and open terrain conducive to pollutant dispersion. However, the emission of biogenic VOCs from forested areas can also contribute to ozone [70].
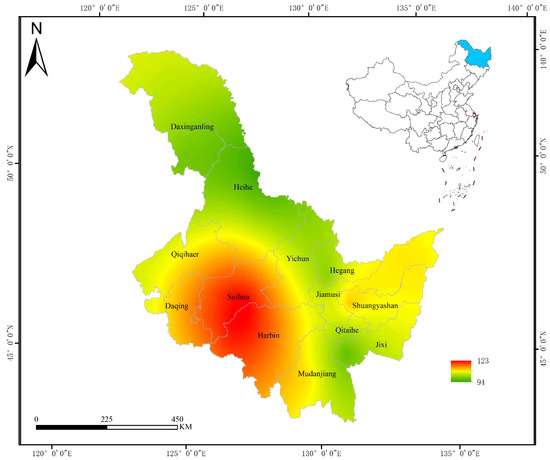
Figure 13.
Distribution of annual average O3 concentrations in various cities of Heilongjiang province.
3.5.2. Change in NMHC Concentration
As shown in Figure 14, NMHC concentrations exhibit marked spatial differences. Daqing, Jixi and Hegang, have been identified as areas of concern due to exceptionally high concentrations, exceeding the provincial average by 93.5%, 42.7% and 30.4%, respectively. In contrast, Daxinganling and Qitaihe are classified as low-value regions, with concentrations reaching only 27.7% and 30.4% of those observed in Daqing. This variation can be attributed to the distinct industrial structures and environmental conditions characteristic of each region. Resource-dependent industries, such as petrochemical production in Daqing and coal mining and processing in Jixi and Hegang, are concentrated in the high-value zone, where substantial amounts of hydrocarbon compounds are released during production. These emissions, together with those from traffic exhaust, industrial solvent use, and agricultural straw burning, directly elevate NMHC concentrations. By contrast, horizontal dispersion in these regions is limited and vertical mixing is weak, causing a persistent accumulation of local emissions. Ecological reserves such as Daxinganling are dominated by forest cover and have little industrial activity; vegetation therefore reduces NMHC concentrations through absorption and biochemical degradation, while the mountainous terrain enhances atmospheric flow and promotes pollutant dilution. Although cities such as Qitaihe and Yichun host some industry, environmental protection measures and industrial restructuring have likely reduced emission intensity. Consequently, NMHC concentrations show a pronounced contrast that reflects the differing development models: concentrated heavy industry in the versus ecological-priority development. This divergence underlines distinct impacts on the atmospheric environment: O3 formation is largely driven by photochemical processes, whereas NMHC concentrations are more directly controlled by the intensity of industrial emissions, highlighting the spatial coupling between anthropogenic activity patterns and natural carrying capacity.
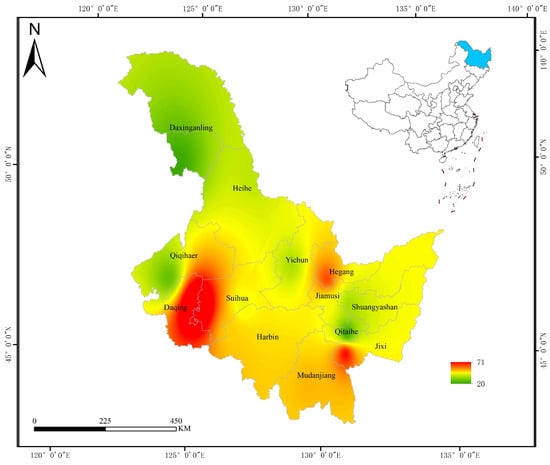
Figure 14.
Distribution of annual average NMHC concentrations in various cities of Heilongjiang Province.
4. Conclusions
This study provides an in-depth analysis of the spatial and temporal variability of O3 and NMHC pollution in Heilongjiang Province, along with differences in their driving mechanisms. Although conventional pollutants have improved significantly, the continued rise in O3 concentrations highlights its role as a key bottleneck in achieving sustainable regional air quality optimization. Temporally, O3 concentrations exhibit a single-peak pattern dominated by summer, with peak values strongly correlated with the intensity of photochemical reactions driven by enhanced solar radiation. In contrast, NMHC concentrations display a winter bimodal pattern, directly associated with the seasonal increase in fossil fuel combustion during the heating period. Moreover, O3 levels peak during the daytime (11:00–17:00), whereas NMHC concentrations are higher at night. This diurnal contrast reflects their distinct formation mechanisms: O3 production depends on sunlight-driven photochemical reactions, while NMHC levels are primarily influenced by anthropogenic emissions. Notably, NMHC concentrations were substantially higher during the heating season than in the non-heating season, whereas O3 concentrations showed the opposite trend. This suggests that the inhibitory effects of low temperatures and weak solar radiation on photochemical reactions outweigh the positive influence of increased precursor concentrations. Pollution-level analysis revealed a strong correspondence between O3 and NMHC concentration gradients under low-pollution conditions. However, the nonlinear response of both pollutants under moderate and high pollution scenarios underscores the moderating influence of complex factors such as meteorological conditions and regional atmospheric transport.
With respect to spatial distribution, pronounced regional differences are evident in the pollution patterns of O3 and NMHCs. O3 forms a typical convergence zone within the central urban agglomeration, where precursors emitted from industrial, transportation, and agricultural sources accumulate through photochemical reactions under stable meteorological conditions. In contrast, ecological barrier zones benefit from vegetation uptake and topography-induced dispersion, which enhance pollutant diffusion. High-intensity NMHC emissions are concentrated in the eastern resource-based industrial clusters, where spatial heterogeneity is primarily governed by the distribution of heavy industries, the regional energy structure, and topographic diffusion conditions. This heterogeneous pattern reflects the dynamic interplay between human activity intensity and the natural environment’s carrying capacity. While O3 pollution is jointly influenced by the rate of photochemical production and natural scavenging capacity, NMHC concentrations more directly represent the spatial distribution of industrial emission sources.
Author Contributions
Conceptualization, P.W., Q.M. and L.H.; Data curation, J.G.; Formal analysis, J.J. and L.H.; Methodology, P.W., Z.Y. and X.W.; Resources, X.W.; Software, X.S. and L.H.; Supervision, Y.Z.; Visualization, R.Z.; Writing—original draft, P.W. and Y.Z.; Writing—review and editing, P.G. and Q.M. All authors have read and agreed to the published version of the manuscript.
Funding
This research received no external funding.
Institutional Review Board Statement
Not applicable.
Informed Consent Statement
Not applicable.
Data Availability Statement
The data presented in this study are available on request from the corresponding author.
Conflicts of Interest
The authors declare no conflicts of interest.
References
- Tang, D.; Mi, T.; Zheng, X.; Yang, M.; Grieneisen, M.L.; Zhan, Y.; Yang, F. Harmonizing Low-Cost and Regulatory Air Quality Monitoring Networks with Interpretable Semi-Supervised Learning: Reducing Exposure Misclassification in Underrepresented Communities. J. Hazard. Mater. 2025, 491, 137893. [Google Scholar] [CrossRef]
- Xu, Y.; Zhou, S.-C.; Feng, Y.-X.; Zou, B.; He, C. Global Air Quality Enhancement Pathways to Health Benefits and Environmental Justice. J. Hazard. Mater. 2024, 480, 136460. [Google Scholar] [CrossRef]
- Ma, X.; Morawska, L.; Zou, B.; Gao, J.; Deng, J.; Wang, X.; Wu, H.; Xu, X.; Wang, Y.; Tan, Z.; et al. Towards Compliance with the 2021 WHO Air Quality Guidelines: A Comparative Analysis of PM2.5 Trends in Australia and China. Environ. Int. 2025, 198, 109378. [Google Scholar] [CrossRef]
- Huang, Y.; Li, Z. Assessing Pesticides in the Atmosphere: A Global Study on Pollution, Human Health Effects, Monitoring Network and Regulatory Performance. Environ. Int. 2024, 187, 108653. [Google Scholar] [CrossRef]
- Yang, J.; Seo, J.-H.; Jee, Y.-K.; Kim, Y.-K.; Sohn, J.-R. Composition Analysis of Airborne Microbiota in Outdoor and Indoor Based on Dust Separated by Micro-Sized and Nano-Sized. Aerosol Air Qual. Res. 2023, 23, 210231. [Google Scholar] [CrossRef]
- Xu, M.; Zhang, S.; Xie, Y. Impacts of the Clean Residential Combustion Policies on Environment and Health in the Beijing-Tianjin-Hebei Area. J. Clean. Prod. 2023, 384, 135560. [Google Scholar] [CrossRef]
- Shao, T.; Wang, P.; Yu, W.; Gao, Y.; Zhu, S.; Zhang, Y.; Hu, D.; Zhang, B.; Zhang, H. Drivers of Alleviated PM2.5 and O3 Concentrations in China from 2013 to 2020. Resour. Conserv. Recycl. 2023, 197, 107110. [Google Scholar] [CrossRef]
- Yang, X.; Ben, B.; Wang, W.; Long, B.; Xie, Y.; Wu, K.; Zhang, X. Fine Particulate Matter Pollution in the Sichuan Basin of China from 2013 to 2020: Sources, Emissions, and Mortality Burden. Environ. Int. 2025, 197, 109366. [Google Scholar] [CrossRef] [PubMed]
- Wei, Y.; Zou, Q.; Lin, X. Evolution of Price Policy for Offshore Wind Energy in China: Trilemma of Capacity, Price and Subsidy. Renew. Sustain. Energy Rev. 2021, 136, 110366. [Google Scholar] [CrossRef]
- Yang, S.; Jahanger, A.; Hossain, M.R. How Effective Has the Low-Carbon City Pilot Policy Been as an Environmental Intervention in Curbing Pollution? Evidence from Chinese Industrial Enterprises. Energy Econ. 2023, 118, 106523. [Google Scholar] [CrossRef]
- Zhao, S.; Ma, C. Research on the Coordination of the Power Battery Echelon Utilization Supply Chain Considering Recycling Outsourcing. J. Clean. Prod. 2022, 358, 131922. [Google Scholar] [CrossRef]
- Wu, Z.; He, Q.; Li, J.; Bi, G.; Antwi-Afari, M.F. Public Attitudes and Sentiments towards New Energy Vehicles in China: A Text Mining Approach. Renew. Sustain. Energy Rev. 2023, 178, 113242. [Google Scholar] [CrossRef]
- Chen, S.; He, Y.; Jiang, M.; You, Q.; Ma, X.; Xu, Z.; Bo, X. Unveiling the Importance of VOCs from Pesticides Applicated in Main Crops for Elevating Ozone Concentrations in China. J. Hazard. Mater. 2023, 465, 133385. [Google Scholar] [CrossRef]
- Chen, L.; Mao, F.; Hong, J.; Zang, L.; Chen, J.; Zhang, Y.; Gan, Y.; Gong, W.; Xu, H. Improving PM2.5 Predictions during COVID-19 Lockdown by Assimilating Multi-Source Observations and Adjusting Emissions. Environ. Pollut. 2021, 297, 118783. [Google Scholar] [CrossRef] [PubMed]
- Wei, J.; Liu, S.; Li, Z.; Liu, C.; Qin, K.; Liu, X.; Pinker, R.T.; Dickerson, R.R.; Lin, J.; Boersma, F.; et al. Ground-Level NO2 Surveillance from Space across China for High Resolution Using Interpretable Spatiotemporally Weighted Artificial Intelligence. Environ. Sci. Technol. 2022, 56, 9988–9998. [Google Scholar] [CrossRef]
- Wang, Z.; Zhu, L.; Peng, M.; Zheng, H.; Zhang, Y. Summer Heatwave, Ozone Pollution and Ischemic Stroke Mortality: An Individual-Level Case-Crossover Study. Environ. Res. 2025, 268, 120818. [Google Scholar] [CrossRef]
- Zheng, D.; Huang, J.; Fang, Y.; Deng, Y.; Peng, C.; Dehaen, W. Fluorescent Probes for Ozone-Specific Recognition: An Historical Overview and Future Perspectives. Trends Environ. Anal. 2023, 38, e00201. [Google Scholar] [CrossRef]
- Ninneman, M.; Petropavlovskikh, I.; Effertz, P.; Chand, D.; Jaffe, D. Investigation of the Parameters Influencing Baseline Ozone in the Western United States: A Statistical Modeling Approach. Atmosphere 2022, 13, 1883. [Google Scholar] [CrossRef]
- Zerillo, L.; Polvere, I.; Varricchio, R.; Madera, J.R.; D’Andrea, S.; Voccola, S.; Franchini, I.; Stilo, R.; Vito, P.; Zotti, T. Antibiofilm and Repair Activity of Ozonated Oil in Liposome. Microb. Biotechnol. 2021, 15, 1422–1433. [Google Scholar] [CrossRef]
- Wang, M.; Aaron, C.P.; Madrigano, J.; Hoffman, E.A.; Angelini, E.; Yang, J.; Laine, A.; Vetterli, T.M.; Kinney, P.L.; Sampson, P.D.; et al. Association between Long-Term Exposure to Ambient Air Pollution and Change in Quantitatively Assessed Emphysema and Lung Function. JAMA 2019, 322, 546–556. [Google Scholar] [CrossRef] [PubMed]
- Zhong, L.; Lee, C.-S.; Haghighat, F. Indoor Ozone and Climate Change. Sustain. Cities Soc. 2017, 28, 466–472. [Google Scholar] [CrossRef]
- Choi, H.; Seo, J.H.; Weon, S. Visualizing Indoor Ozone Exposures via O-Dianisidine Based Colorimetric Passive Sampler. J. Hazard. Mater. 2023, 460, 132510. [Google Scholar] [CrossRef]
- Michaudel, C.; Bataille, F.; Maillet, I.; Fauconnier, L.; Colas, C.; Sokol, H.; Straube, M.; Couturier-Maillard, A.; Dumoutier, L.; van Snick, J.; et al. Ozone-Induced Aryl Hydrocarbon Receptor Activation Controls Lung Inflammation via Interleukin-22 Modulation. Front. Immunol. 2020, 11, 144. [Google Scholar] [CrossRef]
- Zuidema, C.; Stebounova, L.V.; Sousan, S.; Gray, A.; Stroh, O.; Thomas, G.; Peters, T.; Koehler, K. Estimating Personal Exposures from a Multi-Hazard Sensor Network. J. Expo. Sci. Environ. Epidemiol. 2019, 30, 1013–1022. [Google Scholar] [CrossRef]
- Kim, K.; Lim, Y.; Bae, S.; Song, I.G.; Kim, S.; Hong, Y. Age-Specific Effects of Ozone on Pneumonia in Korean Children and Adolescents: A Nationwide Time-Series Study. Epidemiol. Health 2021, 44, e2022002. [Google Scholar] [CrossRef]
- Crooks, J.L.; Licker, R.; Hollis, A.L.; Ekwurzel, B. The Ozone Climate Penalty, NAAQS Attainment, and Health Equity along the Colorado Front Range. J. Expo. Sci. Environ. Epidemiol. 2021, 32, 545–553. [Google Scholar] [CrossRef] [PubMed]
- Lai, D.; Karava, P.; Chen, Q. Study of Outdoor Ozone Penetration into Buildings through Ventilation and Infiltration. Build. Environ. 2015, 93, 112–118. [Google Scholar] [CrossRef]
- Clifton, O.E.; Fiore, A.M.; Massman, W.J.; Baublitz, C.B.; Coyle, M.; Emberson, L.; Fares, S.; Farmer, D.K.; Gentine, P.; Gerosa, G.; et al. Dry Deposition of Ozone over Land: Processes, Measurement, and Modeling. Rev. Geophys. 2020, 58, e2019RG000670. [Google Scholar] [CrossRef] [PubMed]
- Bourtsoukidis, E.; Pozzer, A.; Sattler, T.; Matthaios, V.N.; Ernle, L.; Edtbauer, A.; Fischer, H.; Könemann, T.; Osipov, S.; Paris, J.-D.; et al. The Red Sea Deep Water Is a Potent Source of Atmospheric Ethane and Propane. Nat. Commun. 2020, 11, 447. [Google Scholar] [CrossRef]
- Wang, M.; Hu, K.; Chen, W.; Shen, X.; Li, W.; Lu, X. Ambient Non-Methane Hydrocarbons (NMHCs) Measurements in Baoding, China: Sources and Roles in Ozone Formation. Atmosphere 2020, 11, 1205. [Google Scholar] [CrossRef]
- Helmig, D.; Rossabi, S.; Hueber, J.; Tans, P.; Montzka, S.A.; Masarie, K.; Thoning, K.; Plass-Duelmer, C.; Claude, A.; Carpenter, L.J.; et al. Reversal of Global Atmospheric Ethane and Propane Trends Largely due to US Oil and Natural Gas Production. Nat. Geosci. 2016, 9, 490–495. [Google Scholar] [CrossRef]
- Liang, B.; Bai, H.; Bai, D.; Liu, X. Emissions of Non-Methane Hydrocarbons and Typical Volatile Organic Compounds from Various Grate-Firing Coal Furnaces. Atmos. Pollut. Res. 2022, 13, 101380. [Google Scholar] [CrossRef]
- Zhang, S.; Zhong, L.; Chen, X.; Liu, Y.; Zhai, X.; Xue, Y.; Wang, W.; Liu, J.; Xu, K. Emissions Characteristics of Hazardous Air Pollutants from the Incineration of Sacrificial Offerings. Atmosphere 2019, 10, 332. [Google Scholar] [CrossRef]
- Zhao, Y.; Liu, Y.; Han, B.; Wang, M.; Wang, Q.; Zhang, Y. Fiber Optic Volatile Organic Compound Gas Sensors: A Review. Coord. Chem. Rev. 2023, 493, 215297. [Google Scholar] [CrossRef]
- Lv, Y.; Wu, S.; Li, N.; Cui, P.; Wang, H.; Amirkhanian, S.; Zhao, Z. Performance and VOCs Emission Inhibition of Environmentally Friendly Rubber Modified Asphalt with UiO-66 MOFs. J. Clean. Prod. 2023, 385, 135633. [Google Scholar] [CrossRef]
- Guo, Y.; Wen, M.; Li, G.; An, T. Recent Advances in VOC Elimination by Catalytic Oxidation Technology onto Various Nanoparticles Catalysts: A Critical Review. Appl. Catal. B-Environ. 2021, 281, 119447. [Google Scholar] [CrossRef]
- Angot, H.; Davel, C.; Wiedinmyer, C.; Pétron, G.; Chopra, J.; Hueber, J.; Blanchard, B.; Bourgeois, I.; Vimont, I.; Montzka, S.A.; et al. Temporary Pause in the Growth of Atmospheric Ethane and Propane in 2015-2018. Atmos. Chem. Phys. 2021, 21, 15153–15170. [Google Scholar] [CrossRef]
- Azmi, S.; Sharma, M.; Nagar, P.K. NMVOC Emissions and Their Formation into Secondary Organic Aerosols over India Using WRF-Chem Model. Atmos. Environ. 2022, 287, 119254. [Google Scholar] [CrossRef]
- Song, M.; Liu, X.; Zhang, Y.; Shao, M.; Lu, K.; Tan, Q.; Feng, M.; Yu, Q. Sources and Abatement Mechanisms of VOCs in Southern China. Atmos. Environ. 2019, 201, 28–40. [Google Scholar] [CrossRef]
- Wang, G.; Qian, Y.; Kong, F.; Liu, X.; Liu, Y.; Zhu, Z.; Gao, W.; Zhang, H.; Wang, Y. Non-Methane Hydrocarbon Characteristics and Their Ozone and Secondary Organic Aerosol Formation Potentials and Sources in the Plate and Logistics Capital of China. Atmos. Pollut. Res. 2023, 14, 101873. [Google Scholar] [CrossRef]
- Zhao, T.; Dang, Y.; Wang, A.; Gao, H.; Zhang, H.; Xing, D.; Li, B.; Li, Y.; Liu, Z.; Li, C. Viral Metagenomics Analysis of Rodents from Two Border Provinces Located in Northeast and Southwest China. Front. Microbiol. 2022, 12, 701089. [Google Scholar] [CrossRef]
- Zhao, M.; Sun, B.; Wu, L.; Gao, Q.; Wang, F.; Wen, C.; Wang, M.; Liang, Y.; Hale, L.; Zhou, J.; et al. Zonal Soil Type Determines Soil Microbial Responses to Maize Cropping and Fertilization. mSystems 2016, 1. [Google Scholar] [CrossRef]
- Tian, Y.; Peng, K.; Lou, G.; Ren, Z.; Sun, X.; Wang, Z.; Xing, J.; Song, C.; Cang, J. Transcriptome Analysis of the Winter Wheat Dn1 in Response to Cold Stress. BMC Plant Biol. 2022, 22, 277. [Google Scholar] [CrossRef] [PubMed]
- Yang, Z.; Yang, J.; Li, M.; Chen, J.; Ou, C. Nonlinear and Lagged Meteorological Effects on Daily Levels of Ambient PM2.5 and O3: Evidence from 284 Chinese Cities. J. Clean. Prod. 2021, 278, 123931. [Google Scholar] [CrossRef]
- Lai, H.; Dai, Y.; Mkasimongwa, S.W.; Hsiao, M.; Lai, L. The Impact of Atmospheric Synoptic Weather Condition and Long-Range Transportation of Air Mass on Extreme PM10 Concentration Events. Atmosphere 2023, 14, 406. [Google Scholar] [CrossRef]
- Di, Q.; Kloog, I.; Koutrakis, P.; Lyapustin, A.; Wang, Y.; Schwartz, J. Assessing PM2.5 Exposures with High Spatiotemporal Resolution across the Continental United States. Environ. Sci. Technol. 2016, 50, 4712–4721. [Google Scholar] [CrossRef]
- Wang, S.; Li, C.; Zhou, H. Impact of China’s Economic Growth and Energy Consumption Structure on Atmospheric Pollutants: Based on a Panel Threshold Model. J. Clean. Prod. 2019, 236, 117694. [Google Scholar] [CrossRef]
- Zhu, J.H.; Wang, S.S. Evaluation and Influencing Factor Analysis of Sustainable Green Transformation Efficiency of Resource-Based Cities in Western China in the Post-COVID-19 Era. Front. Public Health 2022, 10, 832904. [Google Scholar] [CrossRef]
- Benchrif, A.; Wheida, A.; Tahri, M.; Shubbar, R.M.; Biswas, B. Air Quality during Three Covid-19 Lockdown Phases: AQI, PM2.5 and NO2 Assessment in Cities with More than 1 million Inhabitants. Sustain. Cities Soc. 2021, 74, 103170. [Google Scholar] [CrossRef] [PubMed]
- Zhang, M.; Ren, F.; Shi, Y.; Chen, H.; Tian, Z. CO2, Environmental Emergencies, and Industrial Pollution Assessment in China from the Perspective of the Circular Economy. Front. Env. Sci. 2022, 9. [Google Scholar] [CrossRef]
- Reilly, J.P.; Zhao, Z.; Shashaty, M.G.S.; Koyama, T.; Christie, J.D.; Lanken, P.N.; Wang, C.; Balmes, J.R.; Matthay, M.A.; Calfee, C.S.; et al. Low to Moderate Air Pollutant Exposure and Acute Respiratory Distress Syndrome after Severe Trauma. Am. J. Respir. Crit. Care Med. 2019, 199, 62–70. [Google Scholar] [CrossRef]
- Visser, A.J.; Boersma, K.F.; Ganzeveld, L.N.; Krol, M.C. European NOx emissions in WRF-Chem derived from OMI: Impacts on summertime surface ozone. Atmos. Chem. Phys. 2019, 19, 11821–11841. [Google Scholar] [CrossRef]
- Li, Y.; Lau, A.K.H.; Fung, J.C.H.; Ma, H.; Tse, Y. Systematic Evaluation of Ozone Control Policies Using an Ozone Source Apportionment Method. Atmos. Environ. 2013, 76, 136–146. [Google Scholar] [CrossRef]
- Levinson, R.; Akbari, H.; Konopacki, S.; Bretz, S. Inclusion of Cool Roofs in Nonresidential Title 24 Prescriptive Requirements. Energy Policy 2005, 33, 151–170. [Google Scholar] [CrossRef]
- Zhang, L.; Zhou, X.; Chai, S.; Guan, J.; Fan, G.; Yang, W.; Ma, G.; Han, N.; Chen, Y. β-Co(OH)2 Nanostructures with High Spin Co(II) in Distorted [CoO6] for Catalytic Ozone Decomposition. ACS Appl. Nano Mater. 2022, 5, 18680–18690. [Google Scholar] [CrossRef]
- Lepeule, J.; Litonjua, A.A.; Gasparrini, A.; Koutrakis, P.; Sparrow, D.; Vokonas, P.S.; Schwartz, J. Lung Function Association with Outdoor Temperature and Relative Humidity and Its Interaction with Air Pollution in the Elderly. Environ. Res. 2018, 165, 110–117. [Google Scholar] [CrossRef]
- Guo, W.; Chen, Q.; Yang, Y.; Zhang, Y.; Liu, X.; Zhang, R.; Zhu, Y.; Li, G.; Liu, P.; Chen, M. Investigating the Mechanism of Morning Ozone Concentration Peaks in a Petrochemical Industrial City. Atmos. Environ. 2022, 270, 118897. [Google Scholar] [CrossRef]
- Moore, K.F.; Ning, Z.; Ntziachristos, L.; Schauer, J.J.; Sioutas, C. Daily Variation in the Properties of Urban Ultrafine Aerosol—Part I: Physical Characterization and Volatility. Atmos. Environ. 2007, 41, 8633–8646. [Google Scholar] [CrossRef]
- Korhale, N.; Anand, V.; Beig, G. Disparity in Ozone Trends under COVID-19 Lockdown in a Closely Located Coastal and Hillocky Metropolis of India. Air Qual. Atmos. Health 2020. [Google Scholar] [CrossRef]
- Deng, T.; Zou, Y.; Hu, S.; Li, F.; He, G.; Ouyang, S.; Zhang, X.; Wang, Q.; Zhang, Z.; Mai, B.; et al. Study on the Characteristics of Actinic Radiation and Direct Aerosol Radiation Effects in the Pearl River Delta Region. Atmos. Environ. 2023, 309, 119937. [Google Scholar] [CrossRef]
- Marin, C.A.; Mărmureanu, L.; Radu, C.; Dandocsi, A.; Stan, C.; Ţoancă, F.; Preda, L.; Antonescu, B. Wintertime Variations of Gaseous Atmospheric Constituents in Bucharest Peri-Urban Area. Atmosphere 2019, 10, 478. [Google Scholar] [CrossRef]
- França, D.d.A.; Longo, K.M.; Neto, T.G.S.; Santos, J.C.; Freitas, S.R.; Rudorff, B.F.T.; Cortez, E.V.; Anselmo, E.; Carvalho, J.A. Pre-Harvest Sugarcane Burning: Determination of Emission Factors through Laboratory Measurements. Atmosphere 2012, 3, 164–180. [Google Scholar] [CrossRef]
- Nath, S.; Yadav, S. A Comparative Study on Fog and Dew Water Chemistry at New Delhi, India. Aerosol Air Qual. Res. 2018, 18, 26–36. [Google Scholar] [CrossRef]
- Capistrano, S.; Zakarya, R.; Chen, H.; Oliver, B. Biomass Smoke Exposure Enhances Rhinovirus-Induced Inflammation in Primary Lung Fibroblasts. Int. J. Mol. Sci. 2016, 17, 1403. [Google Scholar] [CrossRef]
- Sun, Y.; Wang, S.; Yang, Q.; Li, J.; Wang, L.; Zhang, S.; Yang, H.; Chen, H. Environmental Impact Assessment of VOC Emissions from Biomass Gasification Power Generation System Based on Life Cycle Analysis. Fuel 2023, 335, 126905. [Google Scholar] [CrossRef]
- Sampieri, A.; Pérez-Osorio, G.; Hernández-Espinosa, M.Á.; Ruiz-López, I.I.; Ruiz-Reyes, M.; Arriola-Morales, J.; Narváez-Fernández, R.I. Sorption of BTEX on a Nanoporous Composite of SBA-15 and a Calcined Hydrotalcite. Nano Converg. 2018, 5, 21. [Google Scholar] [CrossRef] [PubMed]
- Qin, W.; Liu, Y.; Wang, L.; Lin, A.; Xia, X.M.; Che, H.; Bilal, M.; Zhang, M. Characteristic and Driving Factors of Aerosol Optical Depth over Mainland China during 1980–2017. Remote Sens. 2018, 10, 1064. [Google Scholar] [CrossRef]
- Song, B.; Park, K. Mountain Valley Cold Air Flow Interactions with Urban Morphology: A Case Study of the Urban Area of Changwon, South Korea. Landsc. Urban Plan. 2023, 233, 104703. [Google Scholar] [CrossRef]
- Yao, N.; Yeung, K.L. Investigation of the Performance of TiO2 Photocatalytic Coatings. Chem. Eng. J. 2011, 167, 13–21. [Google Scholar] [CrossRef]
- Hoshika, Y.; Fares, S.; Savi, F.; Gruening, C.; Goded, I.; De Marco, A.; Sicard, P.; Paoletti, E. Stomatal Conductance Models for Ozone Risk Assessment at Canopy Level in Two Mediterranean Evergreen Forests. Agric. For. Meteorol. 2017, 234–235, 212–221. [Google Scholar] [CrossRef]
Disclaimer/Publisher’s Note: The statements, opinions and data contained in all publications are solely those of the individual author(s) and contributor(s) and not of MDPI and/or the editor(s). MDPI and/or the editor(s) disclaim responsibility for any injury to people or property resulting from any ideas, methods, instructions or products referred to in the content. |
© 2025 by the authors. Licensee MDPI, Basel, Switzerland. This article is an open access article distributed under the terms and conditions of the Creative Commons Attribution (CC BY) license (https://creativecommons.org/licenses/by/4.0/).