A Microscale Chemical Transport Model Simulation of an Ozone Episode in Detroit, Michigan

Abstract
1. Introduction
2. Methods
3. Results
4. Discussion and Conclusions
- Local emission sources between Allen Park and East 7 Mile Rd tend to reduce MDA8 O3 at the latter station below the corresponding concentration at Allen Park due to NOx titration of O3.
- Pollution layers aloft may counter O3 titration when they are turbulently entrained to the surface, thus adding directly to ground-level O3 and enhancing radical concentrations and O3 production efficiency.
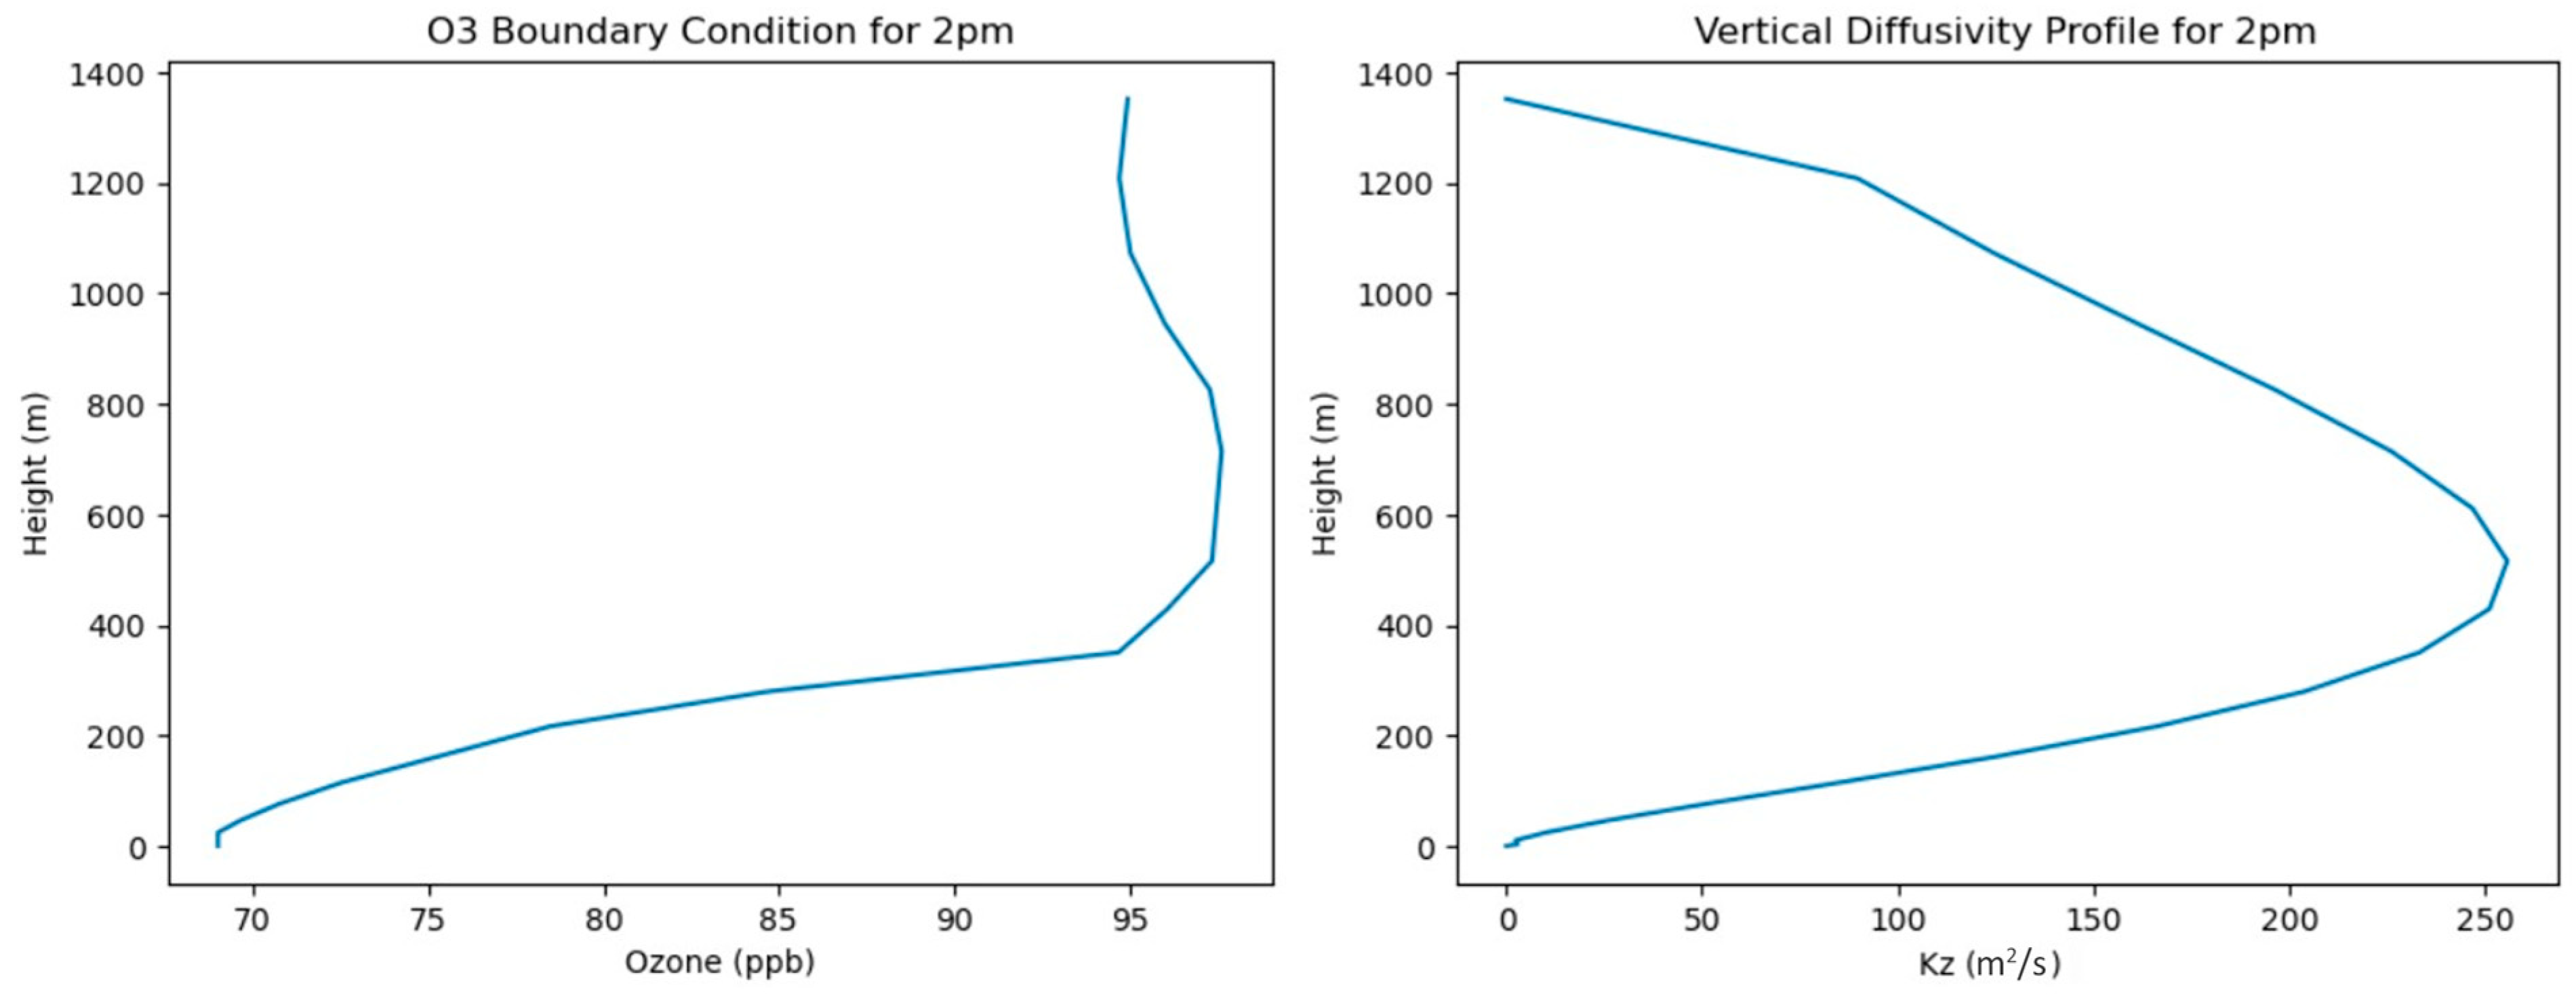
- Transport of O3 around 500 m above ground level may significantly contribute to MDA8 O3 above 70 ppb at East 7 Mile Rd during southwesterly wind flow that imports pollution from a wide region in the U.S. Midwest.
Author Contributions
Funding
Institutional Review Board Statement
Informed Consent Statement
Data Availability Statement
Acknowledgments
Conflicts of Interest
Appendix A

| Species | 9:00–10:00 LST | 10:00–11:00 LST | 11:00–12:00 LST | 12:00–13:00 LST | 13:00–14:00 LST | 14:00–15:00 LST | 15:00–16:00 LST | 16:00–17:00 LST | 17:00–18:00 LST | 18:00–19:00 LST |
|---|---|---|---|---|---|---|---|---|---|---|
| NO | 2.4 | 1.5 | 1.5 | 1.5 | 1.8 | 1.5 | 2.1 | 3.1 | 3.9 | 4.5 |
| NO2 | 7.4 | 6.0 | 6.0 | 6.7 | 7.5 | 8.1 | 10.0 | 12.6 | 15.0 | 22.1 |
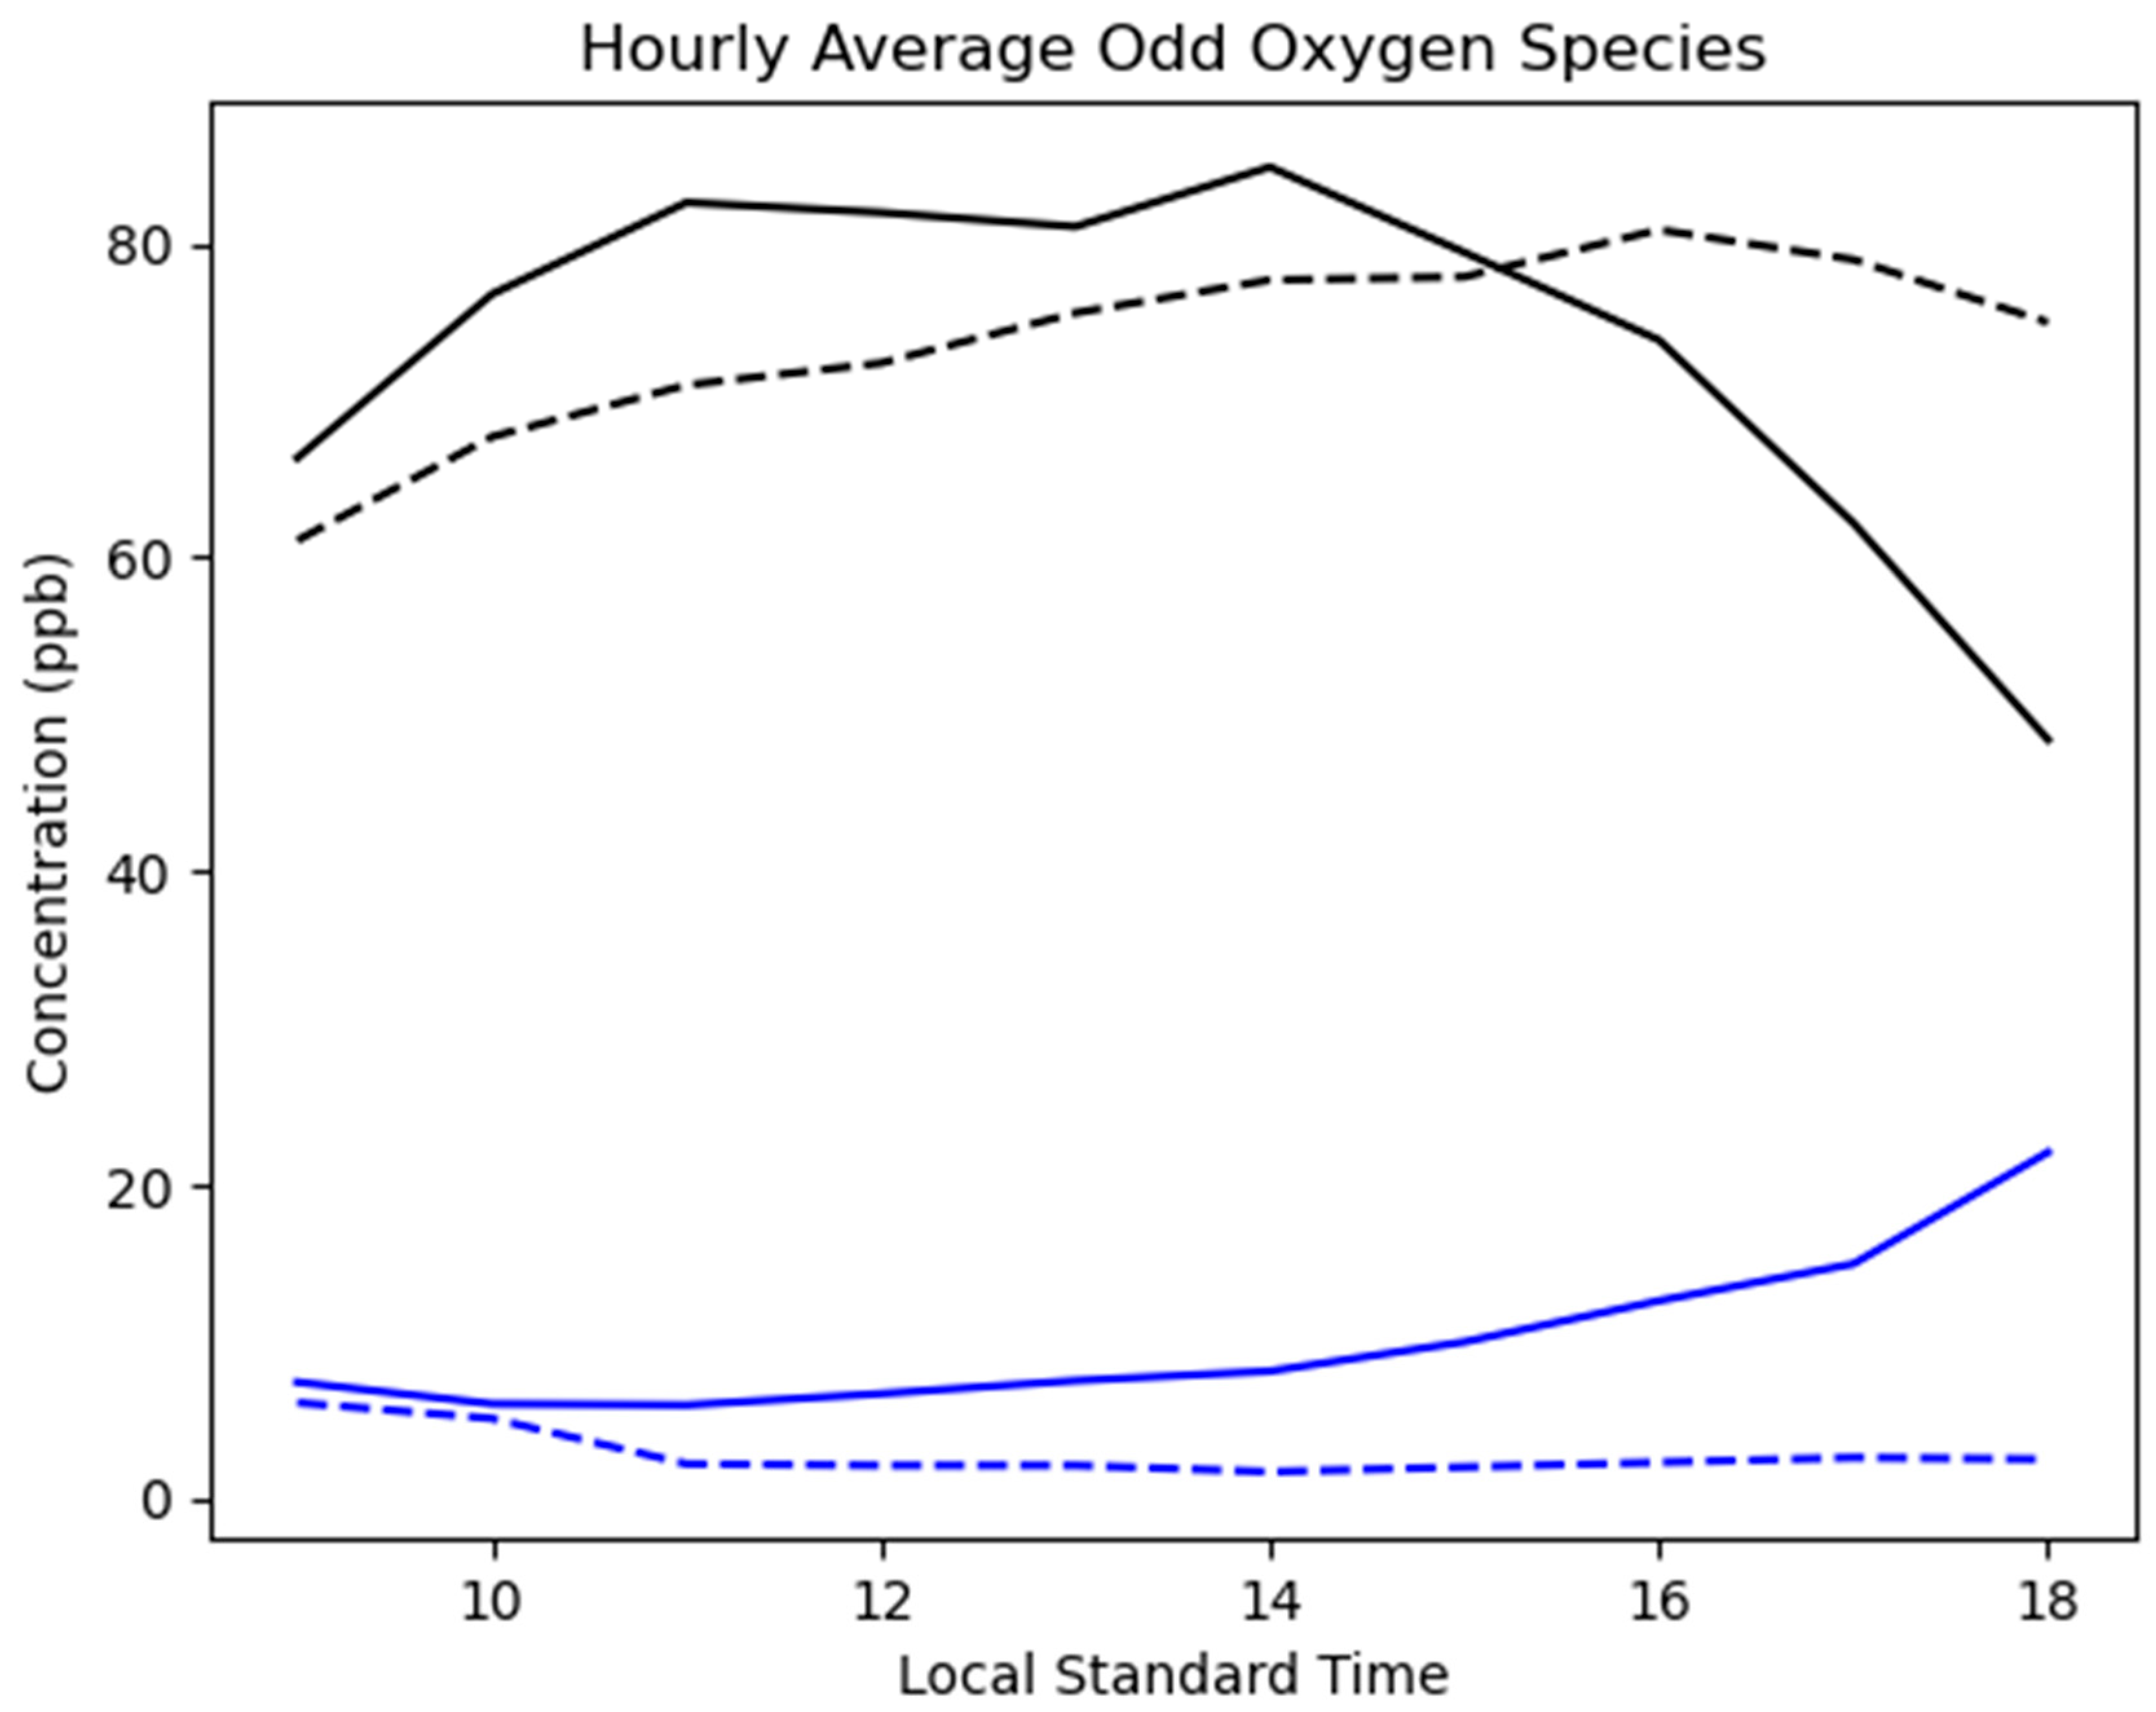
| O3 | 66.4 | 76.8 | 82.6 | 82.0 | 81.1 | 84.9 | 79.5 | 73.9 | 62.2 | 48.4 |
| Ox | 73.8 | 82.8 | 88. 6 | 88.7 | 88.6 | 93.0 | 89.4 | 86.5 | 77.2 | 70.5 |
| NOy | 15.0 | 12.6 | 11.1 | 11.1 | 11.6 | 11.8 | 14.5 | 18.3 | 21.3 | 29.6 |
| Species | 9:00–10:00 LST | 10:00–11:00 LST | 11:00–12:00 LST | 12:00–13:00 LST | 13:00–14:00 LST | 14:00–15:00 LST | 15:00–16:00 LST | 16:00–17:00 LST | 17:00–18:00 LST | 18:00–19:00 LST |
|---|---|---|---|---|---|---|---|---|---|---|
| NO | 1 | 0.8 | 0.2 | 0.2 | 0.2 | 0.1 | 0.2 | 0.1 | 0.2 | 0.1 |
| NO2 | 6.1 | 5.1 | 2.2 | 2.1 | 2.1 | 1.7 | 2 | 2.3 | 2.6 | 2.5 |
| O3 | 61.1 | 67.7 | 71 | 72.4 | 75.6 | 77.7 | 77.9 | 80.9 | 79 | 75 |
| Ox | 67.2 | 72.8 | 73.2 | 74.5 | 77.7 | 79.4 | 79.9 | 83.2 | 81.6 | 77.5 |
| NOy | 9.4 | 8.2 | 4.4 | 4.3 | 4.3 | 3.8 | 4.2 | 4.6 | 4.9 | 4.7 |
| Species | 9:00–10:00 LST | 10:00–11:00 LST | 11:00–12:00 LST | 12:00–13:00 LST | 13:00–14:00 LST | 14:00–15:00 LST | 15:00–16:00 LST | 16:00–17:00 LST | 17:00–18:00 LST | 18:00–19:00 LST |
|---|---|---|---|---|---|---|---|---|---|---|
| NO | 142.4 | 92.1 | 639.9 | 640.7 | 808.4 | 1393.6 | 954.3 | 3012.6 | 1831.1 | 4380.2 |
| NO2 | 21.5 | 18.2 | 170.6 | 218.0 | 257.6 | 377.3 | 399.0 | 448.0 | 475.3 | 782.9 |
| O3 | 8.6 | 13.4 | 16.4 | 13.3 | 7.3 | 9.3 | 2.0 | −8.7 | −21.3 | −35.5 |
| Ox | 9.8 | 13.8 | 21.0 | 19.0 | 14.0 | 17.2 | 11.9 | 3.9 | −5.4 | −9.1 |
| NOy | 59.3 | 53.6 | 151.5 | 157.1 | 169.6 | 210.2 | 244.6 | 298.2 | 335.6 | 530.3 |
| O3 | 9:00–10:00 LST | 10:00–11:00 LST | 11:00–12:00 LST | 12:00–13:00 LST | 13:00–14:00 LST | 14:00–15:00 LST | 15:00–16:00 LST | 16:00–17:00 LST | 17:00–18:00 LST | 18:00–19:00 LST |
|---|---|---|---|---|---|---|---|---|---|---|
| Station | 58.3 | 67.9 | 71.2 | 66.4 | 68.3 | 69.0 | 76.9 | 76.2 | 75.3 | 70.9 |
| Model | 32.4 | 30.9 | 32.0 | 31.2 | 20.9 | 27.9 | 40.3 | 52.3 | 57.1 | 63.4 |
| BC Adj | 25.9 | 37.0 | 39.2 | 35.2 | 47.4 | 41.1 | 36.6 | 23.9 | 18.2 | 7.5 |
| CO | 9:00–10:00 LST | 10:00–11:00 LST | 11:00–12:00 LST | 12:00–13:00 LST | 13:00–14:00 LST | 14:00–15:00 LST | 15:00–16:00 LST | 16:00–17:00 LST | 17:00–18:00 LST | 18:00–19:00 LST |
|---|---|---|---|---|---|---|---|---|---|---|
| Station | 716 | 709 | 708 | 693 | 698 | 696 | 709 | 706 | 718 | 717 |
| Model | 162 | 161 | 176 | 222 | 207 | 207 | 193 | 181 | 167 | 175 |
| BC Adj | 554 | 548 | 532 | 471 | 491 | 489 | 516 | 525 | 551 | 542 |
| NOy | 9:00–10:00 LST | 10:00–11:00 LST | 11:00–12:00 LST | 12:00–13:00 LST | 13:00–14:00 LST | 14:00–15:00 LST | 15:00–16:00 LST | 16:00–17:00 LST | 17:00–18:00 LST | 18:00–19:00 LST |
|---|---|---|---|---|---|---|---|---|---|---|
| Station | 10.4 * | 9.2 * | 8.0 * | 6.8 * | 5.7 | 6.1 | 6.7 | 6.2 | 7.2 | 7.6 |
| Model | 4.2 | 4.9 | 6.8 | 11.3 | 7.1 | 6.3 | 5.5 | 5.4 | 3.7 | 4.2 |
| BC Adj | 6.2 | 4.3 | 1.2 | −4.5 | −1.4 | −0.2 | 1.2 | 0.8 | 3.5 | 3.4 |
References
- U.S. Code of Federal Regulations. Title 40, Parts 50, 51, 52, 53, and 58. National Ambient Air Quality Standards for Ozone. Fed. Regist. 2015, 80, 206. [Google Scholar]
- Olaguer, E.P. Inverse modeling of formaldehyde emissions and assessment of associated cumulative ambient air exposures at fine scale. Atmosphere 2023, 14, 931. [Google Scholar] [CrossRef]
- Draxler, R.R. Hysplit_4 User’s Guide; U.S. National Oceanic and Atmospheric Administration (NOAA) Technical Memorandum ERL-230; Air Resources Laboratory: Silver Spring, MD, USA, 1999.
- Bocquet, M.; Elbern, H.; Eskes, H.; Hirtl, M.; Žabkar, R.; Carmichael, G.R.; Flemming, J.; Inness, A.; Pagowski, M.; Pérez Camaño, J.L.; et al. Data assimilation in atmospheric chemistry models: Current status and future prospects for coupled chemistry meteorology models. Atmos. Chem. Phys. 2015, 15, 5325–5358. [Google Scholar] [CrossRef]
- Singh, B.; Hansen, B.S.; Brown, M.J.; Pardyjak, E.R. Evaluation of the QUIC-URB fast response urban wind model for a cubical building array and wide building street canyon. Environ. Fluid Mech. 2008, 8, 281–312. [Google Scholar] [CrossRef]
- Song, M.; Zhao, X.; Liu, P.; Mu, J.; He, G.; Zhang, C.; Tong, S.; Xue, C.; Zhao, X.; Ge, M.; et al. Atmospheric NOx oxidation as major sources for nitrous acid (HONO). NPJ Clim. Atmos. Sci. 2023, 6, 30. [Google Scholar] [CrossRef]
- Wang, L.; Chai, J.; Gaubert, B.; Huang, Y. A review of measurements and model simulations of atmospheric nitrous acid. Atmos. Environ. 2025, 347, 121094. [Google Scholar] [CrossRef]
- Saunders, S.M.; Jenkin, M.E.; Derwent, R.G.; Pilling, M.J. Protocol for the development of the Master Chemical Mechanism, MCM v3 (Part A): Tropospheric degradation of non-aromatic volatile organic compounds. Atmos. Chem. Phys. 2003, 3, 161–180. [Google Scholar] [CrossRef]
- Madronich, S. Photodissociation in the Atmosphere, 1. Actinic flux and the effects of ground reflections and clouds. J. Geophys. Res. 1987, 92, 9740–9752. [Google Scholar] [CrossRef]
- Yacovitch, T.I.; Lerner, B.M.; Canagaratna, M.R.; Daube, C.; Healy, R.M.; Wang, J.M.; Fortner, E.C.; Majluf, F.; Claflin, M.S.; Roscioli, J.R.; et al. Mobile laboratory investigations of industrial point source emissions during the MOOSE field campaign. Atmosphere 2023, 14, 1632. [Google Scholar] [CrossRef]
- U.S. Environmental Protection Agency. User’s Guide for AERMOD Meteorological Preprocessor (AERMET); EPA-454/B-23-005; Office of Air Quality Planning and Standards: Research Triangle Park, NC, USA, 2023.
- Arakawa, A.; Lamb, V.R. Computational design of the basic processes of the UCLA general circulation model. In Methods in Computational Physics; Academic Press: Cambridge, MA, USA, 1977; Volume 17, pp. 174–265. [Google Scholar]
- Zannetti, P. Air Pollution Modeling; Van Nostrand Reinhold: New York, NY, USA, 1990; 444p. [Google Scholar]
- Michigan Department of Environment. Great Lakes, and Energy. State and Local Emissions Inventory System (SLEIS). Available online: https://mienviro.michigan.gov/sleis/ (accessed on 9 December 2025).
- U.S. Environmental Protection Agency. 2022v1 Emissions Modeling Platform. Available online: https://www.epa.gov/air-emissions-modeling/2022v1-emissions-modeling-platform (accessed on 9 December 2025).
- U.S. Environmental Protection Agency. Motor Vehicle Emission Simulator: MOVES5; Office of Transportation and Air Quality: Ann Arbor, MI, USA, 2024.
- U.S. Environmental Protection Agency. 2020 National Emissions Inventory Technical Support Document: Biogenics—Vegetation and Soil; EPA-454/R-23-001h; Office of Air Quality Planning and Standards: Research Triangle Park, NC, USA, 2023.
- Stroud, C.A.; Zhang, J.; Boutzis, E.I.; Zhang, T.; Mashayekhi, R.; Nikiema, O.; Majdzadeh, M.; Wren, S.N.; Xu, X.; Su, Y. Impact of solvent emissions on reactive aromatics and ozone in the Great Lakes region. Atmosphere 2023, 14, 1094. [Google Scholar] [CrossRef]
- Lake Michigan Air Directors Consortium. Attainment Demonstration Modeling for the 2015 Ozone National Ambient Air Quality Standard; Lake Michigan Air Directors Consortium: Hillside, IL, USA, 2022. [Google Scholar]
- Couillard, M.H.; Schwab, M.J.; Schwab, J.J.; Lu, C.-H.; Joseph, E.; Stutsrim, B.; Shrestha, B.; Zhang, J.; Knepp, T.N.; Gronoff, G.P. Vertical profiles of ozone concentrations in the lower troposphere downwind of New York City during LISTOS 2018–2019. J. Geophys. Res. Atmos. 2021, 126, e2021JD035108. [Google Scholar] [CrossRef]
- Qian, Y.; Luo, Y.; Dou, K.; Zhou, H.; Xi, L.; Yang, T.; Zhang, T.; Si, F. Retrieval of tropospheric ozone profiles using ground-based MAX-DOAS. Sci. Total Environ. 2023, 857, 1593441. [Google Scholar] [CrossRef]
- He, G.; He, C.; Wang, H.; Lu, X.; Pei, C.; Qiu, X.; Liu, C.; Wang, Y.; Liu, N.; Zhang, J.; et al. Nighttime ozone in the lower boundary layer: Insights from 3-year tower-based measurements in South China and regional air quality modeling. Atmos. Chem. Phys. 2023, 23, 13107–13124. [Google Scholar] [CrossRef]
- Johnson, M.S.; Rozanov, A.; Weber, M.; Mettig, N.; Sullivan, J.; Newchurch, M.J.; Kuang, S.; Leblanc, T.; Chouza, F.; Berkoff, T.A.; et al. TOLNet validation of satellite ozone profiles in the troposphere: Impact of retrieval wavelengths. Atmos. Meas. Tech. 2024, 17, 2559–2582. [Google Scholar] [CrossRef]
- Delle Monache, L.; Weil, J.; Simpson, M.; Leach, M. A new urban boundary layer and dispersion parameterization for an emergency response modeling system: Tests with the Joint Urban 2003 data set. Atmos. Environ. 2009, 43, 5807–5821. [Google Scholar] [CrossRef]
- Toro, C.; Foley, K.; Simon, H.; Henderson, B.; Baker, K.R.; Eyth, A.; Timin, B.; Appel, W.; Luecken, D.; Beardsley, M.; et al. Evaluation of 15 years of modeled atmospheric oxidized nitrogen compounds across the contiguous United States. Elem. Sci. Anth. 2021, 9, 00158. [Google Scholar] [CrossRef]
- Olaguer, E.; Su, Y.; Stroud, C.A.; Healy, R.M.; Batterman, S.A.; Yacovitch, T.I.; Chai, J.; Huang, Y.; Parsons, M.T. The Michigan-Ontario Ozone Source Experiment (MOOSE): An overview. Atmosphere 2023, 14, 1630. [Google Scholar] [CrossRef]
- Bergin, R.A.; Harkey, M.; Hoffman, A.; Moore, R.H.; Anderson, B.; Beyersdorf, A.; Ziemba, L.; Thornhill, L.; Winstead, E.; Holloway, T.; et al. Observation-based constraints on modeled aerosol surface area: Implications for heterogeneous chemistry. Atmos. Chem. Phys. 2022, 22, 15449–15468. [Google Scholar] [CrossRef]
- Akimoto, H.; Tanimoto, H. Review of comprehensive measurements of speciated NOy and its chemistry: Need for quantifying the role of heterogeneous processes of HNO3 and HONO. Aerosol Air Qual. Res. 2021, 21, 200395. [Google Scholar] [CrossRef]
- Chace, W.S.; Womack, C.; Ball, K.; Bates, K.H.; Bohn, B.; Coggon, M.; Crounse, J.D.; Fuchs, H.; Gilman, J.; Gkatzelis, G.I.; et al. Ozone production efficiencies in the three largest United States cities from airborne measurements. Environ. Sci. Technol. 2025, 59, 13306–13318. [Google Scholar] [CrossRef] [PubMed]
- Tonnesen, G.S.; Dennis, R.L. Analysis of radical propagation efficiency to assess ozone sensitivity to hydrocarbons and NOx: 2. Long-lived species as indicators of ozone concentration sensitivity. J. Geophys. Res. Atmos. 2000, 105, 9227–9241. [Google Scholar] [CrossRef]
- Xiong, Y.; Chai, J.; Mao, H.; Mariscal, N.; Yacovitch, T.; Lerner, B.; Majluf, F.; Canagaratna, M.; Olaguer, E.P.; Huang, Y. Examining the summertime ozone formation regime in southeast Michigan using MOOSE ground-based HCHO/NO2 measurements and F0AM box model. J. Geophys. Res. Atmos. 2023, 128, e2023JD038943. [Google Scholar] [CrossRef]


| 9:00–10:00 LST | 10:00–11:00 LST | 11:00–12:00 LST | 12:00–13:00 LST | 13:00–14:00 LST | 14:00–15:00 LST | 15:00–16:00 LST | 16:00–17:00 LST | 17:00–18:00 LST | 18:00–19:00 LST |
|---|---|---|---|---|---|---|---|---|---|
| 53 | 42 | 39 | 32 | 30 | 28 | 26 | 26 | 30 | 32 |
| 8 h O3 | 9:00–17:00 LST | 10:00–18:00 LST | 11:00–19:00 LST |
|---|---|---|---|
| Modeled | 78.4 ppb | 77.9 ppb | 74.3 ppb |
| Observed | 73.0 ppb | 75.3 ppb | 76.2 ppb |
| NMB | 7.3% | 3.4% | −2.4% |
| Species | Modeled 9:00–19:00 LST | Observed 9:00–19:00 LST | NMB 9:00–19:00 LST |
|---|---|---|---|
| NO | 2.4 ppb | 0.3 ppb | 668% |
| NO2 | 10.1 ppb | 2.9 ppb | 253% |
| O3 | 73.8 ppb | 73.8 ppb | −0.08% |
| Ox | 83.9 ppb | 76.7 ppb | −9.4% |
| NOy | 15.7 ppb | 5.3 ppb | −197% |
| Experiment | O3 9:00–19:00 LST | Ox 9:00–19:00 LST | OPE 9:00–19:00 LST |
|---|---|---|---|
| Base Case | 73.8 ppb | 83.9 ppb | 3.2 |
| No O3 Layers Aloft | 61.2 ppb | 73.8 ppb | 1.8 |
| Relative Difference | −17% | −12% | −44% |
| Experiment | MDA8 O3 |
|---|---|
| Base Case | 78.4 ppb |
| 10% NOx Reduction | 80.5 ppb |
| 10% VOC Reduction | 78.2 ppb |
| 50% VOC Reduction | 78.0 ppb |
Disclaimer/Publisher’s Note: The statements, opinions and data contained in all publications are solely those of the individual author(s) and contributor(s) and not of MDPI and/or the editor(s). MDPI and/or the editor(s) disclaim responsibility for any injury to people or property resulting from any ideas, methods, instructions or products referred to in the content. |
© 2026 by the authors. Licensee MDPI, Basel, Switzerland. This article is an open access article distributed under the terms and conditions of the Creative Commons Attribution (CC BY) license.
Share and Cite
Olaguer, E.P.; Vaerten, M. A Microscale Chemical Transport Model Simulation of an Ozone Episode in Detroit, Michigan. Atmosphere 2026, 17, 139. https://doi.org/10.3390/atmos17020139
Olaguer EP, Vaerten M. A Microscale Chemical Transport Model Simulation of an Ozone Episode in Detroit, Michigan. Atmosphere. 2026; 17(2):139. https://doi.org/10.3390/atmos17020139
Chicago/Turabian StyleOlaguer, Eduardo P., and Marissa Vaerten. 2026. "A Microscale Chemical Transport Model Simulation of an Ozone Episode in Detroit, Michigan" Atmosphere 17, no. 2: 139. https://doi.org/10.3390/atmos17020139
APA StyleOlaguer, E. P., & Vaerten, M. (2026). A Microscale Chemical Transport Model Simulation of an Ozone Episode in Detroit, Michigan. Atmosphere, 17(2), 139. https://doi.org/10.3390/atmos17020139