Article

Overview of the Korean Precipitation Observation Program (KPOP) in the Seoul Metropolitan Area


1
National Institute of Meteorological Sciences, Korea Meteorological Administration, Seogwipo 63568, Republic of Korea
2
Department of Atmospheric Sciences, Center for Atmospheric Remote Sensing (CARE), Kyungpook National University, Daegu 41566, Republic of Korea
*
Author to whom correspondence should be addressed.
Atmosphere 2026, 17(2), 130; https://doi.org/10.3390/atmos17020130
Submission received: 16 December 2025 / Revised: 13 January 2026 / Accepted: 19 January 2026 / Published: 26 January 2026
(This article belongs to the Section Atmospheric Techniques, Instruments, and Modeling)

Abstract

Recent studies have reported a rapid increase in short-duration, high-intensity rainfall over the Seoul Metropolitan Area (SMA), primarily associated with mesoscale convective systems (MCSs), highlighting the need for high-resolution and multi-platform observations for accurate forecasting. To address this challenge, the Korea Meteorological Administration (KMA) established the Korean Precipitation Observation Program (KPOP), an intensive observation network integrating radar, wind lidar, wind profiler, and storm tracker measurements. This study introduces the design and implementation of the KPOP network and evaluates its observational and forecasting value through a heavy rainfall event that occurred on 17 July 2024. Wind lidar data and weather charts reveal that a strong low-level southwesterly jet and enhanced moisture transport from the Yellow Sea played a key role in sustaining a quasi-stationary, line-shaped rainband over the metropolitan region, leading to extreme short-duration rainfall exceeding 100 mm h−1. To investigate the impact of KPOP observations on numerical prediction, preliminary data assimilation experiments were conducted using the Korean Integrated Model-Regional Data Assimilation and Prediction System (KIM-RDAPS) with WRF-3DVAR. The results demonstrate that assimilating wind lidar observations most effectively improved the representation of low-level moisture convergence and spatial structure of the rainband, leading to more accurate simulation of rainfall intensity and timing compared to experiments assimilating storm tracker data alone. These findings confirm that intensive, high-resolution wind observations are critical for improving initial analyses and enhancing the predictability of extreme rainfall events in densely urbanized regions such as the SMA.

1. Introduction

Extreme rainfall events of short duration have become increasingly frequent and intense across East Asia, with particularly severe impacts in densely populated urban regions such as the Seoul Metropolitan Area (SMA) [1,2]. These events often lead to severe socio-economic impacts, including flash flooding, landslides, urban inundation, transportation disruptions, and damage to power and communication systems. For example, the record-breaking rainfall in the Gangnam district of Seoul in August 2022 produced 141.5 mm h−1 and 381.5 mm day−1, resulting in widespread flooding of residential areas, roads, and subways, along with significant economic losses [3].
The primary meteorological drivers of these events are mesoscale convective systems (MCSs), which are organized convective structures that often extend several hundred kilometers [4]. MCSs typically develop along the East Asian summer monsoon front, sustained by strong low-level moisture inflow, convergence zones, and upper-level forcing. Because they evolve rapidly and frequently produce highly localized precipitation, accurate characterization of their initiation and development requires observational data with high spatiotemporal resolution. However, conventional synoptic-scale observation networks, with resolutions on the order of tens of kilometers and temporal intervals of several hours, remain insufficient for capturing the mesoscale structures and processes that drive these extreme rainfall events.
In response to these limitations, a number of intensive observation programs have been carried out both in Korea and internationally. The Korea Enhanced Observing Period (KEOP) [5] investigated precipitation mechanisms during the summer monsoon using radiosondes, wind profilers, and flux towers. The ProbeX-2009 (Predictability and OBservation Experiment of Korea-2009) extended upper-air observations into the Yellow Sea and adjacent coastal regions through intensive radiosonde launches from ships and coastal sites, aiming to improve the understanding of heavy rainfall mechanisms during the East Asian summer monsoon [6]. The ICE-POP 2018 (International Collaborative Experiments for the PyeongChang 2018 Olympic and Paralympic Winter Games) [7] advanced understanding of winter precipitation microphysics through a coordinated set of radars, radiosondes, and aircraft.
Several international field campaigns have also provided important insights into atmospheric processes across different meteorological environments. The IMPROVE (Improvement of Microphysical Parameterization through Observational Verification Experiment) [8] was conducted in the Pacific Northwest of the United States to investigate frontal and orographic precipitation over the coastal ocean and Cascade Mountains. Its primary objective was to improve bulk microphysical parameterizations in mesoscale models through detailed observations from multiple platforms, including research aircraft, dual-polarization Doppler radar, wind profilers, and enhanced radiosonde launches, thereby providing critical datasets for advancing quantitative precipitation forecasting. The OLYMPEX (Olympic Mountains Experiment) [9] on the Olympic Peninsula in the northwestern United States was designed to validate Global Precipitation Measurement (GPM) satellite precipitation products, focusing on orographic precipitation, frontal systems, and microphysical structures within cyclones through multi-radar, aircraft, and surface observations. The IMPACTS (Investigation of Microphysics and Precipitation for Atlantic Coast-Threatening Snowstorms) [10] program in the United States examined the vertical structures and microphysical characteristics of winter storms using aircraft, airborne radar, and dropsondes, aiming to advance both process-based understanding of precipitation microphysics and satellite retrieval algorithms for snow. The PRECIP (Prediction of Rainfall Extremes Campaign in the Pacific) was carried out over Taiwan and nearby western Pacific regions to study extreme rainfall associated with the Meiyu front, diurnal convection, and typhoons [11,12]. The campaign aimed to enhance understanding of multiscale dynamic, thermodynamic, and microphysical processes leading to extreme precipitation.
These international programs, which employed a network of observational platforms—including dual-polarization radars, wind profilers, radiosondes, aircraft-based cloud microphysics sensors, and dropsondes—demonstrated the significant utility of integrated observing systems for investigating atmospheric microphysics and dynamics across various meteorological environments, thereby contributing to the improvement of predictive capability.
Although these efforts have advanced the understanding of precipitation processes and mesoscale dynamics, previous campaigns have not fully addressed the specific characteristics of summer extreme rainfall in urbanized environments such as the SMA, where various land-use types, urban heat islands, and interactions with the Yellow Sea strongly influence convective processes.
The Korea Meteorological Administration (KMA), in collaboration with domestic and international research institutions, has established an intensive observation network for hazardous weather in the SMA to address this observational gap. The aim of this study is to introduce the network and to present preliminary research results that demonstrate its promising contributions toward achieving these overall objectives.
This paper is organized as follows. Section 2 introduces the design and operation of the intensive observation network. Section 3 presents preliminary research findings obtained from the application of the network, focusing on the analysis of a heavy rainfall event and its promising contributions to forecasting improvement. Section 4 provides concluding remarks.

2. Overview of Observations

2.1. Implementation of the Intensive Observation Program in the Seoul Metropolitan Area

The Seoul Metropolitan region, characterized by a high density of population and industrial facilities, is particularly vulnerable to severe socio-economic damages when hazardous weather phenomena such as localized extreme rainfall occur. Localized precipitation that develops and dissipates within a short timescale is especially difficult to diagnose accurately in terms of its origin and evolution when observations are limited to the existing observation networks. To overcome these limitations, the Korea Meteorological Administration (KMA), in collaboration with academic and affiliated research institutions, has jointly implemented an intensive observation program designed to establish a three-dimensional observational system encompassing the ocean, land, and atmosphere.
The program has been organized into three phases spanning the period from 2020 to 2026. The first phase focused on constructing a pilot observation network, while the second phase (2021–2023) emphasized the expansion of marine and upper-air observation systems, the integration and shared utilization of datasets from private and related organizations, and the execution of targeted intensive observation campaigns. The third phase (2024–2026) aims to apply enhanced numerical models and advanced observational techniques to operational forecasting, with the ultimate objective of transitioning into a long-term and sustainable observation system.
The overall strategy of the intensive observation program can be classified into three major components. First, by integrating multi-source datasets from operational observation networks, instruments maintained by the private sector and academia, high-resolution analysis fields are produced and subsequently utilized to improve the initial conditions of numerical weather prediction models. Second, three-dimensional intensive observations are conducted—including the establishment of dedicated observational supersites—in order to minimize observational gaps. To achieve this, meteorological research aircraft and observation vessels acquire vertical atmospheric and oceanic data through the deployment of dropsondes and drifting buoys, the launch of radiosondes; mobile platforms then conduct upper-air measurements during hazardous weather episodes, and cloud microphysical datasets are collected through coordinated observations with academic and international research institutions. Figure 1 illustrates the spatial configuration of the KPOP observation network, showing the locations of major observational platforms over the Yellow Sea and the Seoul Metropolitan Area, which are designed to capture marine inflow, low-level wind structure, and mesoscale convective systems affecting the metropolitan region.
Third, the acquired data are subjected to a thorough quality control process and are subsequently utilized as essential input for the production of three-dimensional reanalysis fields, mesoscale convection analyses, and precipitation mechanism studies, while also contributing to improvements in data assimilation systems and model physical process representations.
The intensive observation activities are carried out annually from June through September for approximately 120 days and are categorized into continuous operational observations, intensive observations, and special observations. Continuous operational observations are conducted using automatic weather stations, meteorological radars, satellites, and upper-air observations. Based on retrospective analyses of past events, four intensive observation periods of approximately 10 days each are designated annually during climatologically favorable conditions for extreme rainfall occurrence. Intensive observations involve the concentrated deployment of mobile observational infrastructure such as meteorological research aircraft, research vessels, and mobile observation vehicles. Upper-air observations are performed more than four times daily at selected sites over islands in the Yellow Sea and at principal inland observation sites, while special observations are activated during typhoon landfalls or extreme rainfall events, during which the frequency and coverage of observations are rapidly intensified. All data are disseminated in real time to operational forecasting offices, supporting forecasters’ analyses and decision-making, while simultaneously serving as essential input for data assimilation and numerical model development studies.
The Korea Precipitation Observation Program: International Collaborative Experiments for Mesoscale Convective Systems in the Seoul Metropolitan Area (KPOP-MS), through its emphasis on marine, upper-air, and mobile observation strategies, provides a strong scientific basis for bridging existing observational gaps and for elucidating the developmental processes of mesoscale convective systems with high precision. Furthermore, the program provides a foundation for improving forecast accuracy and mitigating disaster impacts, and, in the long term, evolves into a sustainable hazardous weather monitoring system through international collaborative research.

2.2. Operations of Supersite Observation

The KPOP supersite in the Seoul metropolitan area was established as a core observational infrastructure to enhance monitoring and analysis of localized hazardous weather, particularly mesoscale convective systems (MCSs) associated with extreme rainfall. The primary objective of the supersite is to obtain high-spatiotemporal-resolution observations of precipitation microphysics, vertical wind structure, and thermodynamic conditions that are not adequately captured by conventional operational networks. The supersite integrates multiple surface-based and remote-sensing instruments within a single location, enabling simultaneous observation of precipitation, clouds, and atmospheric dynamics. Compared with existing observation systems, this integrated configuration allows detailed three-dimensional characterization of convective systems and supports comprehensive analyses of their initiation, development, and maintenance processes.
The location of the supersite has been carefully selected by considering the likelihood of MCS occurrence, prevailing wind direction, and local infrastructure conditions. Availability of power and communication networks, accessibility, and radio-wave environment were also major factors in site selection.
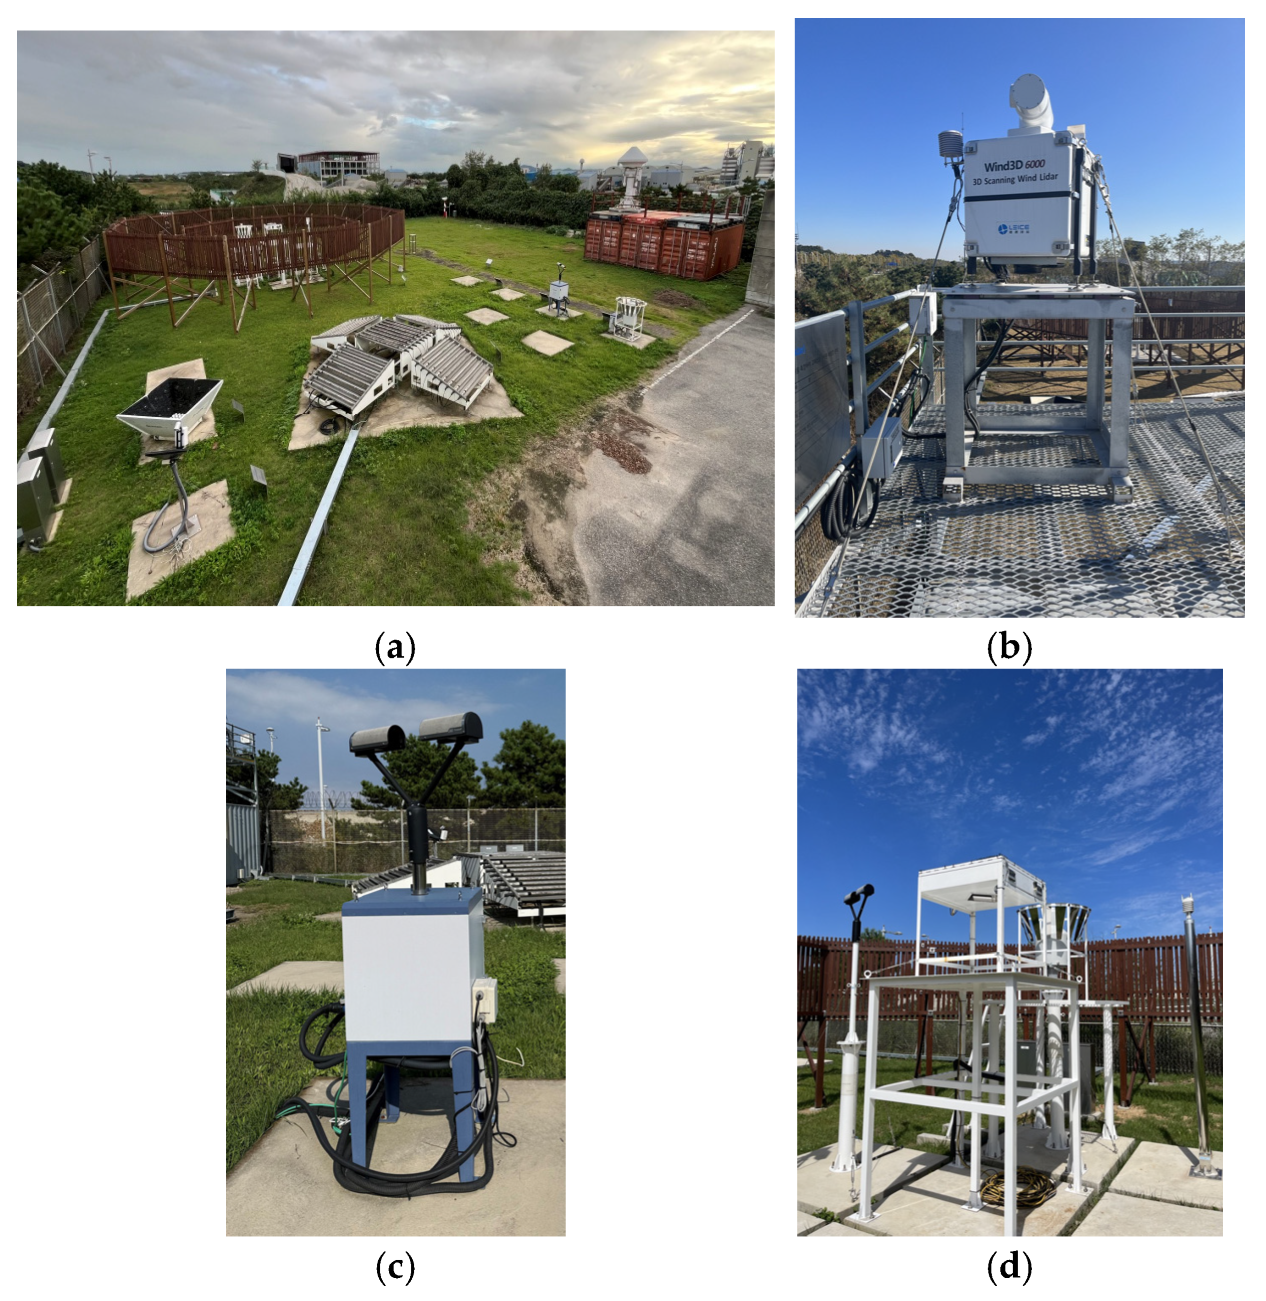
Figure 2 presents representative photographs of surface-based instruments operated at the KPOP supersite near Incheon Airport, while detailed specifications and observational purposes of these instruments are summarized in Table 1. Among them, the PARticle Size and Velocity disdrometer (PARSIVEL; OTT HydroMet GmbH, Kempten, Germany) [14] measures in real time the diameter, fall velocity, and shape of hydrometeors. These data are essential for diagnosing the physical properties of precipitation particles, classifying precipitation types such as snow, rain, and validating the microphysical processes responsible for precipitation formation.
The two-dimensional video disdrometer (2DVD; Joanneum Research, Graz, Austria) [15] provides detailed measurements of particle size distributions, shapes, and fall velocities. This enables improvements to the parameterization of cloud microphysics in numerical weather prediction (NWP) models, especially by supplying critical data for verifying microphysical parameterizations under heavy rainfall conditions. The Pluvio weighing rain gauge (OTT HydroMet GmbH, Kempten, Germany) [16] provides high-precision measurements of both real-time rainfall intensity and accumulated precipitation. These data allow for fine-scale monitoring of rainfall patterns during heavy precipitation events and are also applicable to flood forecasting and early warning systems. In addition, as a fundamental reference for precipitation measurements, the Pluvio is used to cross-validate and ensure the quality of other instruments.
Multiple radar systems are operated in a complementary manner to capture cloud and precipitation structures across a wide range of spatial scales. An X-band dual-polarization radar (Ridgeline Instrument, Fort Collins, CO, USA) [17] is used to monitor mesoscale convective organization and rainfall distribution, while a W-band cloud radar (RPG Radiometer Physics GmbH, Meckenheim, Germany) [18] and a Micro Rain Radar (METEK GmbH, Elmshorn, Germany) [19] provide high-resolution vertical profiles of cloud and precipitation microphysical properties. Together, these radar observations bridge surface measurements and volumetric radar data, supporting multi-scale analyses of precipitation evolution.
Vertical wind structure and boundary-layer processes are monitored using a wind profiler (DEGREANE HORIZON, Cuers, France) and a wind lidar (LEICE, Qingdao, China) [20] system. These observations enable detailed diagnosis of low-level jets, wind shear, and convergence associated with heavy rainfall events and provide critical information for understanding moisture transport and convective triggering mechanisms. Near-surface meteorological conditions are continuously monitored by an Automatic Weather Station (AWS), supplying essential background data for synoptic and mesoscale analyses.
The supersite is utilized for both continuous monitoring and intensive observation periods. Simultaneously collecting upper-air and surface data enables three-dimensional analyses of atmospheric processes. The high-resolution datasets obtained are applied to improving the initial conditions of NWP models, refining model physics, advancing MCS research, and conducting real-time hazardous weather analyses. In the final analysis, the observational instruments at the supersite contribute to enhancing hazardous weather monitoring and improving forecast accuracy in the Seoul metropolitan area.

2.3. International Collaborative Observation

The Korea Precipitation Observation Program (KPOP) has been conducted as an international collaborative program in the Seoul metropolitan area to perform detailed analyses of the microphysical properties and three-dimensional structures of hazardous weather events. Research organizations from North America, Europe, and Asia have participated in this effort. NASA has taken the lead in lightning observations and analyses. Environment and Climate Change Canada (ECCC) has conducted Ka-band cloud radar (METEK GmBH, Elmshorn, Germany) observations to investigate fine-scale cloud microphysical structures. Colorado State University (CSU) operated Micro Rain Particle Spectrometers (MPS; Droplet Measurement Technologies, Longmont, CO, USA) for in-situ measurement of precipitation particle characteristics. The University of Castilla-La Mancha (UCLM) performed observations using X-band dual-polarization radar (SelexES GmbH, Neuss, Germany) to examine precipitation microphysics and convective cloud systems. In addition, Taiwan’s National Taiwan University (NTU) and National Central University (NCU) have contributed vertical atmospheric structure observations and operation of storm trackers.
The first phase of this international collaborative campaign was conducted in 2023, with the main objectives of testing observational instruments, validating the operational framework, and establishing an initial observation strategy. A second intensive field campaign is planned for 2026, during which the observation network will be redesigned based on the outcomes of the first campaign. This future effort will strengthen vertical water vapor observations and focus on the study of convection and precipitation processes associated with inflow into the metropolitan area. In particular, enhanced observations using Micro Pulse Differential Absorption Lidar (MPD) [21], Differential Absorption Lidar (DIAL) [22], and Colorado State University (CSU) SEA-POL [23] radar are planned to improve analyses of atmospheric water vapor and precipitation processes over the Yellow Sea.

3. Preliminary Analysis of Results Based on the Metropolitan Intensive Observation Network

3.1. Analysis of a Summer Heavy Rainfall Event

Observational data collected from the Seoul metropolitan intensive observation network were utilized to investigate the heavy rainfall event that occurred on 17 July 2024. In this case, extremely heavy precipitation was concentrated over the western part of the metropolitan region within a short period of time.
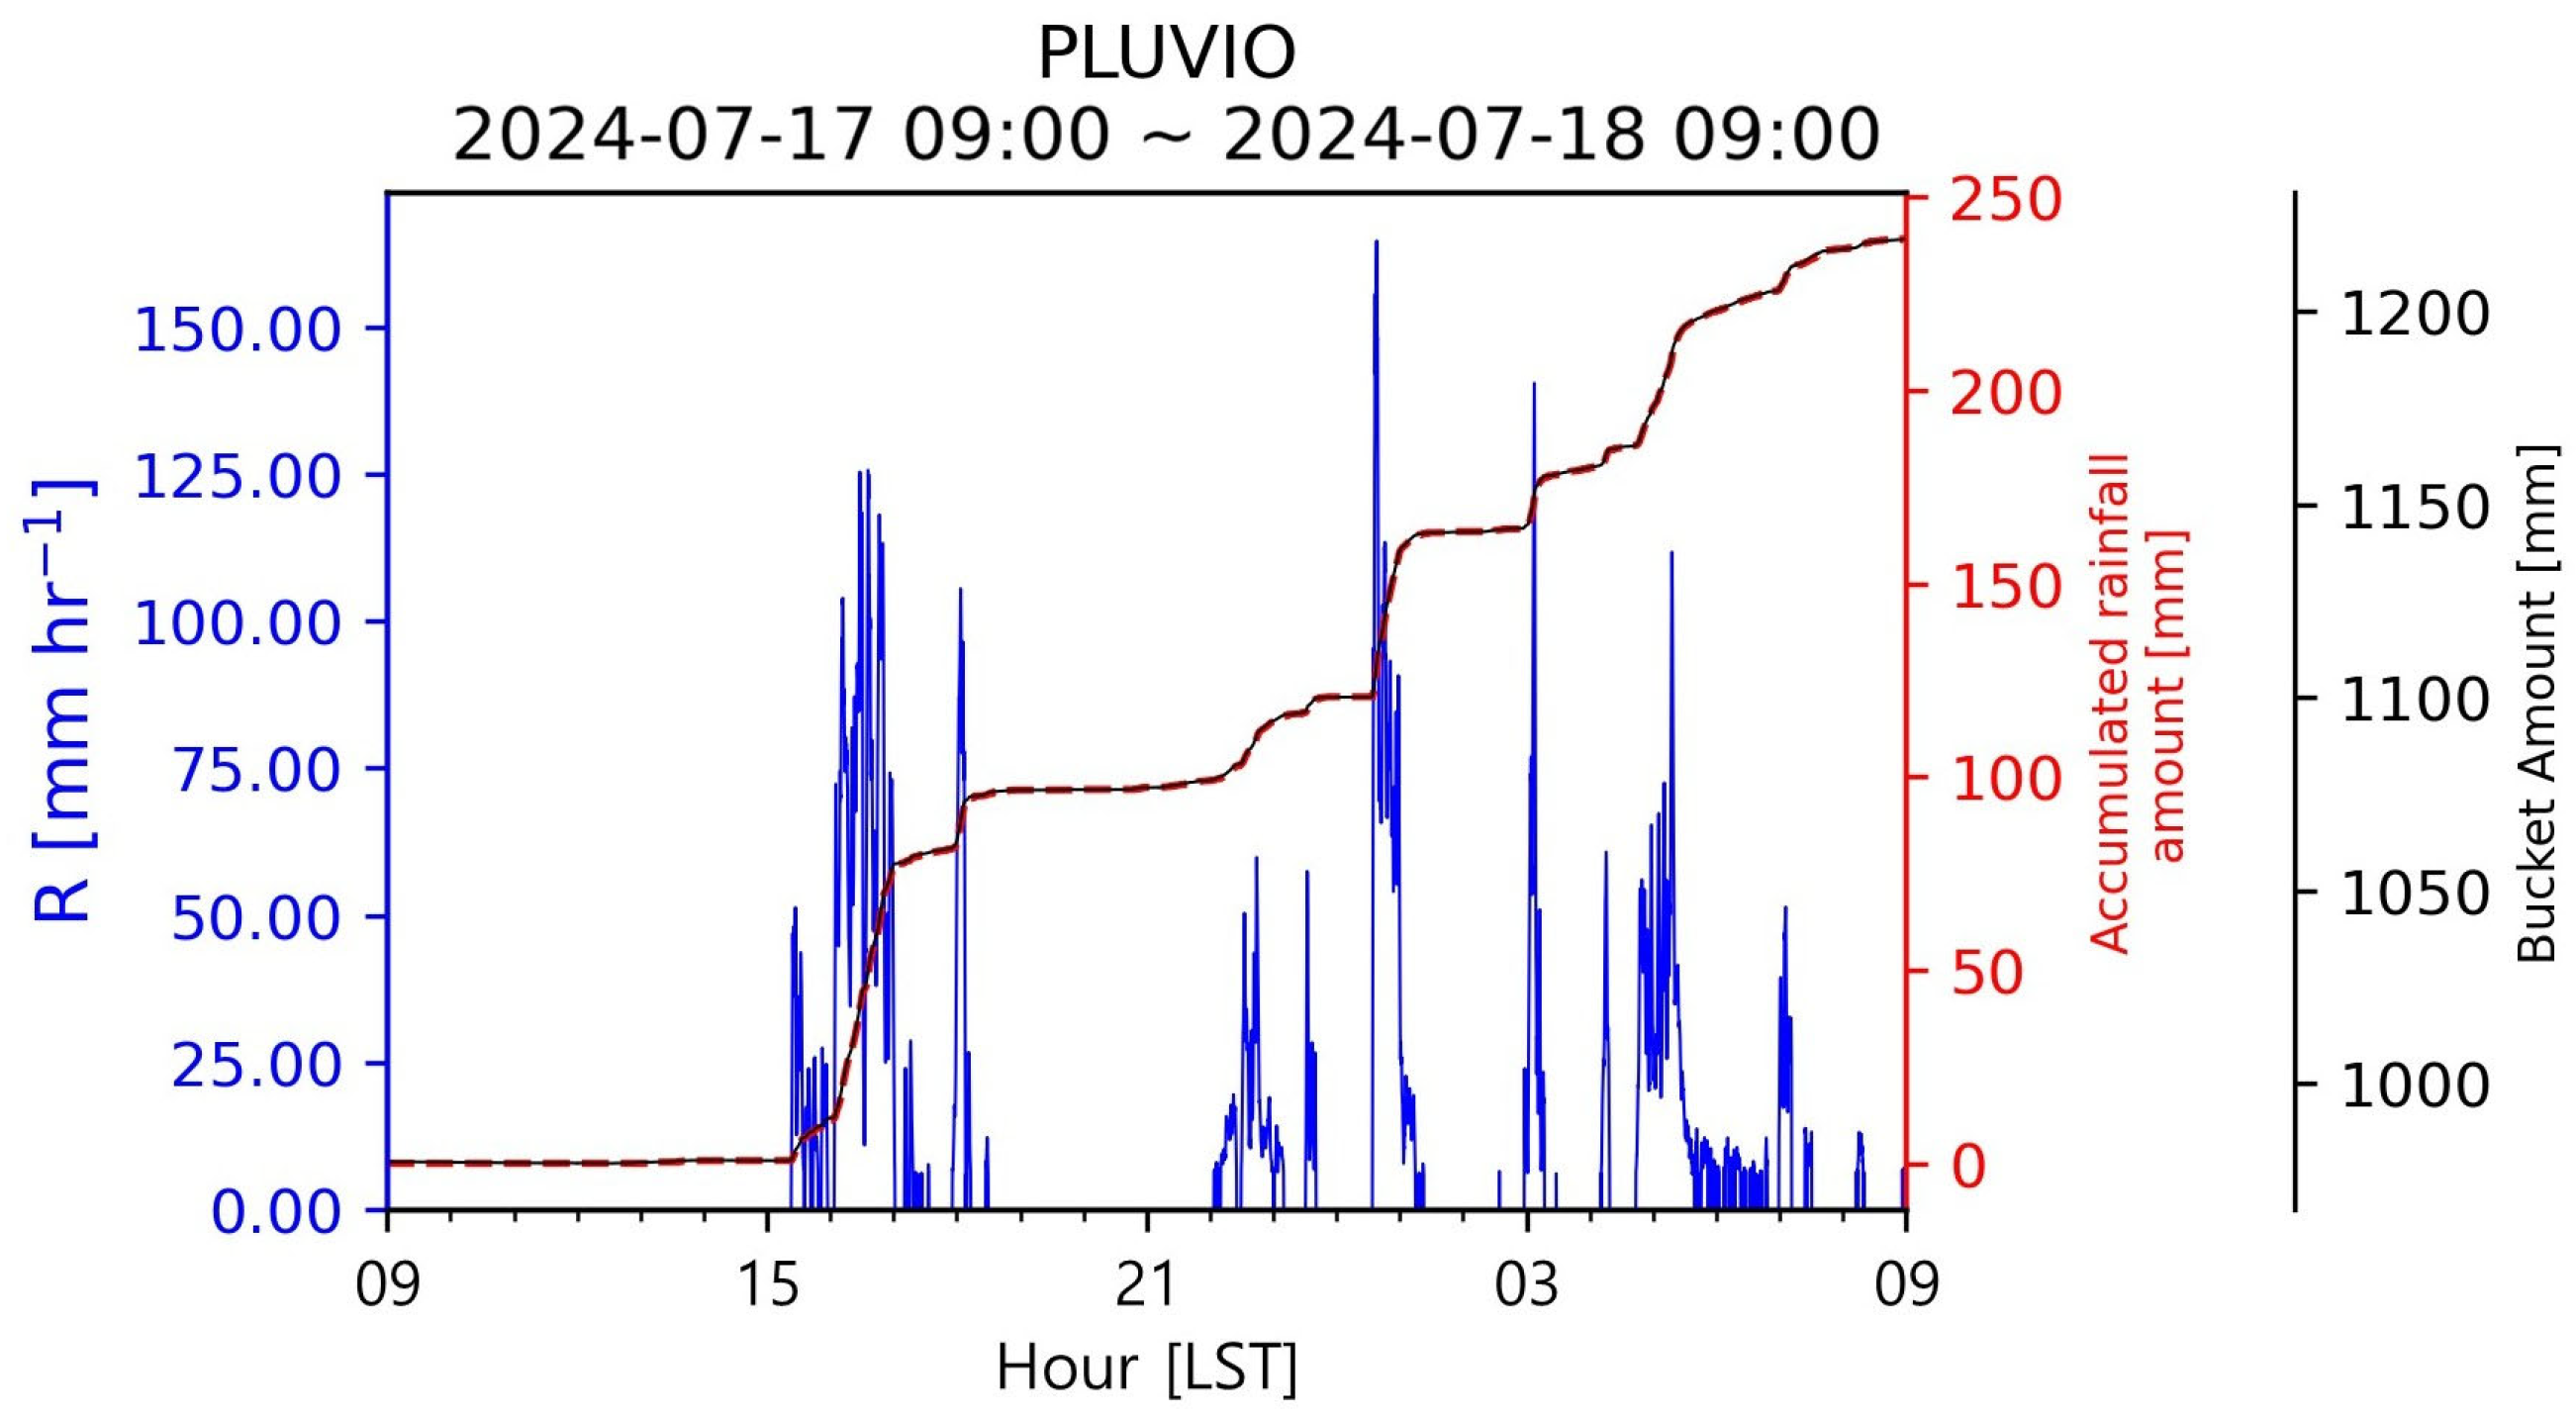
For the case analysis, a time series of rainfall measured by the Pluvio weighing rain gauge installed at the supersite observation at the Incheon International Airport was examined (Figure 3). According to the time series, light rainfall began around 0900 LST, and rainfall intensity increased sharply after 1500 LST. During 1500–1900 LST, the hourly rainfall rate rose rapidly, marking the peak rainfall intensity of the case. Although the intensity gradually weakened afterwards, most of the daily accumulated precipitation occurred during this peak period. The maximum rainfall near Incheon Airport was observed between 1600 LST and 1700 LST.
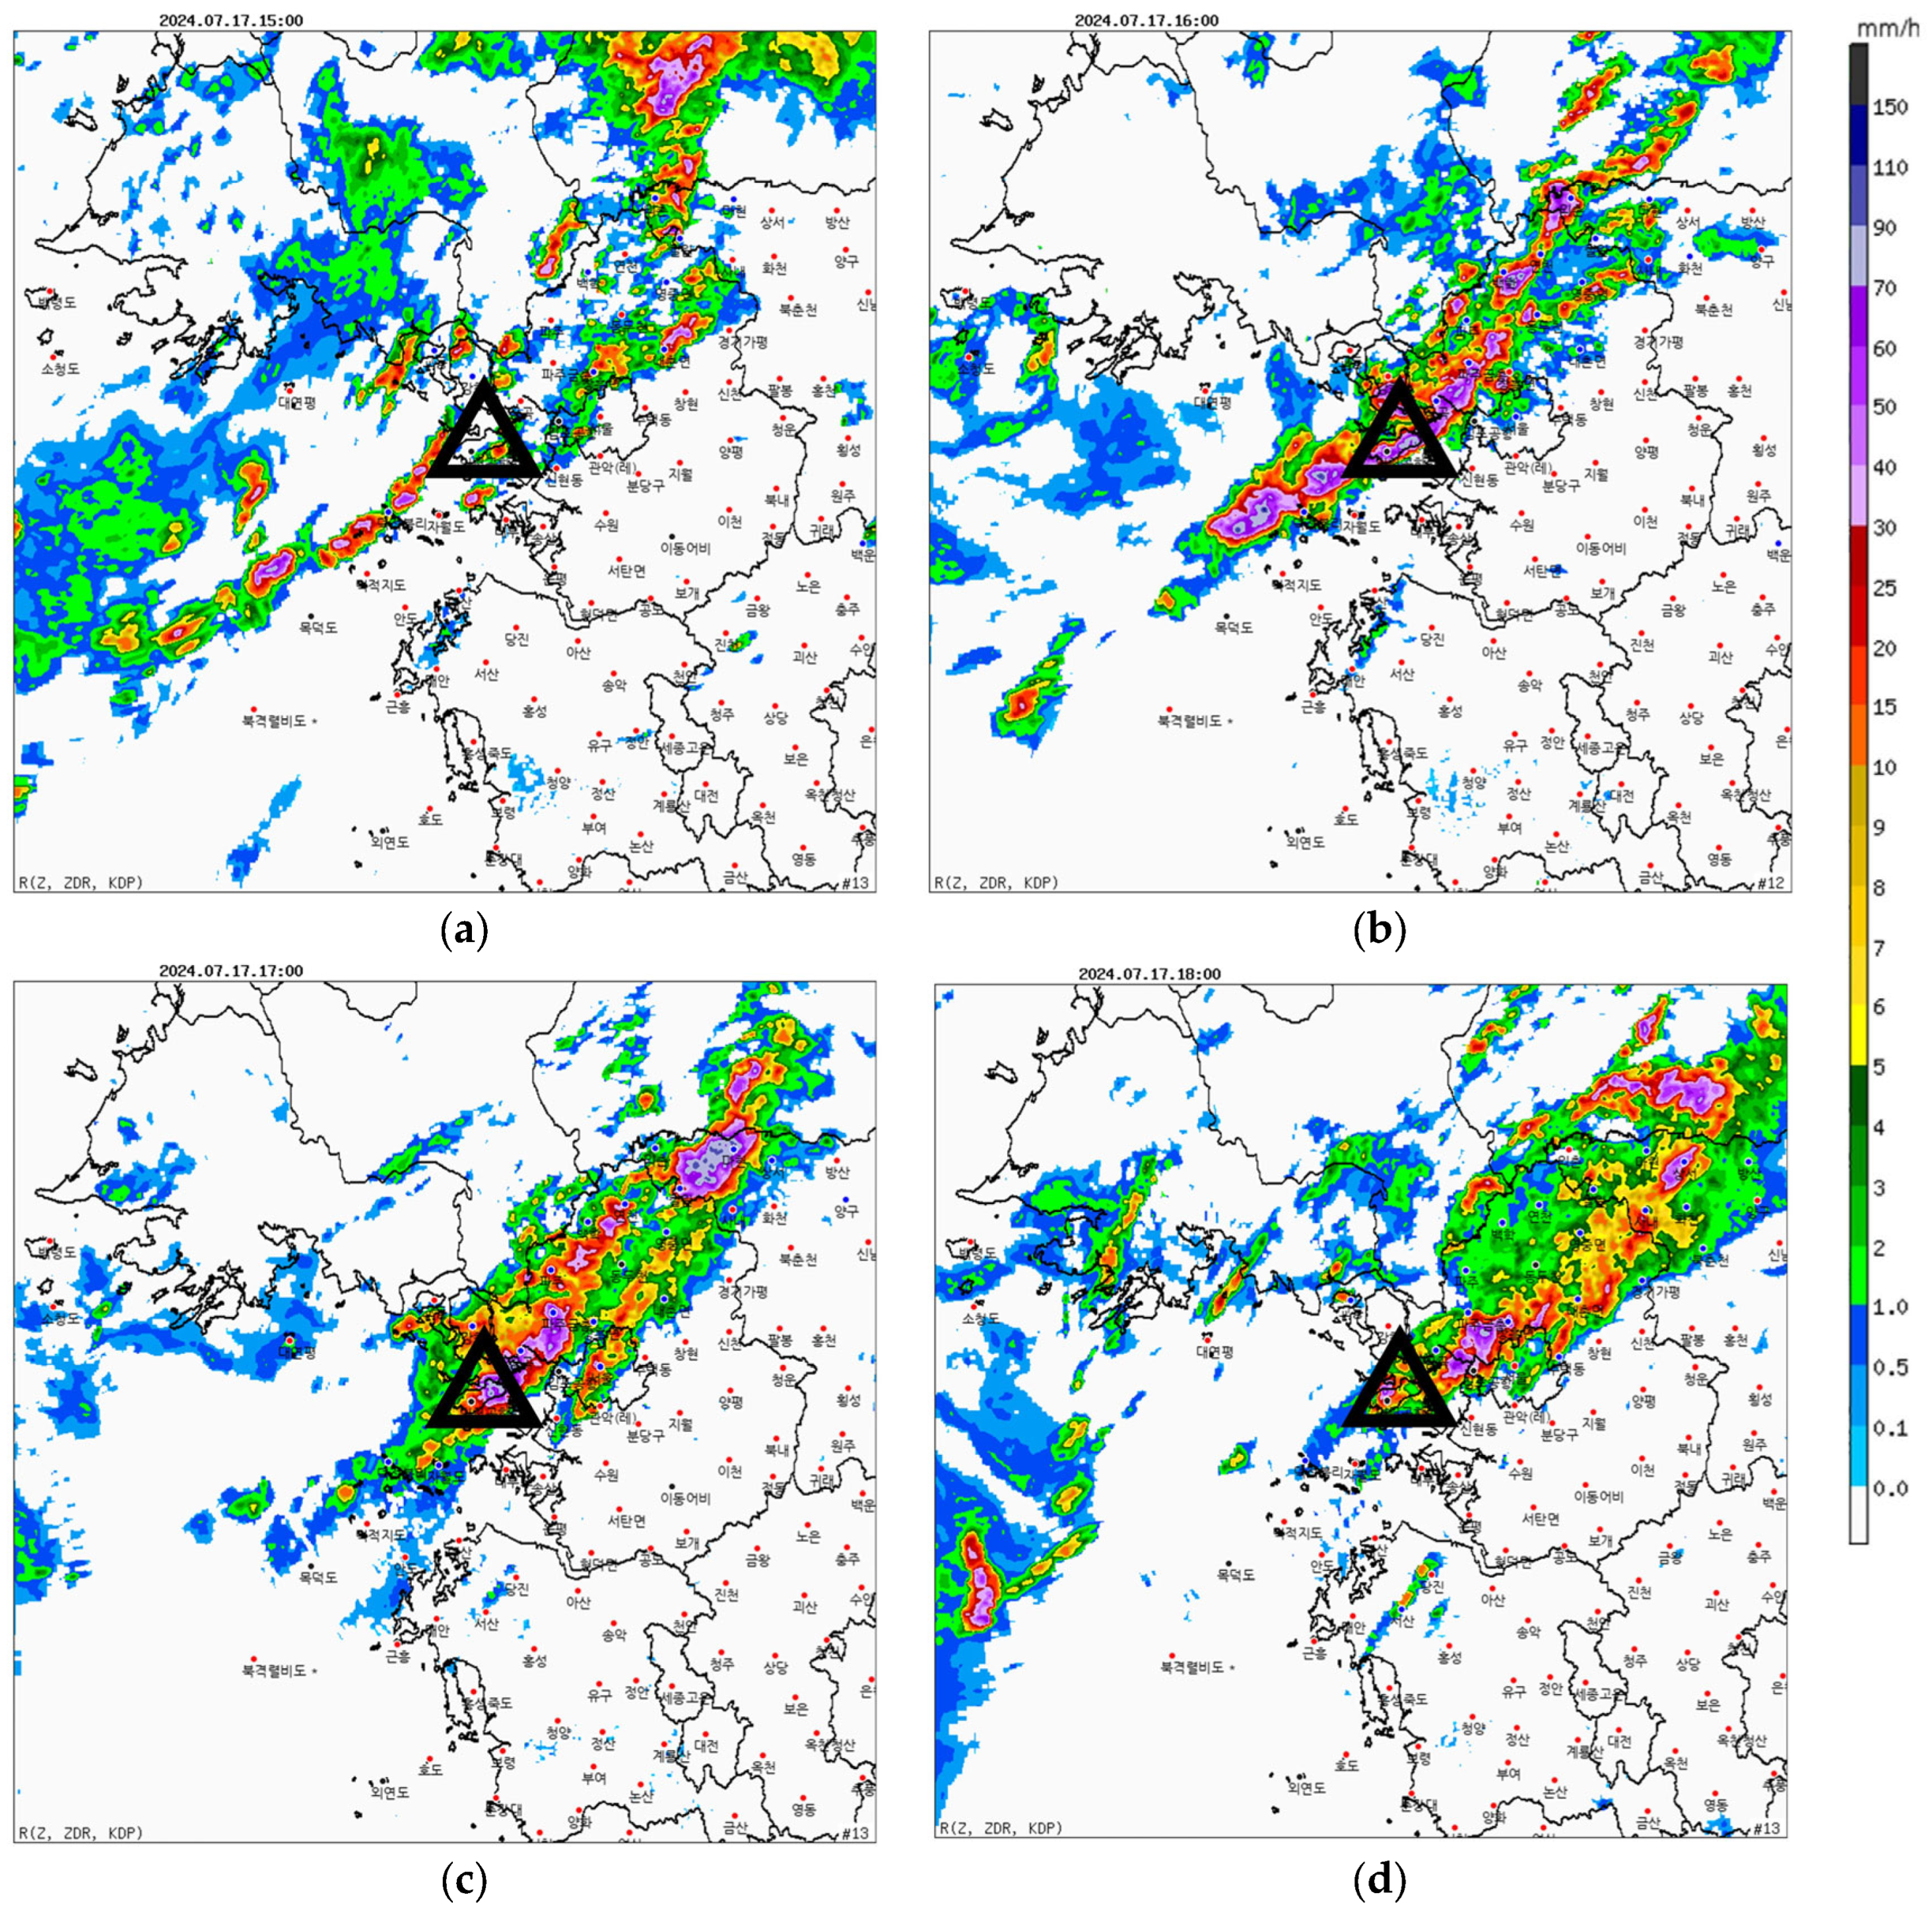
To examine the spatial distribution of precipitation before and after the peak, radar-derived rainfall distributions were analyzed (Figure 4). Prior to the peak (1500 LST), a linear rainband developed over the Yellow Sea, extending from the west of Gyeonggi Bay in the northeastern Yellow Sea to the Incheon–Gimpo area, with a distinct southwest–northeast orientation. Maximum rainfall rates exceeding 80 mm h−1 began to appear over Gyeonggi Bay and the western coastal areas, while the Incheon Airport site was just entering the core of the rainband.
At the peak time (1600 LST), the rainband crossed Gyeonggi Bay and produced extremely heavy rainfall centered on Incheon Airport. Within a radius of several kilometers, extreme rainfall exceeding 100–150 mm h−1 was observed, with the rainfall core spanning Incheon Airport, and the western part of Gimpo Airport. By 1700 LST, the strong rainband had shifted eastward, extending into northern Seoul and northeastern Gyeonggi Province. Rainfall intensity near Incheon Airport began to weaken at this stage, although localized heavy rainfall exceeding 50 mm h−1 continued to be observed over parts of Gyeonggi Bay. By 1800 LST, the main rainfall core had moved further eastward into the eastern metropolitan area and southwestern Gangwon Province, while the Incheon Airport region transitioned to moderate or light rainfall.
Radar-derived precipitation distributions therefore confirmed that Incheon Airport was located at the core of the line-shaped rainband around 1600 LST, directly experiencing extreme rainfall, consistent with the peak period identified in the time series analysis.
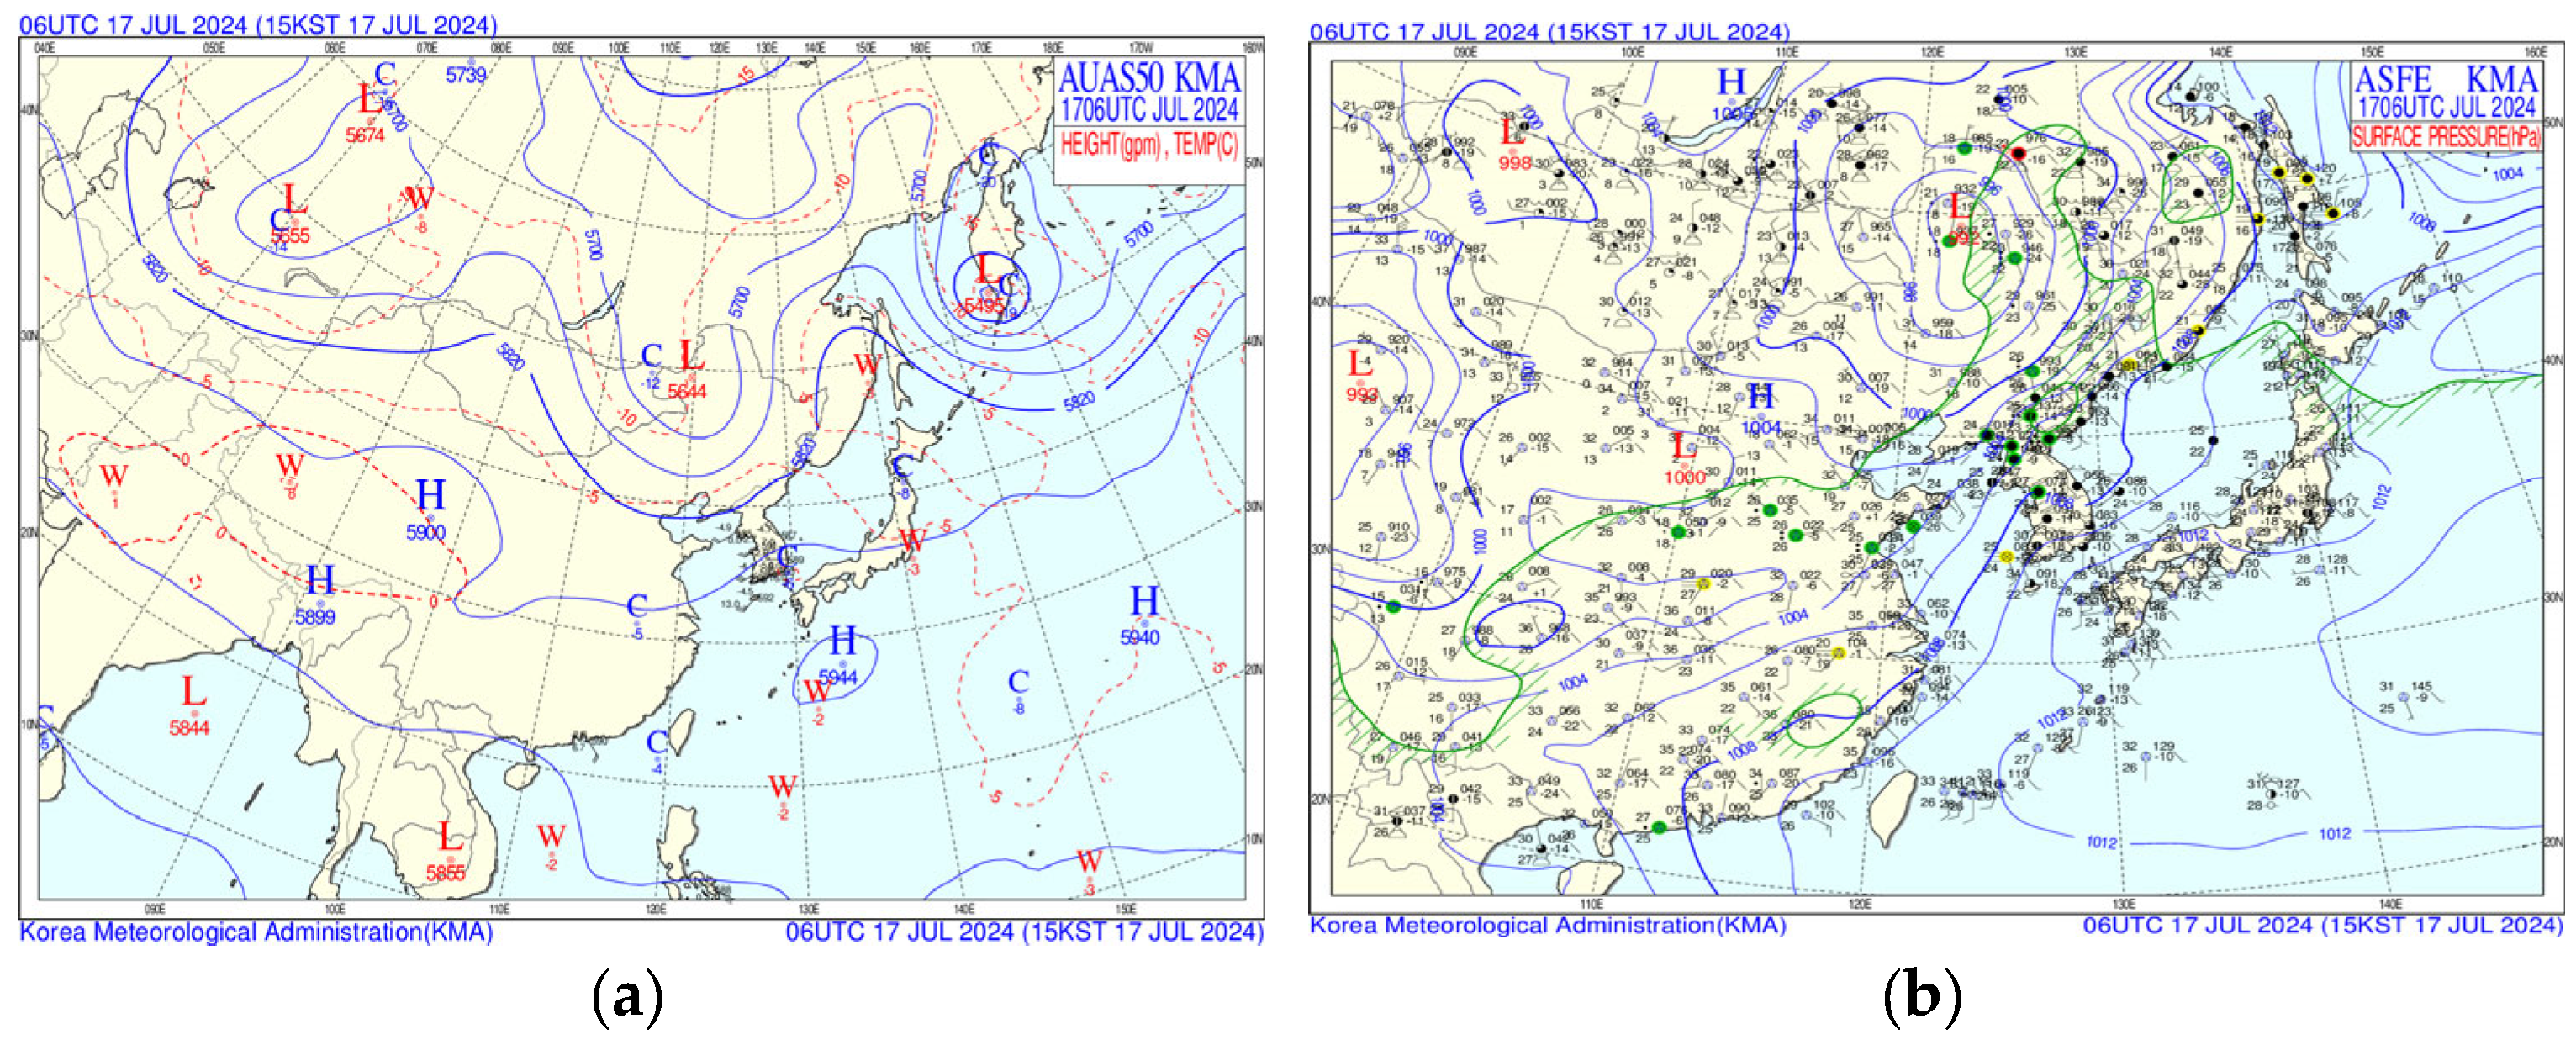
To investigate the mechanism of the line-shaped rainband and the heavy rainfall over Incheon Airport, synoptic-scale atmospheric circulation patterns were analyzed using weather charts. The 500 hPa upper-level chart at 1500 LST (Figure 5a) displayed a typical Ω-blocking pattern, with a low-pressure system over Northeast China, a high-pressure system over Sakhalin Island, and another low-pressure system over the Kamchatka Peninsula. This upper-level wave pattern contributed to the formation and persistence of a stationary front over the Korean Peninsula. In addition, a mid-level trough extending from Northeast China to the Shandong Peninsula reached into central Korea, providing favorable large-scale ascent for convective development.
The surface chart at the same time (Figure 5b) showed a stationary low-pressure system over Northeast China and the periphery of the North Pacific High extending into southeastern Korea. This environment enhanced the pressure gradient along the western coast of Korea, promoting the development of a strong low-level jet. Strong westerly and southwesterly winds transported large amounts of water vapor into Gyeonggi Bay in the northeastern Yellow Sea and the western coastal areas, where convergence and ascent near the stationary front triggered intense short-duration rainfall.
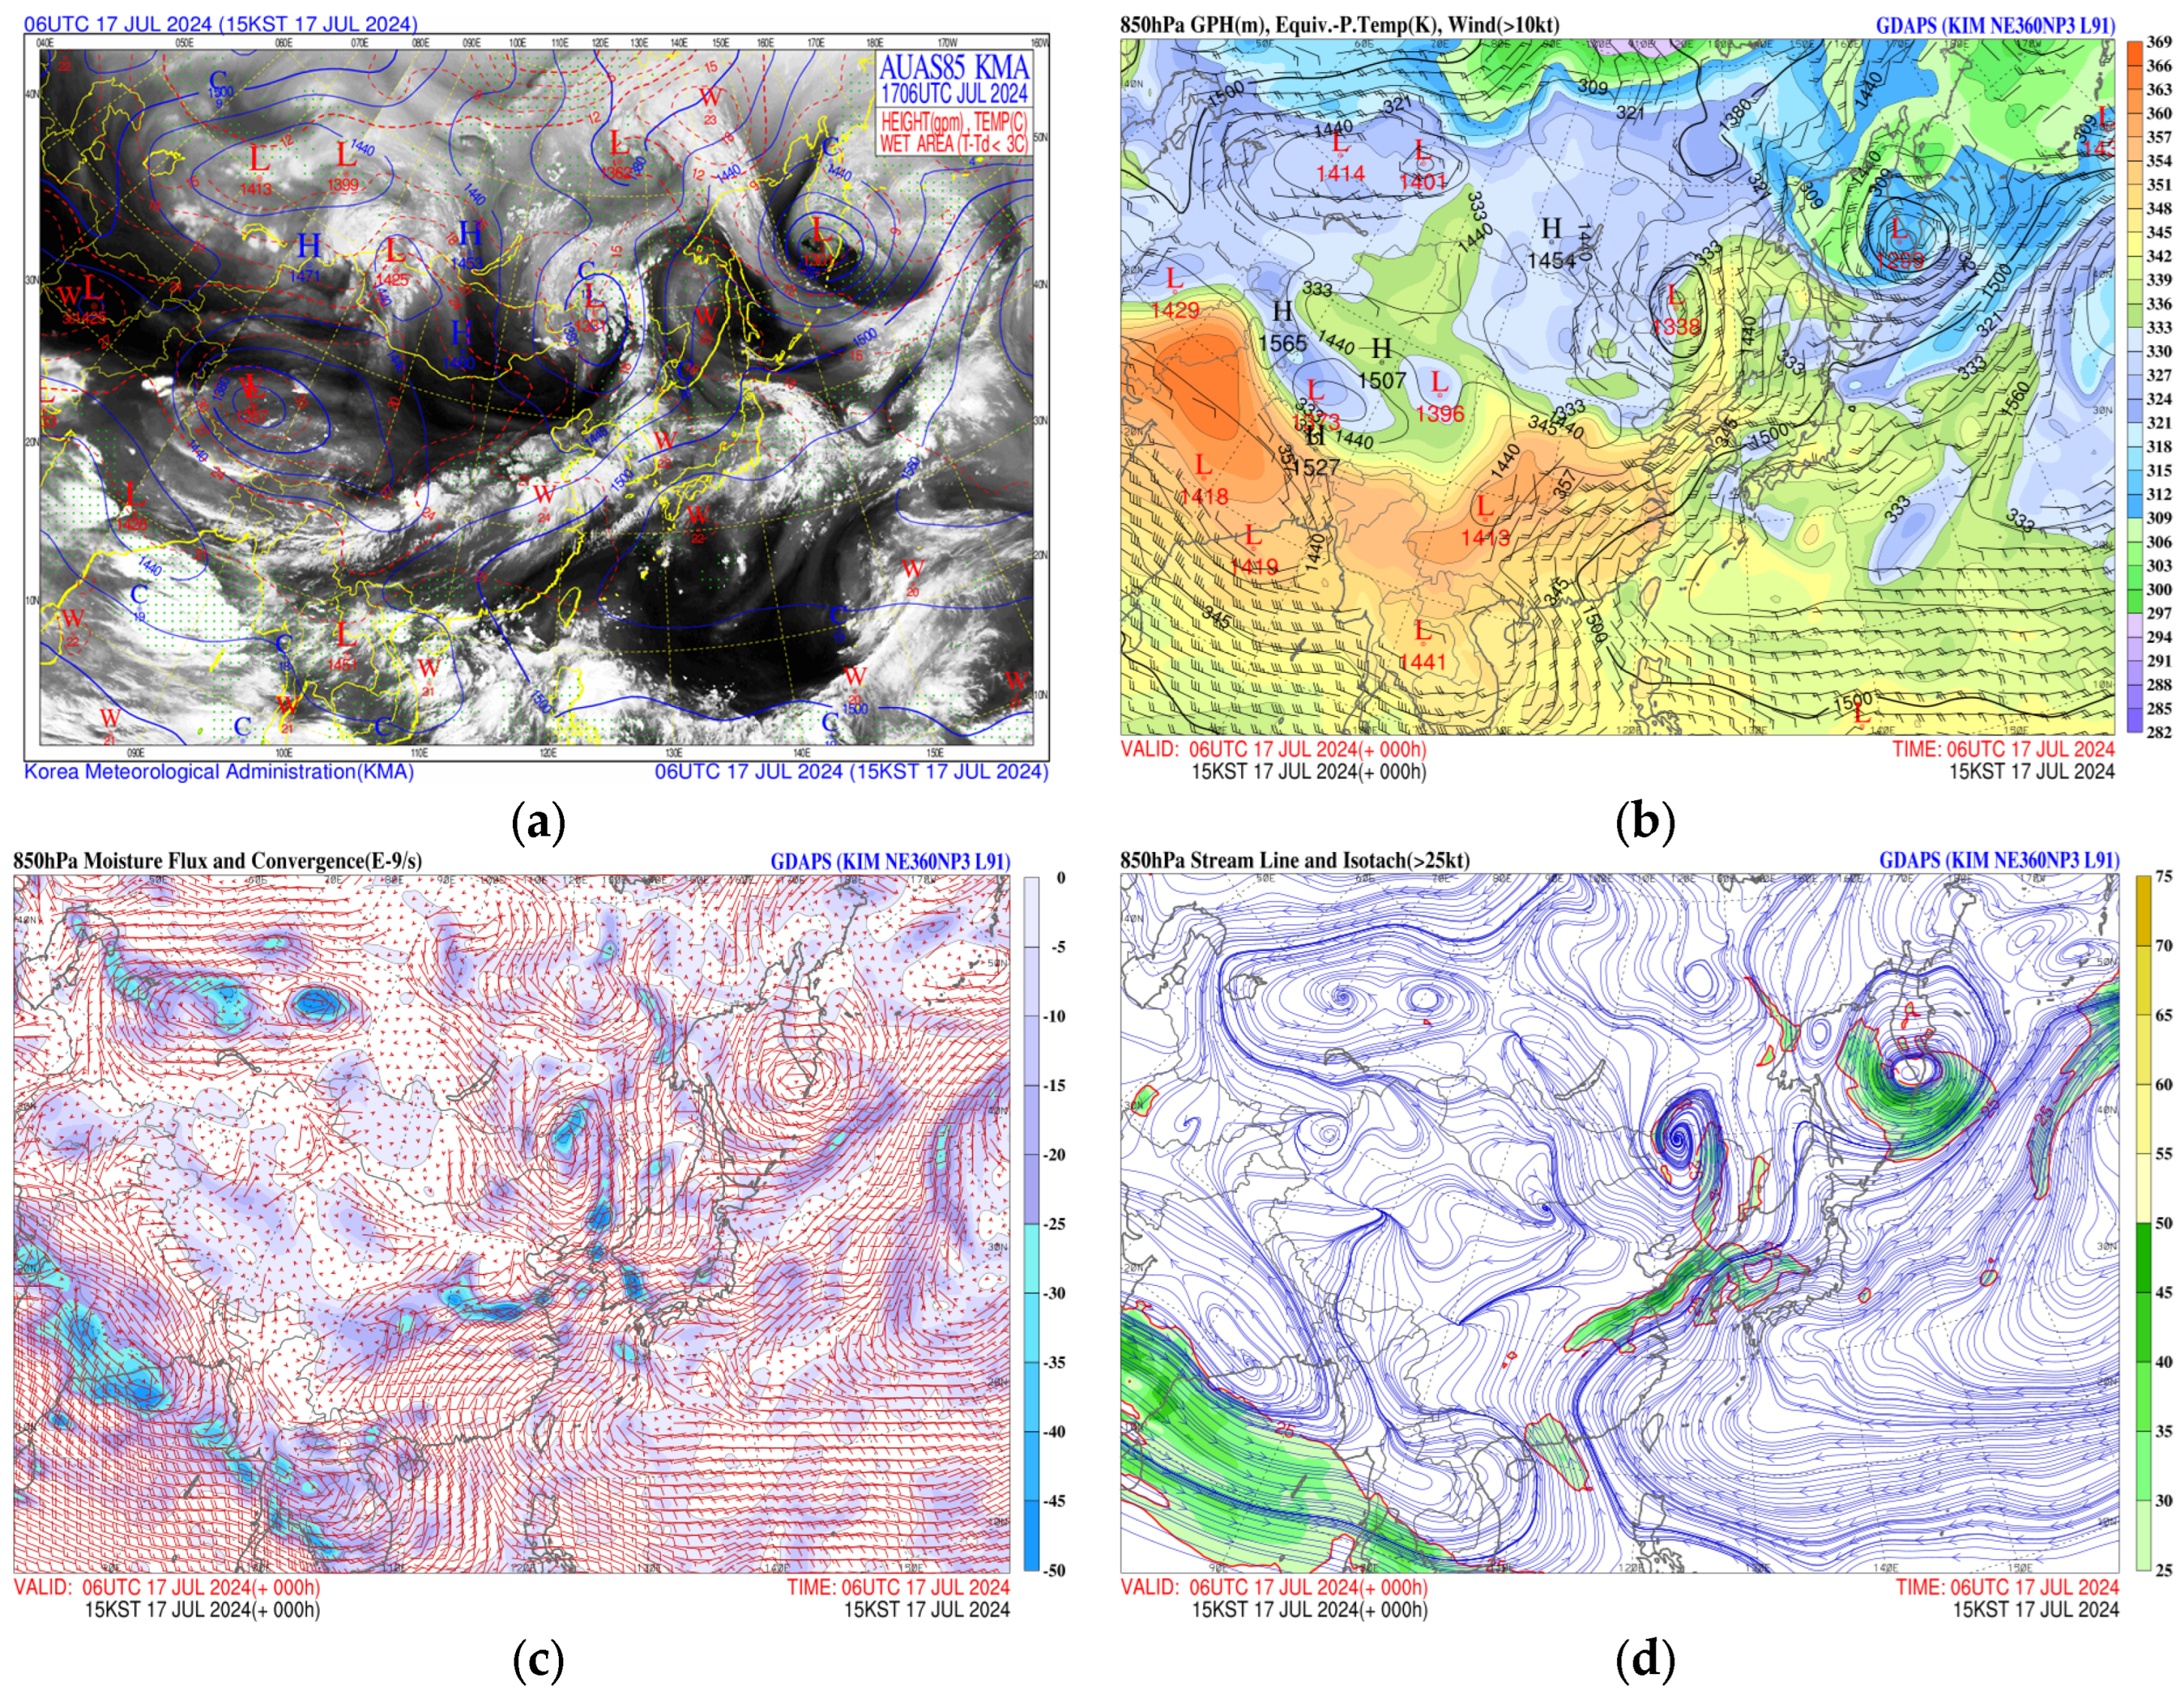
The heavy rainfall event over the Seoul metropolitan area was induced by the interaction between moisture transport from the Yellow Sea and large-scale atmospheric circulation. According to the 850-hPa weather chart and GK2A water vapor imagery (Figure 6a), abundant moisture was continuously supplied from the Yellow Sea into the metropolitan region, and this inflow coincided with the local convergence, thereby triggering intense convective development. In particular, a blocking high located over northern Korea caused stagnation of the synoptic flow, which allowed the rainband to persist over the same region for an extended period. Meanwhile, the western periphery of the North Pacific High provided a pathway for southwesterly flow, enabling the continuous influx of warm and moist air from the Yellow Sea into the Seoul metropolitan area.
Equivalent potential temperature (θe) analysis at 850 hPa (Figure 6b) at 1500 LST showed a distinct high-θe region across central Korea and the western coastal areas, indicating abundant low-level moisture and potential for enhanced instability. The high-θe zone observed over the western sea coincided with the inflow pathway of the southwesterly low-level jet, providing an environment favorable for convective development along the moisture transport pathway. The high θe air further enhanced convection through latent heat release during ascent, contributing to short-duration heavy rainfall.
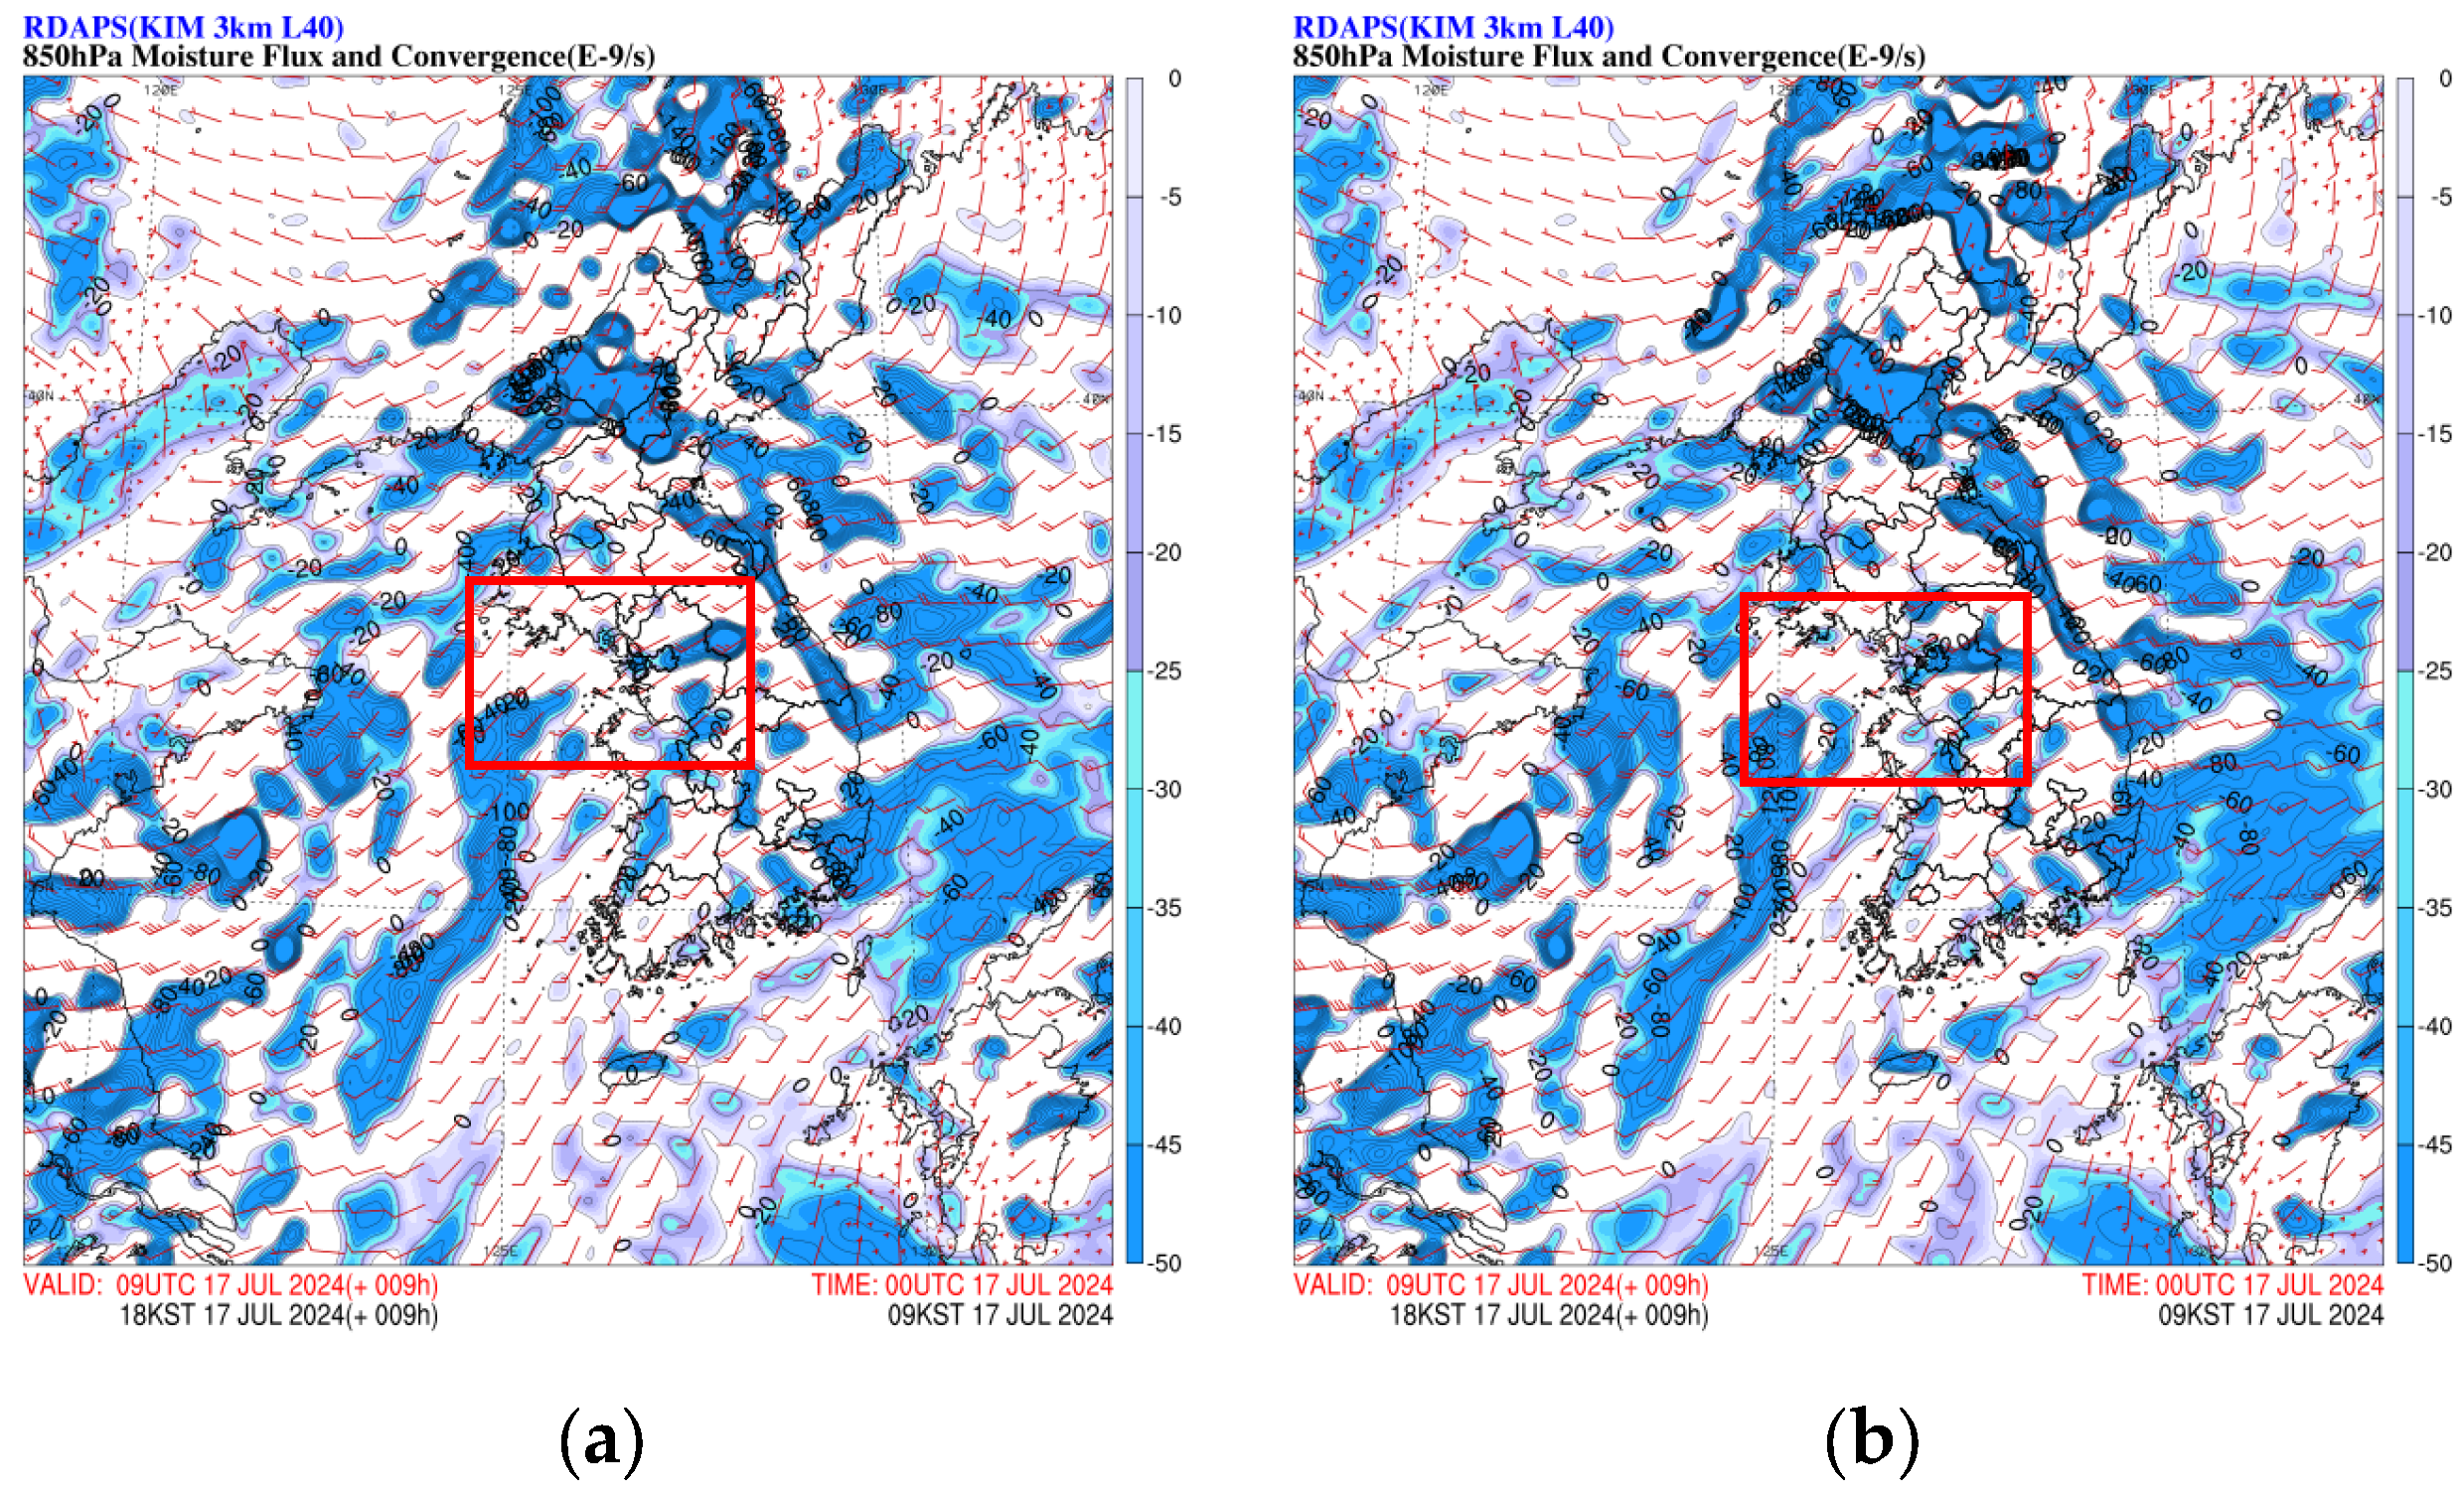
Moisture flux analysis at 850 hPa (Figure 6c) confirmed strong southwesterly moisture transport into Gyeonggi Bay and the western coast of the metropolitan area. The axis of maximum moisture flux was found to coincide with the observed rainfall maxima between 1500 and 1900 LST, indicating a direct association between the low-level jet and rainfall development.
Furthermore, analysis of the 850 hPa streamline and isotach fields (Figure 6d) revealed the presence of a strong low-level jet propagating northeastward from the Yellow Sea toward central Korea. This jet not only enhanced the transport of warm and moist air but also intensified vertical shear and convergence, thereby contributing to localized convective development. These characteristics are consistent with the 850-hPa equivalent potential temperature distribution and moisture flux, both of which directly link to the occurrence of the heavy rainfall in the Seoul metropolitan area.
This case represents a typical summer heavy rainfall event over the Korean Peninsula, characterized by stationary fronts sustained by upper-level Ω-blocking and strong low-level jets that facilitated moisture transport and mesoscale convective system (MCS) development. In particular, the strong westerly–southwesterly inflow from the Yellow Sea into the metropolitan region induced significant moisture transport over Gyeonggi Bay, where enhanced instability near the stationary front triggered rapid convective development. As a result, localized heavy rainfall was intensified within a short time, consistent with the rainfall time series and radar observations.
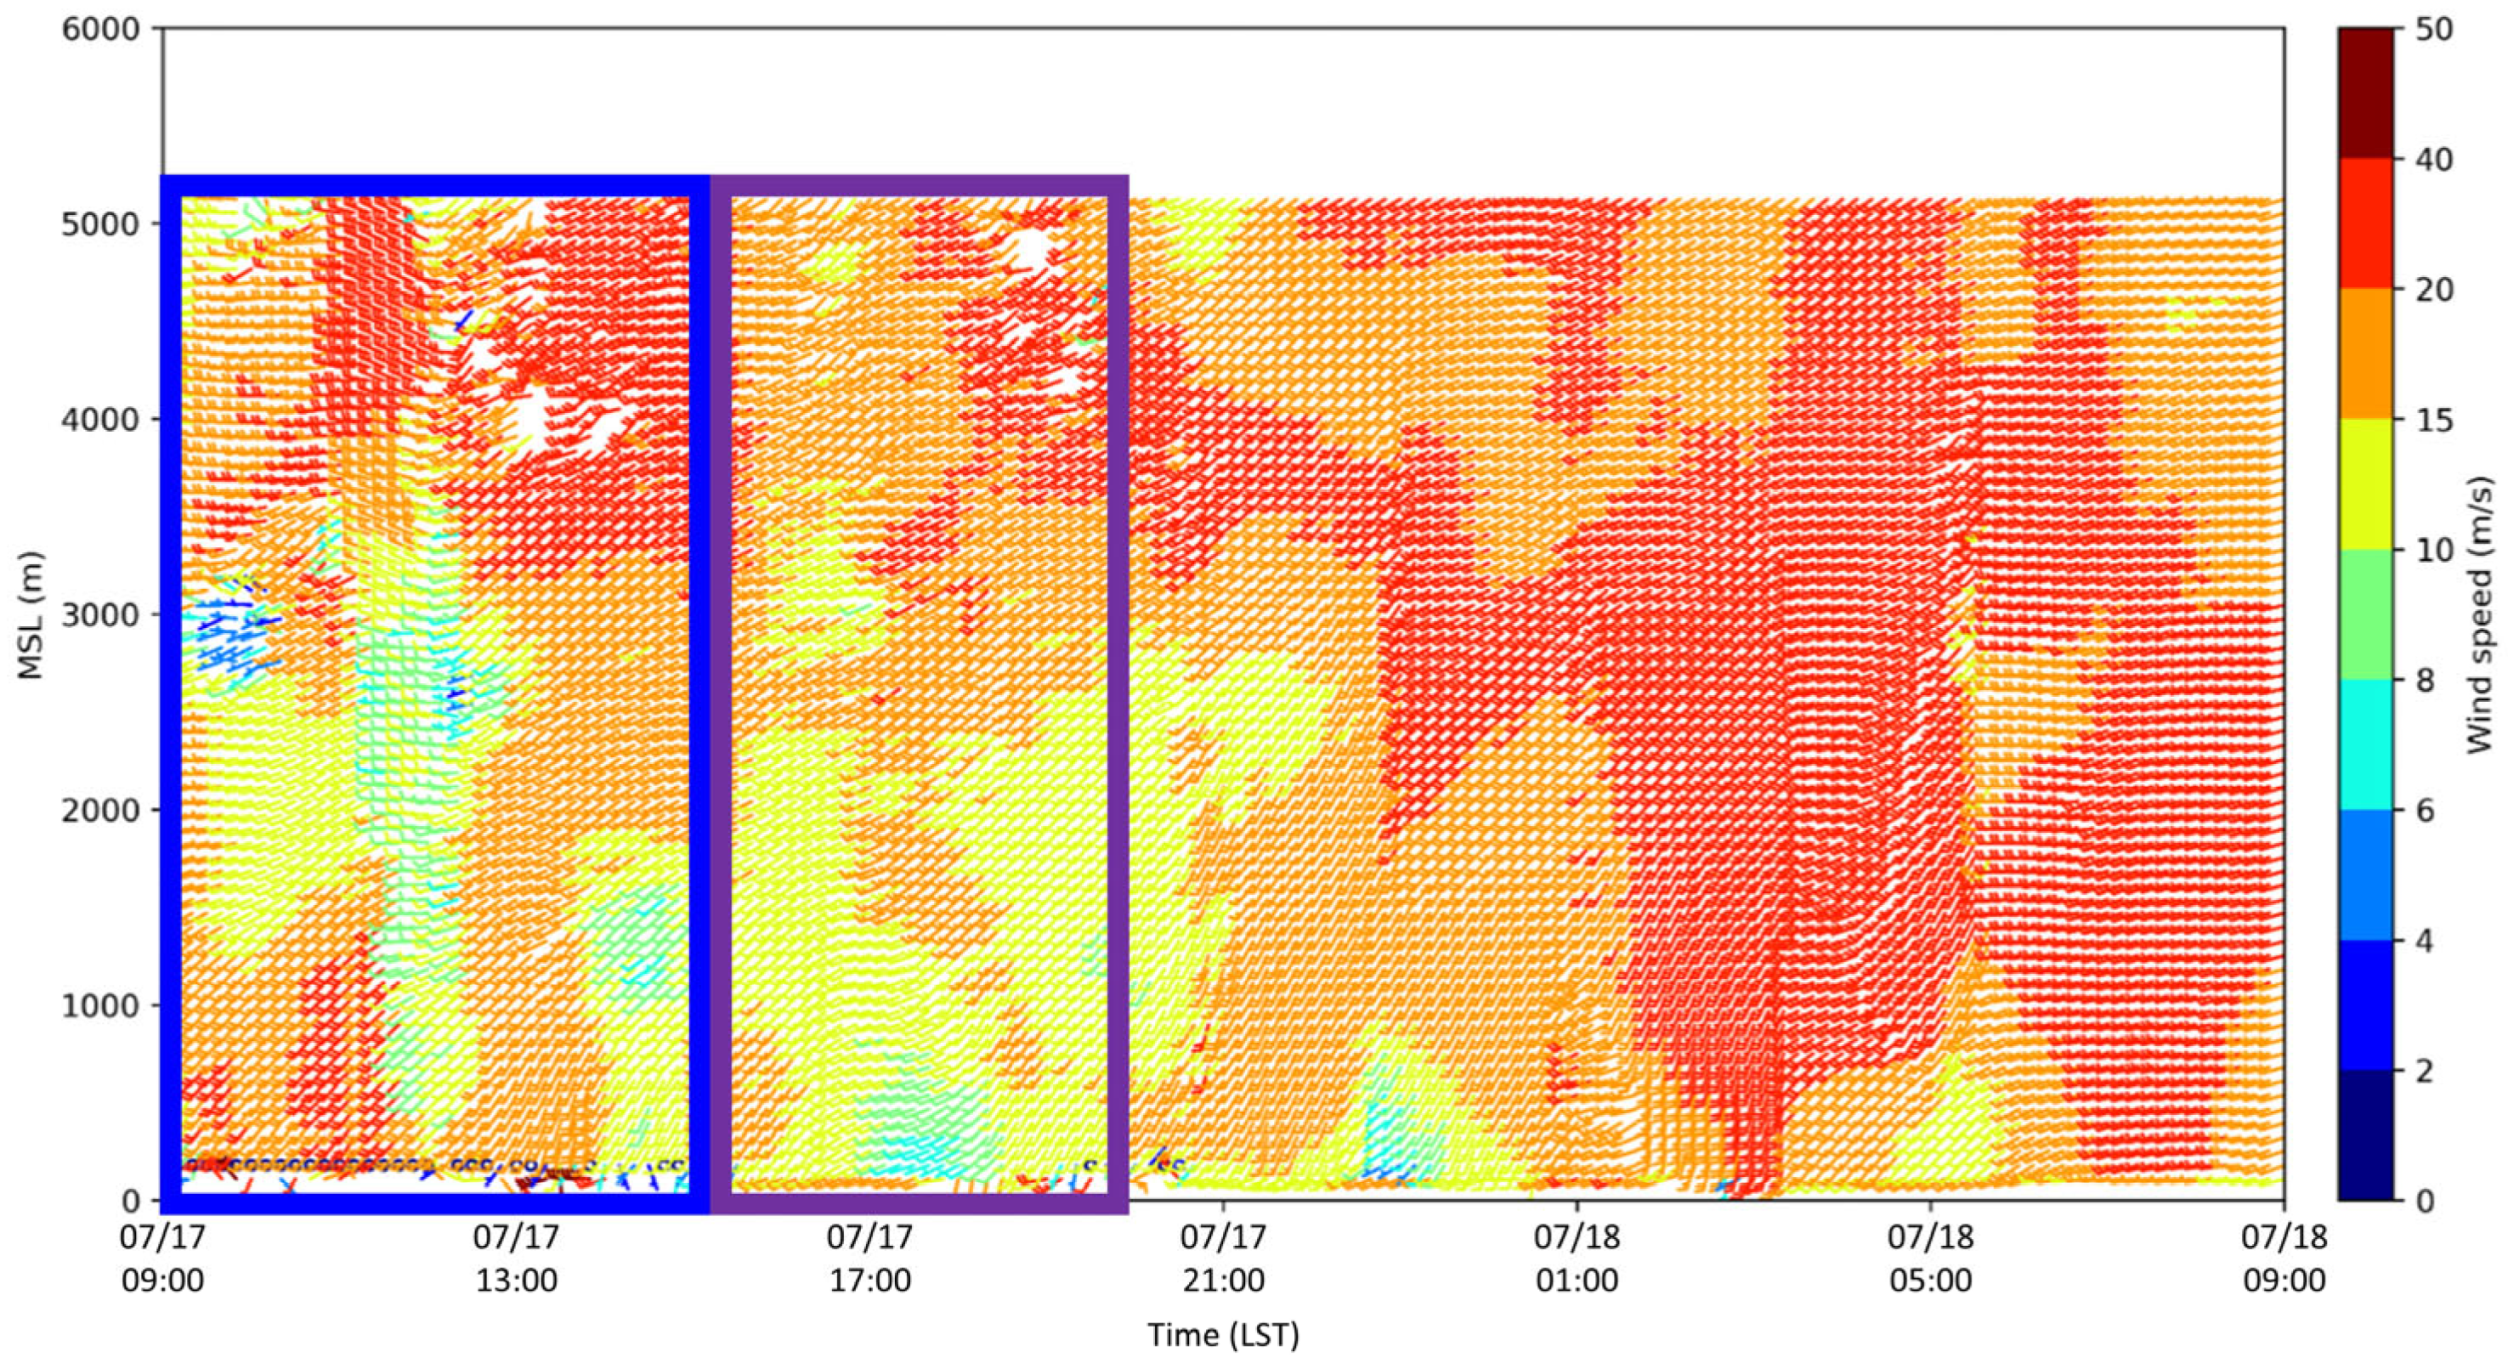
Vertical wind profiles observed by the wind profiler at Incheon Airport further confirmed the existence and persistence of the low-level jet. Prior to the rainfall event (0900–1500 LST), which is indicated by the blue box in Figure 7, the profiler detected intensifying westerly winds in the lower troposphere, indicating the development of the low-level jet. This inflow continuously supplied moisture from Gyeonggi Bay and the Yellow Sea, strengthening instability by inducing warm advection up to mid-levels.
During the heavy rainfall period (1500–1900 LST), which is indicated by the purple box in Figure 7, the low-level jet maintained strong wind speeds, sustaining moisture transport. The resulting convergence and ascent near the stationary front supported the development and persistence of the line-shaped rainband and the heavy rainfall event.
Such analyses using vertical wind profiler data provided a more detailed understanding of rainfall development mechanisms compared to surface-based analyses alone. The observed development and persistence of the low-level jet were consistent with the rainfall time series and radar-based rainband evolution, providing essential evidence for improving forecast accuracy.

3.2. Study on the Use of Intensive Observation Data for Data Assimilation

Mesoscale Convective Systems (MCSs) often develop and dissipate within only a few hours, so even small errors in the initial conditions can have a significant impact on forecast performance. Therefore, assimilating high-resolution and high-frequency observations is essential for improving prediction accuracy. In this section, we present results from a preliminary study in which observational data collected from the Korea Precipitation Observation Program (KPOP)—including upper-air and remote sensing measurements—were assimilated into the Korea Meteorological Administration (KMA) operational regional model (KIM-RDAPS) using the three-dimensional variational method (WRF-3DVAR, version 4.1.3) [24]. This experiment was designed to evaluate improvements in the initial fields and forecast performance for a heavy rainfall event.
Table 2 summarizes the experimental configuration used in this study. The numerical experiments employed a horizontal resolution of 3 km × 3 km with a grid size of 1050 (east–west) × 840 (north–south) × 40 (vertical levels), enabling representation of mesoscale atmospheric structures and localized precipitation features. For cumulus parameterization, the KSAS (KIM Simplified Arakawa-Schubert) scheme [25] was applied, while the WDM7 microphysics scheme [26] was used to represent the generation, growth, and dissipation of hydrometeors. Although the horizontal grid spacing is 3 km, a cumulus parameterization scheme was applied because this resolution lies within the convective gray zone, where deep convection is only partially resolved. In such a regime, unresolved convective updrafts and convective transport processes can still influence precipitation development. The KSAS scheme used in this study is a scale-aware cumulus parameterization designed to operate consistently across different model resolutions [27]. Previous studies have shown that applying a scale-aware cumulus parameterization in high-resolution models improves precipitation prediction compared to simulations without a cumulus scheme, indicating that cumulus parameterization performance remains important in gray-zone simulations [28,29].
The planetary boundary layer was parameterized using the Shin–Hong PBL scheme [30], and the surface layer with the revised MM5 Monin–Obukhov formulation [31]. Land surface processes were simulated using the five-layer thermal diffusion model (SLAB) [32], while radiative transfer was treated with the RRTMG K scheme [33] for both shortwave and longwave radiation. Initial and boundary conditions were provided by the KMA global model GDAPS (KIM-GDAPS) analysis and forecast fields.
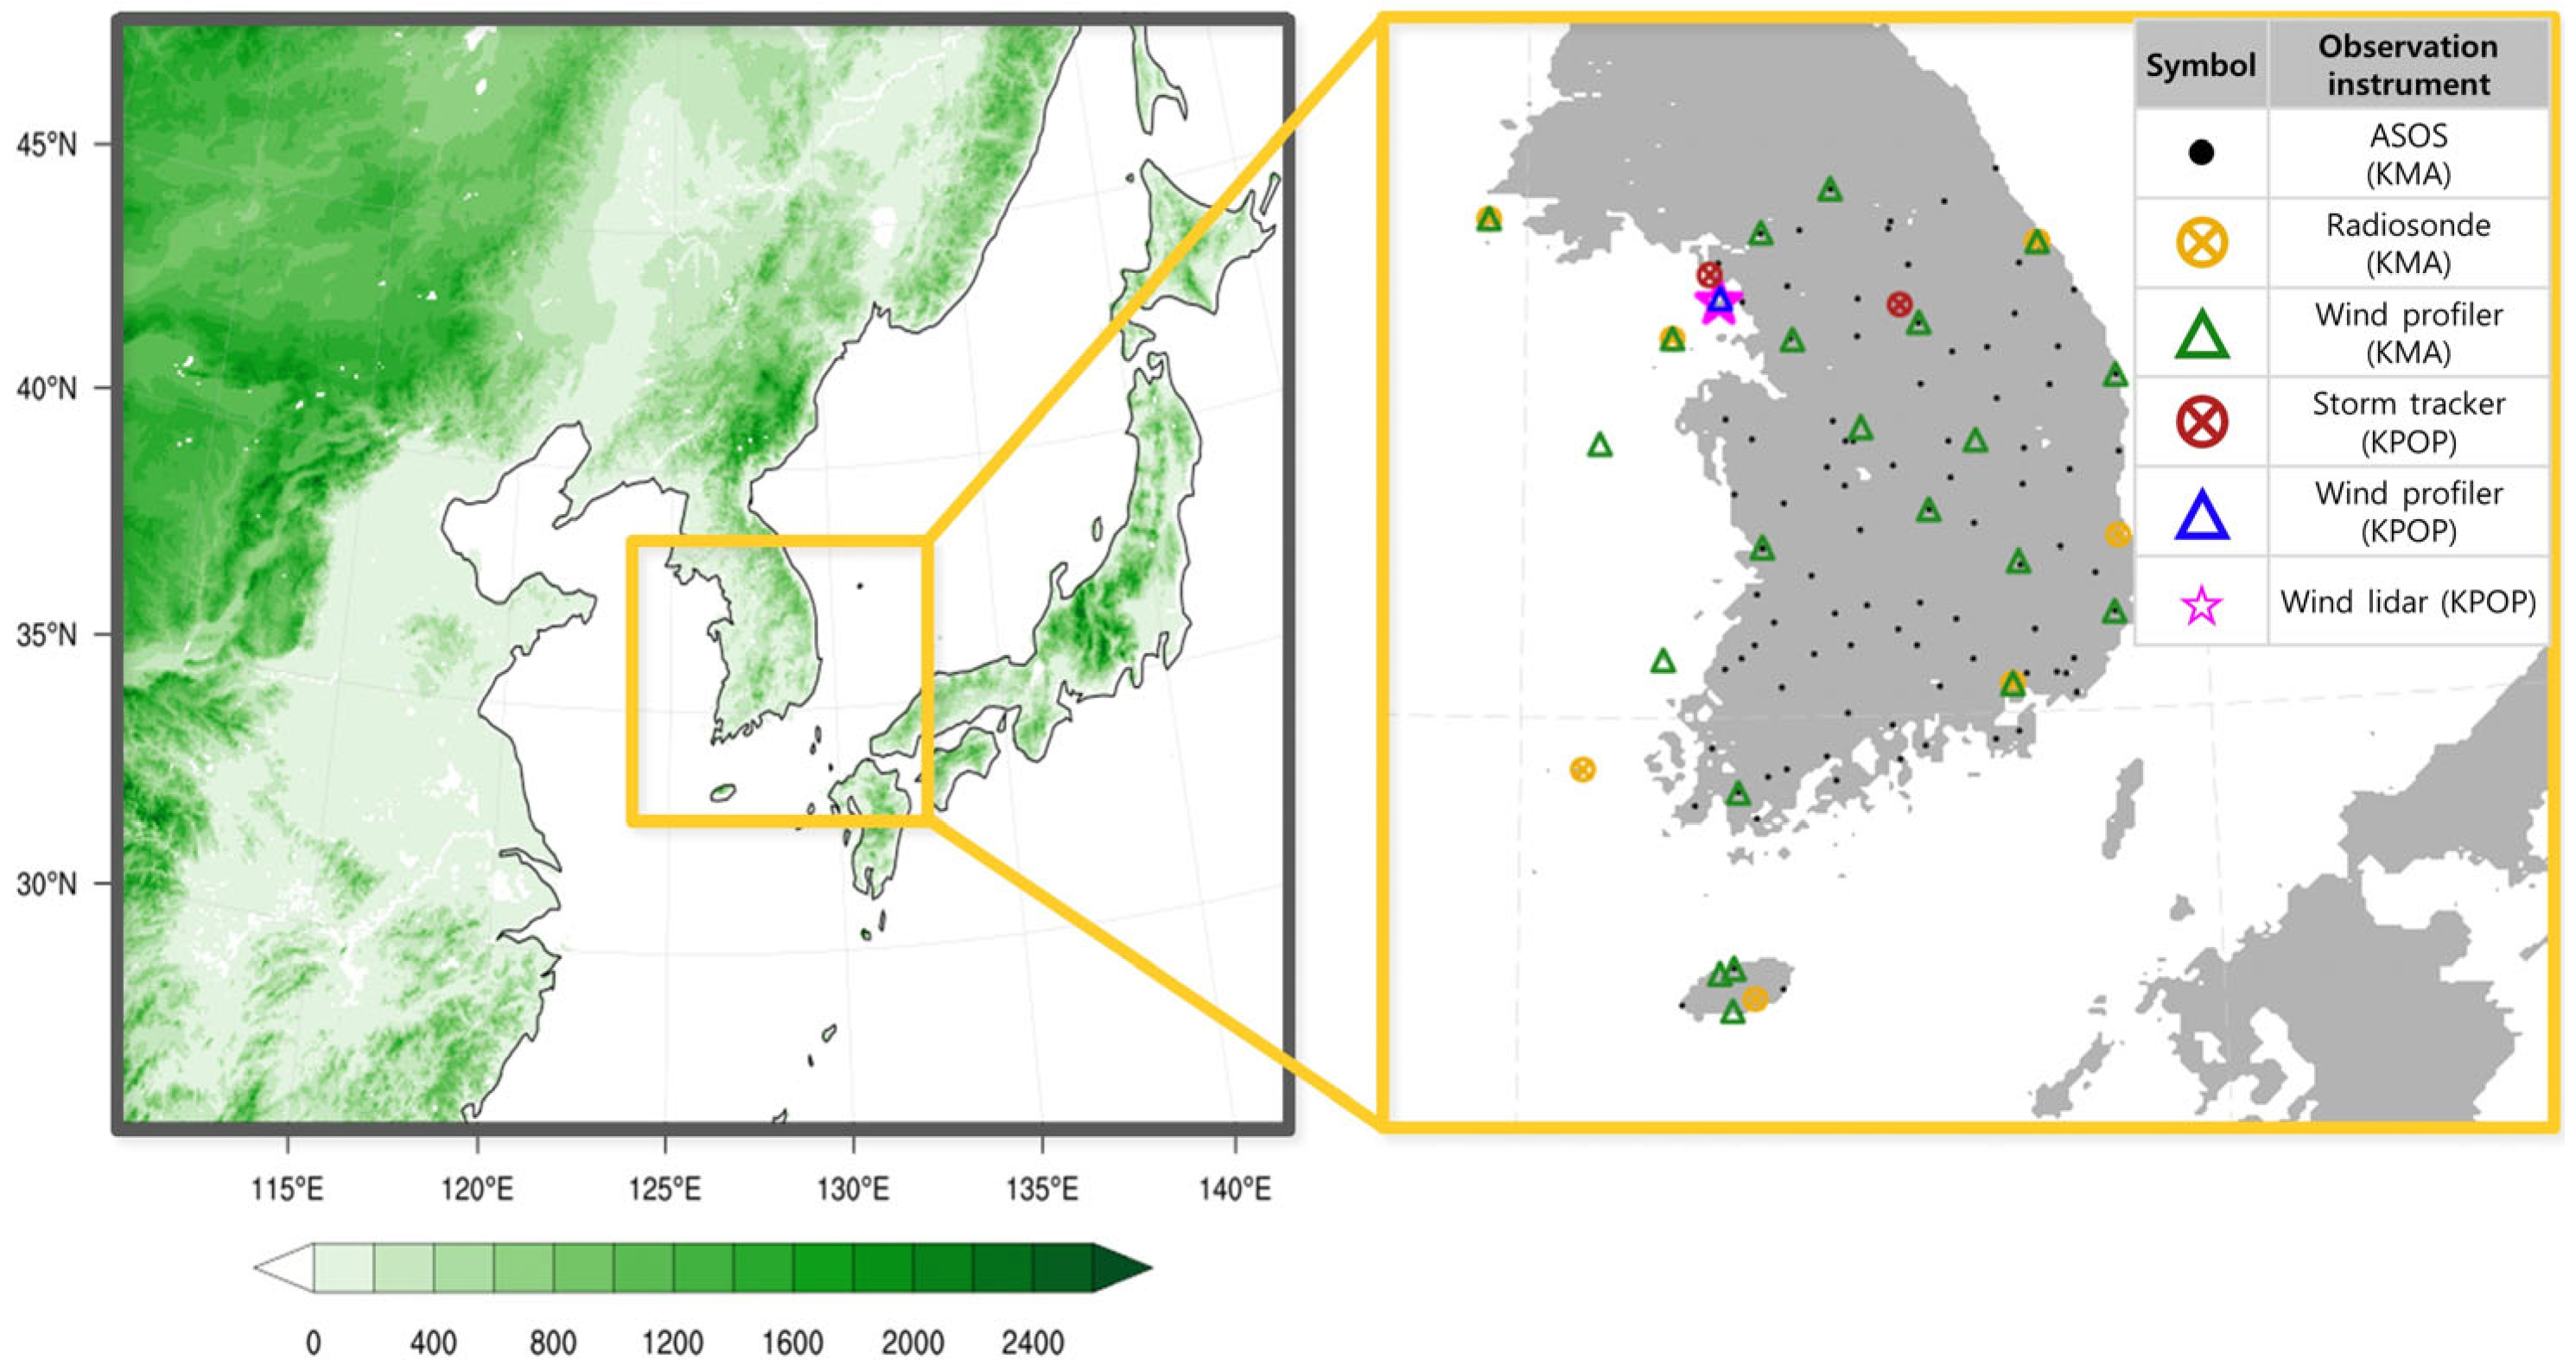
For data assimilation, both surface and upper-air observations were incorporated into the initial fields. Surface data consisted of temperature, humidity, wind direction, and wind speed from 96 ASOS stations. Upper-air data included vertical profiles of temperature, humidity, and wind from seven radiosonde sites, as well as vertical wind observations from 22 wind profilers. In addition, intensive observation data from the KPOP network were assimilated, including two storm trackers, one wind lidar, and one wind profiler at the KPOP supersite (Figure 8).
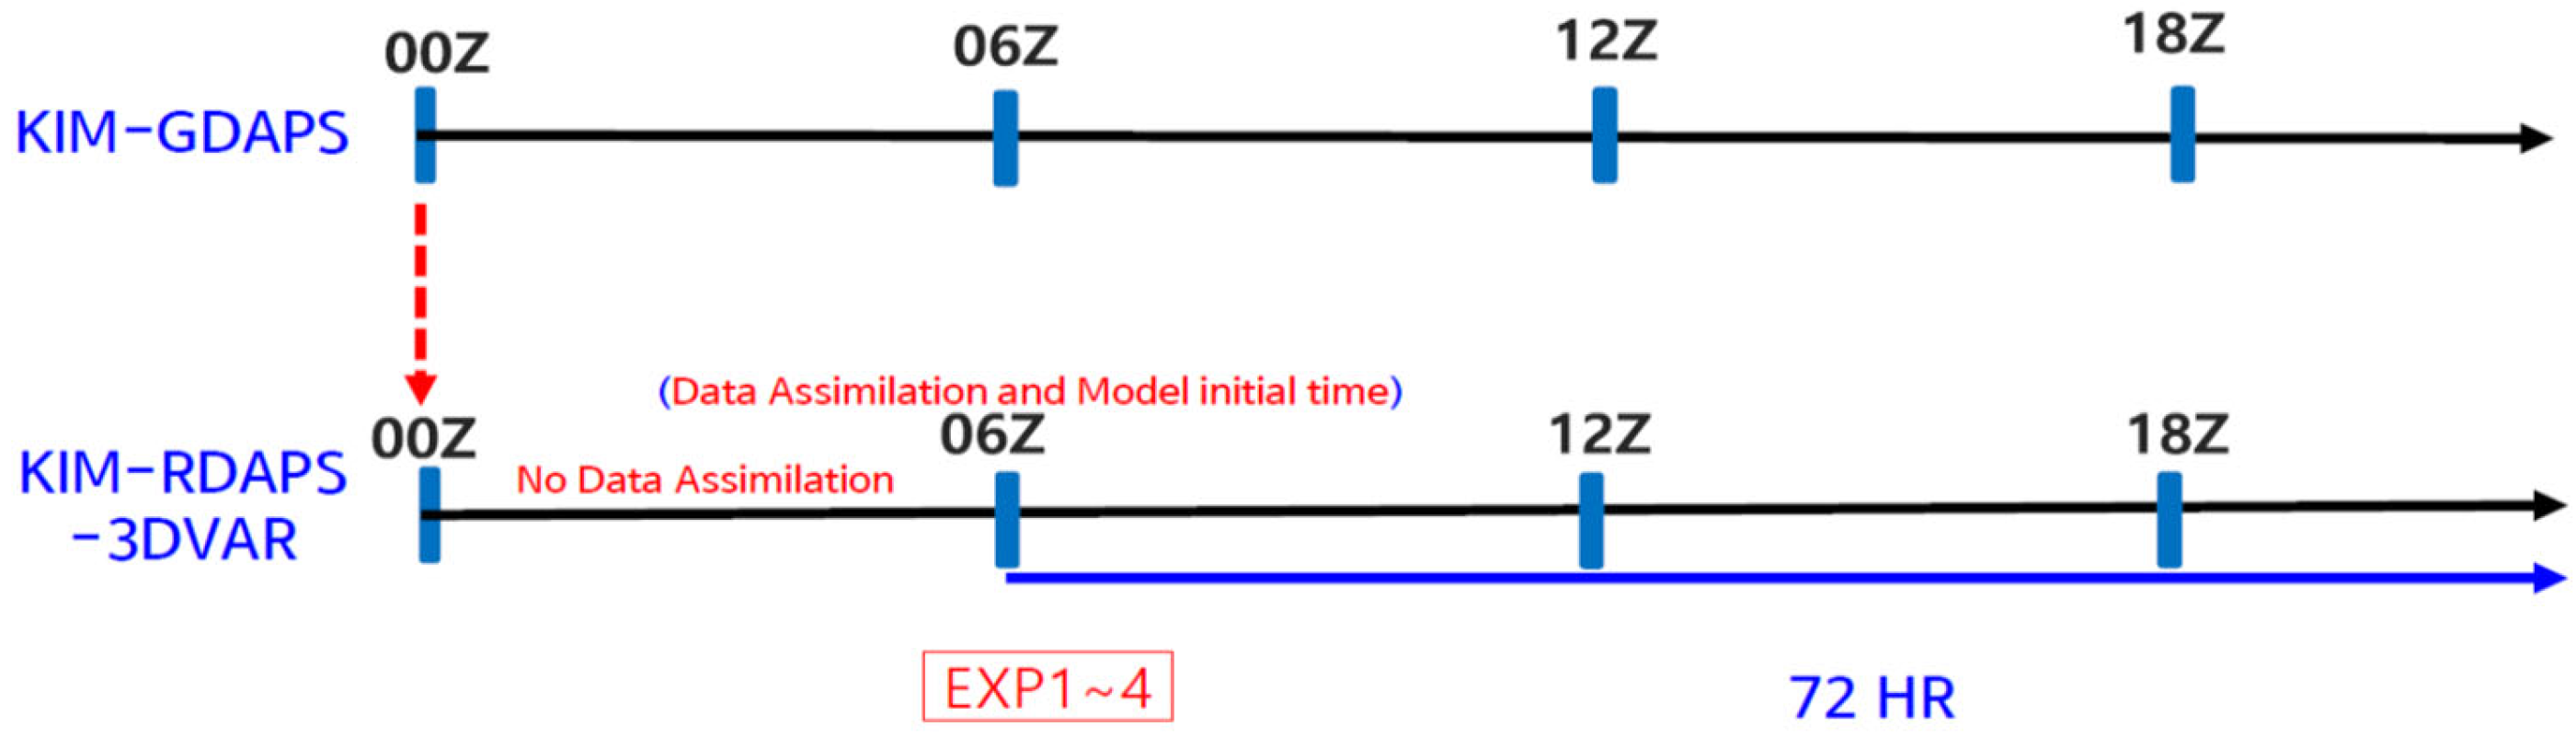
The experimental procedure was as follows: initial and boundary conditions from KIM-GDAPS were used to generate 6 h forecasts with KIM-RDAPS, which served as the background fields for data assimilation, by assimilating surface and upper-air data, including high-resolution remote sensing data from KPOP. Analysis fields were produced. Based on these analysis fields, 72 h forecasts were conducted, and the forecast accuracy of rainfall occurrence, location, and intensity was evaluated (Figure 9).
The assimilation experiments were designed with four configurations (EXP1–EXP4) depending on the observational datasets included. EXP1 assimilated operational observational data from the KMA, including surface data from ASOS stations, upper-air soundings from radiosondes, and vertical wind profiles from wind profilers. EXP2 ingested wind lidar and storm tracker observations from the KPOP program, while EXP3 incorporated wind lidar only. Finally, EXP4 included storm tracker data alone to examine its individual contribution to the prediction of convective systems (Table 3). This design allowed for quantitative evaluation of the contribution of each observational dataset to heavy rainfall prediction skill.
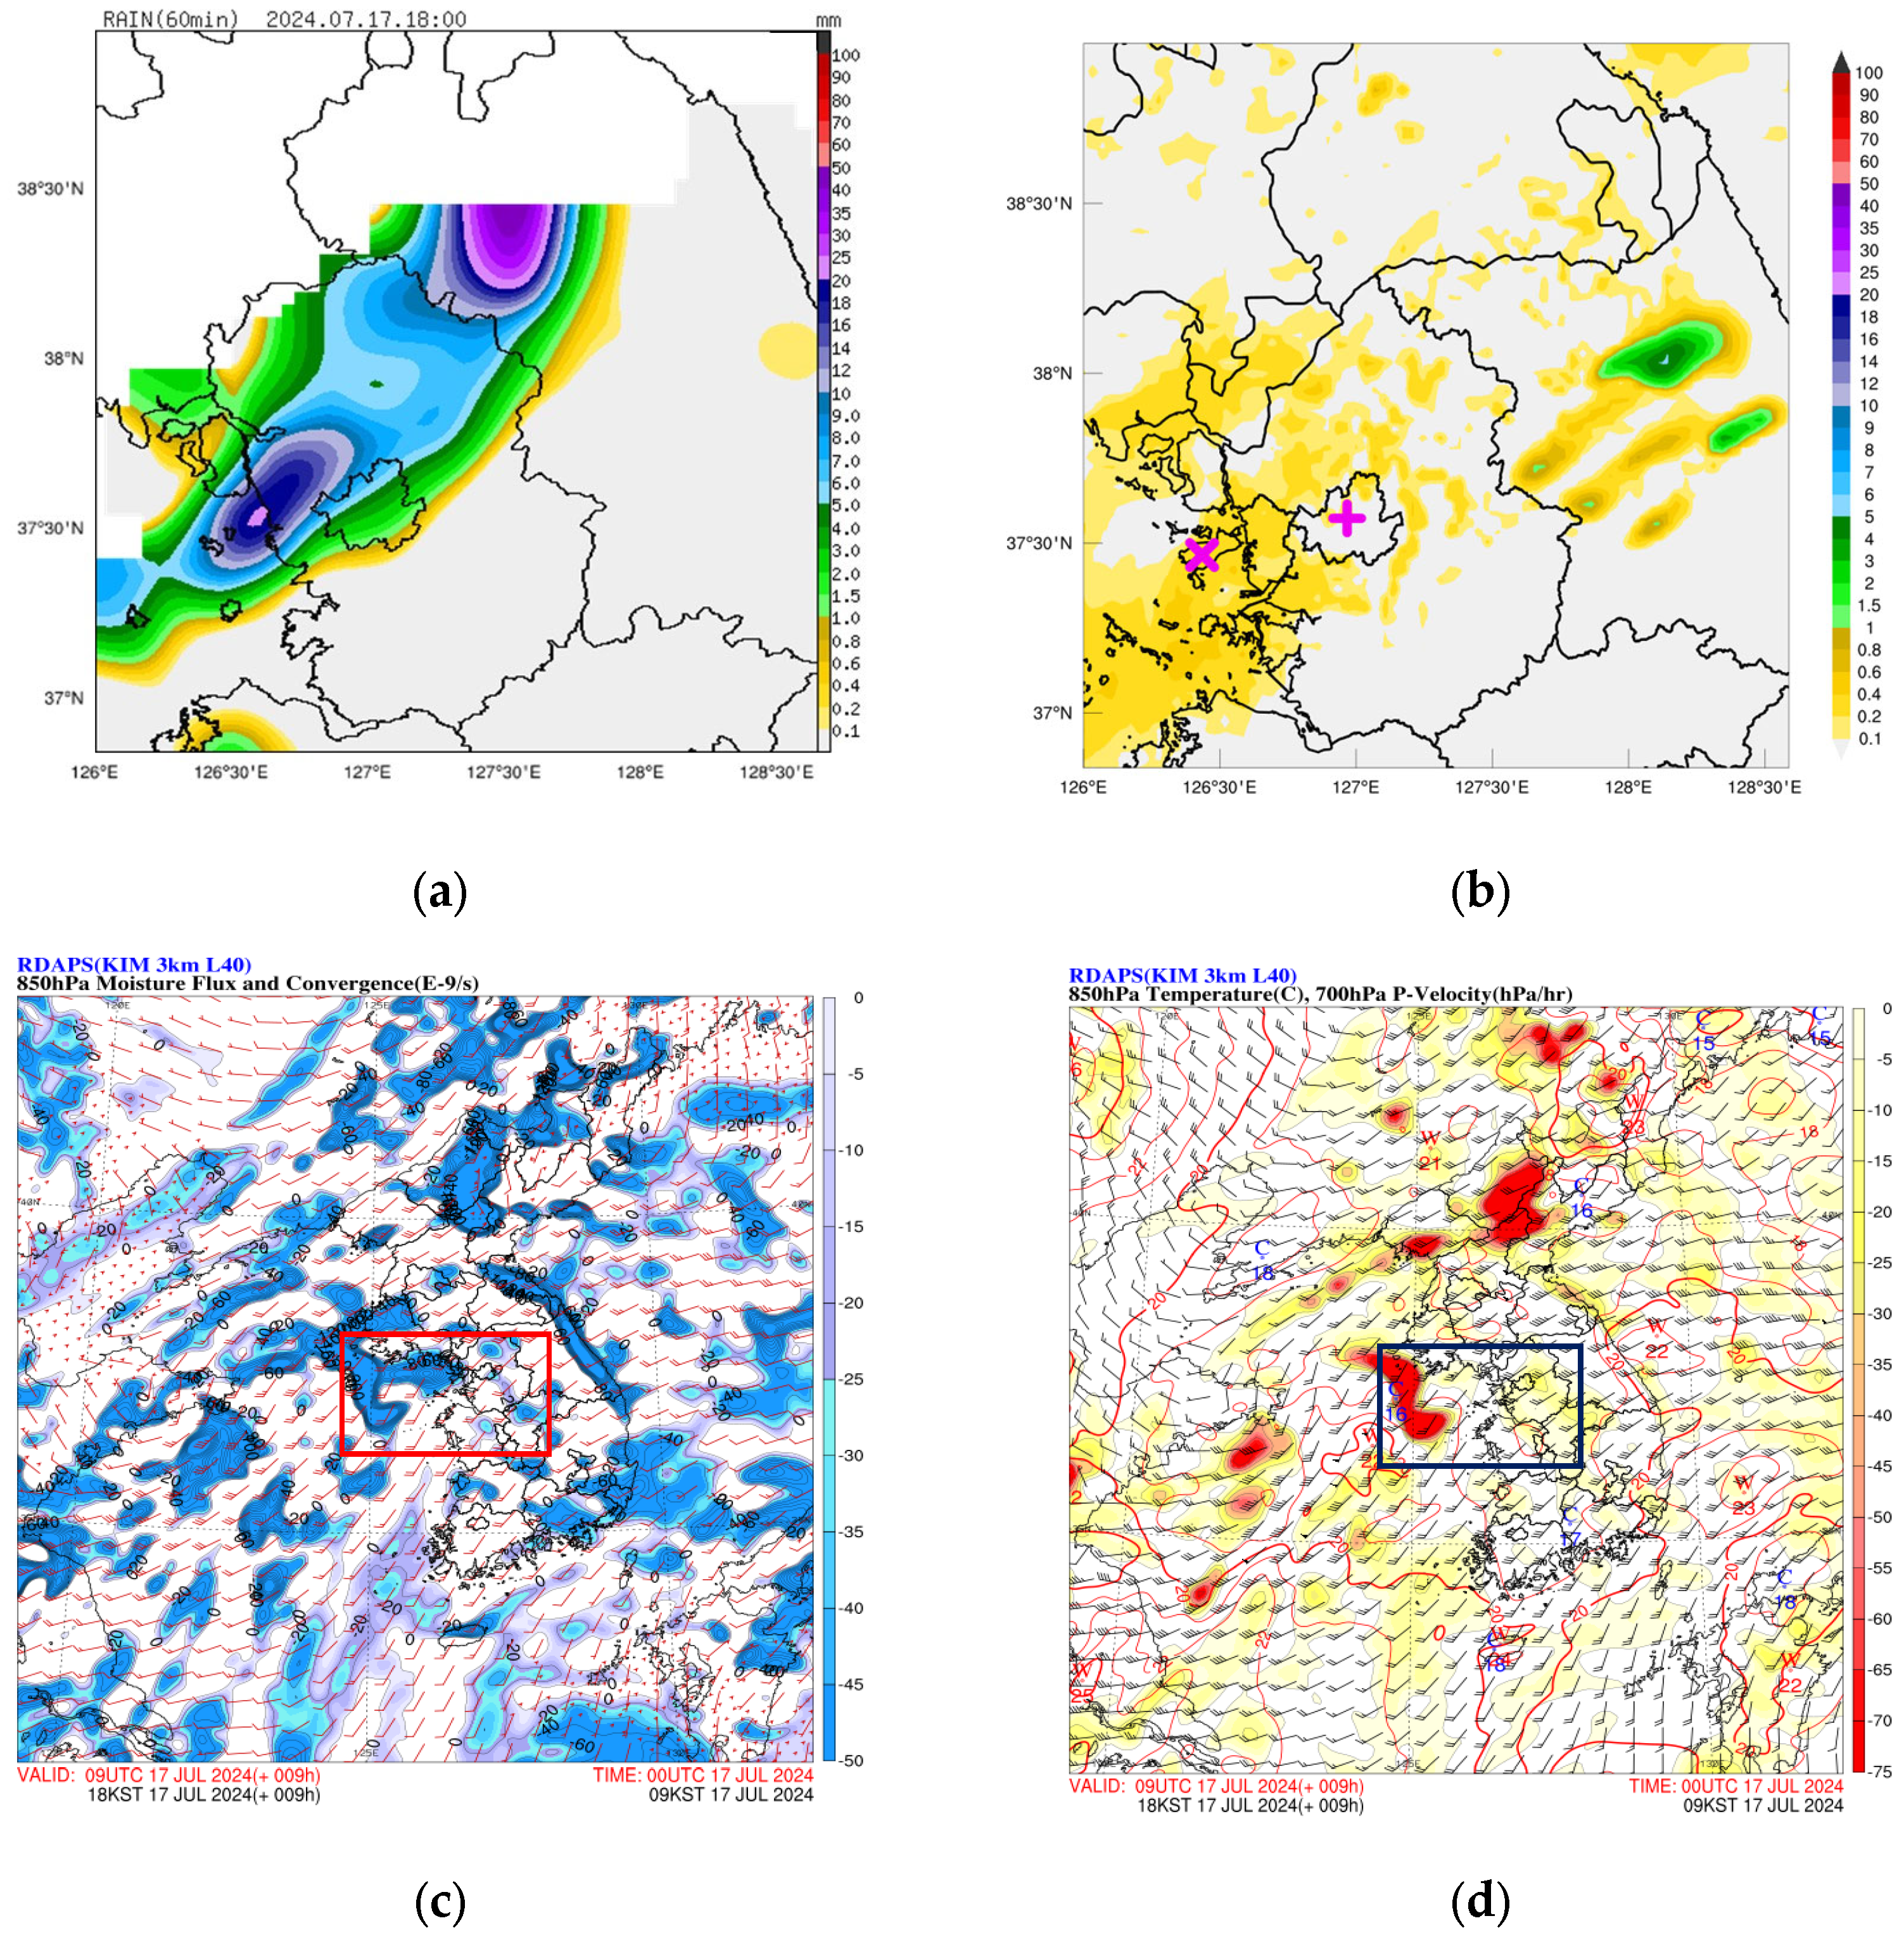
Analysis of observed rainfall distribution at the peak time (1800 LST, 17 July 2024) is presented in Figure 10a. AWS observations showed a strong band of heavy precipitation forming over the western coastal region near Incheon, extending across Seoul and into northern Gyeonggi Province, aligned along a southwest–northeast axis. In comparison, the KIM-RDAPS simulation without data assimilation (Figure 10b) underestimated the overall rainfall intensity across the metropolitan area, while some localized regions exhibited overestimation. As a result, the simulated rainband was unable to adequately reproduce the observed continuity and intensity characteristics, indicating that model errors were attributable to limitations in representing the actual initial wind and moisture fields.
As shown in Figure 10c, the moisture flux at 850 hPa was strongly transported along the western coast of the Seoul metropolitan area by a southwesterly low-level jet. The associated convergence zone extended from the Incheon–western Seoul region into northern Gyeonggi Province, which generally coincided with the location of the primary rainband observed by the AWS network. In the simulation without data assimilation, however, the convergence zone was intensified over the sea, which affected the predicted position of the rainfall core. The center of upward motion was nearly collocated with the axis of moisture convergence, playing a crucial role in the formation and intensity of the rainfall system. In the KIM-RDAPS forecast, the maximum updraft area appeared over the Yellow Sea, while only weak upward motion was simulated over the Seoul metropolitan area.
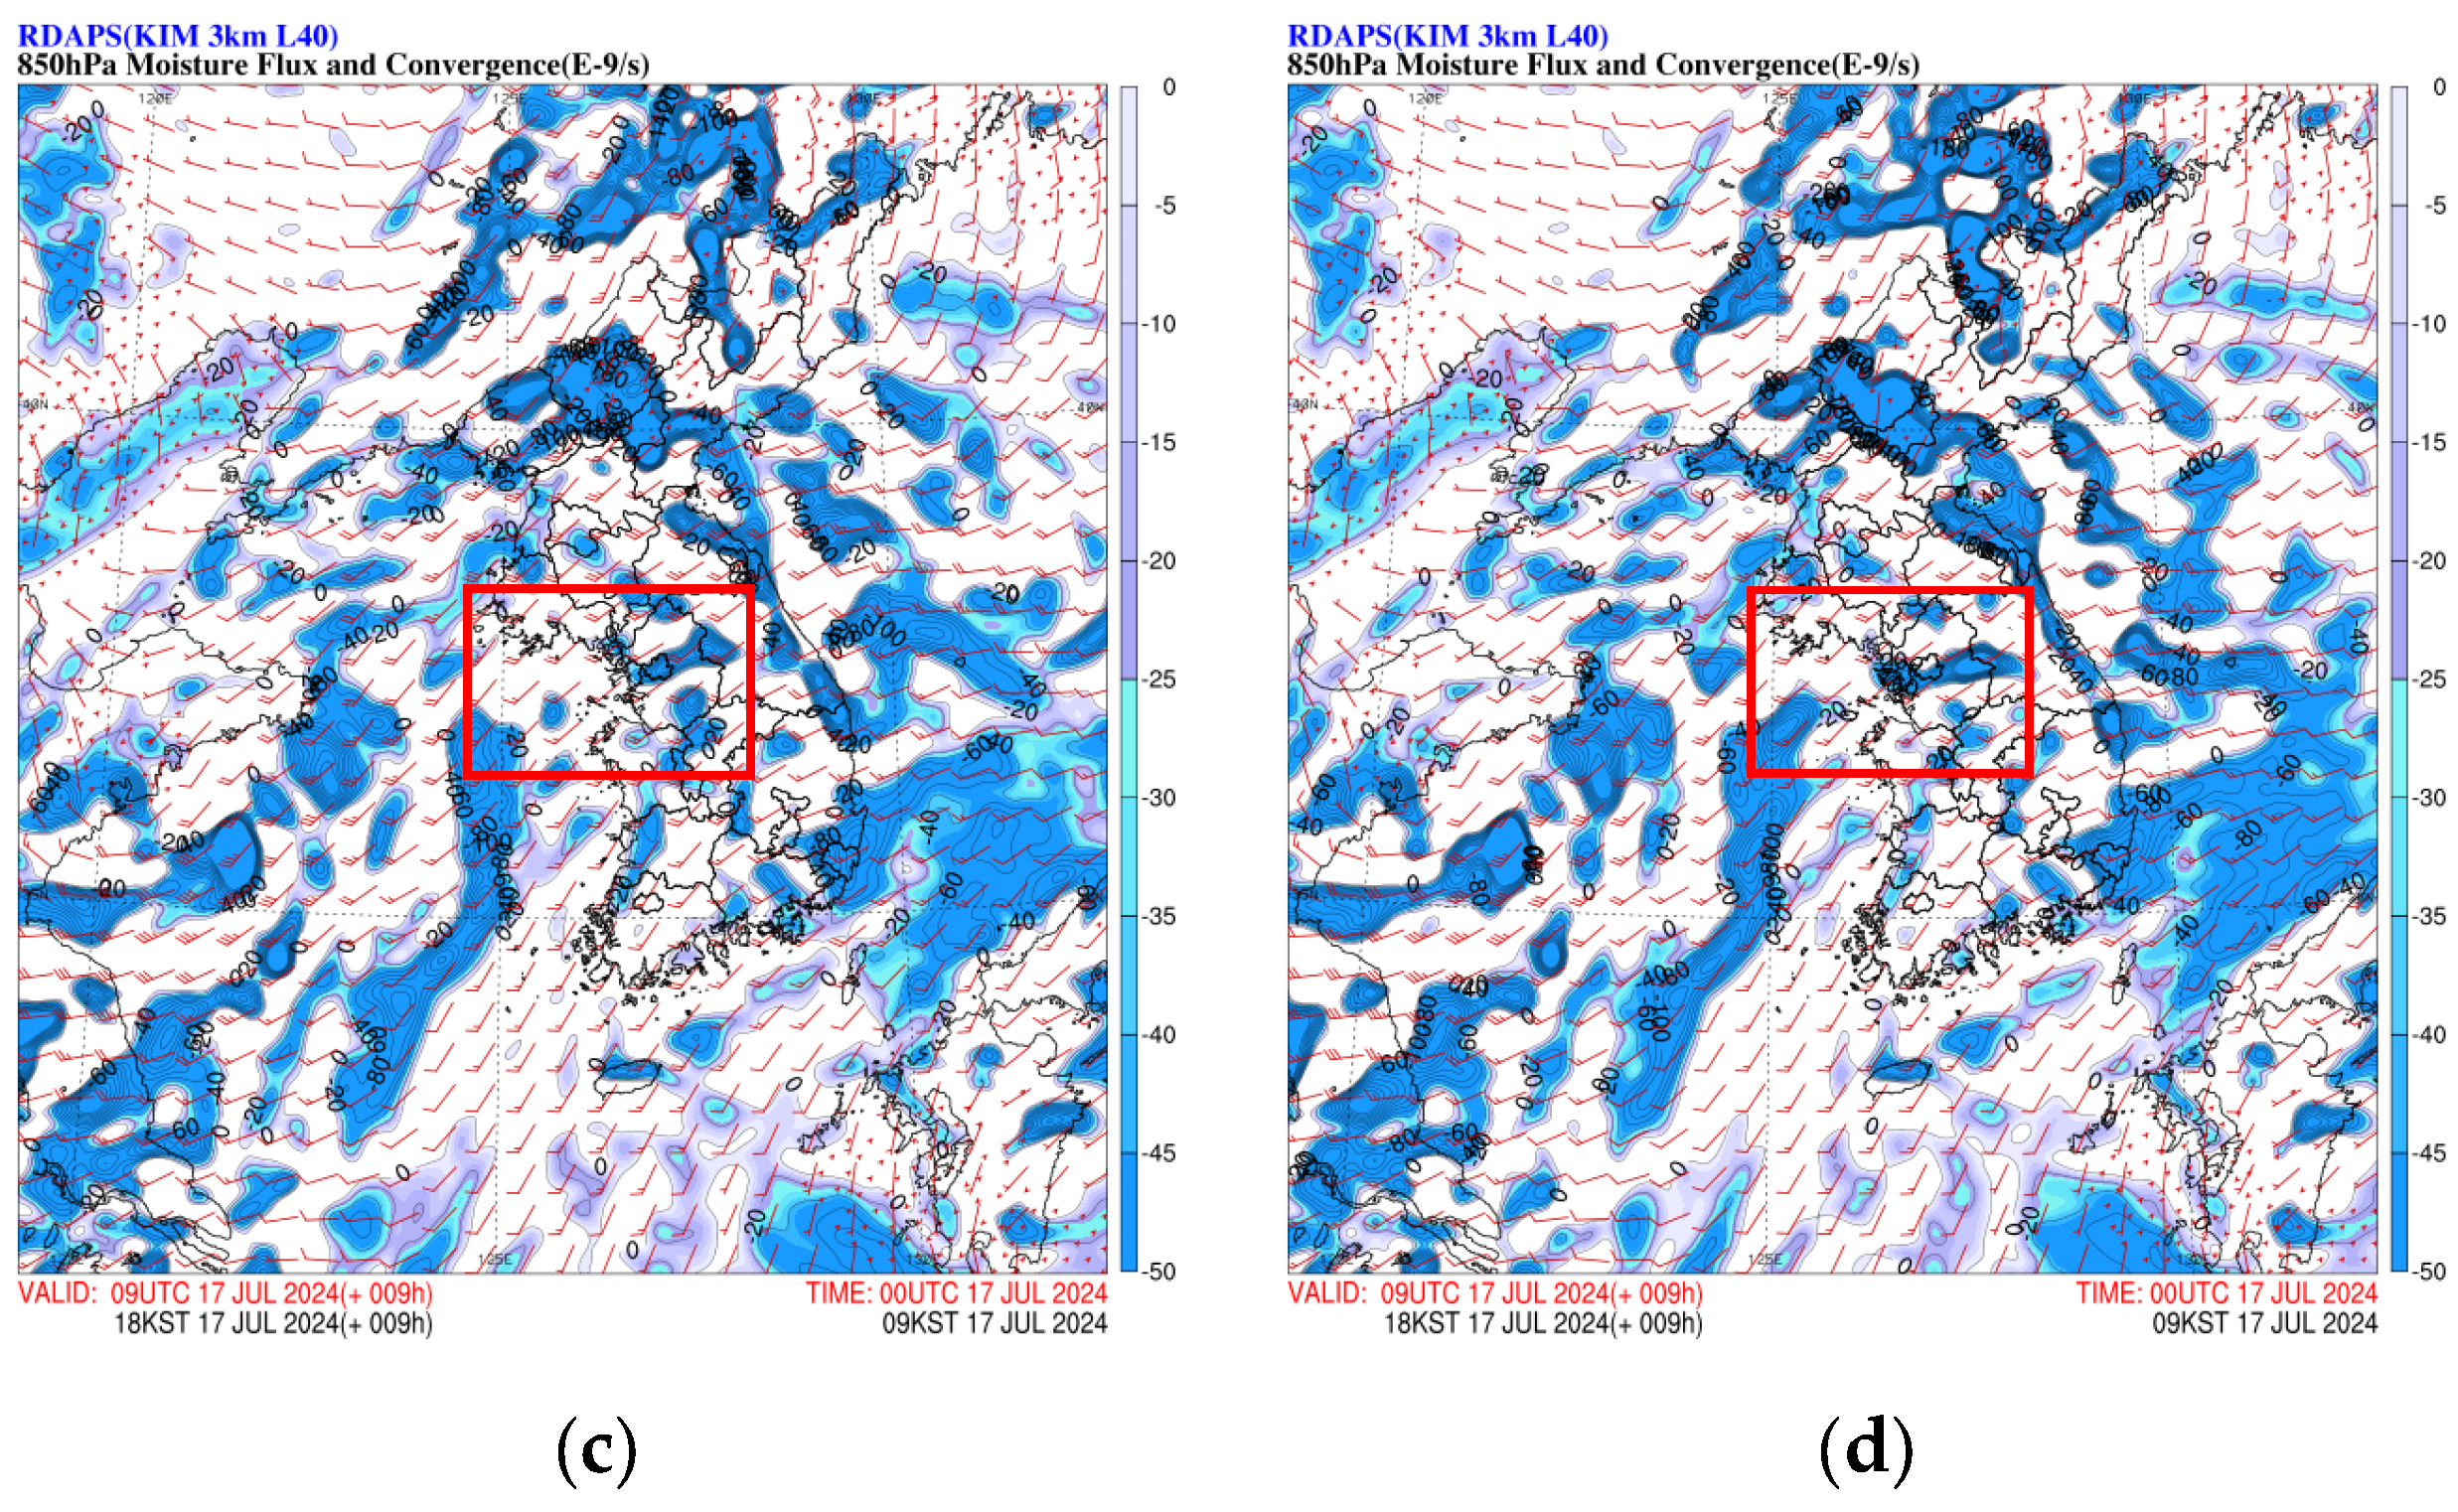
At 850 hPa, the moisture flux analysis in the sensitivity experiments clearly showed that the development of the low-level jet and the location of the convergence zone varied depending on the type of assimilated observations (Figure 11). A strong southwesterly low-level jet formed along the western coast of the Seoul metropolitan area in EXP1, but the convergence center was displaced eastward relative to the observed rainfall band, which reduced simulation accuracy. By comparison, EXP2 produced a stronger low-level jet near the west coast, with the convergence zone shifted southward and enhanced in intensity. The position and intensity of the low-level jet were also improved in EXP3, bringing the convergence zone closer to the observed rainband, although the convergence was somewhat weaker than in EXP2. Conversely, EXP4 adjusted the location of the convergence zone near the rainfall core, but the spatial consistency of the rainband was lower than in the experiments assimilating wind lidar. Among all experiments, EXP3 demonstrated the best correspondence with the observed structures of moisture flux and rainbands, confirming that assimilation of high-resolution low-level wind data plays a notable role in adjusting moisture transport pathways and convergence zones.
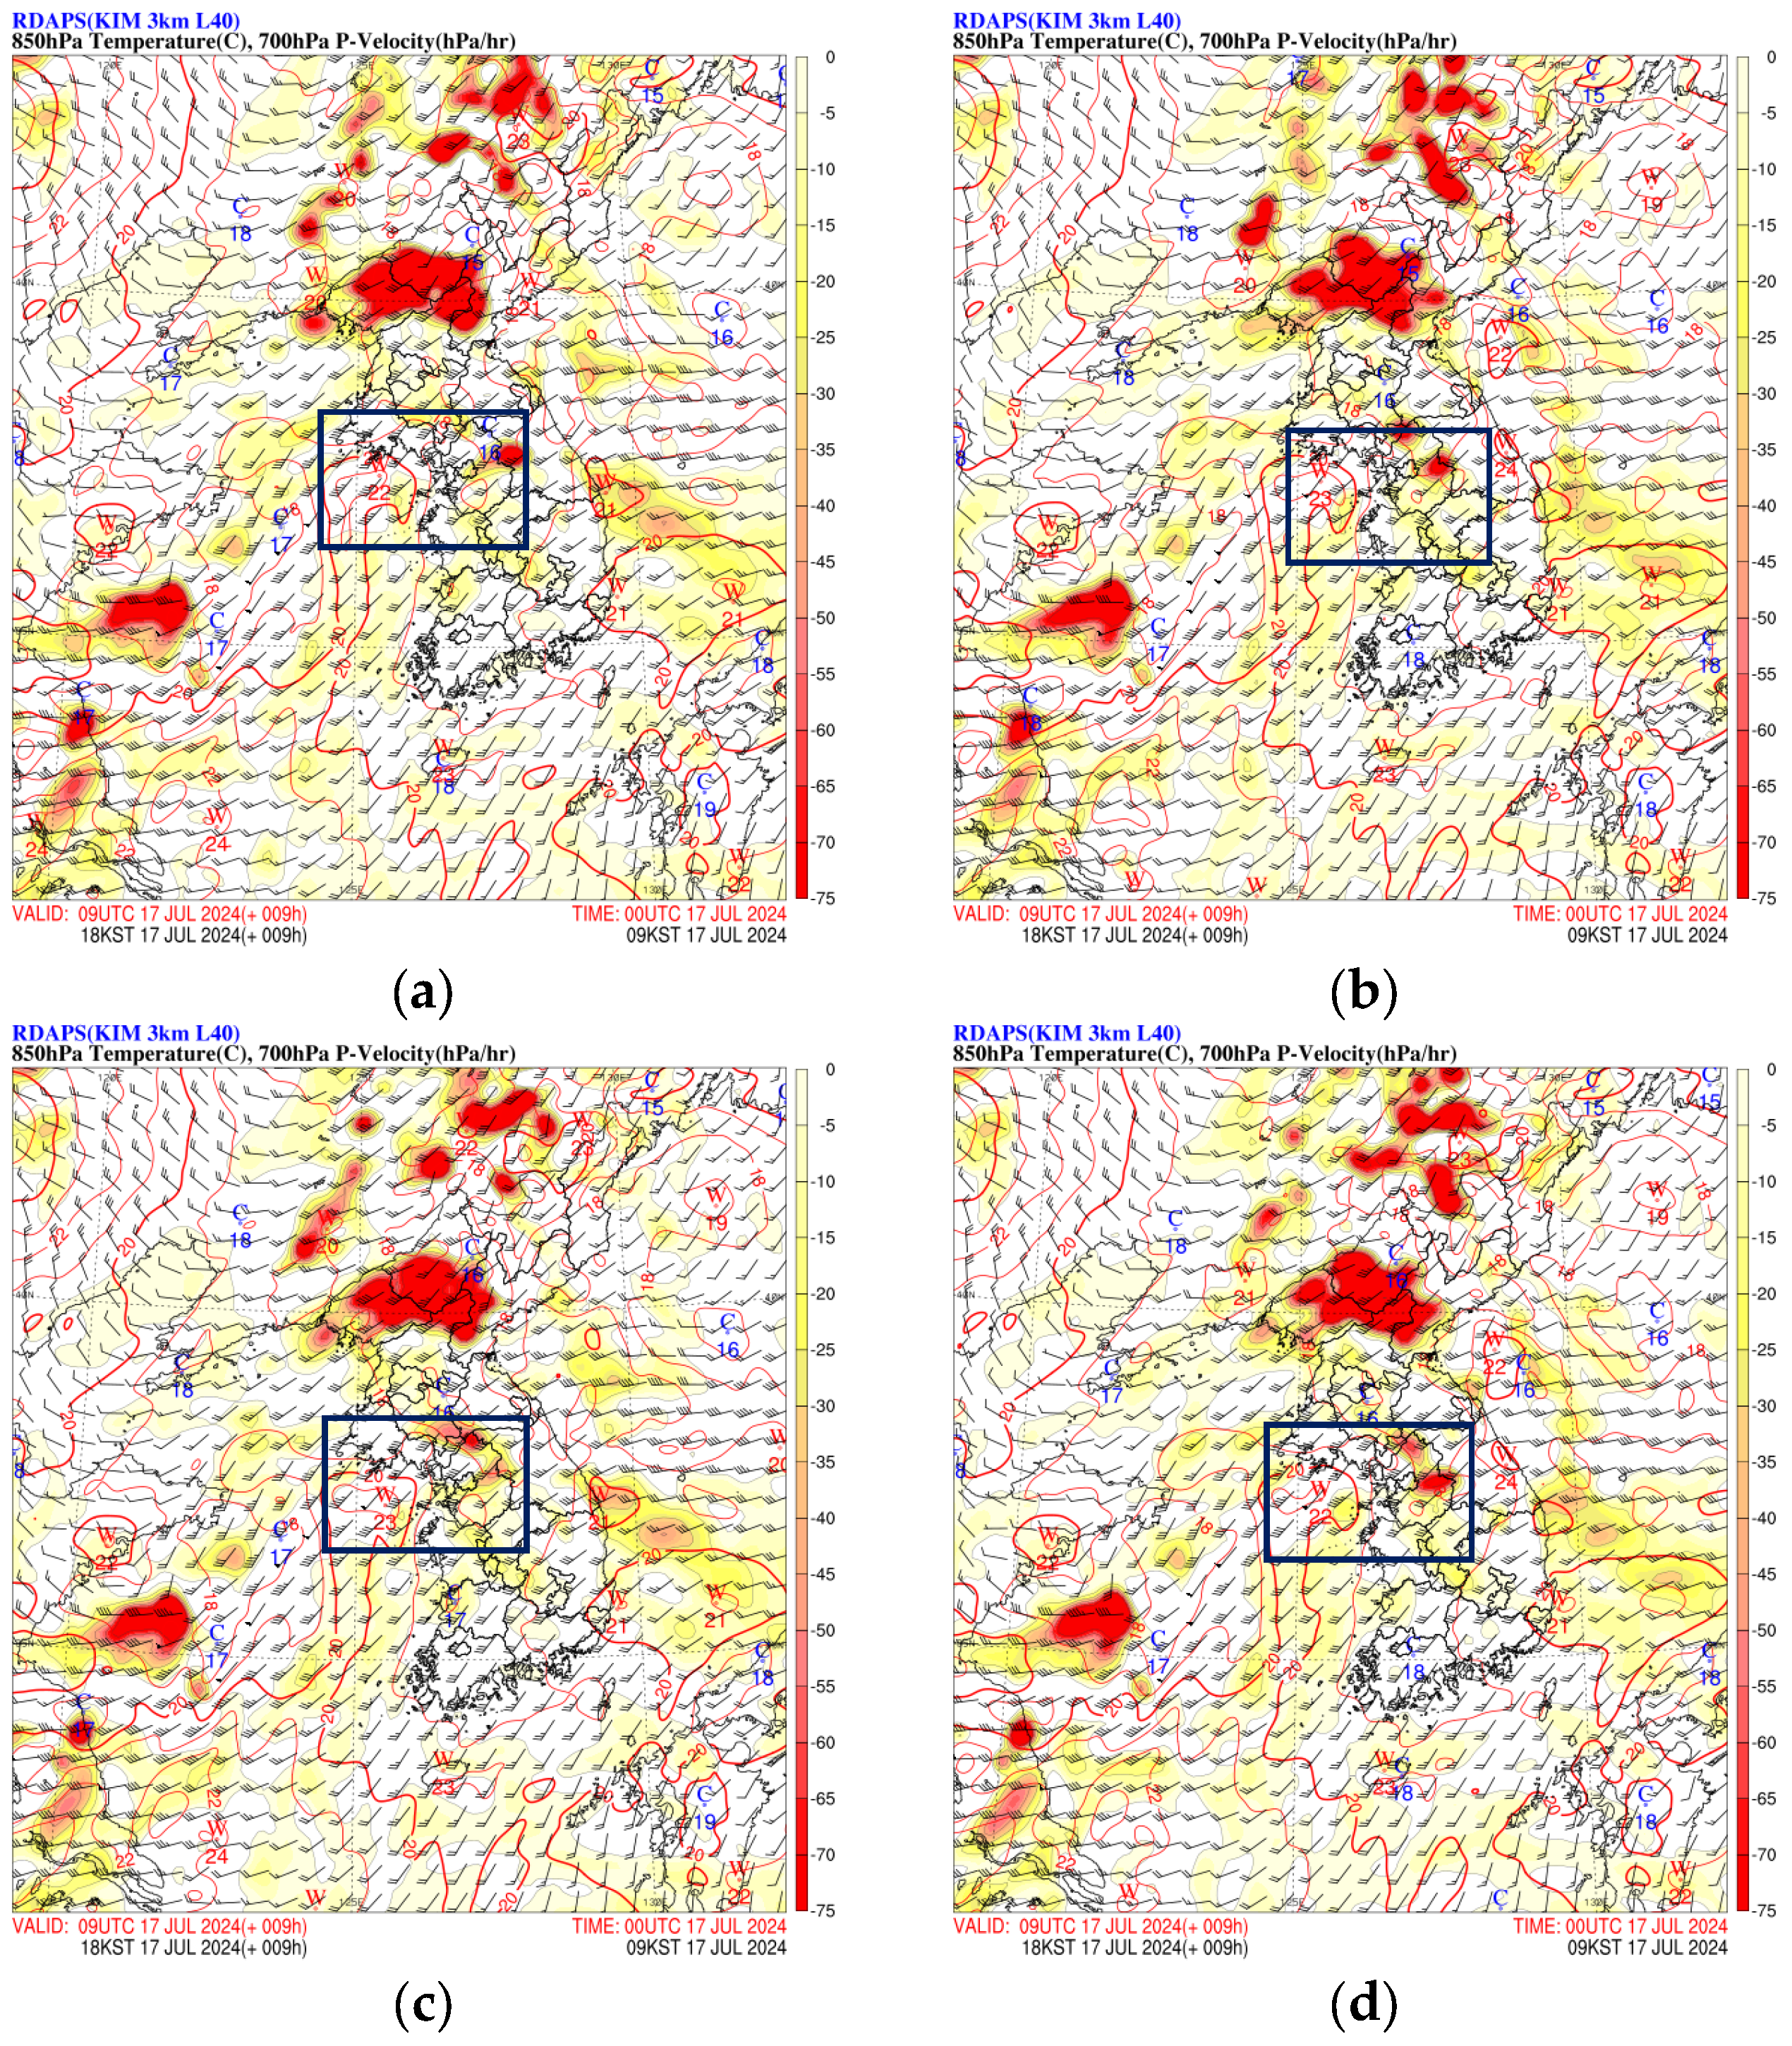
At 700 hPa, vertical velocity analysis also revealed differences in intensity and spatial accuracy depending on the type of assimilated observations. A strong updraft extending from western Seoul to the northeast was evident in EXP1, but the maximum was displaced eastward of the observed rainfall center, reducing spatial accuracy. Both the intensity and location of the updraft improved in EXP2, with maxima positioned more realistically over the eastern and northern parts of the metropolitan region. The updraft location was also reasonably well reproduced in EXP3, though the magnitude was slightly weaker than in EXP2. On the other hand, EXP4 improved the updraft near the rainfall core but shifted the maximum eastward, away from the observed peak (Figure 12).
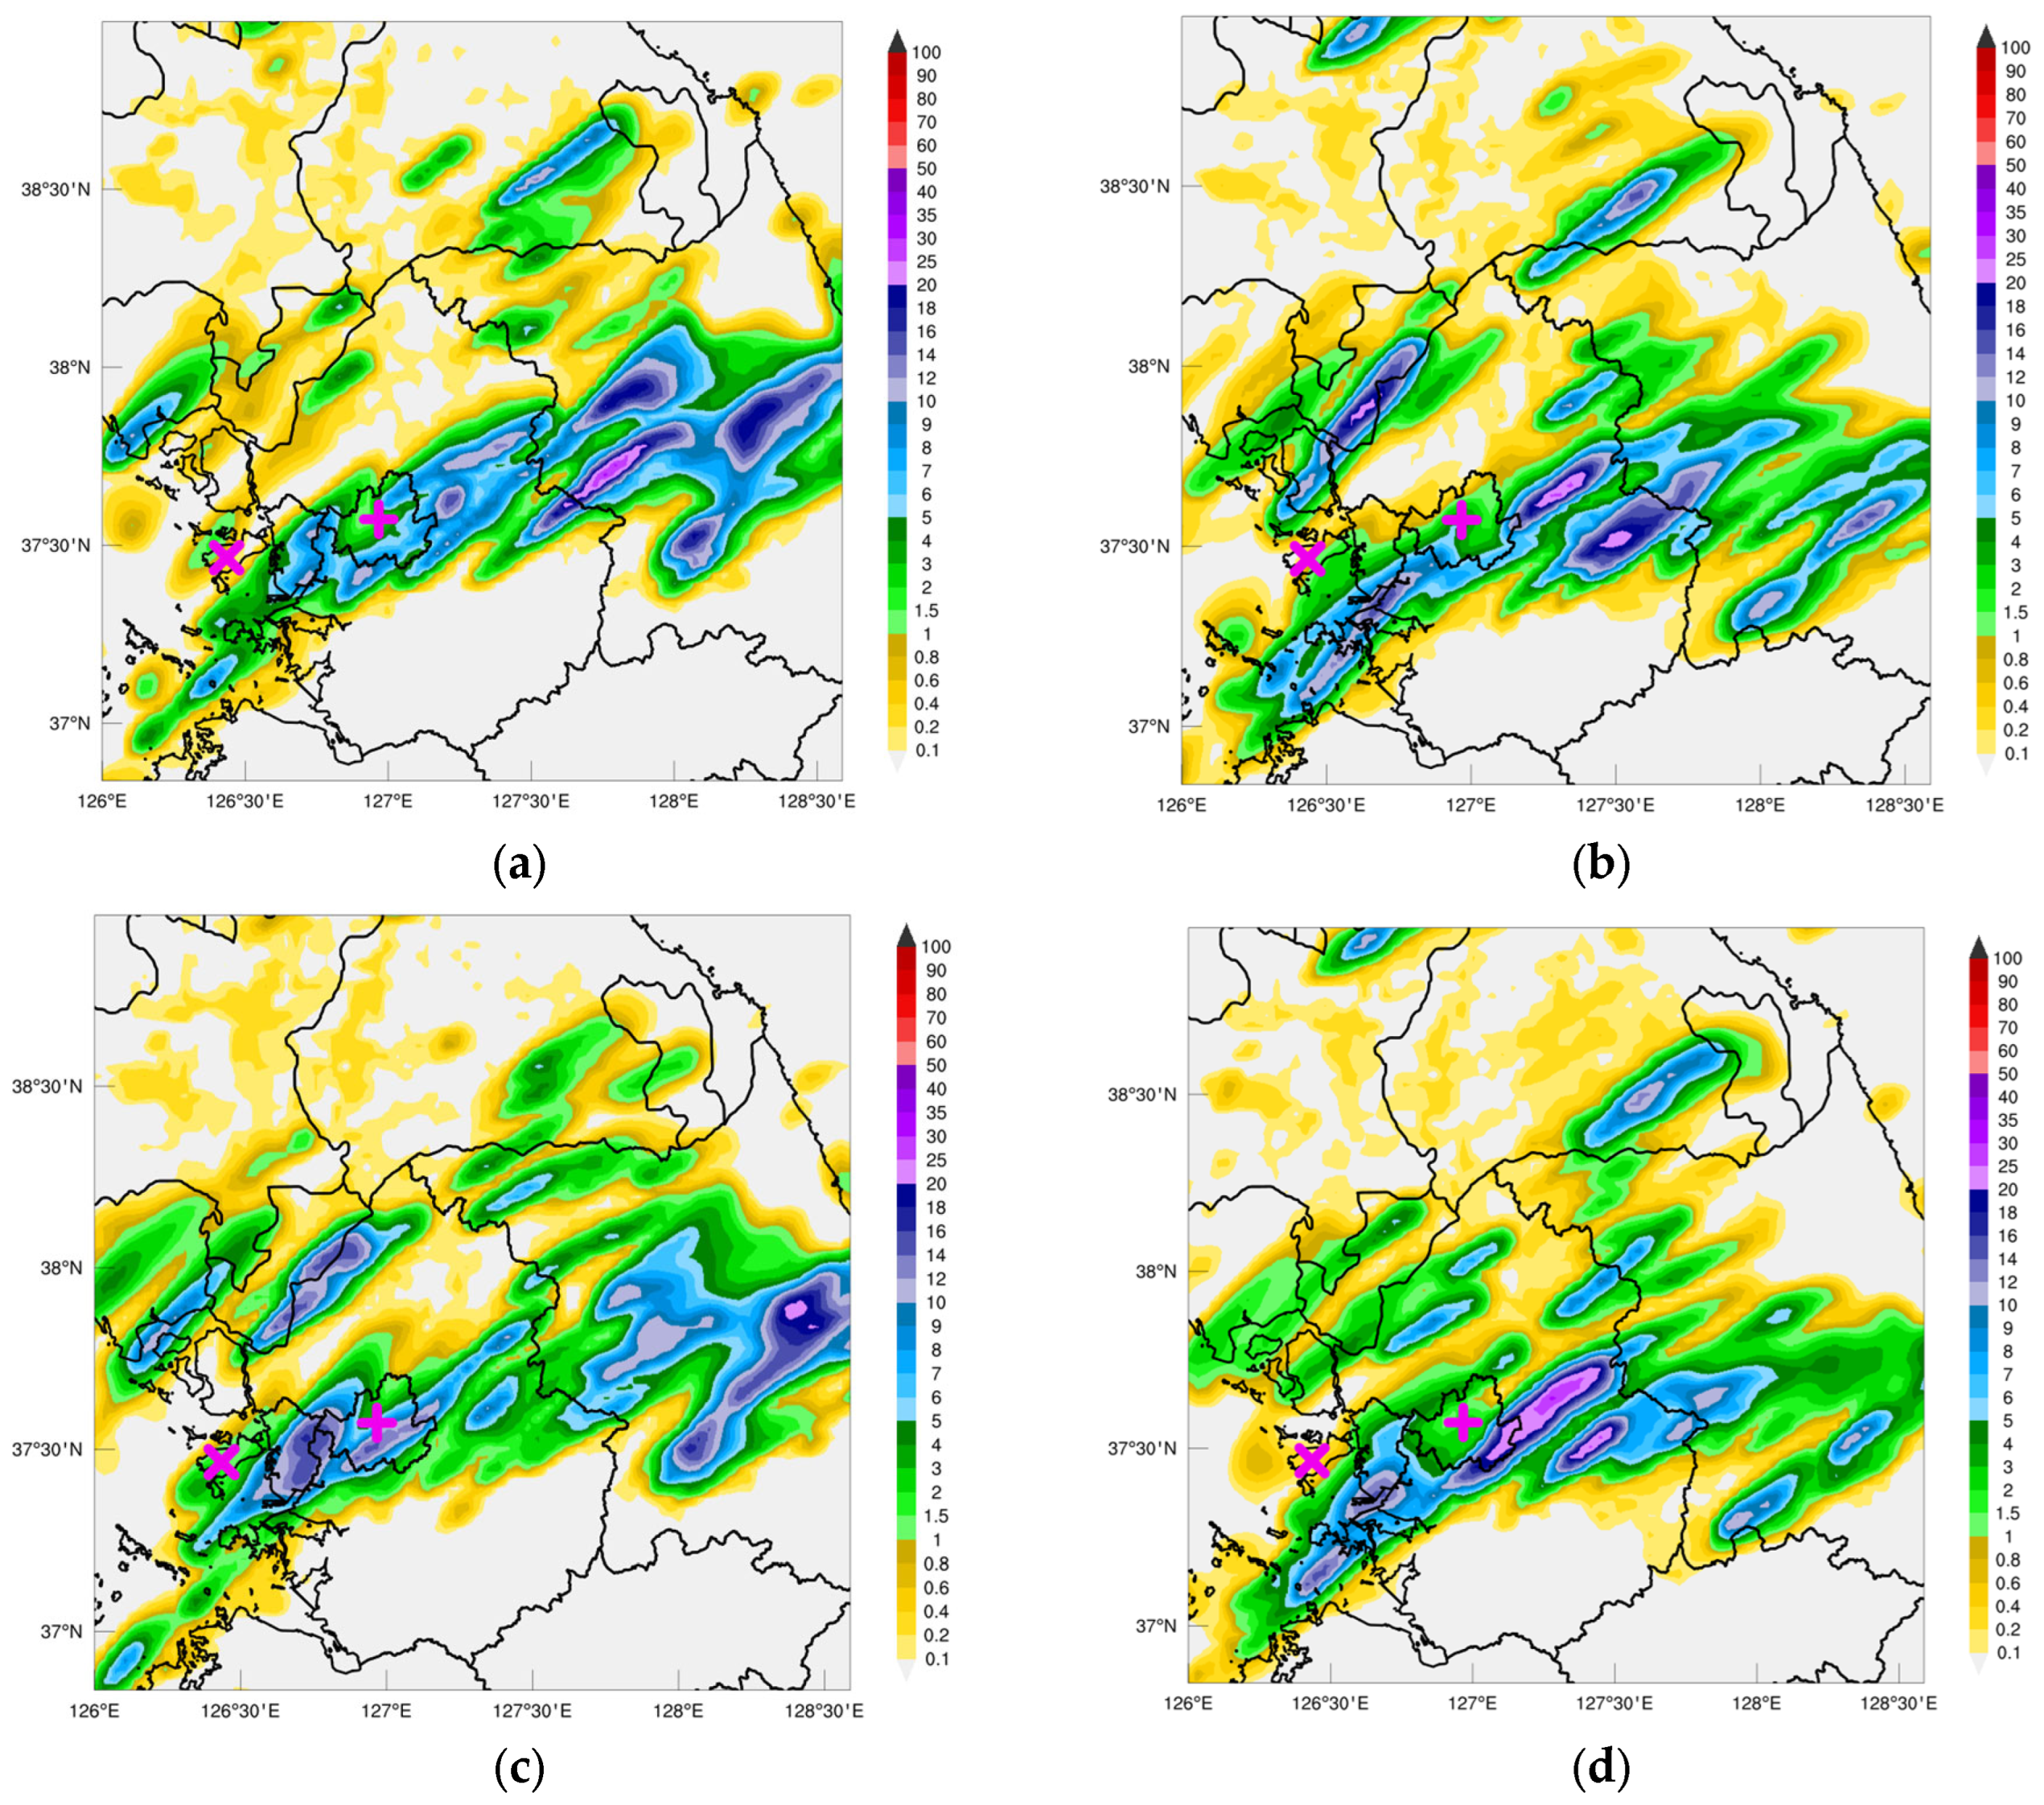
The simulated rainfall distribution showed patterns similar to those observed by the AWS network (Figure 13). According to the observed rainfall distribution in Figure 10a, AWS observations indicated a strong southwest–northeast oriented rainband extending from the Incheon coastal region through Seoul to northern Gyeonggi Province. The rainband was displaced eastward, and rainfall intensity weakened near Seoul in EXP1. Rainfall intensified farther south in EXP2, differing from observations that showed a northward enhancement. The structure and intensification of rainfall in the northwestern metropolitan region were well captured in EXP3, although intensity toward the northeast was underestimated. Relative to these experiments, EXP4 simulated stronger rainfall in the eastern metropolitan area, consistent with storm tracker observations but less representative of the overall observed distribution.
These results indicate that EXP3—i.e., the experiment assimilating wind lidar observations—provided the best performance in terms of moisture transport structure, convective development patterns, and both spatial and intensity accuracy of the rainband. These results are in agreement with a previous study [34], which demonstrated that assimilation of wind lidar data in Taiwan improved representation of typhoon-associated winds and local land–sea breeze circulations. In contrast, experiments including storm tracker data (EXP2 and EXP4) tended to overestimate rainfall in the eastern metropolitan area, likely reflecting the strong influence of localized storm tracker observations. These findings indicate that further quality control and additional sensitivity testing with an increased number of case studies are required.
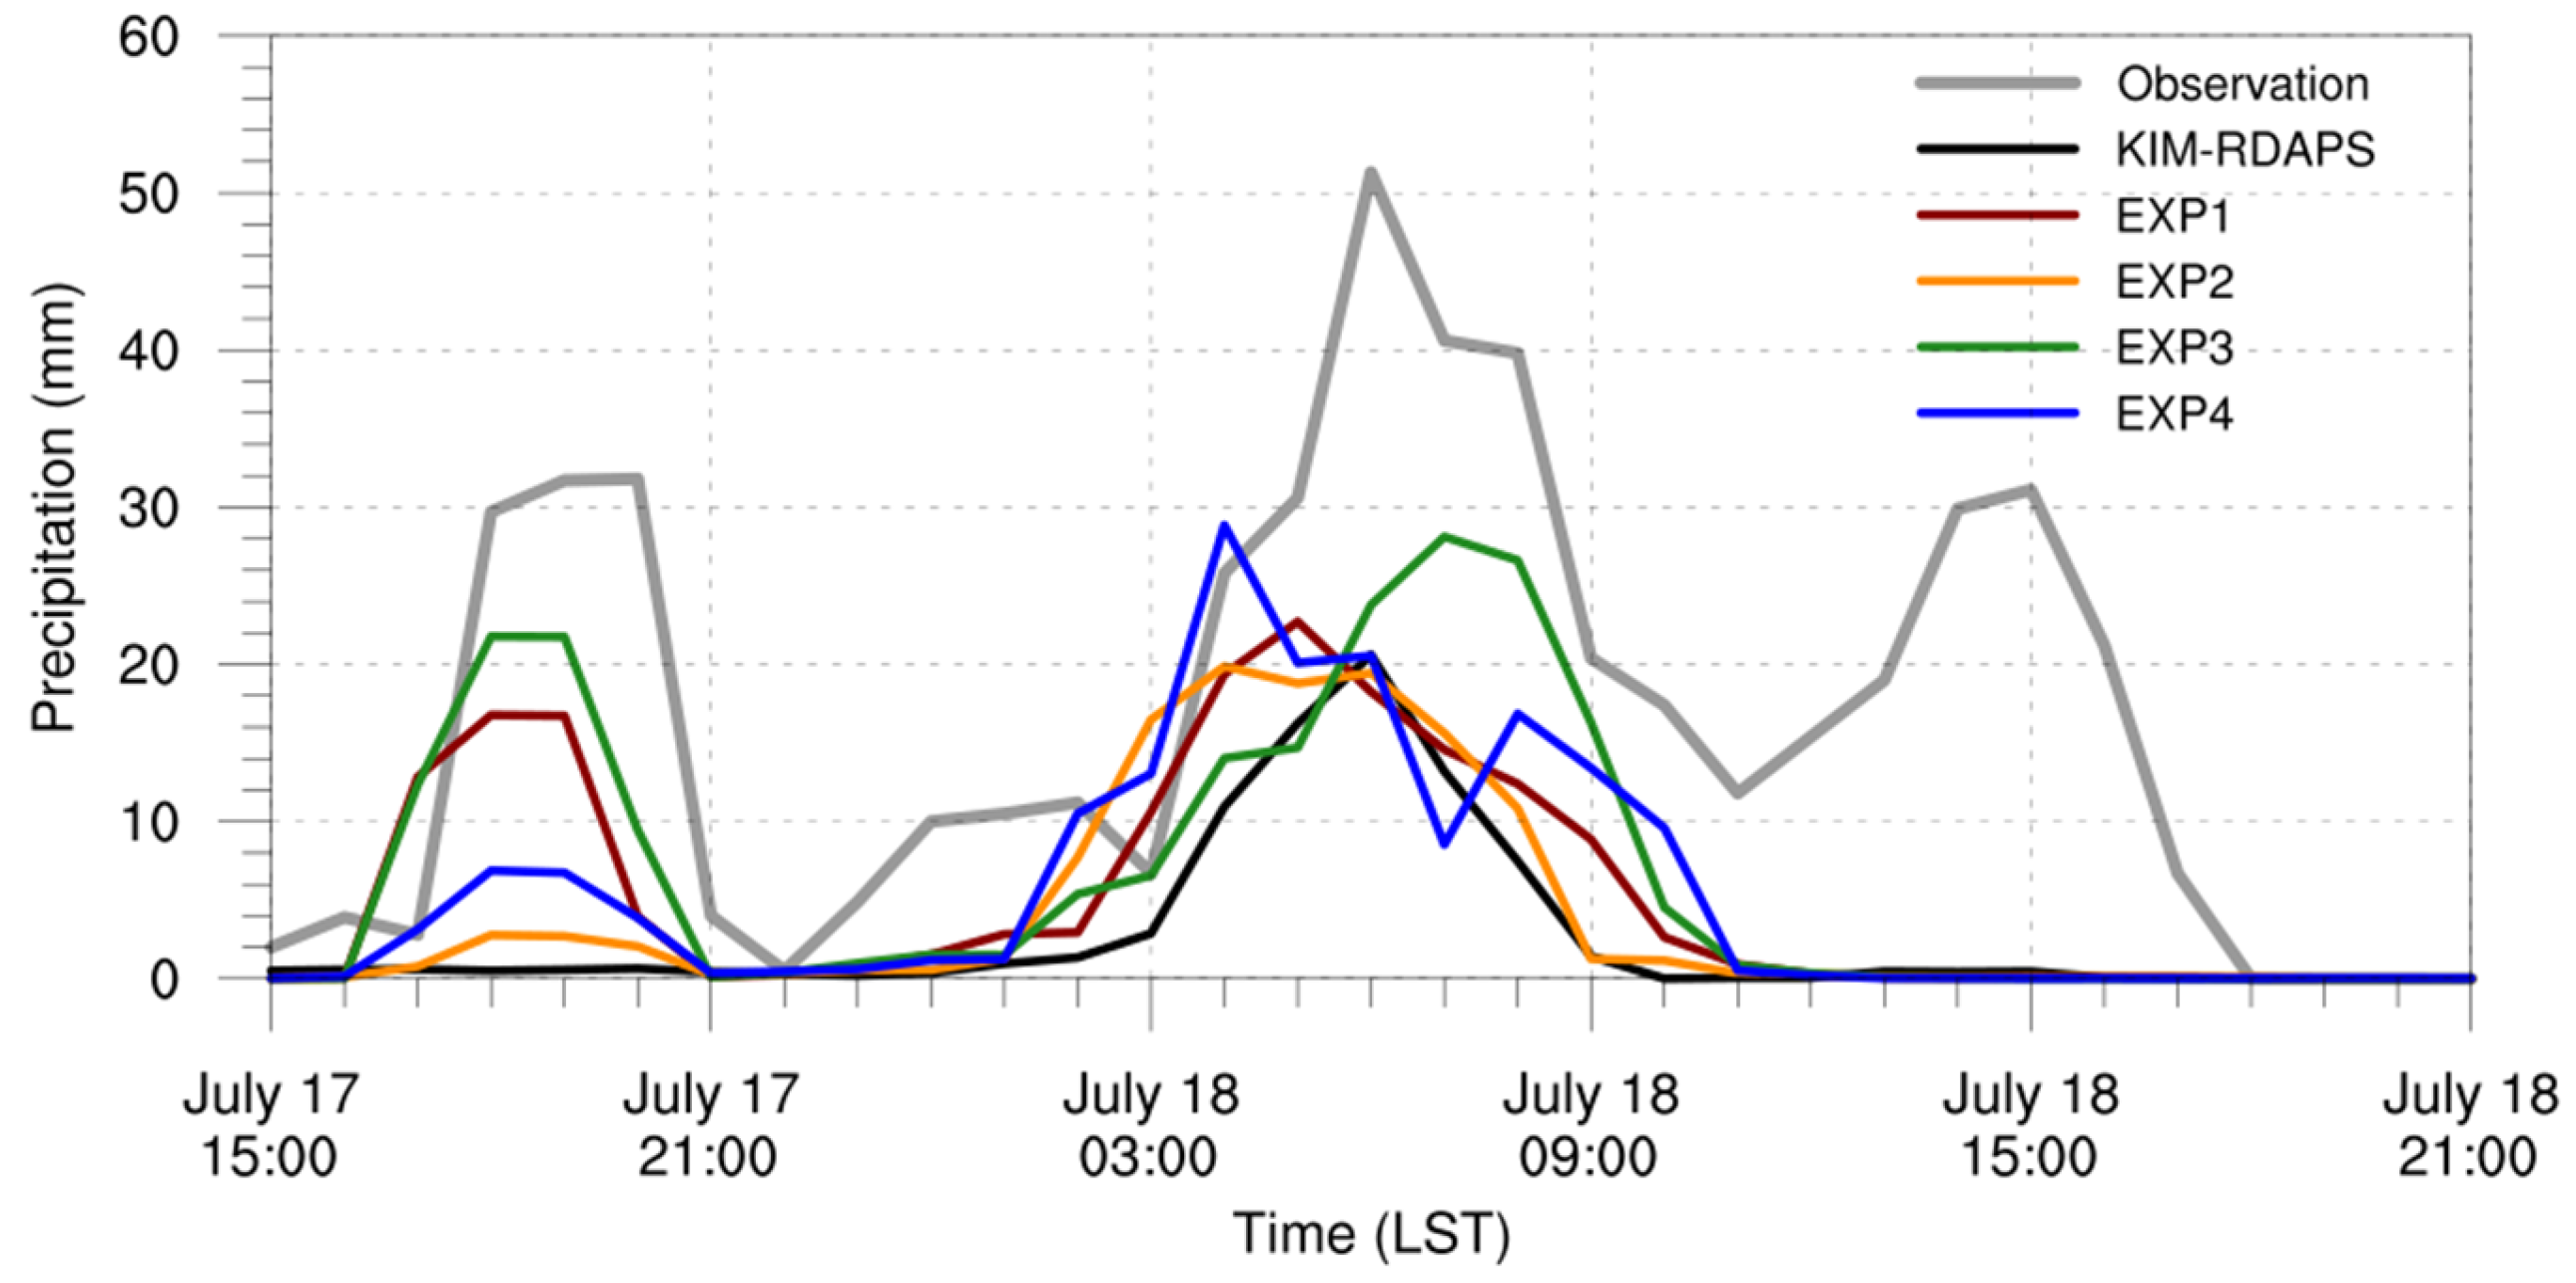
Figure 14 presents a comparison of the time series of 3-h accumulated rainfall observed at Incheon station and that simulated in the experiments. The observations showed distinct rainfall peaks in the afternoon of 17 July, and again near 0600 LST and 1500 LST on 18 July. Comparison of the forecasts from the sensitivity experiments against these observations revealed distinct differences in the timing, intensity, and accuracy of rainfall peaks. The rainfall peak occurred earlier than observed, with peak intensity considerably underestimated in EXP1, showing a strong tendency of underprediction. The first peak rainfall was the weakest in EXP2, while the second peak was comparable to other experiments but still underestimated relative to observations, and the peak occurred earlier than observed. The timing and magnitude of rainfall peaks were most consistent with observations in EXP3. Although slightly underestimated in intensity, EXP3 delayed the rainfall onset relative to the other experiments, resulting in a longer persistence of precipitation that was more consistent with the observed evolution. EXP4, in contrast, underestimated the afternoon rainfall on 17 July but reproduced the early morning rainfall on 18 July more accurately; however, it subsequently showed a rapid increase followed by an early decay, failing to capture the full development and dissipation cycle of the observed heavy rainfall event.
Through this preliminary study, it was demonstrated that assimilation of high-resolution low-level wind lidar data provides essential corrections to moisture transport and convergence structures, playing a critical role in improving forecast accuracy for heavy rainfall in the Seoul metropolitan region. Storm tracker data also contributed to the representation of localized convective development and rainfall positioning, but exhibited tendencies of overestimation in some cases, indicating the need for further quality control and validation. Future work will focus on additional case studies, statistical verification, and sensitivity experiments, with the aim of deriving an optimal data assimilation strategy for hazardous weather prediction in the metropolitan area.

4. Discussion and Conclusions

This study introduces the Korean Precipitation Observation Program (KPOP), an intensive and integrated observation network designed to improve the understanding and predictability of extreme rainfall events in the Seoul Metropolitan Area (SMA), where short-duration, high-intensity precipitation has become increasingly frequent. The SMA is particularly vulnerable to such events due to its high population density, complex land–sea configuration adjacent to the Yellow Sea, and strong urban influences on mesoscale atmospheric processes.

4.1. Discussion: Added Value of Intensive Observations in an Urban Coastal Environment

The analysis of the 17 July 2024 heavy rainfall event demonstrated that the observed extreme precipitation was closely associated with a line-shaped mesoscale convective system sustained by strong low-level southwesterly inflow from the Yellow Sea, enhanced moisture convergence, and large-scale stagnation induced by an upper-level Ω-blocking pattern. These characteristics are consistent with previous studies on summer heavy rainfall over the Korean Peninsula, which emphasized the importance of stationary fronts, low-level jets, and moisture transport in producing localized extreme precipitation.
However, the present study extends earlier findings by demonstrating the added value of high-resolution, three-dimensional intensive observations in an urban coastal setting. While previous field campaigns in Korea—such as KEOP and ProbeX-2009—provided valuable insights into monsoon-related rainfall mechanisms, their spatial focus and observational density were insufficient to fully resolve the mesoscale and boundary-layer processes governing short-lived convective systems over the SMA. In contrast, KPOP integrates wind lidar, wind profilers, storm trackers, and multi-frequency radar systems to directly capture low-level wind structures, moisture transport pathways, and convective organization at sub-hourly time scales.
The observed persistence and intensity of the low-level jet prior to and during the peak rainfall period were particularly well resolved by the wind lidar and wind profiler measurements. Similar conclusions were reported in international studies, such as the Doppler wind lidar assimilation experiments over northern Taiwan, which showed that accurate representation of boundary-layer winds substantially improves the predictability of extreme rainfall events. The present results are consistent with those studies, indicating that the representation of low-level wind and moisture convergence is a critical limiting factor in convective-scale numerical prediction.

4.2. Discussion: Impact of Intensive Observation Data on Data Assimilation

Preliminary data assimilation experiments using KIM-RDAPS with WRF-3DVAR further highlighted the importance of intensive observations. Among the tested configurations, the experiment assimilating wind lidar observations (EXP3) most effectively improved the structure of low-level moisture flux, the positioning of convergence zones, and the spatial distribution and temporal evolution of rainfall. These improvements directly translated into a more realistic simulation of the observed rainband compared to experiments relying solely on conventional operational observations.
The results suggest that wind lidar data play a more systematic role in adjusting large-scale moisture transport and convergence than storm tracker observations, which tended to exert a strong localized influence and occasionally led to rainfall overestimation. This behavior is consistent with findings from previous wind lidar assimilation studies, which showed that Doppler wind lidar primarily improves background wind and moisture fields, while localized convective observations require careful quality control and optimal weighting within data assimilation systems.
Although the present study is limited to a single case, the consistency between observational analyses and data assimilation results strongly indicates that intensive low-level wind observations are essential for improving forecasts of urban extreme rainfall. These findings provide observational evidence supporting recent modeling studies that identified boundary-layer wind errors as a major source of uncertainty in convective-scale prediction.

4.3. Conclusions and Future Perspectives

This study demonstrates that the KPOP intensive observation network provides a robust framework for monitoring and analyzing extreme rainfall events in the Seoul metropolitan area. High-resolution multi-platform observations revealed that the 17 July 2024 heavy rainfall event was driven by sustained low-level moisture transport from the Yellow Sea, strong convergence near a stationary front, and favorable large-scale circulation patterns. The integration of wind lidar and wind profiler observations was particularly effective in resolving the timing, strength, and persistence of the low-level jet responsible for maintaining the convective system.
Preliminary data assimilation experiments confirmed that incorporating intensive observation data—especially wind lidar measurements—substantially improves the representation of moisture transport, convective development, and rainfall distribution in numerical forecasts. These results underscore the importance of targeted intensive observations for enhancing the predictability of hazardous weather in densely populated urban regions.
Future work will therefore focus on expanding the analysis to additional cases of extreme rainfall observed during the KPOP intensive observation periods. By extending the current single-case study to further events, the applicability of the identified impacts of intensive observations can be statistically evaluated using quantitative forecast skill metrics such as bias, root-mean-square error, equitable threat score, and spatial precipitation statistics. In parallel, the current six-hourly data assimilation framework will be enhanced to a higher-frequency cycling system with 1 h assimilation intervals, allowing more frequent ingestion of rapidly evolving surface and upper-air observations. This higher-temporal-resolution cycling is expected to improve the representation of boundary-layer evolution, moisture transport, and convective initiation, which are critical for short-duration extreme rainfall prediction.
In addition, targeted sensitivity experiments will be conducted to further examine the assimilation of storm-tracker observations. These experiments will assess the effects of observation density, quality-control procedures, observation-error specification, and spatial influence radii in order to reduce localized over-adjustment and improve the physical consistency of convective-scale forecasts. Together with the planned expansion to radar and satellite data assimilation, these efforts are expected to establish an optimized data assimilation framework that effectively utilizes the value of the KPOP observation network and enhances the predictability of extreme rainfall events in the Seoul metropolitan area.

Author Contributions

Conceptualization, J.-Y.B., M.P., H.P. and G.L.; Visualization, M.P.; Writing—original draft preparation, J.-Y.B.; Writing—review and editing, J.-Y.B., M.P., H.P. and G.L. All authors have read and agreed to the published version of the manuscript.

Funding

This research was funded by the Korea Meteorological Administration’s Research and Development Program “Observing Severe Weather in Seoul Metropolitan Area and Developing Its Application Technology for Forecasts” under Grant (KMA2018-00125).

Institutional Review Board Statement

Not applicable.

Informed Consent Statement

Not applicable.

Data Availability Statement

Data are available from the corresponding author upon reasonable request.

Acknowledgments

The authors would like to thank the participants of the field campaign “Korea Precipitation Observation Program: international collaborative experiments for Mesoscale convective system in Seoul metropolitan area” (KPOP-MS), hosted by the Korea Meteorological Administration (KMA).

Conflicts of Interest

The authors declare no conflicts of interest.

References

  1. Kim, H.-R.; Moon, M.; Yun, J.; Ha, K.-J. Trends and Spatio-Temporal Variability of Summer Mean and Extreme Precipitation across South Korea for 1973–2022. Asia-Pac. J. Atmos. Sci. 2023, 59, 385–398. [Google Scholar] [CrossRef] [PubMed]
  2. Jin, H.-G.; Baik, J.-J. Detection of Urban Effects on Precipitation in the Seoul Metropolitan Area, South Korea. Urban Clim. 2024, 53, 101773. [Google Scholar] [CrossRef]
  3. Oh, H.; Ha, K.-J.; Jeong, J.-Y. Identifying Dynamic and Thermodynamic Contributions to the Record-Breaking 2022 Summer Extreme Rainfall Events in Korea. Asia-Pac. J. Atmos. Sci. 2024, 60, 387–399. [Google Scholar] [CrossRef]
  4. Li, J.; Gao, S.; Shen, X.; Xu, D.; Ren, F. The Characteristics of Mesoscale Convective Systems (MCSs) over East Asia in Warm Seasons. Atmos. Ocean. Sci. Lett. 2012, 5, 269–273. [Google Scholar] [CrossRef]
  5. Kim, H.H.; Park, S.K. Current Status of Intensive Observing Period and Development Direction. Atmosphere 2008, 18, 147–158. [Google Scholar]
  6. Hwang, Y.-J.; Ha, J.-C.; Kim, Y.-H.; Kim, K.-H.; Jeon, E.-H.; Chang, D.-E. Observing System Experiments Using KLAPS and 3DVAR for the Upper-Air Observations over the South and West Sea during ProbeX-2009. Atmosphere 2011, 21, 1–16. [Google Scholar]
  7. Kim, K.; Bang, W.; Chang, E.-C.; Tapiador, F.J.; Tsai, C.-L.; Jung, E.; Lee, G. Impact of Wind Pattern and Complex Topography on Snow Microphysics during ICE-POP 2018. Atmos. Chem. Phys. 2021, 21, 11955–11978. [Google Scholar] [CrossRef]
  8. Stoelinga, M.T.; Hobbs, P.V.; Mass, C.F.; Locatelli, J.D.; Colle, B.A.; Houze, R.A.; Rangno, A.L.; Bond, N.A.; Smull, B.F.; Rasmussen, R.M.; et al. Improvement of Microphysical Parameterization through Observational Verification Experiment. Bull. Am. Meteorol. Soc. 2003, 84, 1807–1826. [Google Scholar] [CrossRef]
  9. Houze, R.A.; McMurdie, L.A.; Petersen, W.A.; Schwaller, M.R.; Baccus, W.; Lundquist, J.D.; Mass, C.F.; Nijssen, B.; Rutledge, S.A.; Hudak, D.R.; et al. The Olympic Mountains Experiment (OLYMPEX). Bull. Am. Meteorol. Soc. 2017, 98, 2167–2188. [Google Scholar] [CrossRef]
  10. McMurdie, L.A.; Heymsfield, G.M.; Yorks, J.E.; Braun, S.A.; Skofronick-Jackson, G.; Rauber, R.M.; Yuter, S.; Colle, B.; McFarquhar, G.M.; Poellot, M.; et al. Chasing Snowstorms: The Investigation of Microphysics and Precipitation for Atlantic Coast-Threatening Snowstorms (IMPACTS) Campaign. Bull. Am. Meteorol. Soc. 2022, 103, E1243–E1269. [Google Scholar] [CrossRef]
  11. Yang, S.-C.; Chen, S.-H.; Liu, L.J.-Y.; Yeh, H.-L.; Chang, W.-Y.; Chung, K.-S.; Chang, P.-L.; Lee, W.-C. Investigating the Mechanisms of an Intense Coastal Rainfall Event during TAHOPE/PRECIP-IOP3 Using a Multiscale Radar Ensemble Data Assimilation System. Mon. Weather Rev. 2024, 152, 2545–2567. [Google Scholar] [CrossRef]
  12. Bell, M.M.; DeHart, J.C.; Nam, C.C.; Cha, T.Y.; Yang, M.J. Microphysics of Heavy Rainfall Observed during the Prediction of Rainfall Extremes Campaign in the Pacific (PRECIP). In Proceedings of the 40th Conference on Radar Meteorology, Minneapolis, MN, USA, 28 August–1 September 2023; American Meteorological Society: Boston, MA, USA. Available online: https://ams.confex.com/ams/40RADAR/webprogram/Paper426298.html (accessed on 9 December 2025).
  13. Nam, C.C.; Chai, D.S.; Kim, K.; Shin, S.S.H.; Lee, Y.; Park, H.; Kang, H.-S.; Lee, Y.-H.; Park, S.-H.; Lee, G. How to Maximize the Educational Benefits for Students Participating in a Meteorological Field Campaign. Bull. Am. Meteorol. Soc. 2025, accepted. [Google Scholar]
  14. Löffler-Mang, M.; Joss, J. An Optical Disdrometer for Measuring Size and Velocity of Hydrometeors. J. Atmos. Ocean. Technol. 2000, 17, 130–139. [Google Scholar] [CrossRef]
  15. Kruger, A.; Krajewski, W.F. Two-Dimensional Video Disdrometer: A Description. J. Atmos. Ocean. Technol. 2002, 19, 602–617. [Google Scholar] [CrossRef]
  16. Rasmussen, R.; Baker, B.; Kochendorfer, J.; Meyers, T.; Landolt, S.; Fischer, A.P.; Black, J.; Thériault, J.M.; Kucera, P.; Gochis, D.; et al. How Well Are We Measuring Snow? The NOAA/FAA/NCAR Winter Precipitation Test Bed. Bull. Am. Meteorol. Soc. 2012, 93, 811–829. [Google Scholar] [CrossRef]
  17. Dolan, B.; Rutledge, S.A. A Theory-Based Hydrometeor Identification Algorithm for X-Band Polarimetric Radar. J. Atmos. Ocean. Technol. 2009, 26, 2071–2088. [Google Scholar] [CrossRef]
  18. Kollias, P.; Clothiaux, E.E.; Miller, M.A.; Albrecht, B.A.; Stephens, G.L.; Ackerman, T.P. Millimeter-Wavelength Radars—New Frontier in Atmospheric Cloud and Precipitation Research. Bull. Am. Meteorol. Soc. 2007, 88, 1608–1624. [Google Scholar] [CrossRef]
  19. Peters, G.; Fischer, B.; Andersson, T. Rain Observations with a Vertically Looking Micro Rain Radar (MRR). Boreal Environ. Res. 2002, 7, 353–362. [Google Scholar]
  20. Pearson, G.; Davies, F.; Collier, C. An Analysis of the Performance of the UFAM Pulsed Doppler Lidar for Observing the Boundary Layer. J. Atmos. Ocean. Technol. 2009, 26, 240–250. [Google Scholar] [CrossRef]
  21. Spuler, S.M.; Repasky, K.S.; Morley, B.; Moen, D.; Hayman, M.; Nehrir, A.R. Field-Deployable Diode-Laser-Based Differential Absorption Lidar (DIAL) for Profiling Water Vapor. Atmos. Meas. Tech. 2015, 8, 1073–1087. [Google Scholar] [CrossRef]
  22. Weckwerth, T.M.; Weber, K.J.; Turner, D.D.; Spuler, S.M. Validation of a Water Vapor Micropulse Differential Absorption Lidar (DIAL). J. Atmos. Ocean. Technol. 2016, 33, 2353–2372. [Google Scholar] [CrossRef]
  23. Rutledge, S.A.; Chandrasekar, V.; Fuchs, B.; George, J.; Junyent, F.; Dolan, B.; Kennedy, P.C.; Drushka, K. SEA-POL Goes to Sea. Bull. Am. Meteorol. Soc. 2019, 100, 2285–2301. [Google Scholar] [CrossRef]
  24. Barker, D.M.; Huang, W.; Guo, Y.-R.; Bourgeois, A.J.; Xiao, Q.N. A Three-Dimensional Variational Data Assimilation System for MM5: Implementation and Initial Results. Mon. Weather Rev. 2004, 132, 897–914. [Google Scholar] [CrossRef]
  25. Han, J.Y.; Hong, S.Y.; Lim, K.S.S.; Han, J. Sensitivity of a Cumulus Parameterization Scheme to Precipitation Production Representation and Its Impact on a Heavy Rain Event over Korea. Mon. Weather Rev. 2016, 144, 2125–2135. [Google Scholar] [CrossRef]
  26. Jang, S.; Lim, K.S.S.; Ko, J.; Kim, K.; Lee, G.; Cho, S.J.; Ahn, K.D.; Lee, Y.H. Revision of WDM7 Microphysics Scheme and Evaluation for Precipitating Convection over the Korean Peninsula. Remote Sens. 2021, 13, 3860. [Google Scholar] [CrossRef]
  27. Han, J.-Y. Impact of Different Scale-Aware Cumulus Parameterizations on Precipitation Forecasts over Korea. Atmos. Res. 2025, 317, 107990. [Google Scholar] [CrossRef]
  28. Zheng, Y.; Alapaty, K.; Herwehe, J.A.; Del Genio, A.D.; Niyogi, D. Improving High-Resolution Weather Forecasts Using the Weather Research and Forecasting (WRF) Model with an Updated Kain–Fritsch Scheme. Mon. Weather Rev. 2016, 144, 833–860. [Google Scholar] [CrossRef]
  29. Jeworrek, J.; West, G.; Stull, R. Evaluation of Cumulus and Microphysics Parameterizations in WRF across the Convective Gray Zone. Weather Forecast. 2019, 34, 1097–1115. [Google Scholar] [CrossRef]
  30. Chen, X.; Xue, M.; Zhou, B.; Fang, J.A.; Zhang, J.; Marks, F.D. Effect of Scale-Aware Planetary Boundary Layer Schemes on Tropical Cyclone Intensification and Structural Changes in the Gray Zone: Comparison between the Shin-Hong (SH) and YSU Schemes. Mon. Weather Rev. 2021, 149, 2079–2095. [Google Scholar] [CrossRef]
  31. Jiménez, P.A.; Dudhia, J.; González-Rouco, J.F.; Navarro, J.; Montávez, J.P.; García-Bustamante, E. A Revised Scheme for the WRF Surface Layer Formulation. Mon. Weather Rev. 2012, 140, 898–918. [Google Scholar] [CrossRef]
  32. Hua, W.; Dong, X.; Liu, Q.; Zhou, L.; Chen, H.; Sun, S. High-Resolution WRF Simulation of Extreme Heat Events in Eastern China: Large Sensitivity to Land Surface Schemes. Front. Earth Sci. 2021, 9, 770826. [Google Scholar] [CrossRef]
  33. Iacono, M.J.; Delamere, J.S.; Mlawer, E.J.; Shephard, M.W.; Clough, S.A.; Collins, W.D. Radiative Forcing by Long-Lived 0Greenhouse Gases: Calculations with the AER Radiative Transfer Models. J. Geophys. Res. Atmos. 2008, 113, D13103. [Google Scholar] [CrossRef]
  34. Chen, C.-Y.; Yeh, N.-C.; Lin, C.-Y. Data Assimilation of Doppler Wind Lidar for the Extreme Rainfall Event Prediction over Northern Taiwan: A Case Study. Atmosphere 2022, 13, 987. [Google Scholar] [CrossRef]
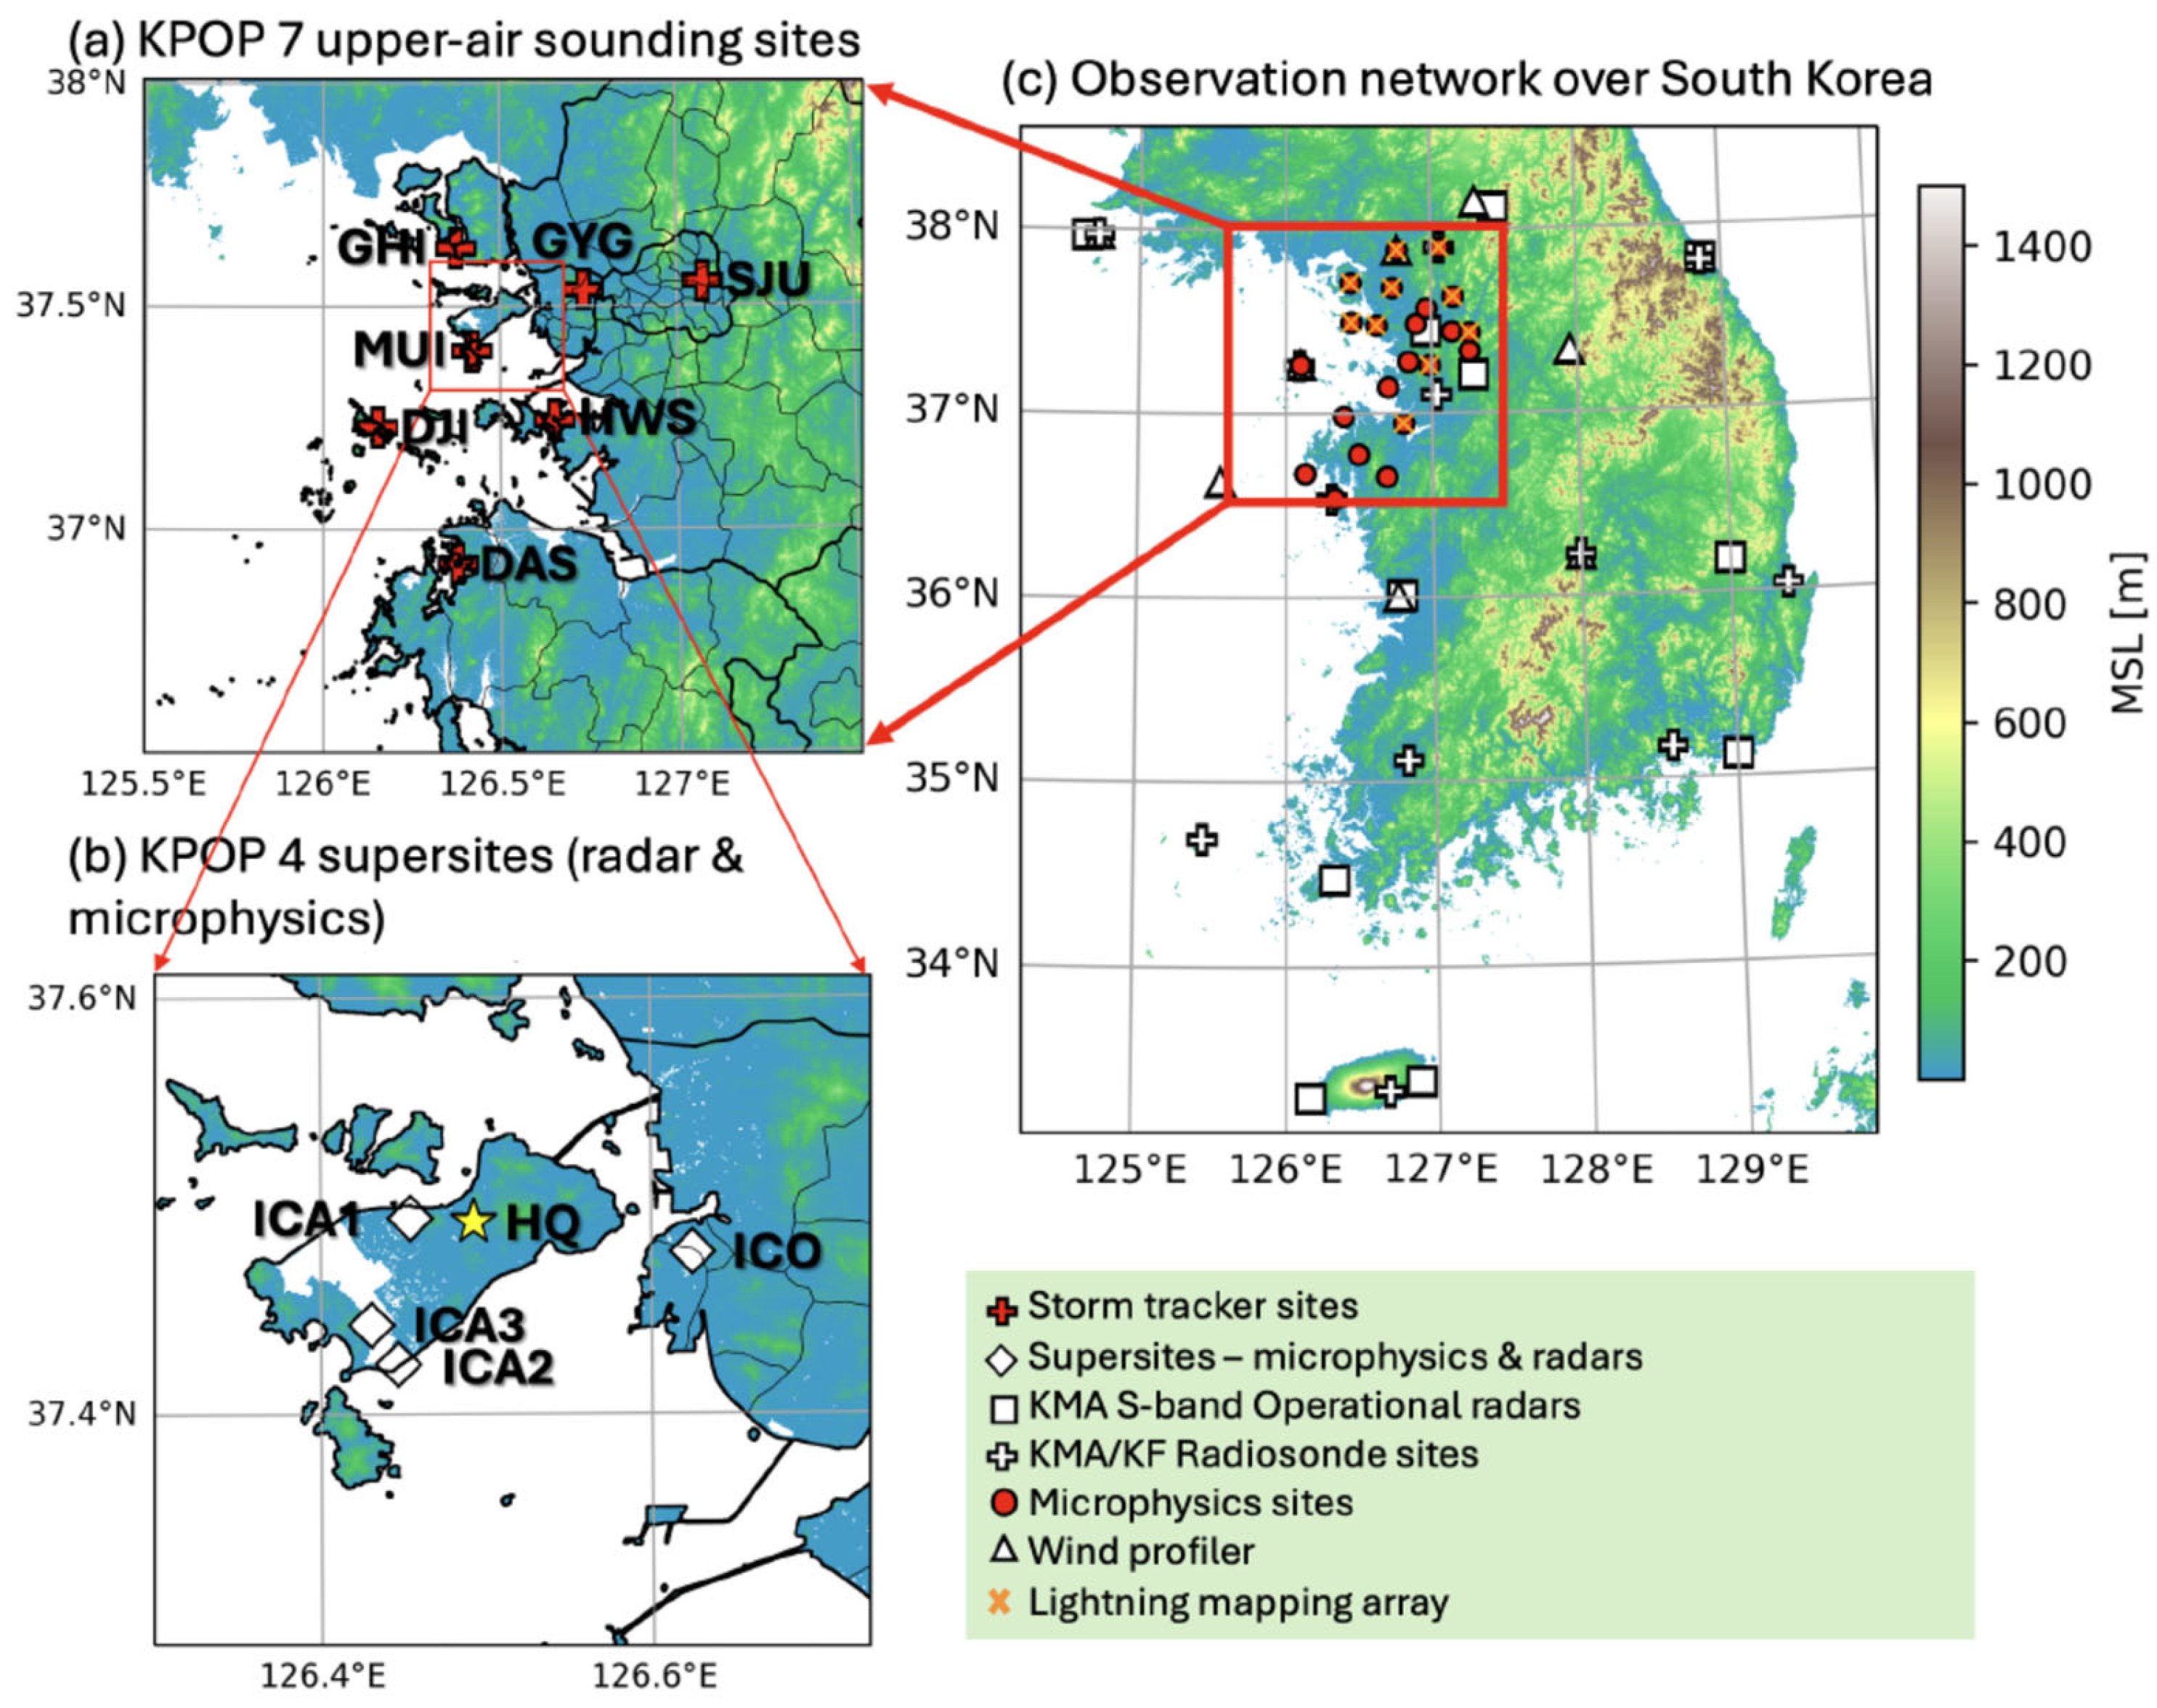
Figure 1. Map of the Yellow Sea and Seoul, showing locations of KPOP observation network (Adapted from Reference [13]). GYG in panel (a) marks the observation site near Gimpo Airport, and ICA in panel (b) indicates the KPOP observation site near Incheon International Airport. In panel (c), the red box represents both the Gyeonggi Bay and the land area of Gyeonggi Province, with Gangwon Province located to the east. The yellow star in panel (b) indicates the headquarter location for the international collaborative observation campaign conducted in 2023.
Atmosphere 17 00130 g001
Figure 2. Examples of surface observations at the KPOP supersite. (a) Photograph of the meteorological instruments at the supersite located near Incheon Airport (ICA1). Installation of (b) wind lidar, (c) PARSIVEL, and (d) 2DVD at the ICA1.
Atmosphere 17 00130 g002
Figure 3. Time series of rainfall observed by Pluvio weighing rain gauge from the supersite for the period 0900 LST 17 July–0900 LST 18 July 2024. Solid blue and dashed red line indicate hourly rainfall and accumulated rainfall amount, respectively.
Atmosphere 17 00130 g003
Figure 4. Spatial distribution of rainfall observed by the KMA radar over the KPOP observation area at (a) 1500 LST, (b) 1600 LST, (c) 1700 LST, and (d) 1800 LST. The black triangle indicates the KPOP supersite location.
Atmosphere 17 00130 g004
Figure 5. Synoptic weather chart during 1500 LST, 17 July 2024 at (a) 500 hP and (b) surface level. These charts are operational analysis products used for real-time weather forecasting within the KMA internal forecasting system.
Atmosphere 17 00130 g005
Figure 6. (a) Satellite image observed by GK2A operated by the KMA. Spatial distribution of (b) geopotential height (gpm; contours), equivalent potential temperature (K; shaded), and wind speed (m s−1), (c) moisture flux (10−9 s−1), and (d) stream line and isotach during 1500 LST, 17 July 2024 at 850 hPa. These fields are operational products utilized in real-time forecasting through the KMA internal forecasting system.
Atmosphere 17 00130 g006
Figure 7. Vertical profile of wind speed observed by wind profiler at supersite for the period 0900 LST 17 July–0900 LST 18 July 2024. The blue and purple boxes indicate the pre-rainfall period and the heavy rainfall period, respectively.
Atmosphere 17 00130 g007
Figure 8. Model domain and observation data used in the data assimilation.
Atmosphere 17 00130 g008
Figure 9. Schematic diagram of the analysis and forecasting system with KIM-RDAPS 6-h assimilation cycle.
Atmosphere 17 00130 g009
Figure 10. (a) Spatial distribution of rainfall (mm h−1) observed by AWS, (b) rainfall forecast from KIM-RDAPS, (c) moisture flux (10−9 s−1) at 850 hPa, and (d) vertical velocity (ω, hPa h−1) at 700 hPa during 1800 LST, 17 July 2024. The inner box indicates the KPOP analysis domain, including the Seoul metropolitan area. “+” and “×” symbols indicate Seoul and KPOP supersite location, respectively.
Atmosphere 17 00130 g010
Figure 11. Comparison of moisture flux (10−9 s−1) from sensitivity experiments during 1800 LST, 17 July 2024, at 850 hPa: (a) EXP1, (b) EXP2, (c) EXP3, and (d) EXP4. The inner box indicates the KPOP analysis domain, including the Seoul metropolitan area.
Atmosphere 17 00130 g011aAtmosphere 17 00130 g011b
Figure 12. Comparison of vertical velocity (ω, hPa h−1) from sensitivity experiments during 1800 LST, 17 July 2024, at 700 hPa: (a) EXP1, (b) EXP2, (c) EXP3, and (d) EXP4. The inner box indicates the KPOP analysis domain, including the Seoul metropolitan area.
Atmosphere 17 00130 g012
Figure 13. Comparison of rainfall (mm h−1) distribution from sensitivity experiment during 1800 LST, 17 July 2024: (a) EXP1, (b) EXP2, (c) EXP3, and (d) EXP4. “+” and “×” signs indicate Seoul and KPOP supersite location, respectively.
Atmosphere 17 00130 g013
Figure 14. Comparison of the time series of 3 h accumulated rainfall (mm) at Incheon station and those simulated in the sensitivity experiments.
Atmosphere 17 00130 g014
Table 1. List of major meteorological observation instruments operated at the KPOP supersite.
InstrumentObservation
Variables
SpecificationManufacturer
(Model)
PARSIVEL
(PARticle Size and VeLocity
disdrometer)
Rain rate,
Fall Velocity,
Drop Size
Spectra etc.
Laser wavelength: 650 nm
Measuring area: 54 cm2
(180 × 30 mm)
Rain Rate: 0.001–1200 mm h−1
Size range: 0.2–5 mm (fluid type), 0.2–25 mm (solid type)
Temporal resolution: 1 min
OTT HydroMet GmbH, Kempten, Germany
(OTT Parsivel2)
Pluvio
(Weighing type rain gauge)
Rain rate,
Accumulated
precipitation,
Temperature
Capacity: 1500 mm
Measurement resolution: 0.01 mm
Temporal resolution: 1 min
OTT HydroMet GmbH, Kempten, Germany
(OTT Pluvio2 L
Version 200)
2-Dimensional Video
Disdrometer
Reflectivity,
Drop size
distribution,
Shape,
Fall velocity, etc.
Measuring area: 10 × 10 cm2
Channel: 0.0–10.25 mm (41 channel)
Temporal resolution:
1 min
Spatial resolution: drop size bin width of 0.2 mm
Joanneum Research,
Graz, Austria
(VDIS)
MRR
(Micro Rain
Radar)
Rain rate,
Reflectivity,
Fall velocity,
Drop size
Distribution
Frequency: 24.1 GHz
Vertical resolution: 10–200 m
Range: 0–6 km
Temporal resolution: 10–3600 s
METEK GmbH, Elmshorn, Germany
(Micro Rain Radar MRR-2)
X-band dual polarization radarReflectivity,
Differential
reflectivity,
Radial velocity, Differential phase
Frequency: 9.41 GHz
Sampling resolution: 1.2–192 m
Antenna diameter: 1.8 m
Gain: 42 dB
Beam width: 1.4°
Simultaneous H/V polarization
Temporal resolution: 10 min
Ridgeline Instrument, Fort Collins, CO, USA
(RXM-25)
W-band cloud radarReflectivity,
Mean doppler
velocity,
Specific
differential phase,
Doppler
spectral width
Frequency: 94 GHz
Observation range:
50–12 km
Gain: 50.1 ± 0.3 dB
Beam width: 1.4°
H/V polarization
Temporal resolution: 1 min
Vertical resolution: 15–30 m
RPG Radiometer Physics GmbH, Meckenheim, Germany
(RPG-FMCW-94)
Wind ProfilerWind direction,
Wind speed,
Radial velocity
Frequency: 1.29 GHz
Beam width: 8°
Beam number: 5 beams
Maximum height: 5–10 km
Vertical resolution: 75 m (Low mode), 172.5 m (High mode)
Temporal resolution: 10 min
DEGREANE HORIZON, Cuers, France (PCL-1300)
Wind LidarWind direction,
Wind speed
Wavelength: 1550 nm
Pluse width: 0.25 μs
Detectable range: 45 m–6 km
Spatial resolution: 30 m
Temporal resolution: 0.1–10 s
LEICE, Qingdao, China
(Wind3D 6000)
Table 2. Configuration of the model in this study.
Description
Horizontal Grid Size3 km
Number of Grid1050 × 840 × 40
Cumulus ParameterizationKSAS scheme
MicrophysicsWDM7 scheme
Planetary Boundary LayerShin-Hong PBL scheme
Surface LayerRevised MM5 Monin-Obukhov formulation
Land Surface PhysicsFive-layer thermal diffusion
RadiationRRTMG K scheme
Initial and Boundary ConditionsKMA global model GDAPS
Table 3. Summary of experiment and observation data used in the data assimilation.
ExperimentData
EXP1ASOS, Radiosonde, Wind profiler observed by the KMA
EXP2EXP1 data, wind lidar and storm tracker from the KPOP program
EXP3EXP1 data, wind lidar data from the KPOP program
EXP4EXP1 data, strom tracker data from the KPOP program
Disclaimer/Publisher’s Note: The statements, opinions and data contained in all publications are solely those of the individual author(s) and contributor(s) and not of MDPI and/or the editor(s). MDPI and/or the editor(s) disclaim responsibility for any injury to people or property resulting from any ideas, methods, instructions or products referred to in the content.