Article

Analysis of Spatiotemporal Characteristics of Lightning Activity in the Beijing-Tianjin-Hebei Region Based on a Comparison of FY-4A LMI and ADTD Data

Institute of Electrical Engineering, Chinese Academy of Sciences, Beijing 100190, China
*
Authors to whom correspondence should be addressed.
Atmosphere 2026, 17(1), 96; https://doi.org/10.3390/atmos17010096
Submission received: 5 December 2025 / Revised: 6 January 2026 / Accepted: 15 January 2026 / Published: 16 January 2026
(This article belongs to the Section Atmospheric Techniques, Instruments, and Modeling)

Abstract

Accurate lightning data are critical for disaster warning and climate research. This study systematically compares the Fengyun-4A Lightning Mapping Imager (FY-4A LMI) satellite and the Advanced Time-of-arrival and Direction (ADTD) lightning location network in the Beijing-Tianjin-Hebei (BTH) region (April–August, 2020–2023) using coefficient of variation (CV) analysis, Welch’s independent samples t-test, Pearson correlation analysis, and inverse distance weighting (IDW) interpolation. Key results: (1) A significant systematic discrepancy exists between the two datasets, with an annual mean ratio of 0.0636 (t = −5.1758, p < 0.01); FY-4A LMI shows higher observational stability (CV = 5.46%), while ADTD excels in capturing intense lightning events (CV = 28.01%). (2) Both datasets exhibit a consistent unimodal monthly pattern peaking in July (moderately strong positive correlation, r = 0.7354, p < 0.01) but differ distinctly in diurnal distribution. (3) High-density lightning areas of both datasets concentrate south of the Yanshan Mountains and east of the Taihang Mountains, shaped by topography and water vapor transport. This study reveals the three-factor (climatic background, topographic forcing, technical characteristics) coupled regulatory mechanism of data discrepancies and highlights the complementarity of the two datasets, providing a solid scientific basis for satellite-ground data fusion and regional lightning disaster defense.

1. Introduction

As a crucial indicator of severe convective weather, the accurate capture of the spatiotemporal distribution characteristics of lightning holds significant scientific significance and practical value for severe weather warning, power security protection, and research on climate system evolution [1,2,3,4]. With the continuous advancement of observation technologies, lightning monitoring has formed a three-dimensional observation pattern integrating space-based satellite remote sensing and ground-based positioning networks. Among them, the Lightning Mapping Imager (LMI) aboard the Fengyun-4A (FY-4A) and the Advanced Time-of-arrival and Direction (ADTD) lightning location network, as two core monitoring methods, play irreplaceable roles in the refined observation of lightning activity by virtue of their unique technical characteristics [5,6,7].
As a core payload of China’s new-generation geostationary meteorological satellites, FY-4A LMI enables round-the-clock continuous monitoring of total lightning activity over China and its surrounding regions, providing a novel space-based observational perspective for lightning disaster monitoring and relevant scientific research [8]. Compared with traditional ground-based detection methods (e.g., the ADTD system), LMI boasts distinct advantages including seamless full-region coverage, high observational stability, and freedom from geographical constraints, yet it also has inherent technical attributes: the spatial resolution at the subsatellite point is approximately 7.8 km, and its detection principle is based on optical sensing mechanisms [9,10,11]. These fundamental differences in technical characteristics make it an essential prerequisite for the scientific application of LMI data in meteorological operations and research to systematically evaluate and validate LMI’s detection performance, and to conduct in-depth analysis of its consistency and complementarity with ground-based observational data.
In recent years, scholars at home and abroad have conducted extensive comparative studies on the data quality and detection capability of FY-4A LMI. A large body of research results indicates that the spatial distribution pattern of lightning activity detected by LMI exhibits good qualitative consistency with various benchmark datasets, including the Lightning Imaging Sensor (LIS) aboard the International Space Station (ISS-LIS) [8,10,12,13], the World Wide Lightning Location Network (WWLLN) [8,14,15], and China’s ground-based lightning location networks (e.g., ADTD, Beijing Broadband Lightning Network (BLNET)) [5,10,14,16,17,18,19,20], which confirms the reliability of LMI in capturing the spatial distribution characteristics of regional lightning activity.
However, in terms of quantitative detection capability, FY-4A LMI still exhibits distinct characteristics: first, the number of detected lightning events is significantly lower than that of ISS-LIS, reflecting the impact of resolution differences among different sensors [12]; second, there is a notable diurnal variation in detection efficiency, with daytime efficiency generally lower than nighttime efficiency [13,17,19]; third, compared with ground-based positioning networks, the number of lightning flashes detected by FY-4A LMI is typically an order of magnitude lower [5,17], and its detection capability is easily modulated by cloud characteristics, tending to capture lightning activity in regions with shallower clouds and weaker optical occlusion [5]. At the level of joint analysis of satellite-ground data, existing studies have further revealed the complex correlations between the two types of data: although LMI and ground-based datasets such as ADTD show consistency in the main peak period of diurnal variation and the overall temporal evolution trend of lightning activity, significant differences may still exist in aspects such as the amplitude of seasonal variation, the distribution of diurnal-nocturnal ratios, and the specific locations of spatial high-density areas [18]. These findings fully highlight that satellite and ground-based lightning data are not simply substitutive but highly complementary; the integrated application of the two datasets can more comprehensively capture the characteristics of lightning activity during severe convective weather processes, providing richer decision-making information for the monitoring and early warning of disastrous weather [10,14].
Overall, existing studies have achieved fruitful results in multiple regions of China (e.g., Jiangsu [17], Southwest China [19]). However, systematic comparative research on FY-4A LMI and ADTD ground-based lightning data for the Beijing-Tianjin-Hebei (BTH) region, an important area with dense population, advanced economy, and frequent severe convective weather, remains insufficient. To address this research gap in the BTH region, this study aims to conduct a multi-dimensional and systematic comparative analysis of the spatiotemporal distribution characteristics of lightning activity in this region by comprehensively utilizing FY-4A LMI and ADTD ground-based lightning observation data, to clarify the consistency and differences between the two datasets, and to provide a scientific basis and technical support for the in-depth application of LMI data in the BTH region and the fusion of satellite-ground data.

2. Materials and Methods

2.1. Study Area

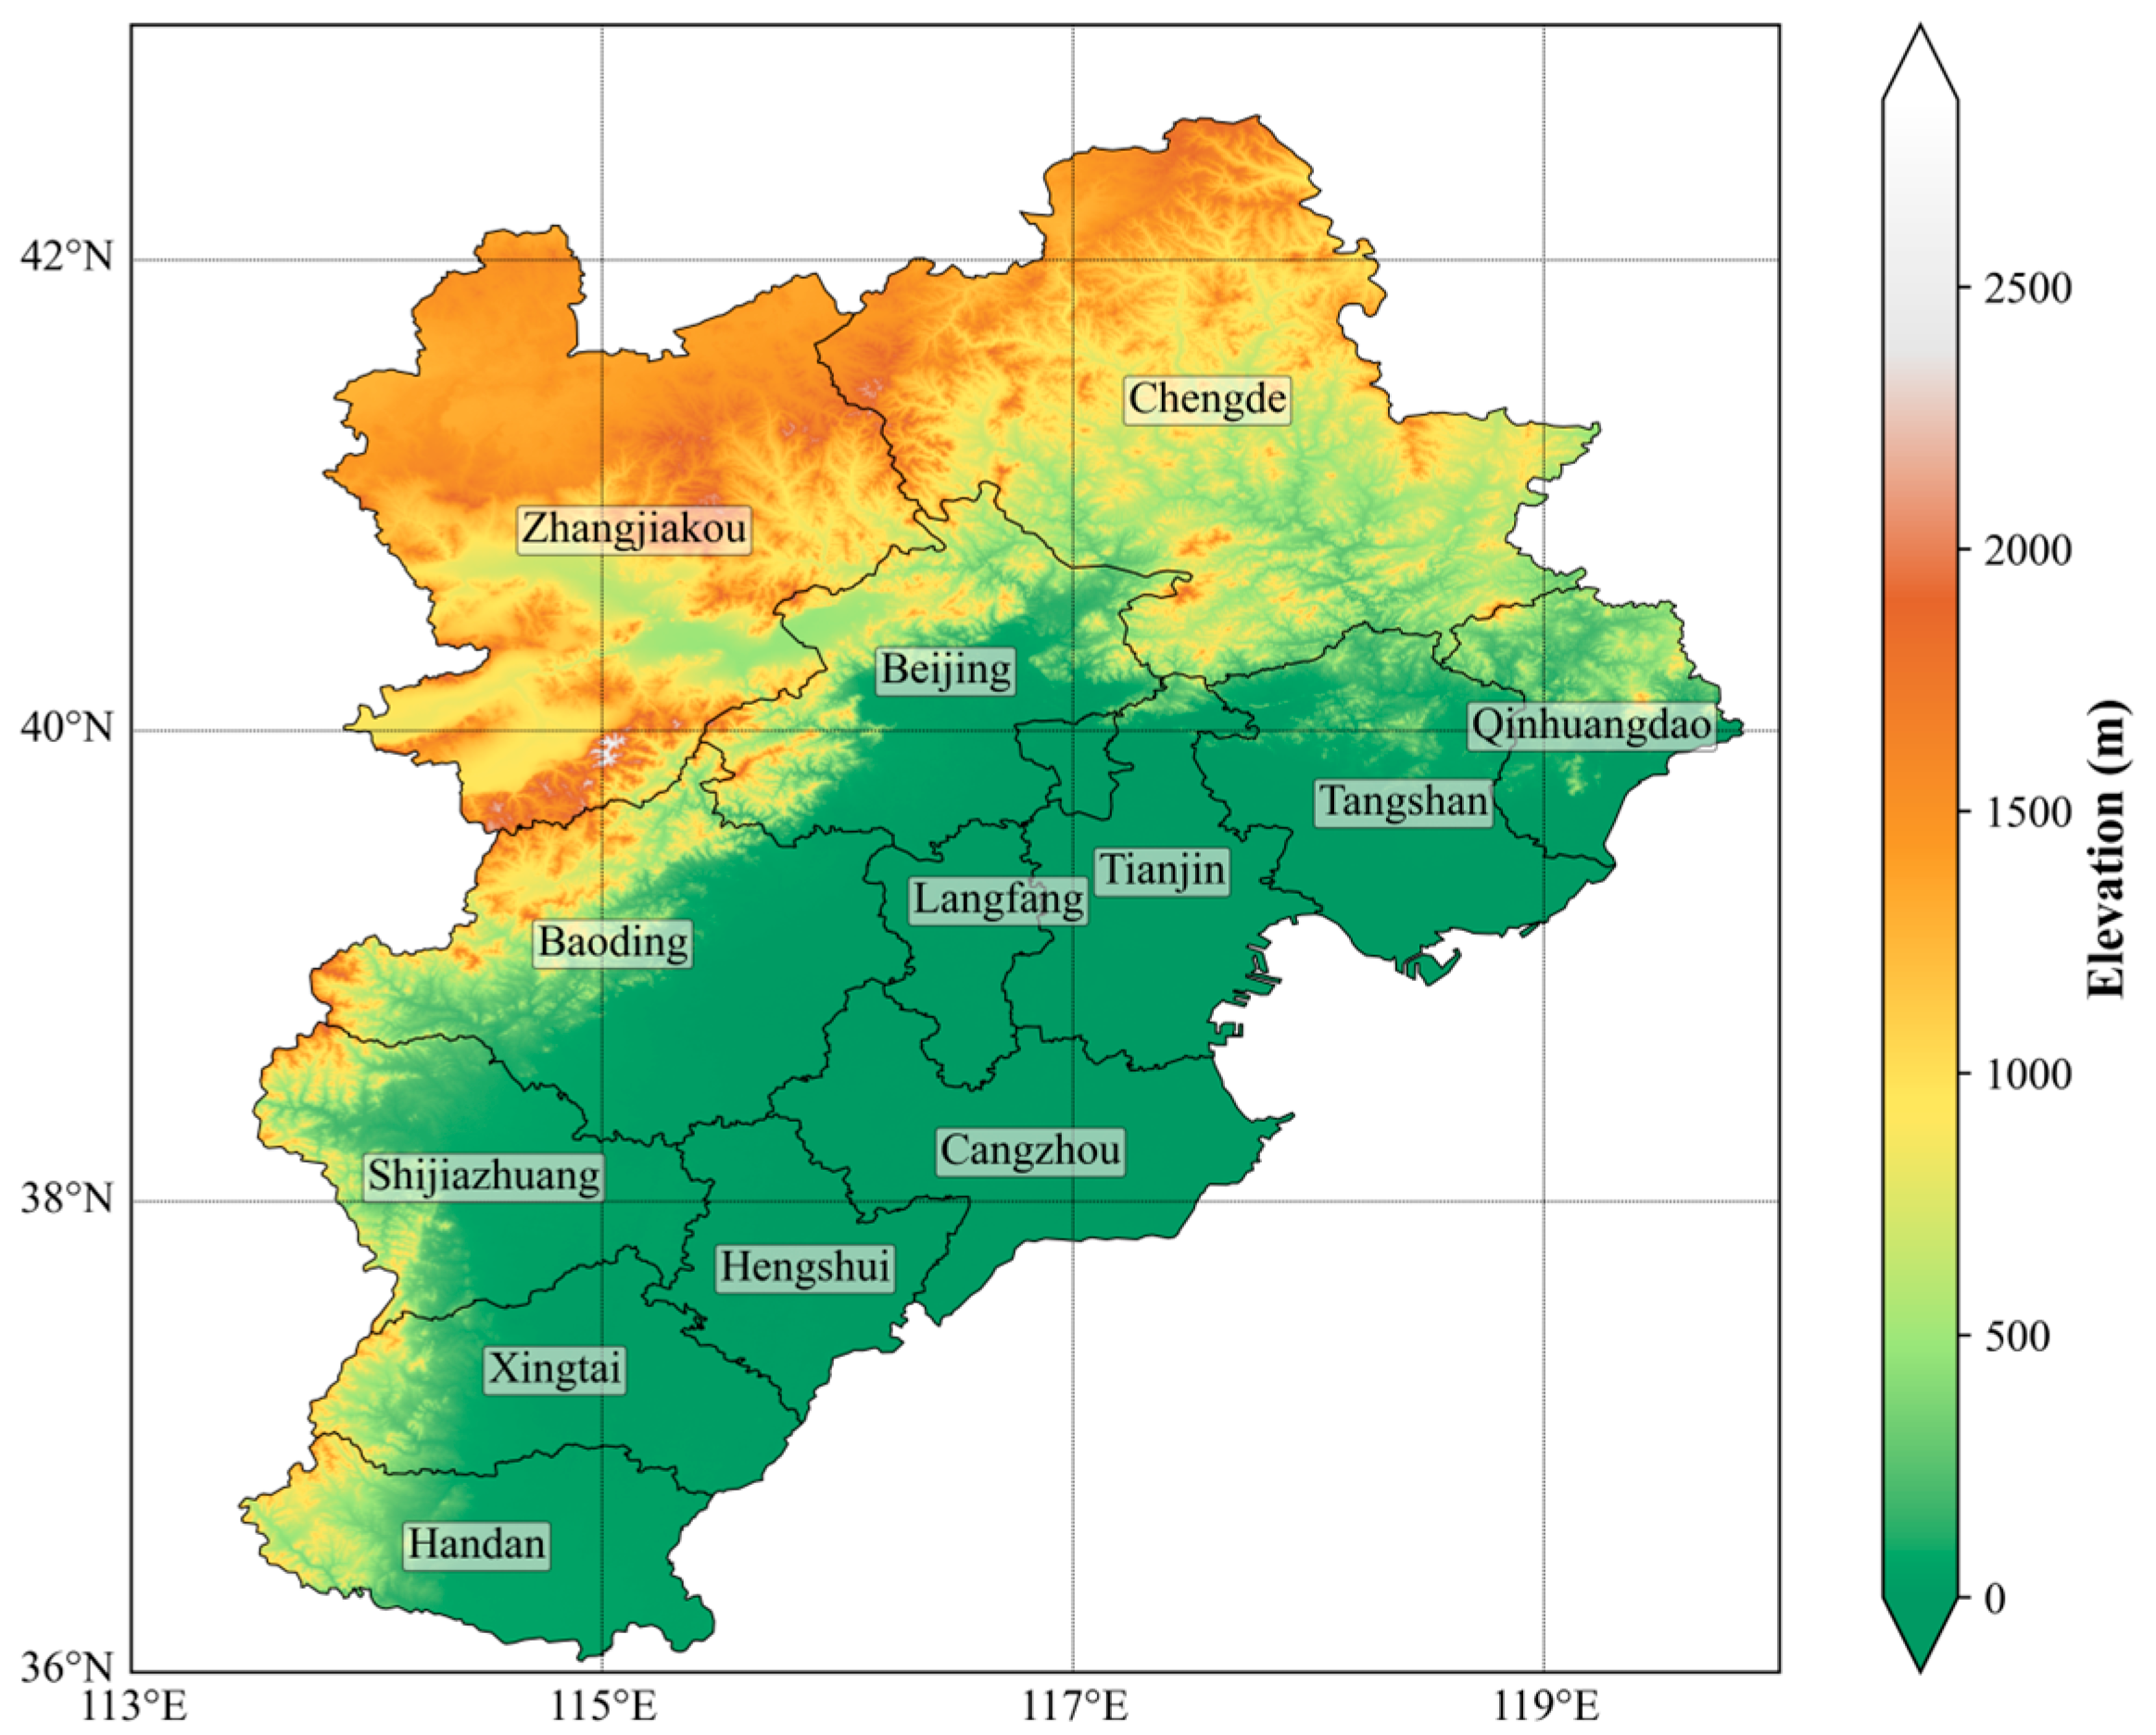
This study takes the BTH region as the research object. Located in the northern part of the North China Plain, east of the Taihang Mountains and south of the Yanshan Mountains, the region features a distinct topographic characteristic of “high in the northwest and low in the southeast”, covering a total area of approximately 218,000 km2. As a core urban agglomeration in northern China, it occupies an important strategic position in regional development.
The region has diverse landforms, including mountains, plains and coastal areas. Combined with the influence of a warm temperate continental monsoon climate, it has become a high-incidence area of severe convective weather in North China, with significant spatiotemporal differentiation characteristics of lightning activity. This provides a typical sample support for conducting comparative studies of lightning observation data, as well as research on spatiotemporal patterns and regulatory mechanisms of lightning activity.
Figure 1 shows the topographic and administrative division map of the region. It should be noted that the area surrounded by Langfang City, Beijing and Tianjin is the Northern Three Counties of Langfang (Beisanxian).

2.2. Data Sources

This study employs a multi-source dataset comprising lightning observation and topographic data to analyze lightning activities in the BTH region from April to August each year during the 2020–2023 period (Beijing Time, BJT). The dataset consists of: (1) LMI “group” products from the FY-4A LMI provided by the National Satellite Meteorological Center; (2) Ground-based detection data from the ADTD three-dimensional lightning detection network sourced from the Institute of Electrical Engineering, Chinese Academy of Sciences. For topographic feature analysis, the ASTER GDEM V3 Digital Elevation Model with a spatial resolution of 30 m is adopted, which is derived from NASA’s Terra satellite.

2.2.1. FY-4A LMI “Group” Products

The LMI onboard the FY-4A satellite is China’s first lightning detection instrument operating in geostationary orbit. Its core detection unit consists of a 400 × 600 pixel charge-coupled device (CCD) array, featuring a central detection wavelength of 777.4 nm and a bandwidth of ±1 nm, which ensures a high signal-to-noise ratio for the LMI detection system. The sensor operates at a frame rate of 500 frames per second [5].
The CCD detects the optical radiation generated by lightning discharges, and the acquired optical radiation intensity data is processed via on-board preprocessing by the Real-Time Event Processor (RTEP). This process employs algorithms such as background light estimation to filter out the background light detected by CCD pixels and extract potential lightning-emitting “events”, after which the data is transmitted to ground receiving stations in real time. Ground receiving stations perform radiometric calibration and geolocation processing on the data transmitted by the RTEP, and output calibrated and geolocated products containing information including the occurrence time, location, and intensity of lightning “events”. Subsequent false signal filtering and clustering analysis are implemented using product algorithm software, ultimately generating complete products that cover the three-level structure of lightning “events”, “group”, and “flashes” [21].
The LMI has a nadir spatial resolution of 7.8 km [9,10,11], with a field of view (FOV) covering China, adjacent landmasses, and surrounding marine areas. Notably, affected by the platform rotation of the FY-4A satellite during the spring and autumn equinoxes, the LMI’s FOV exhibits seasonal variations: from the spring equinox to the autumn equinox, it monitors China and adjacent marine areas; from the autumn equinox to the spring equinox of the following year, it observes the Indian Ocean and western Australia. This configuration enables the LMI to focus on monitoring lightning activity during the convectively active spring and summer seasons over China, providing effective data for severe convective weather monitoring and lightning warning. Since the FY-4A LMI “group” products correspond to either a single return stroke of cloud-to-ground lightning or a single K-change of cloud lightning [11], this study selected such group products, and the data were obtained from the National Satellite Meteorological Center (NSMC, http://www.nsmc.org.cn, accessed on 3 November 2025).

2.2.2. Ground-Based ADTD Lightning Data

The ground-based ADTD lightning data is derived from the three-dimensional lightning detection system deployed by the Institute of Electrical Engineering, Chinese Academy of Sciences. This system covers China and surrounding countries and regions, and has now built a monitoring network consisting of more than 500 electromagnetic pulse detection stations. To ensure detection accuracy and continuous coverage, the distance between adjacent stations is strictly controlled within 100~150 km. Among them, the detection range has achieved full coverage of the BTH region, enabling comprehensive capture of the lightning activity characteristics in this area [22,23].
The core of the system is based on the principle of electromagnetic radiation detection. It accurately captures the very low frequency (VLF)/low frequency (LF) electromagnetic signals naturally radiated during the return stroke of lightning through a highly sensitive receiving module. Combined with the time difference of arrival (TDOA) algorithm of multi-site collaboration and signal feature analysis technology, it achieves precise positioning of lightning strikes and the inversion of discharge parameters (such as return stroke current, energy, etc.), ensuring the scientific nature and integrity of the data.
This lightning data has two core advantages: first, it boasts high positioning accuracy, with a networking positioning error of less than 300 m [24], enabling clear restoration of the discharge position and trajectory of a single lightning; second, it covers a complete range of parameter dimensions, including the key physical parameters of lightning discharge, and can accurately reflect the single-point characteristics of lightning. Based on this, the data can effectively support two types of core applications: on the one hand, it provides a ground-based measured benchmark for the reliability verification of lightning observation data from the FY-4A meteorological satellite; on the other hand, it offers a high-quality data foundation for in-depth analysis of the spatial correlation laws between lightning activities and terrain (such as mountains and plains).

2.2.3. Digital Elevation Model (DEM) Data

The terrain analysis uses the 30-m resolution ASTER Global Digital Elevation Model Version 3 (ASTER GDEM V3) [25] to represent the terrain features of the BTH region. This dataset provides high-resolution global elevation information, derived from the optical stereo pairs obtained by the ASTER sensor of the NASA Terra satellite, and is available from the Geospatial Data Cloud (https://www.gscloud.cn/, accessed on 4 November 2025).

2.3. Methods

2.3.1. Data Stability Analysis

To quantify the interannual stability of the FY-4A LMI and ADTD lightning detection systems during the period 2020–2023, this study employed the coefficient of variation (CV) as the evaluation metric. The calculation formula is:
C V = s x ¯ × 100 %
where x ¯ represents the interannual mean, and s is the unbiased sample standard deviation with n 1 degrees of freedom. This indicator effectively eliminates the influence of units by calculating the ratio of the standard deviation to the mean, objectively characterizing the interannual fluctuation characteristics of the two types of lightning data.

2.3.2. Normalization of Monthly Lightning Counts

To eliminate the disparities in absolute lightning counts across different years and facilitate reliable comparison of seasonal variation patterns, the monthly lightning counts during April-August of 2020–2023 were normalized by the annual peak monthly count for each year. Specifically, the normalized value of each month was calculated as the ratio of the monthly count to the maximum monthly count within the same year. Subsequently, the average normalized value for each month was derived by averaging the normalized values of the corresponding month across the four years.

2.3.3. Statistical Significance Test

To objectively evaluate whether the differences in lightning detection results between the FY-4A LMI satellite and ADTD ground-based network were caused by essential system differences rather than random errors, and to further verify the consistency of their variation trends, two statistical analyses were performed in this study, with a significance level of α = 0.05.
(1)
Welch’s independent samples t-test
The Welch’s independent samples t-test was adopted to test the significance of differences in lightning count values between the FY-4A LMI and ADTD datasets. This modified t-test was selected because it relaxes the assumption of homogeneity of variances, which is more suitable for the lightning observation data with different detection sensitivities and resolution characteristics. The t-statistic was used to measure the magnitude of the difference between the two datasets, and the p-value was used to determine the statistical significance of the difference.
(2)
Pearson correlation analysis
Pearson correlation analysis was conducted to quantify the linear correlation between the monthly lightning counts of FY-4A LMI and ADTD. The correlation coefficient (r) reflected the strength and direction of the linear relationship between the two datasets, and the p-value was used to verify the statistical significance of the correlation. The correlation strength was divided into three levels: strong correlation (|r| ≥ 0.8), moderate correlation (0.5 ≤ |r| < 0.8), and weak correlation (|r| < 0.5).

2.3.4. Spatial Interpolation

Based on the first law of geography proposed by Tobler [26], the spatial correlation principle was adopted in this study to convert the discrete lightning observation data into continuous spatial grid data, thereby generating a lightning density distribution map. This method achieves a high-precision conversion from discrete observations to continuous density fields, providing reliable technical support for the analysis of the spatial pattern of regional lightning activities. The calculation model for the density value at the target point x 0 , y 0 is as follows:
Z x 0 , y 0 = i = 1 n w i Z i , w i = 1 d i p j = 1 n 1 d j p
where Z i represents the density of the i-th sample point, d i is the Euclidean distance between the target point and the i-th sample point, p is the distance attenuation coefficient, and w i is the normalized weight.
Equation (2) is derived from the inverse distance weighting (IDW) interpolation method, a classical spatial interpolation technique whose core assumption (spatial dependence decays with distance) is consistent with Tobler’s First Law of Geography [27]. The mathematical form of this model is a standard expression of the IDW method, widely applied in converting discrete meteorological and geophysical observation data into continuous spatial fields.
In this study, the optimal distance attenuation coefficient p for IDW interpolation was determined via the K-fold cross-validation method. Combined with verification using the empirical value commonly adopted in academic research [28], the optimal parameter p = 2.0 was finally selected.
Considering the differences in spatial resolution between the FY-4A LMI and ADTD datasets, this study adopted distinct analytical scales for them: the spatial resolution of FY-4A LMI at the subsatellite point is approximately 7.8 km [9,10,11], and a 10 km × 10 km grid was used for its density analysis; in contrast, leveraging the advantage of its meter-level high resolution, the ADTD dataset was analyzed with a 5 km × 5 km grid to more precisely characterize the spatial details of lightning activities.

3. Results

3.1. Annual Variation

To deeply analyze the interannual lightning activity characteristics and differences between the two datasets, Table 1 summarizes the statistical results of total lightning detected by the FY-4A LMI and the ADTD lightning monitoring network in the BTH region from 2020 to 2023. The statistics reveal that during the study period, the cumulative number of total lightning detected by FY-4A LMI was 88,920, corresponding to an annual average of 22,230. In comparison, the cumulative number of total lightning detected by the ADTD network reached 1,399,098, averaging 349,774.5 per year. The ratio of the annual average frequency of FY-4A LMI to that of ADTD was 0.0636, indicating a systematic discrepancy in total quantity representation. Regarding interannual variation characteristics, both FY-4A LMI and ADTD recorded their highest lightning detection numbers in 2021, demonstrating a consistent interannual peak distribution pattern. However, their interannual stability differed significantly: the interannual CV of FY-4A LMI was only 5.46%, with minimal fluctuations in annual detected numbers, reflecting strong interannual consistency. This advantage stems from the technical merits of satellite remote sensing for large-scale continuous observation. In contrast, ADTD showed a considerably higher interannual CV of 28.01%, with pronounced annual fluctuations and marked interannual variability.
The fundamental cause of this disparity in volatility lies in the technical characteristics of the two detection systems: FY-4A LMI, based on geostationary satellite optical detection, offers extensive coverage with minimal susceptibility to local environmental interference, thereby delivering stronger observational stability. In contrast, ADTD relies on ground-based electromagnetic detection technology, whose detection efficiency is susceptible to interannual variations in regional meteorological conditions (e.g., precipitation intensity and cloud thickness), surface obstructions, and station network density. These factors result in more pronounced fluctuations in lightning detection counts across years. These findings further validate the complementary nature of the two datasets at the interannual scale: FY-4A LMI is suitable for long-term stable characterization of regional lightning activity, while ADTD can accurately capture transient intense activity characteristics of lightning discharges.

3.2. Monthly Variation

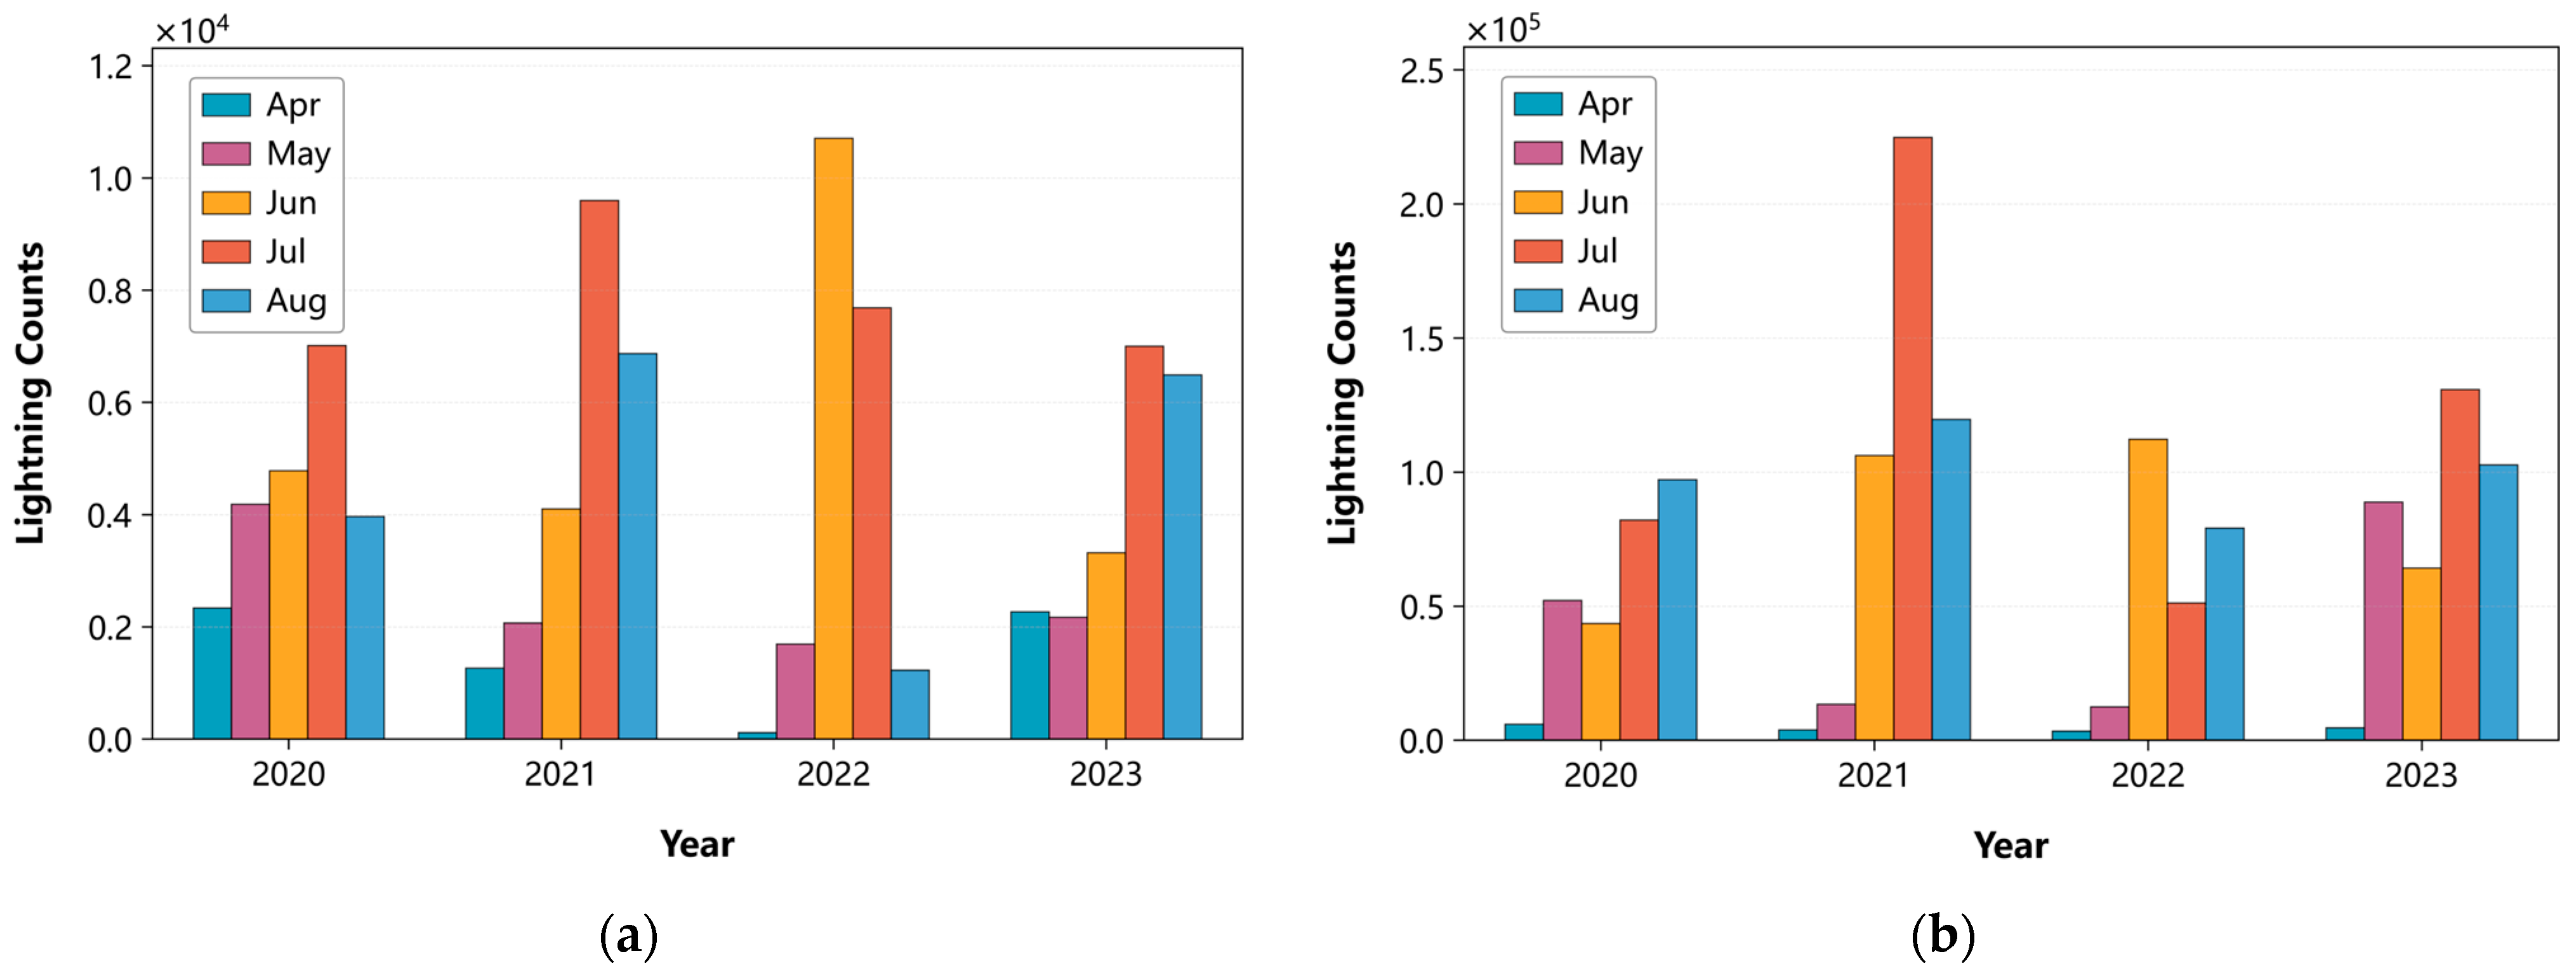
As shown in Figure 2a, the total lightning count detected by FY-4A LMI from 2020 to 2023 generally exhibited a “first increase then decrease” monthly variation pattern during the April-August period, with subtle differences in peak months and local variation details among years. In 2020 and 2021, the lightning count reached its annual peak in July, consistent with the climatic background of frequent strong convective weather during midsummer in the Northern Hemisphere for this region. In 2022, the peak month shifted earlier to June, exhibiting a distinct monthly variation pattern compared with other years. In 2023, despite local fluctuations (slightly lower count in May than in April), the overall monthly variation trend remained unchanged, ultimately peaking in July
As shown in Figure 2b, the total lightning count detected by ADTD exhibited an overall “first increase then decrease” seasonal pattern during the April-August period: the lightning count was the lowest in April, and July served as the core peak month for most years (with peak values of 224,826 and 130,805 counts in 2021 and 2023, respectively). In 2020, the peak month was delayed until August (97,190 counts), with the frequency in July of the same year (82,147 counts) showing little difference from that in August. In 2022, the peak month shifted earlier to June (112,281 counts), and the lightning count in July dropped sharply to 51,196 counts. Although the lightning count in August decreased compared with that in the peak month, it remained at a relatively high level, forming the final high-value phase of lightning activity during the flood season.
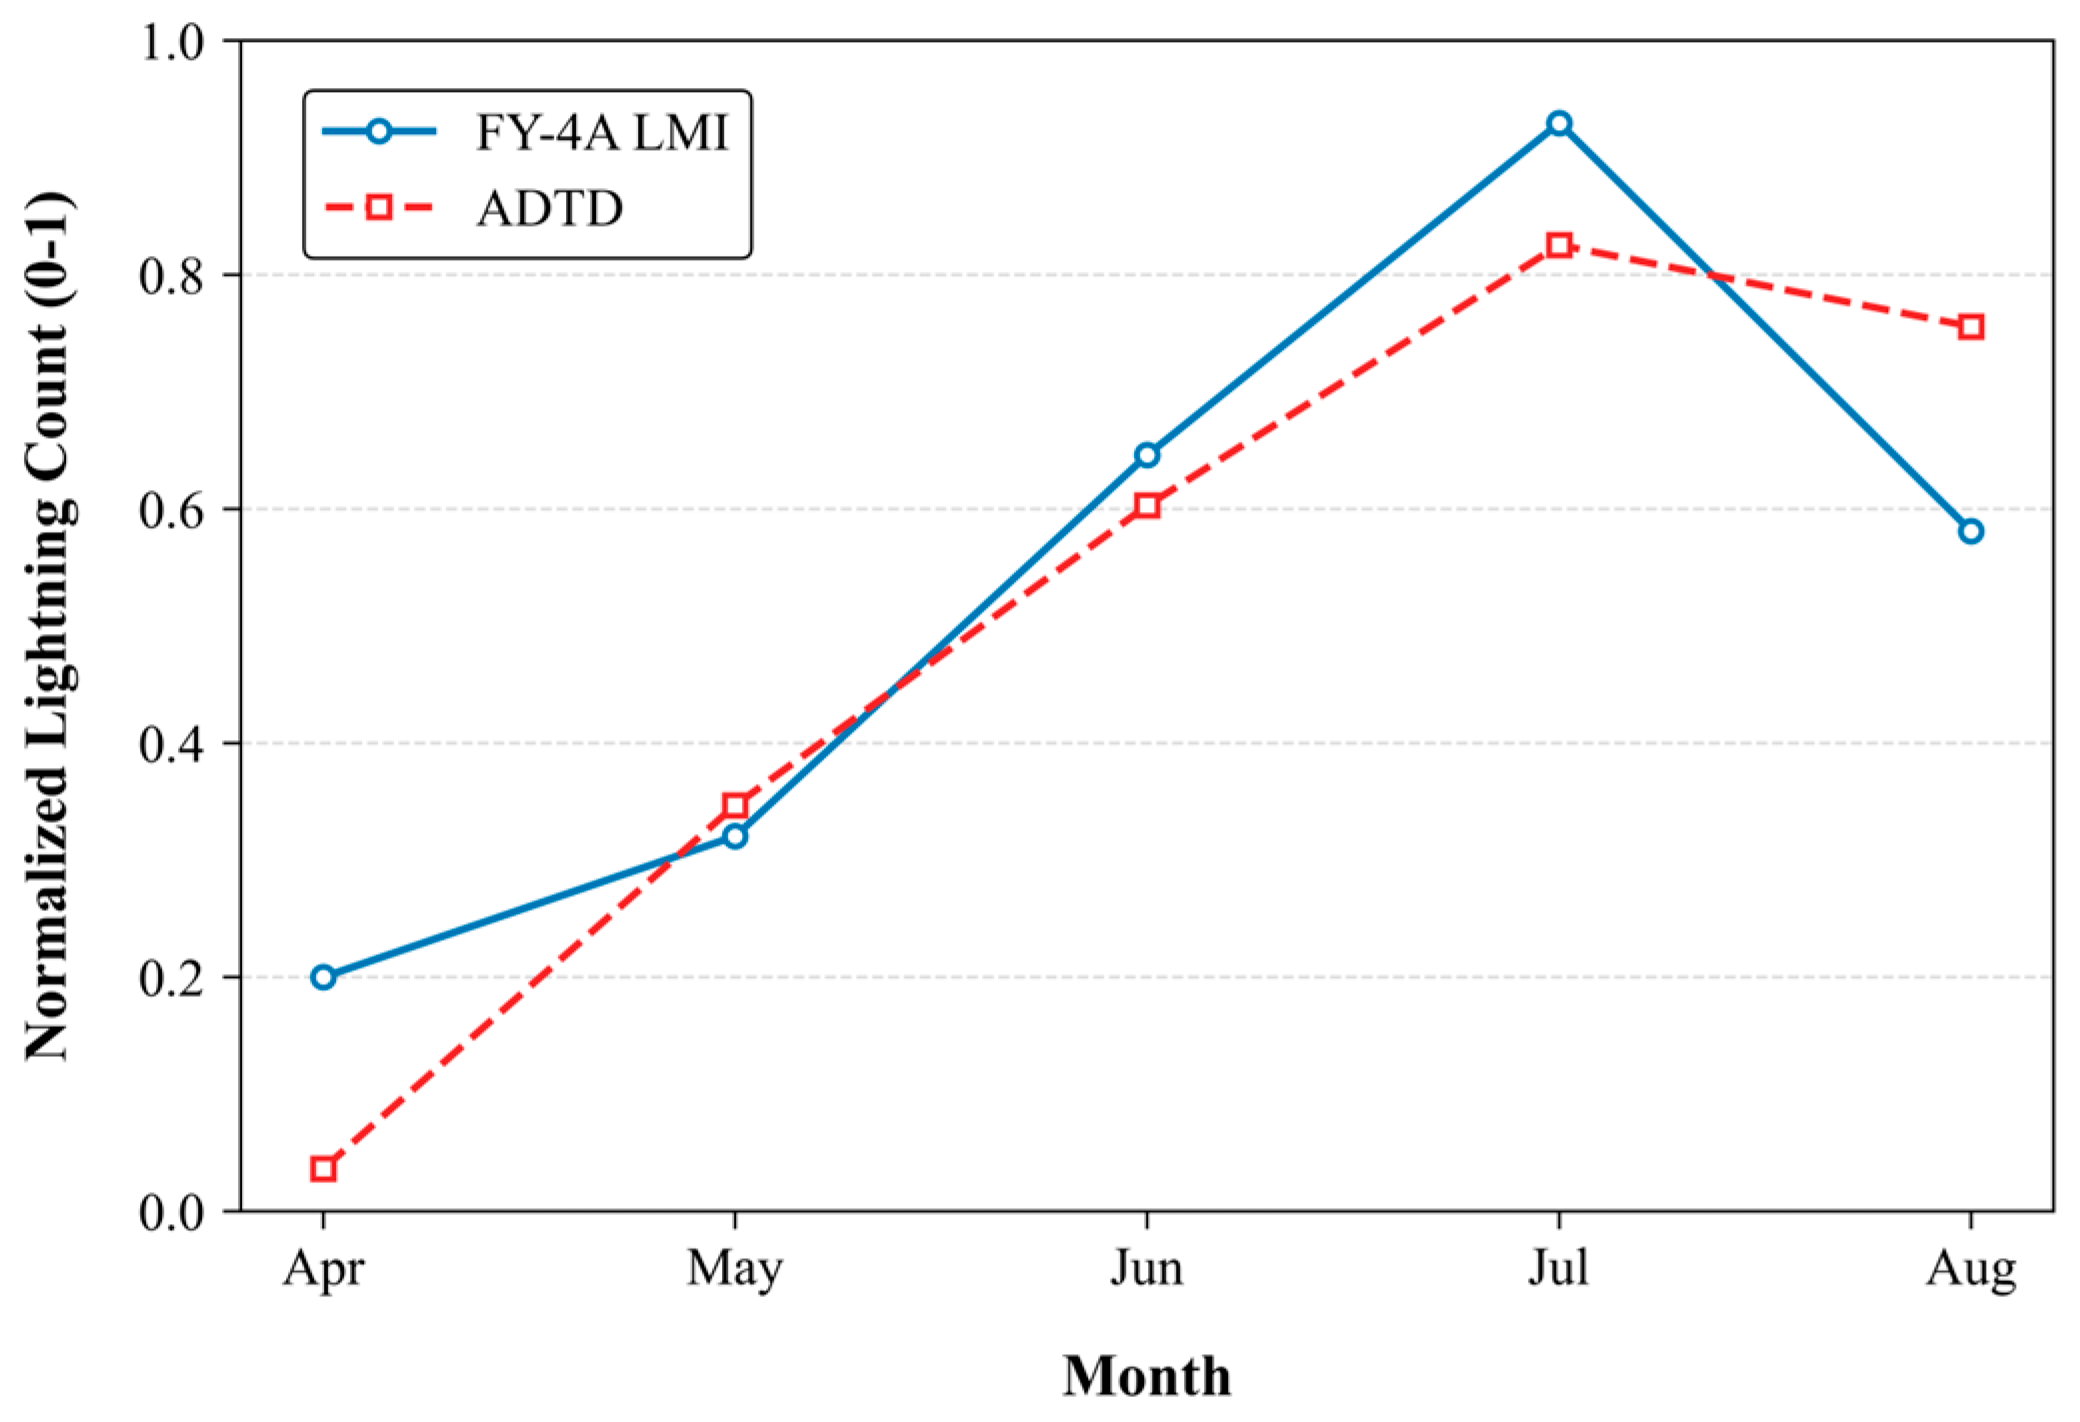
As shown in Figure 3, the monthly variations in normalized lightning counts from the FY-4A LMI and ADTD datasets exhibit the following characteristics:
(1)
Highly consistent variation trend
Both datasets exhibit a unimodal distribution, with lightning counts continuously increasing from April to July, peaking in July and declining in August. No trend deviation is observed between the two datasets.
(2)
Consistent peak time point
The maximum normalized values of both datasets occur in July. Specifically, the normalized value of FY-4A LMI reaches 0.93, while that of ADTD is 0.83. These results jointly confirm that midsummer July is the most active month for lightning activities in the BTH region.
(3)
Significant differences in values and fluctuations
(1)
Difference in overall value levels across the entire period: From April to August, the normalized values of FY-4A LMI are generally higher than those of ADTD, with the most prominent gap observed in July.
(2)
Difference in monthly fluctuation amplitude: The values of FY-4A LMI exhibit more drastic variations (rising from 0.20 in April to 0.93 in July, representing an over 3.6-fold increase), whereas ADTD shows relatively moderate fluctuations. Despite a high growth rate of approximately 19.8-fold (rising from 0.04 in April to 0.83 in July), ADTD has a much lower initial value.
(3)
Differentiated performance in the declining phase: Both datasets show a decreasing trend in August. FY-4A LMI experiences a greater decline, while ADTD exhibits a relatively moderate decrease. Notably, the normalized value of ADTD surpasses that of FY-4A LMI in August.
The Welch’s independent samples t-test results showed a highly significant difference in lightning counts between FY-4A LMI and ADTD (t = −5.1758, p = 0.000053 < 0.01), suggesting that the discrepancy in detection results was caused by the intrinsic differences in detection principles and technical characteristics between the two observation systems rather than random errors. In addition, Pearson correlation analysis indicated a moderately strong positive correlation in monthly lightning counts between the two datasets (r = 0.7354, p = 0.000220 < 0.01), which verified a good consistency in characterizing the monthly variation trend of lightning activity over the BTH region.

3.3. Daily Variation

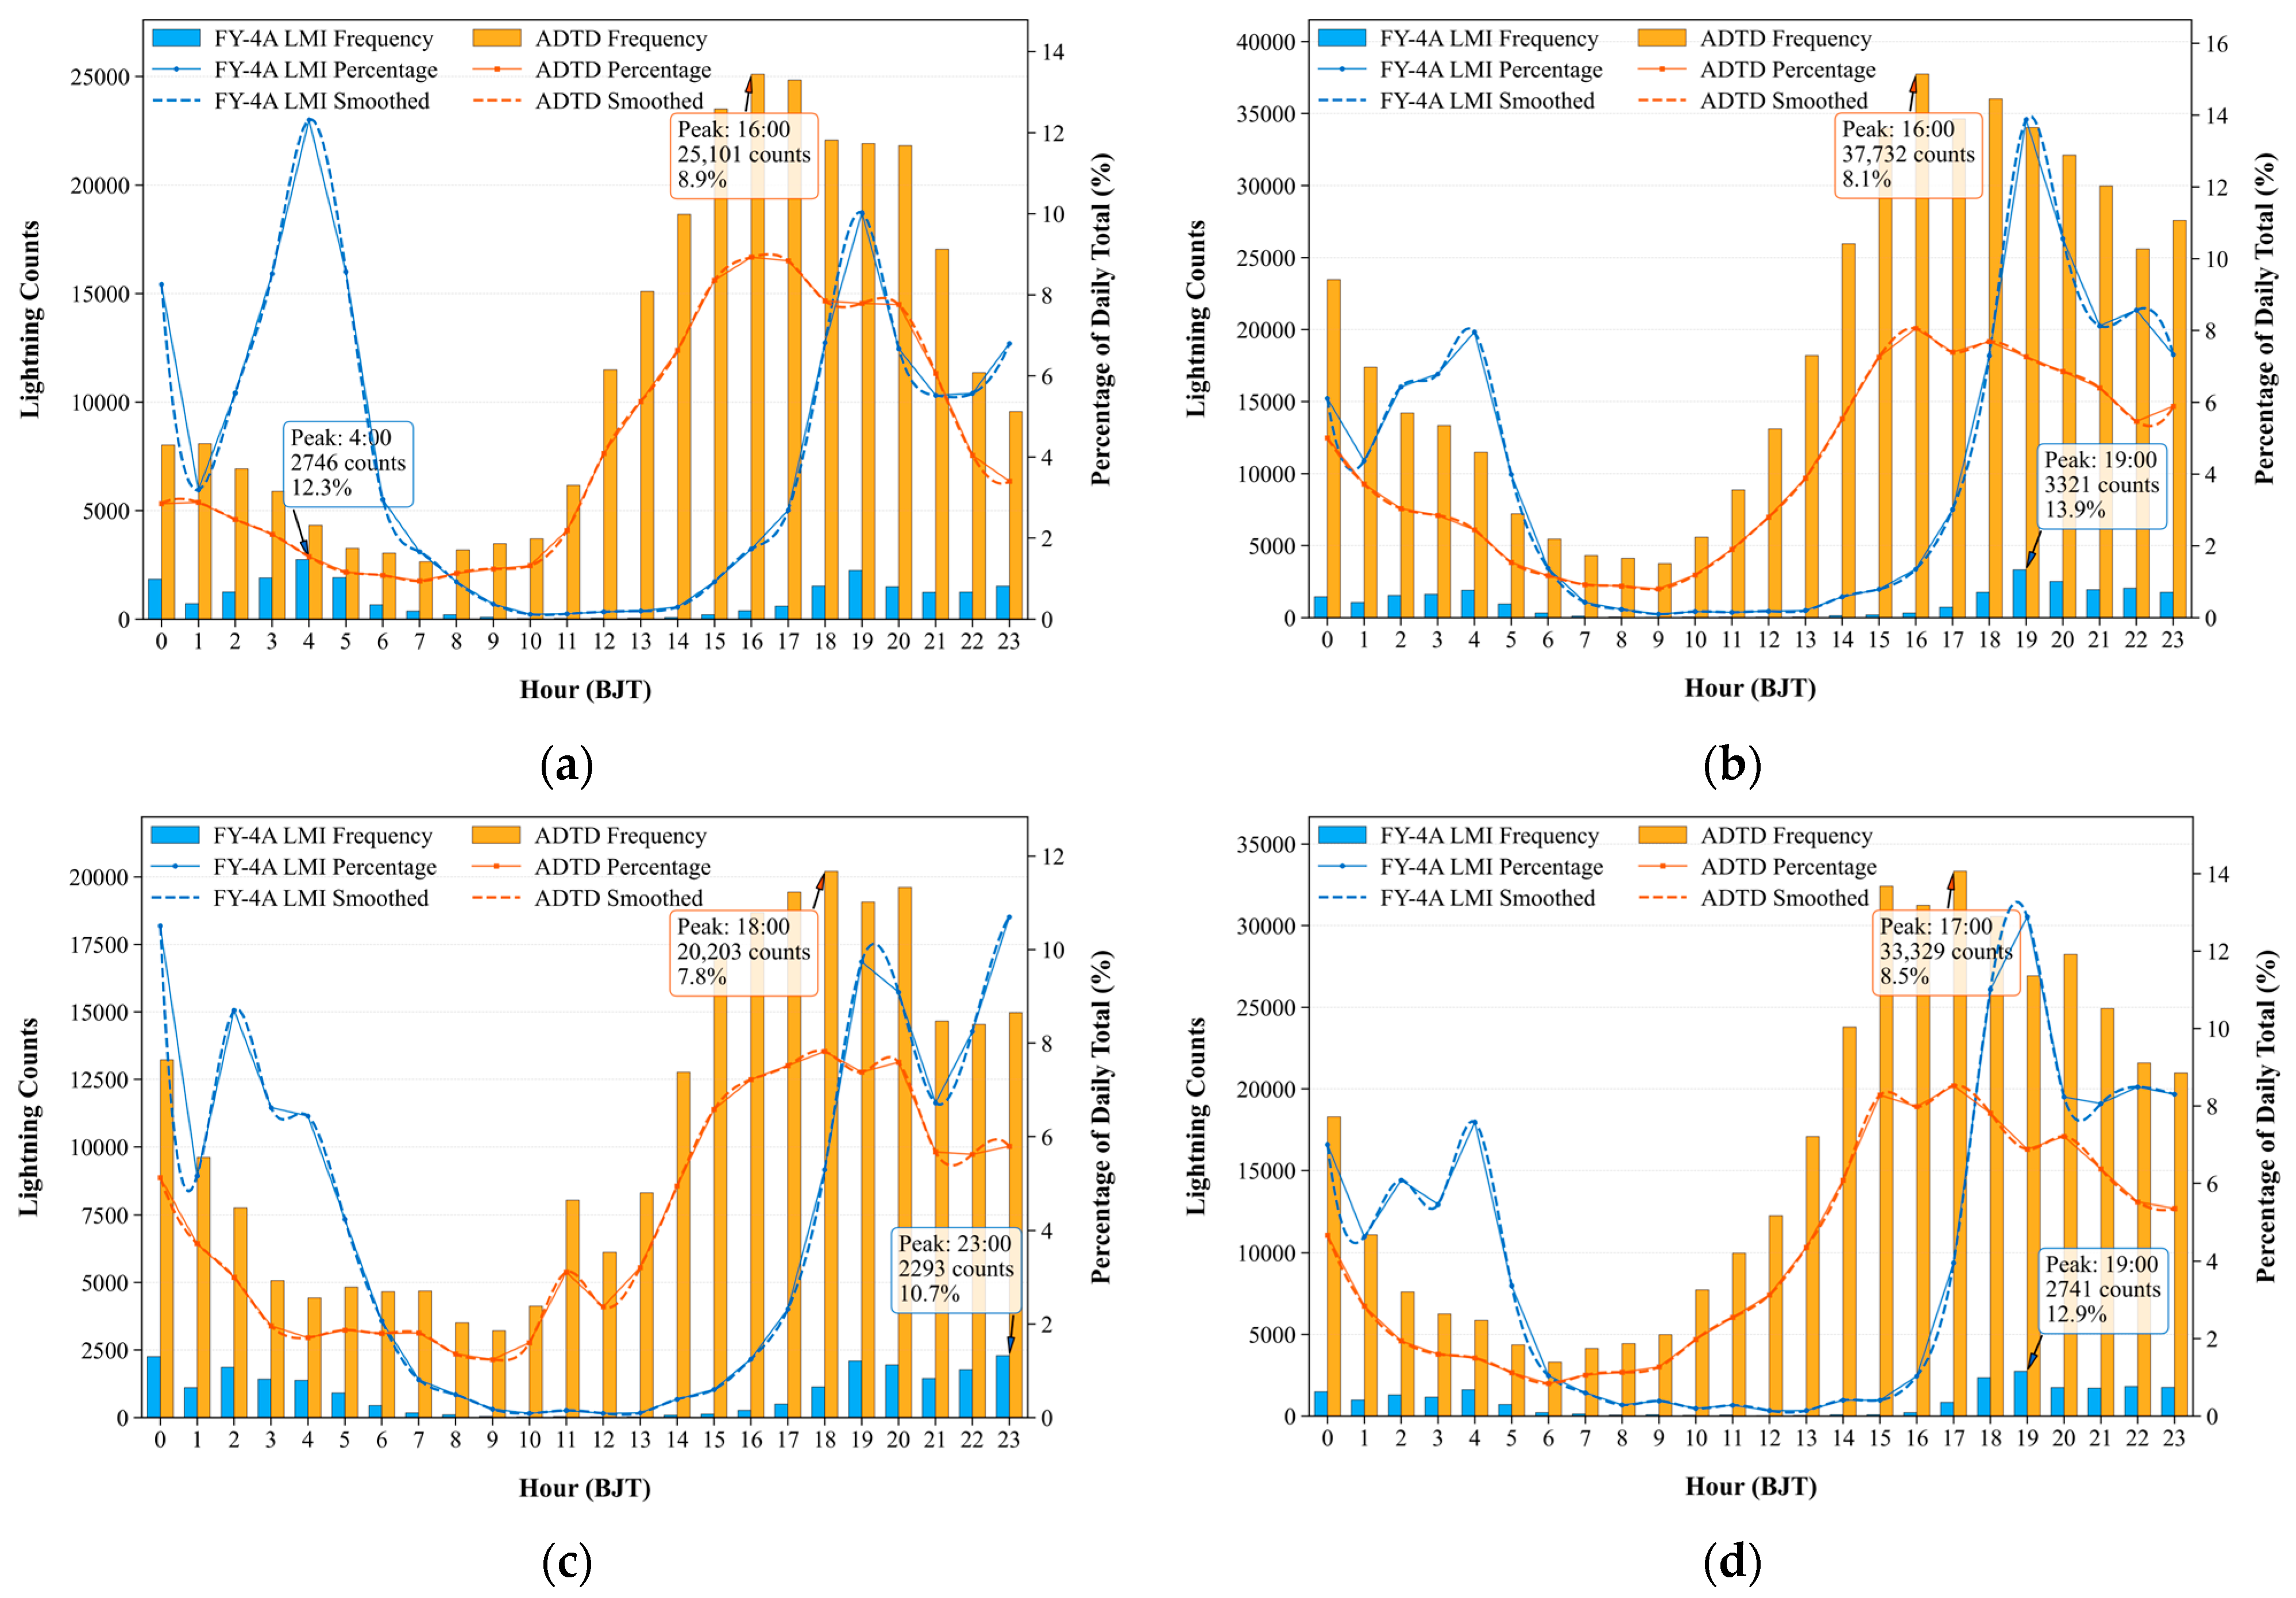
The diurnal distributions of lightning detected by FY-4A LMI and ADTD from 2020 to 2023 are presented in Figure 4.
As shown in Figure 4a (2020), the FY-4A LMI lightning diurnal distribution exhibited a distinct bimodal pattern, with the primary peak occurring at 04:00 (2746 counts, accounting for 12.3% of the total daily count) and a secondary peak at 19:00. In contrast, the ADTD lightning diurnal distribution showed a unimodal pattern, with the peak appearing at 16:00 (25,101 counts, accounting for 8.9% of the total daily count).
As shown in Figure 4b (2021), the FY-4A LMI dataset maintained a bimodal diurnal pattern, where the first peak occurred at 04:00 and the primary peak shifted to 19:00 (3321 counts, constituting 13.9% of the total daily count). For ADTD lightning, the diurnal variation remained unimodal with the peak still at 16:00, reaching a count of 37,732 (8.1% of the total daily count).
As shown in Figure 4c (2022), the bimodal pattern of FY-4A LMI lightning persisted but with a notable shift in peak timing: the first peak was recorded at 19:00 and the primary peak at 23:00 (2293 counts, accounting for 10.7% of the total daily count). Meanwhile, the ADTD lightning diurnal distribution remained unimodal, with its peak delayed to 18:00 (20,203 counts, making up 7.8% of the total daily count).
As shown in Figure 4d (2023), the FY-4A LMI lightning diurnal distribution persisted as a bimodal pattern, with the first peak at 04:00 and the primary peak at 19:00 (2741 counts, constituting 12.9% of the total daily count). In comparison, the ADTD lightning diurnal distribution kept its unimodal pattern, with the peak time advancing to 17:00 (33,329 counts, accounting for 8.5% of the total daily count).
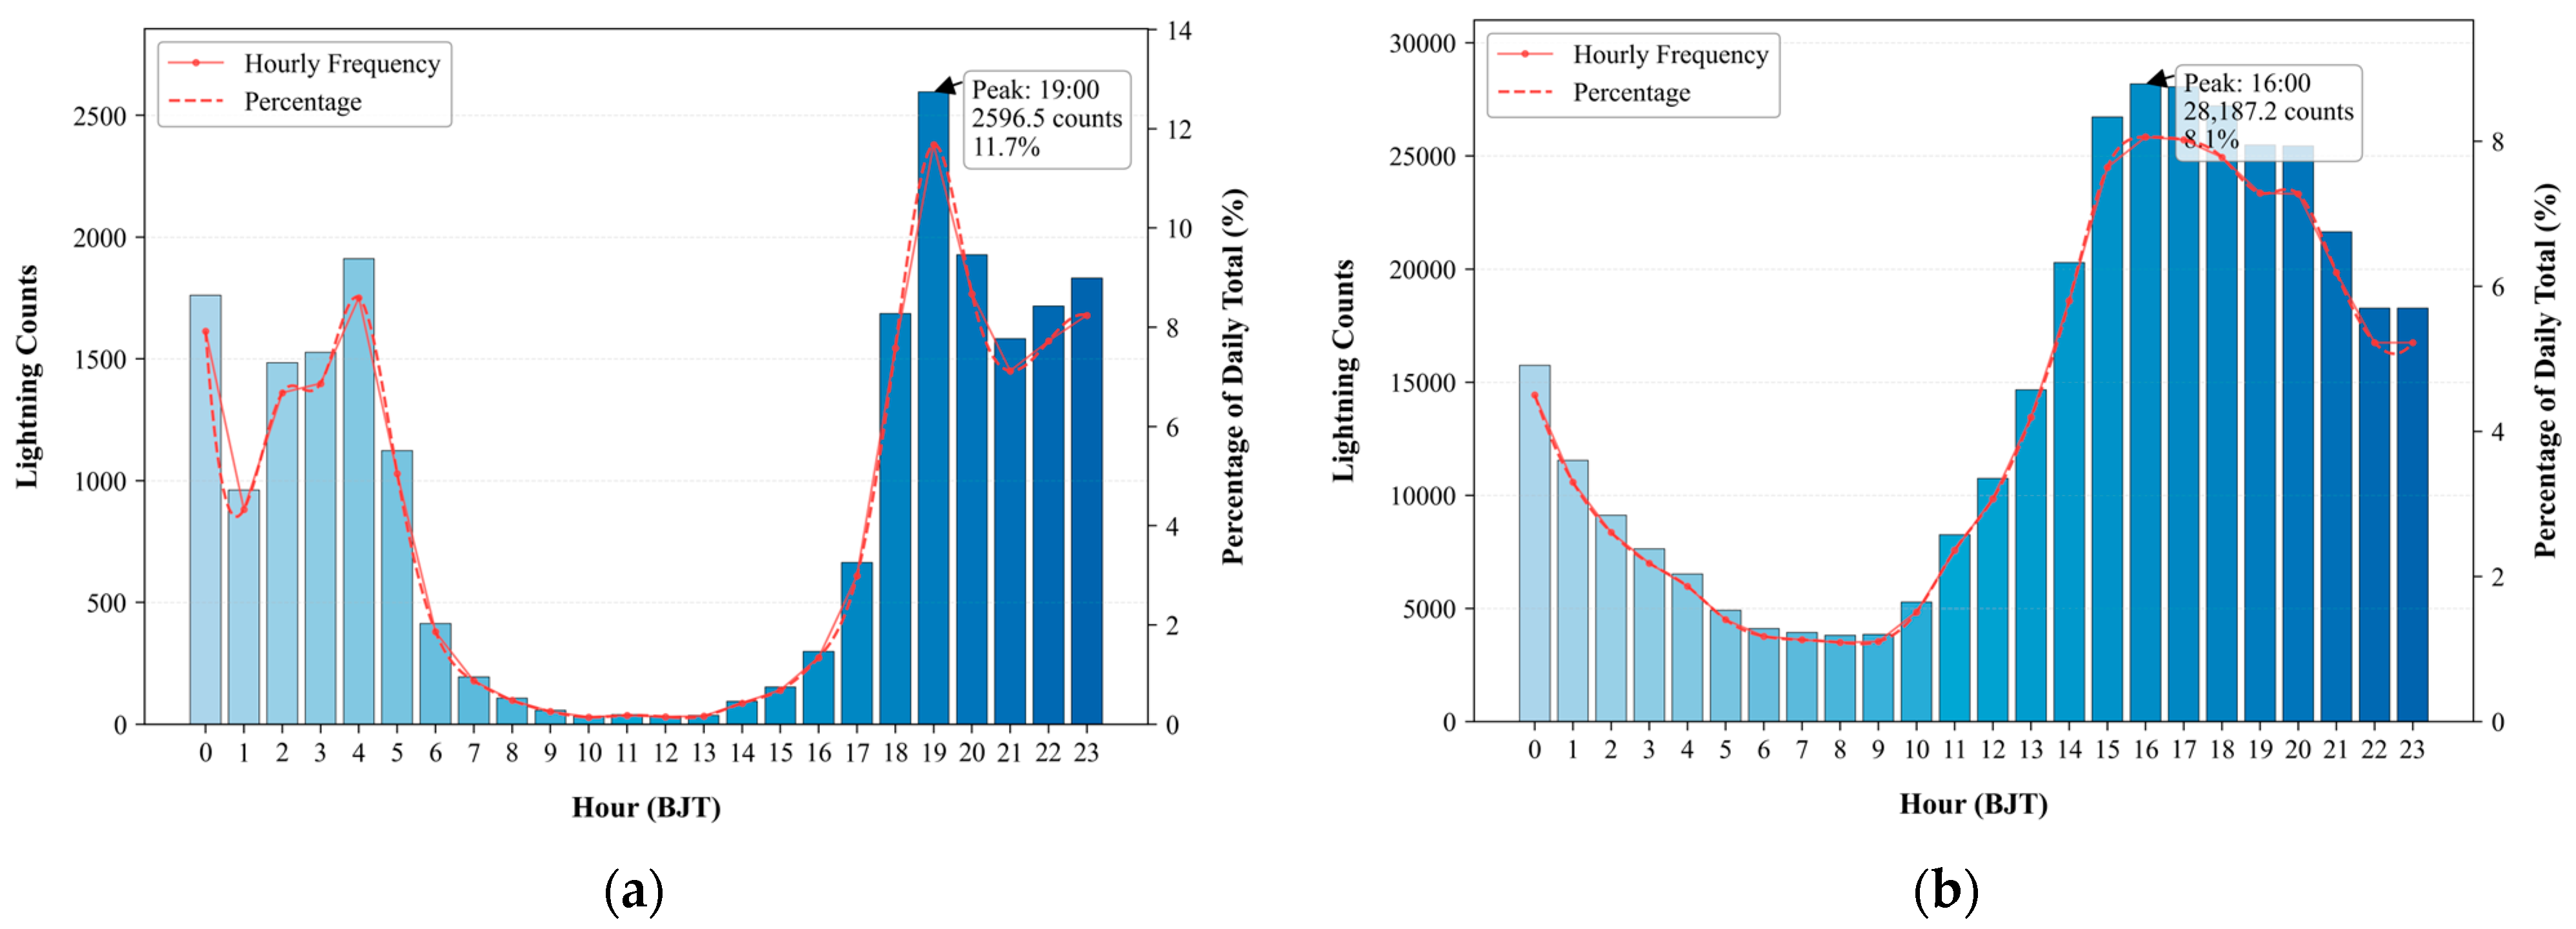
From the perspective of the average daily distribution characteristics of lightning during 2020–2023, FY-4A LMI (Figure 5a) exhibited a typical bimodal diurnal variation pattern, with lightning activity predominantly concentrated between 18:00 on the same day and 05:00 the next day. Specifically, the first peak occurred at 04:00, with a count of 1910.75 (accounting for 8.6% of the total daily count), while the primary peak (i.e., the maximum peak) emerged at 19:00 in the evening, corresponding to a count of 25,596.5 (representing 11.7% of the total daily count). In contrast, ADTD (Figure 5b) displayed a typical unimodal diurnal variation pattern, with its lightning activity mainly concentrated from 14:00 on the same day to the early morning of the next day. The peak occurred at 16:00 in the afternoon, with a count of 28,187.2 (accounting for 8.1% of the total daily count).
Notably, the proportion of FY-4A LMI in peak periods is higher than that of ADTD. This discrepancy may be associated with the characteristic of FY-4A LMI’s relatively lower detection efficiency during daytime [17]. During daytime, FY-4A LMI is disturbed by solar radiation background noise, leading to a decrease in its detection sensitivity to cloud-top discharge signals. As a result, some daytime lightning events are not effectively captured, causing a relative increase in the frequency proportion during nighttime and twilight periods. In contrast, ADTD maintains stable detection efficiency throughout the day, and the large number of lightning events generated by afternoon severe convection disperses the proportion in peak periods, thus resulting in a lower peak proportion.

3.4. Spatial Variation

As can be seen from the 2020 FY-4A LMI lightning density distribution map (Figure 6a), the highest density in 2020 was observed in eastern Xingtai, followed by western, central and eastern Zhangjiakou, western and eastern Cangzhou, the border area between Hengshui and Xingtai, and other scattered small regions.
According to the 2021 FY-4A LMI lightning density distribution map (Figure 6b), the highest density in 2021 was observed in southern Beijing, followed by most areas of Beijing, western Tangshan, eastern Tianjin, eastern and southern Cangzhou, and other scattered small regions.
As indicated in the 2022 FY-4A LMI lightning density distribution map (Figure 6c), the highest density in 2022 was observed at the junction of western Langfang and Baoding, as well as northern Shijiazhuang, followed by the Beijing-Tianjin-Langfang border area, northern Shijiazhuang, eastern Xingtai, the Langfang-Baoding-Cangzhou junction area, western Zhangjiakou, southern Qinhuangdao, and other scattered small regions.
From the 2023 FY-4A LMI lightning density distribution map (Figure 6d), a small localized core high-density area with the highest lightning density was observed in northwestern Shijiazhuang in 2023. Secondary high-density areas were distributed across the relatively larger regions adjacent to its northwest, southern Qinhuangdao, central Tianjin, and other scattered small regions.
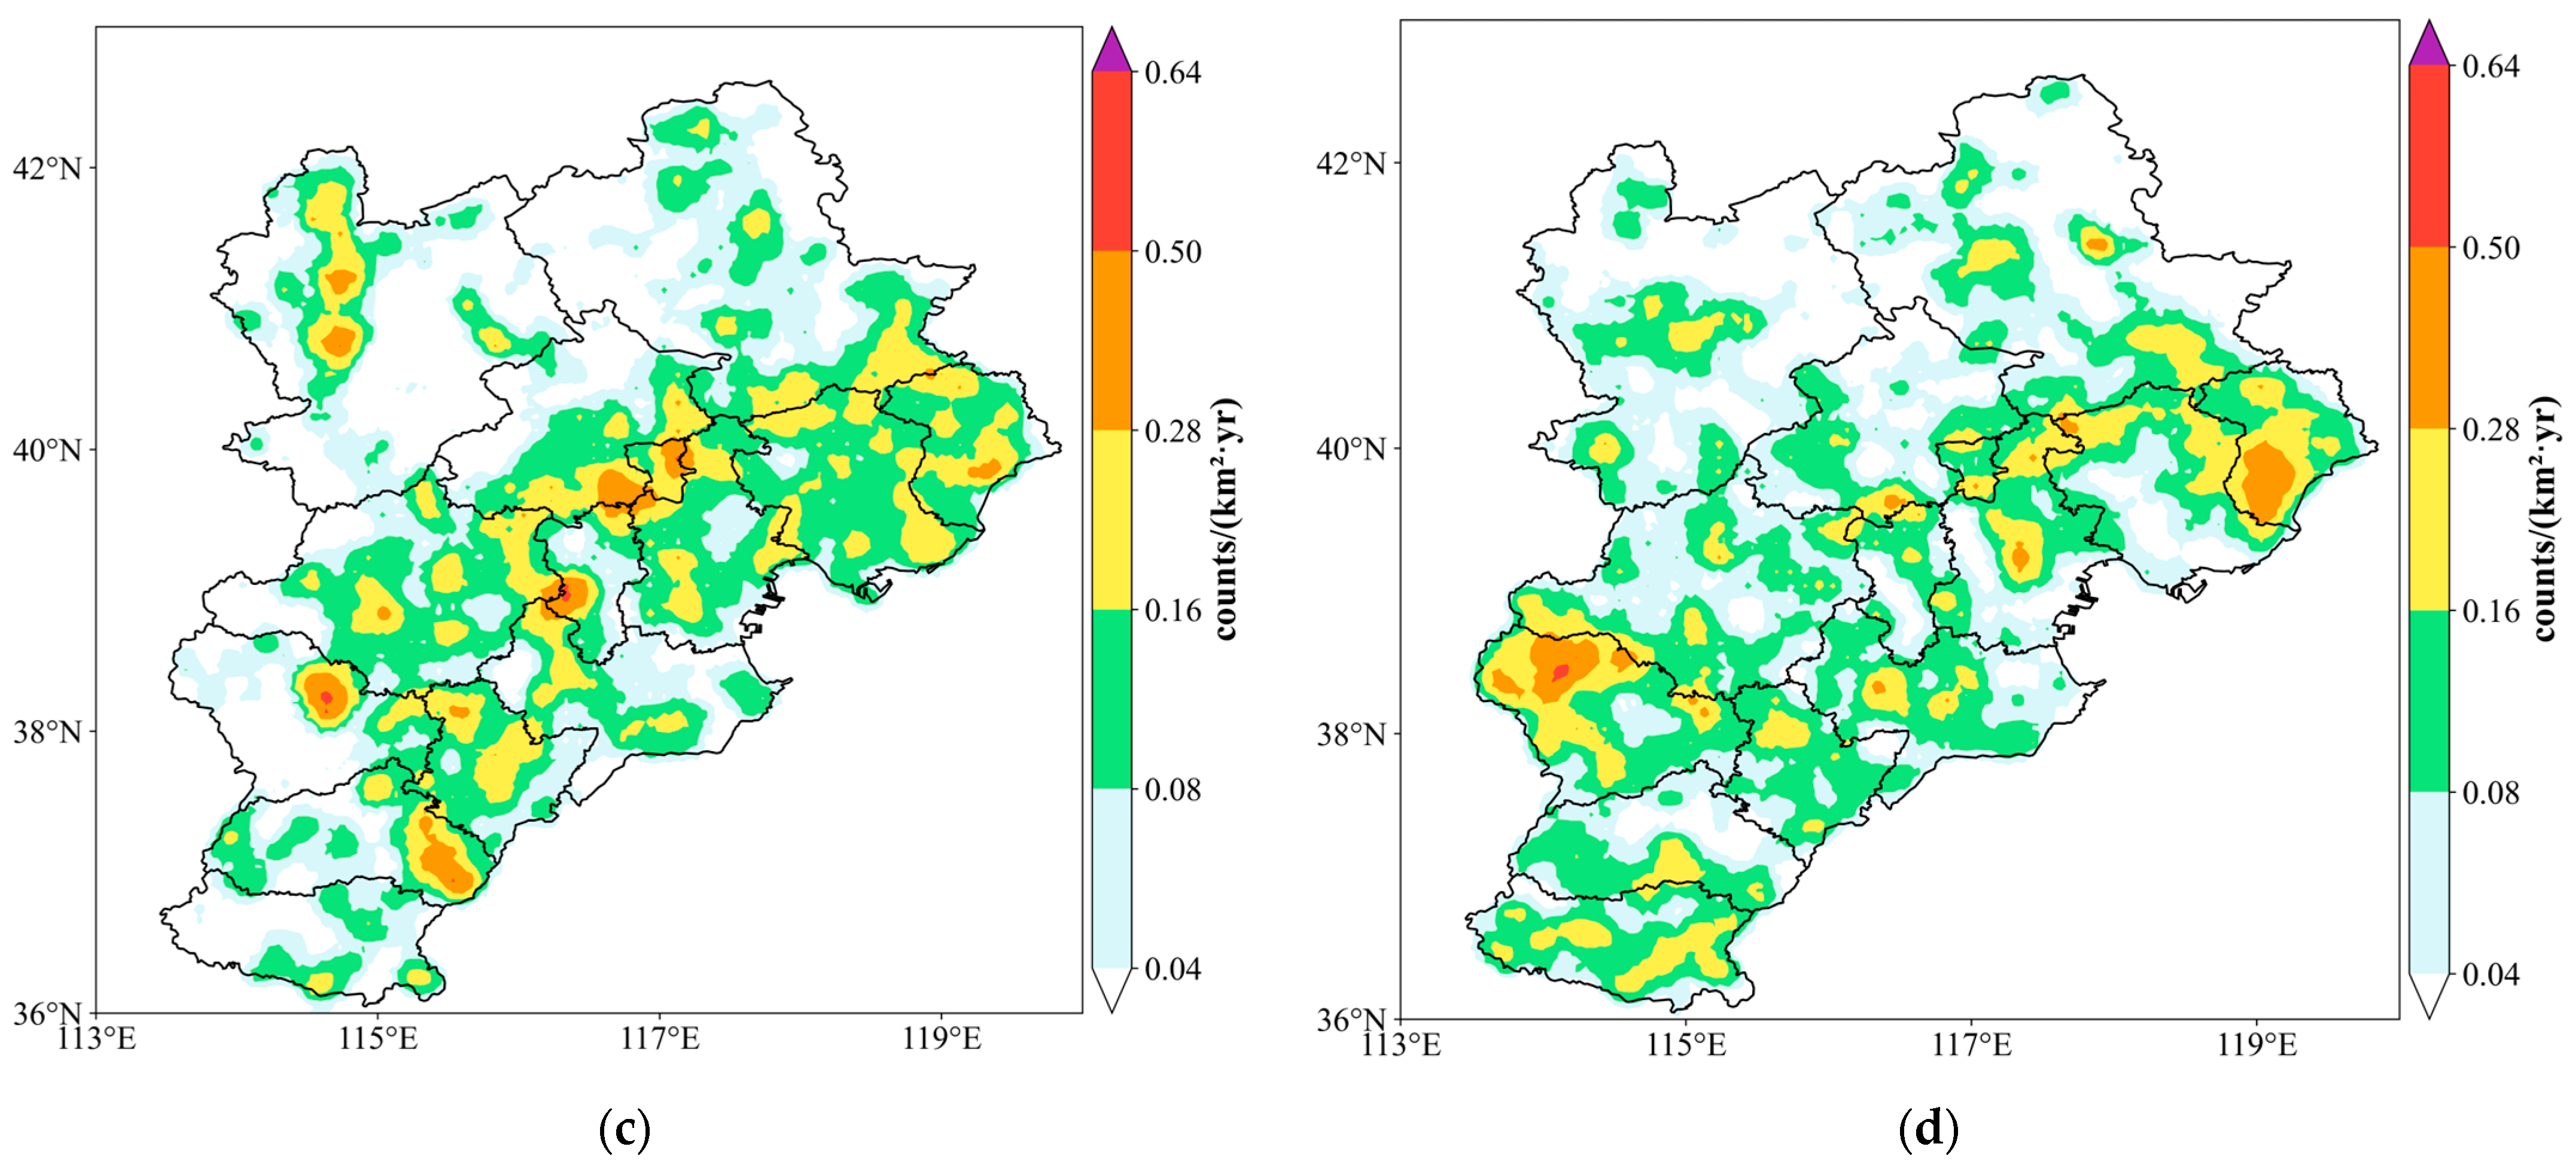
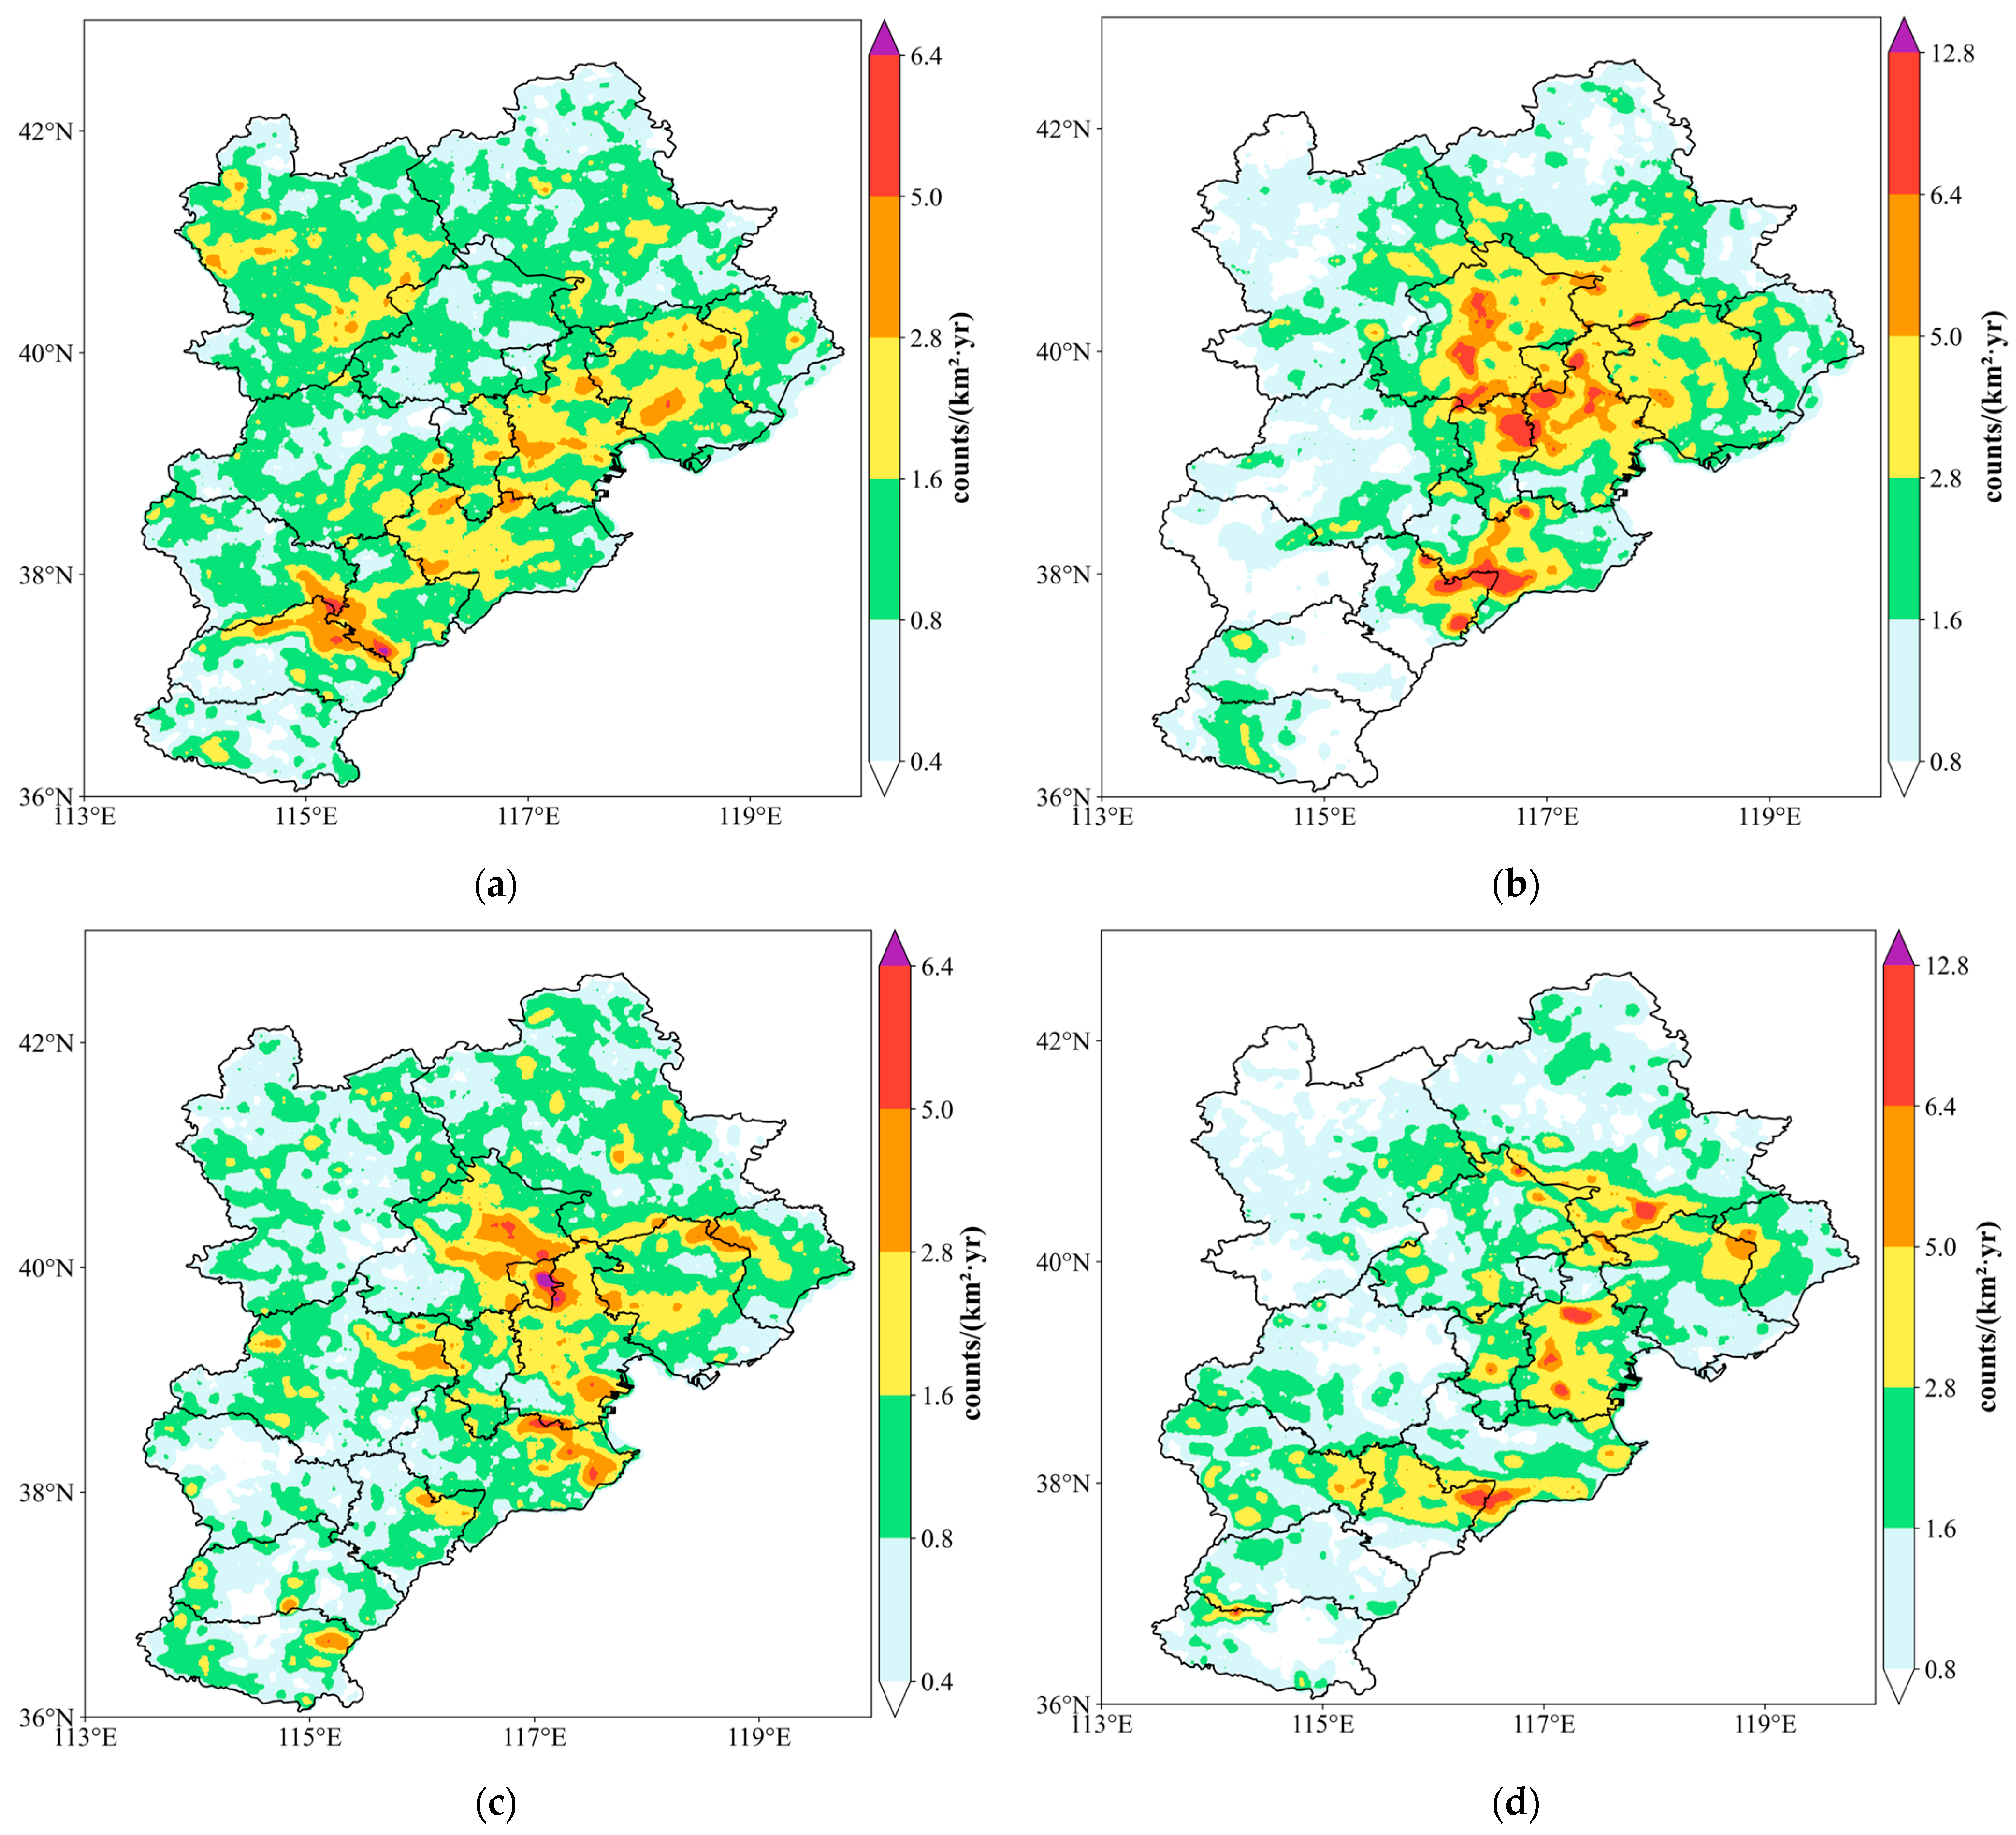
As can be seen from the 2020 ADTD lightning density distribution map (Figure 7a), the highest lightning density was observed in southwestern Hengshui adjacent to Xingtai and the eastern part of Shijiazhuang bordering Xingtai. Secondary high-density areas included western Tangshan, central and western Tianjin, northern and western Cangzhou, the junction of Hengshui, Shijiazhuang and Xingtai, as well as western and southeastern Zhangjiakou.
As indicated in the 2021 ADTD lightning density distribution map (Figure 7b), lightning was primarily distributed across central and southern Beijing, western Tangshan, northern and western Tianjin, northeastern Langfang, southern Cangzhou, eastern Hengshui, and other scattered regions.
The 2022 ADTD lightning density distribution map (Figure 7c) shows that the highest density occurred in the border areas between eastern Beijing and northern of Beisanxian, between eastern Beisanxian and northern Tianjin, and between northern Tianjin and Beisanxian. Secondary high-density zones were identified in eastern Beijing, the junction of Qinhuangdao, Tangshan and Chengde, northern and eastern Tianjin, eastern Beisanxian, eastern Cangzhou, eastern Baoding, eastern Handan, and other scattered small areas.
According to the 2023 ADTD lightning density distribution map (Figure 7d), lightning activity was mainly concentrated in northern Beijing, southern Chengde, the border area between western Qinhuangdao and Tangshan, western and central Tianjin, central Langfang, the border area between southern Cangzhou and eastern Hengshui, and other scattered small regions.
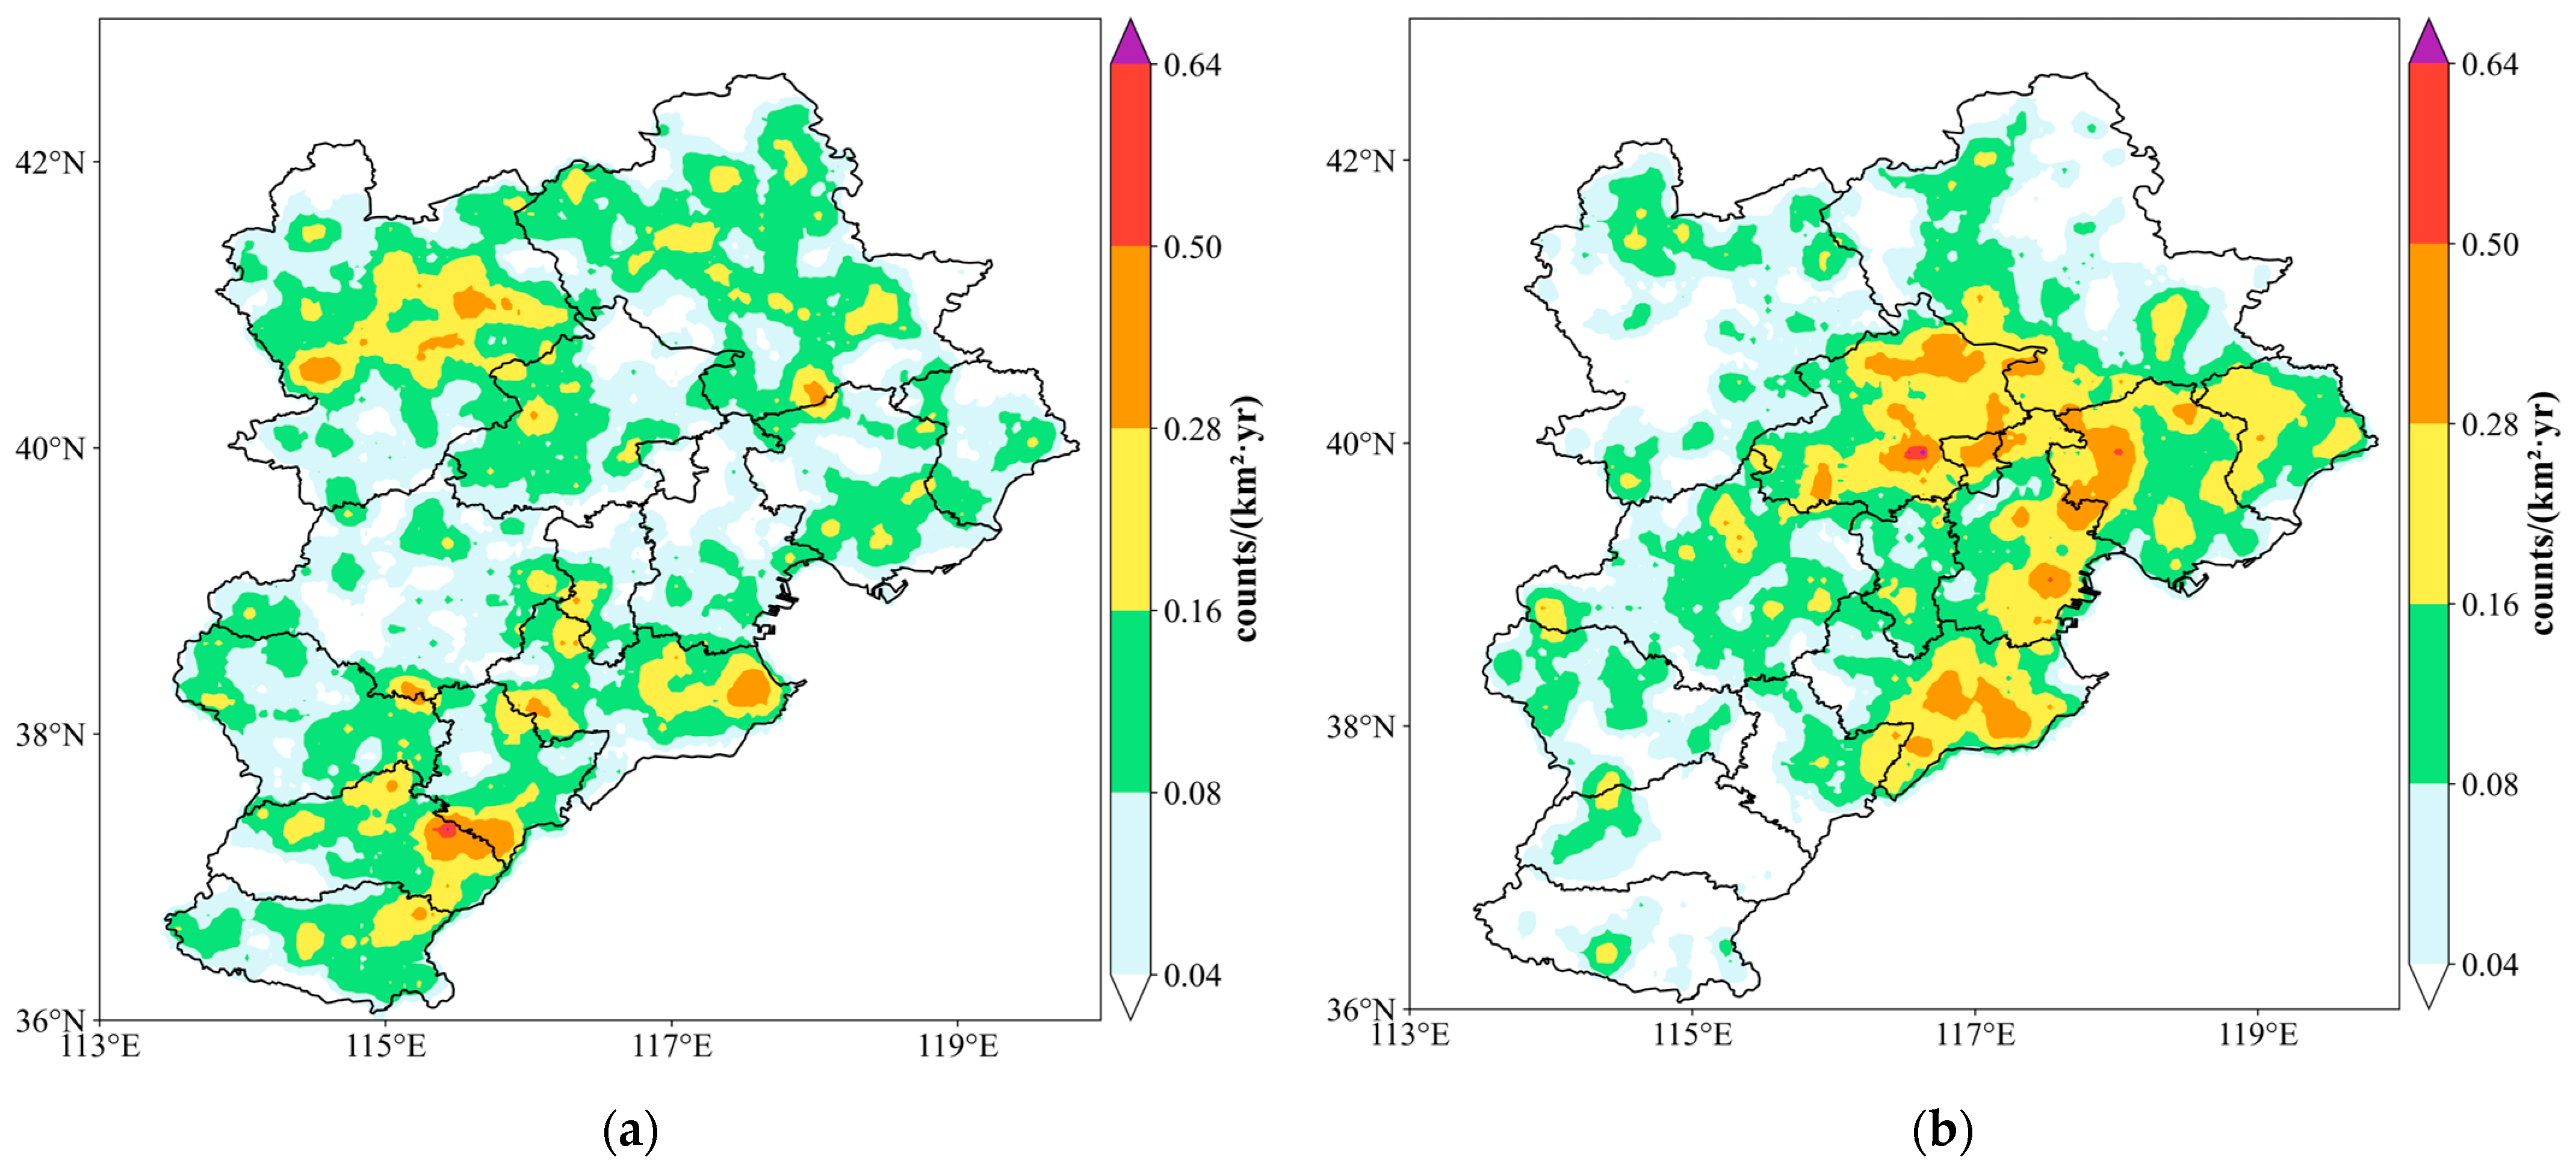
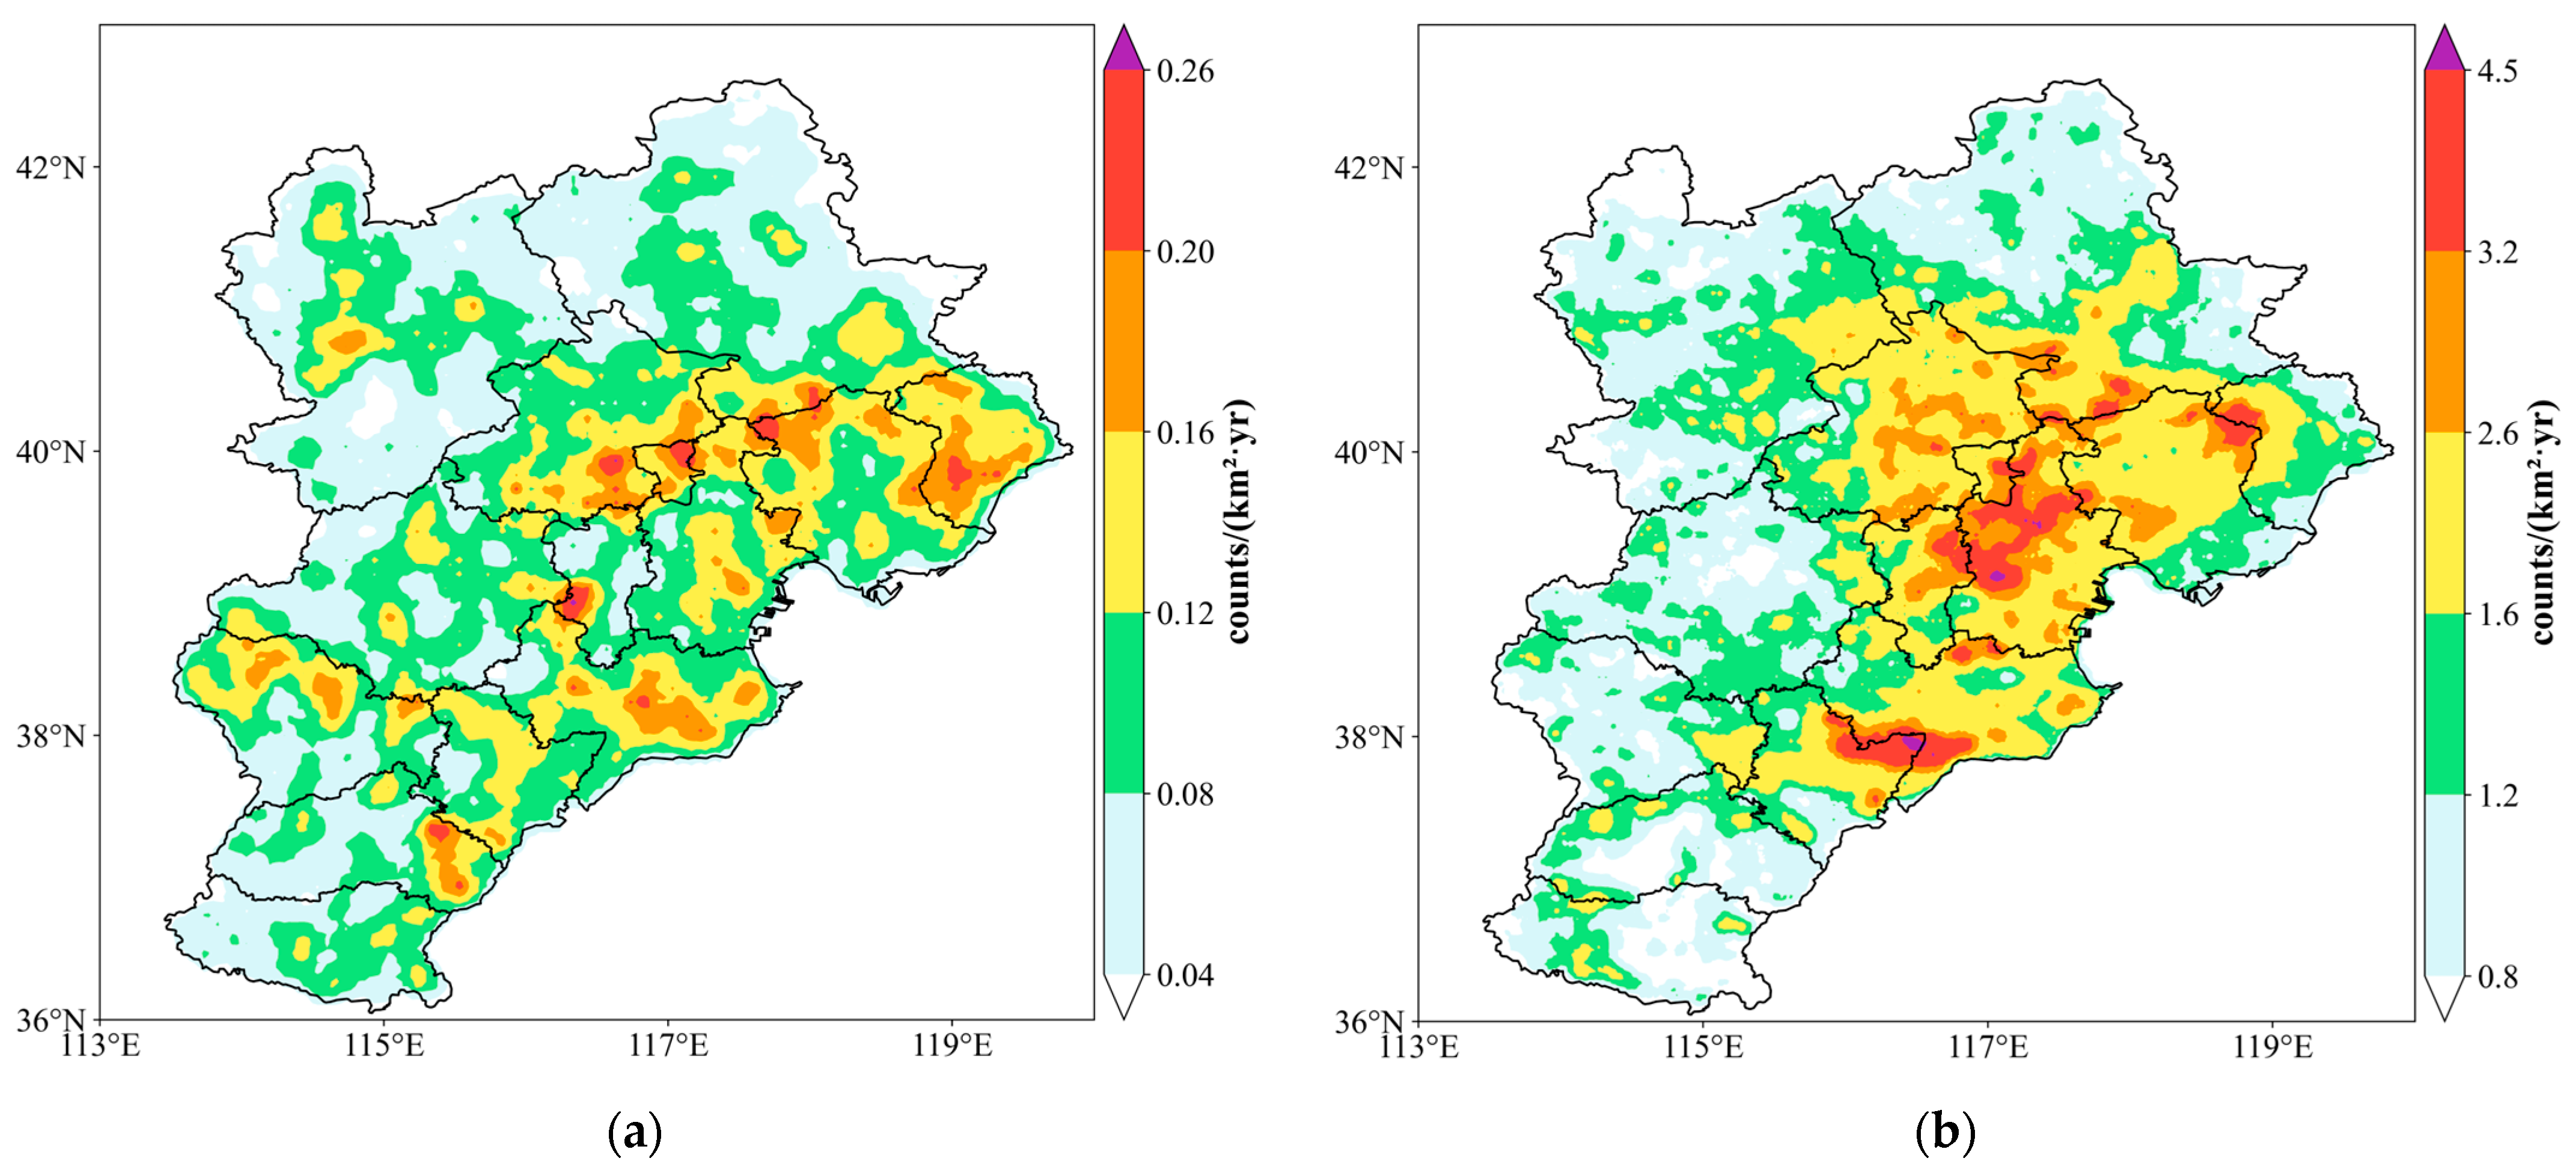
The multi-year (2020–2023) average lightning density distributions derived from FY-4A LMI and ADTD are presented in Figure 8a,b, respectively. The FY-4A LMI distribution (Figure 8a) shows that lightning activity was mainly located in southern Beijing, southern Qinhuangdao, Beisanxian, northwestern Tangshan, central Cangzhou, eastern Xingtai, and western Langfang. In comparison, the ADTD distribution (Figure 8b) indicates a primary concentration in western Qinhuangdao, eastern Tangshan, southern Chengde, central and eastern Beijing, northern and western Tianjin, eastern Langfang, southern Cangzhou, and northern Hengshui. When integrated with the topographic map of the BTH region (Figure 1), it is evident that both datasets show lightning occurring predominantly in the areas south of the Yanshan Mountains and east of the Taihang Mountains.
From the above analysis, it can be concluded that the lightning density distributions derived from the FY-4A LMI and ADTD datasets exhibit significant interannual differences across the BTH region during 2020–2023, whereas the average distribution pattern is dominated by topographic and meteorological conditions.
(1)
Interannual Differences in Spatial Distribution with Dynamic Variations of High-Density Area Locations by Year
The high-density areas of FY-4A LMI lightning density show prominent interannual migration characteristics: In 2020, they concentrated in eastern Xingtai, with secondary high-density areas covering most parts of Zhangjiakou, eastern and western Cangzhou, as well as the border zone between Hengshui and Xingtai. In 2021, the high-density areas shifted to southern Beijing, and the secondary high-density areas expanded to most regions of Beijing, western Tangshan, eastern Tianjin, and eastern and southern Cangzhou. In 2022, the high-density areas split into two separate regions: the Langfang-Baoding border area and northern Shijiazhuang, with secondary high-density areas encompassing multiple regions in the central and southern parts of the BTH region. In 2023, the high-density areas contracted into a small, localized core zone in northwestern Shijiazhuang, while the secondary high-density areas included the extensive surrounding areas to its northwest, southern Qinhuangdao, and central Tianjin.
The high-density areas of ADTD also exhibited distinct annual dynamic variations: In 2020, the high-density areas were concentrated in southwestern Hengshui adjacent to Xingtai and the border zone between eastern Shijiazhuang and Xingtai, with secondary high-density areas covering western Tangshan, central and western Tianjin, and other regions. In 2021, no obvious single-point high-density areas were observed; lightning activity was mainly concentrated in central-southern Beijing, northern and western Tianjin, and other regions in the central-eastern part of the BTH region. In 2022, the high-density areas formed a contiguous belt spanning eastern Beijing, Beisanxian, and northern Tianjin, while secondary high-density areas extended to multiple regions such as the junction of Qinhuangdao, Tangshan, and Chengde. In 2023, the lightning distribution became further scattered, primarily covering northern Beijing, southern Chengde, central and western Tianjin, and other regions.
Both datasets indicate that the lightning high-density areas were not fixed in the same locations across different years, demonstrating a prominent feature of interannual dynamic migration.
(2)
Average Distribution Displays Regional Commonalities, with High-Density Areas of Both Datasets Shaped by Topography
The 2020–2023 average lightning density distribution reveals clear regional commonalities between the concentrated areas derived from the FY-4A LMI and ADTD datasets. The FY-4A LMI mean lightning density is mainly concentrated in southern Beijing, southern Qinhuangdao, Beisanxian, northwestern Tangshan, central Cangzhou, eastern Xingtai, and western Langfang. In contrast, the ADTD mean lightning density is distributed across western Qinhuangdao, eastern Tangshan, southern Chengde, central-eastern Beijing, northern and western Tianjin, eastern Langfang, southern Cangzhou, and northern Hengshui.
Integrated with the topographic map of the BTH region, it is evident that the concentrated lightning distribution areas of both datasets fall within the macro-topographic scope of “south of the Yanshan Mountains and east of the Taihang Mountains”. This region is dominated by plains and low hills, featuring open and gentle terrain that stands in sharp contrast to the topographic boundaries formed by the Yanshan Mountains to the north and the Taihang Mountains to the west. The average density zones of both datasets are consistent with this topographic pattern, confirming the fundamental constraining effect of topography on the long-term average distribution of lightning.
(3)
Distribution Differences Stem from Synergistic Effects of Topographic Uplift and Moisture Transport
The interannual distribution differences and regional average commonalities between FY-4A LMI and ADTD primarily result from the synergistic driving effects of topographic uplift and moisture transport. From the perspective of dynamic conditions, the blocking effect of the Yanshan and Taihang Mountains readily induces airflow convergence and uplift, providing stable dynamic forcing for lightning generation. Regarding moisture conditions, inland moisture carried by southerly airflows converges with marine moisture transported from the Bohai Sea in the plains south of the Yanshan Mountains and east of the Taihang Mountains. This convergence forms a high-moisture environment characterized by high relative humidity and abundant precipitable water. Sufficient moisture supply not only serves as the material basis for the formation of convective clouds but also enhances the instability of the atmospheric boundary layer. These are key factors that promote the development of strong convection and thus trigger lightning activity. Specifically, the convergence of dual moisture sources maintains high atmospheric moisture content. This high moisture content strengthens the latent heat release during cloud formation, further intensifying upward airflow and creating favorable conditions for charge separation, which is the core process of lightning generation. Therefore, the adequate moisture availability in the study area is a prerequisite for frequent lightning activity. Its coupling with dynamic forcing from orographic convergence jointly determines the intensity and frequency of lightning.
In the short term, annual anomalies in atmospheric circulation cause variations in the synergistic effects of moisture transport pathways, intensity, and topographic uplift, leading to interannual migration of lightning high-density areas. From a long-term perspective, the stable patterns of topographic distribution and moisture transport determine the regional commonalities in average lightning distribution, causing both datasets to focus on the favorable topographic area south of the Yanshan Mountains and east of the Taihang Mountains. This synergistic driving mechanism not only explains the distribution differences between the two datasets but also confirms their effective detection capabilities for lightning activity under different topographic and meteorological backgrounds.

4. Discussion

4.1. Multi-Factor Regulatory Mechanisms of Discrepancies Between Satellite-Based and Ground-Based Lightning Data

A comparative analysis of FY-4A LMI and ADTD data in the BTH region from 2020 to 2023 indicates that the significant discrepancies in total quantity, temporal and spatial distribution between the two types of data are essentially the result of the coupled regulation of climatic background, topographic forcing, and detection technical characteristics.
(1)
Discrepancies in total quantity
In terms of discrepancies in total quantity, the annual average ratio of FY-4A LMI to ADTD is only 0.0636. Welch’s independent samples t-test results confirm that this discrepancy is highly statistically significant (t = −5.1758, p = 0.000053 < 0.01), and this systematic quantitative gap is caused by the characteristics of detection technologies. FY-4A LMI is based on an optical sensing mechanism, which has inherent limitations in capturing intracloud flashes and weak discharge events; additionally, its spatial resolution of 7.8 km [9,10,11] at the subsatellite point makes it difficult to identify small-scale intense local discharge events. In contrast, ADTD, as a ground-based electromagnetic detection system, is highly sensitive to instantaneous intense electromagnetic signals from cloud-to-ground flashes and can accurately capture dense discharge events during local severe convection processes.
The differences in stability between the two datasets (FY-4A LMI: CV = 5.46%, ADTD: CV = 28.01%) further confirm the impact of technical characteristics. Satellite optical detection is less susceptible to atmospheric interference and has strong observational continuity, making it more suitable for the long-term climatic characterization of regional lightning activity. In contrast, ground-based electromagnetic detection is prone to interference from factors such as underlying surface roughness and meteorological conditions (e.g., precipitation, cloud thickness), resulting in more significant fluctuations, but it can effectively capture the eruptive characteristics of instantaneous severe convection.
(2)
Discrepancies in temporal distribution
In terms of discrepancies in temporal distribution, the consistency in intermonthly evolution (both exhibiting a unimodal pattern with the peak in July), as evidenced by the monthly variation characteristics of normalized lightning counts (Section 3.2, Figure 2 and Figure 3), highlights the dominant role of the large-scale climatic background. During midsummer in the BTH region, influenced by the East Asian Summer Monsoon (EASM), abundant warm and moist airflows and vigorous thermal convection form the climatic core period of regional severe convection. The stability of this climatic forcing results in a highly consistent seasonal evolution framework for the two datasets. Pearson correlation analysis revealed a moderately strong and highly significant positive correlation in monthly lightning counts between the two datasets (r = 0.7354, p = 0.000220 < 0.01), which statistically validated that the consistent intermonthly variation trend was driven by the stable large-scale climatic background rather than accidental observational consistency. The differentiated decline performance in August (ADTD shows a milder decrease and surpasses LMI) can be attributed to the higher sensitivity of ground-based electromagnetic detection to residual convective activities in late summer, while satellite optical detection is more affected by the decreasing cloud optical thickness, leading to a more significant drop in observed counts.
In contrast, the discrepancies in diurnal distribution (FY-4A LMI showing a bimodal pattern vs. ADTD a unimodel pattern) are mainly caused by differences in the environmental adaptability of detection technologies: FY-4A LMI is subject to optical interference from solar radiation during the daytime, leading to missed detection of lightning from afternoon severe convection; thus, lightning activity accounts for a higher proportion during nighttime to early morning (18:00 to 05:00 next day), forming a bimodal characteristic with peaks at 19:00 (evening convection) and 04:00 (early morning weak convection). ADTD, based on the principle of electromagnetic pulse detection, maintains stable detection efficiency throughout the day and is more likely to capture the peak of afternoon thermal convection (16:00–17:00), presenting a single-peak distribution.
(3)
Characteristics of spatial distribution
In terms of spatial distribution, discrepancies in the high-density areas of the two datasets reflect the synergistic effects of topography, water vapor, and underlying surface characteristics. The high-density areas of FY-4A LMI are located in the plains south of the Yanshan Mountains and east of the Taihang Mountains; this region is driven by the superposition of warm and moist airflow lifting in the piedmont area and thermal convection over the plains, resulting in relatively shallow clouds in convective systems and weak optical occlusion, which are more consistent with the detection preferences of FY-4A LMI. In contrast, the high-density areas of ADTD are concentrated in the piedmont of the Yanshan Mountains (intense topographic lifting) and the Bohai Sea water vapor channel (synergistic effects of water vapor transport and urban heat island effect); these regions are prone to the formation of severe convective thunderstorms with high instantaneous discharge intensity, which matches the characteristic of ADTD being highly sensitive to intense electromagnetic signals. Interannual dynamic shifts in high-density areas reflect the modulating effects of short-term meteorological anomalies (e.g., EASM intensity, peripheral impacts of typhoons), while the average distribution pattern highlights the long-term dominance of topography and water vapor transport.
(4)
Fundamental causes of dataset discrepancies
The essential causes of the discrepancies between the two datasets can be attributed to the inherent characteristic differences of the two observation systems, which are mainly derived from the differences in identification methodologies and instrument technical characteristics.
  (1)
The intrinsic differences in identification methodologies are the core inducements
The FY-4A LMI realizes lightning identification by capturing the instantaneous optical signals of lightning discharges. This optical detection principle enables it to effectively capture lightning optical signals, but its detection capability for discharge events with weak radiation intensity is limited [21]. In contrast, the ADTD identifies lightning based on the characteristic electromagnetic pulse signals generated by lightning return strokes. Affected by the rapid attenuation of electromagnetic waves in the atmosphere, its detection capability for intracloud lightning is weak. Such differences in detection targets directly lead to systematic quantitative deviations between the two datasets and are also the key reason for the spatial differences in their high-density distribution areas.
  (2)
Differences in instrument technical characteristics further amplify the deviations
In terms of spatial resolution, the FY-4A LMI has a subsatellite point resolution of 7.8 km [9,10,11], making it difficult to identify small-scale local convective events. In contrast, the ADTD can achieve a spatial resolution of less than 300 m for lightning [24], which allows it to accurately capture discrete intense discharge events. In addition, the LMI is sensitive to light intensity, resulting in significant diurnal differences in detection efficiency (see Section 3.3 for details).

4.2. Complementarity and Application Value of Satellite-Based and Ground-Based Data

The discrepancies between FY-4A LMI and ADTD essentially constitute distinct complementary advantages. With stable observational characteristics reflected by a low coefficient of variation (CV = 5.46%), FY-4A LMI can accurately characterize the long-term climatic evolution trend of regional lightning activity, providing reliable data support for lightning climatology research and long-term disaster risk assessment in the BTH region. In contrast, ADTD, with its high detection density and capability to capture instantaneous intense lightning activity, plays a core role in short-term early warning of severe convective weather and emergency response to local disasters. This complementarity holds significant implications for multi-scenario applications: (1) In regional climatic evolution research, the long-term stability of FY-4A LMI can be used to eliminate interference from short-term fluctuations, clarifying the long-term regulatory effects of topography and climate systems on lightning activity. (2) In short-term early warning operations, the afternoon peak characteristics of ADTD can be combined with the nighttime peak advantages of FY-4A LMI to achieve full-time coverage monitoring of lightning activity throughout the day. (3) In spatial risk assessment, the overlay of FY-4A LMI’s high-density areas over plains and ADTD’s high-density areas in piedmont zones and water vapor channels enables precise identification of high-risk areas where topography, thermal dynamics, and water vapor factors are coupled, enhancing the targeting of disaster defense measures.
Furthermore, the consistency of the two datasets in intermonthly evolution and core drivers (topography, climate) mutually validates observational data reliability and underpins satellite-ground lightning data fusion. By integrating the macro-stability of FY-4A LMI data with the high-resolution local detection capability of ADTD data, a multi-dimensional lightning monitoring system covering the temporal, spatial, and intensity dimensions can be established. This system effectively compensates for the inherent limitations of single-source observational data in terms of coverage range, spatiotemporal resolution, and detection accuracy, thereby providing a novel technical approach for multi-scenario lightning disaster prevention and early warning in the BTH region. Specifically, it can not only support early warning of lightning-induced trip-outs for power grid transmission lines but also provide real-time data support for the early identification of lightning-caused wildfires and the prediction of fire spread trends in the Yanshan and Taihang Mountains as well as the coastal wetlands of the Bohai Sea. Meanwhile, it can assist in the lightning protection engineering design and risk assessment of key areas such as urban high-rise buildings and petrochemical industrial parks, thus comprehensively enhancing the overall capability of regional lightning disaster defense.

5. Conclusions

This study systematically compares FY-4A LMI satellite-borne and ADTD ground-based lightning monitoring data over the BTH region from 2020 to 2023, exploring the characteristic discrepancies, formation mechanisms, and application complementarity of the two datasets. The core conclusions and research contributions are summarized as follows:
(1)
Systematic discrepancies between the two datasets are clarified
There exists a significant quantitative gap between FY-4A LMI and ADTD, with an annual mean data ratio of 0.0636. Welch’s independent samples t-test results further confirmed that this discrepancy was highly statistically significant (t = −5.1758, p = 0.000053 < 0.01). The FY-4A LMI exhibits superior observational stability (coefficient of variation, CV = 5.46%) due to its optical detection mechanism being less susceptible to atmospheric interference. In contrast, the ADTD demonstrates advantages in capturing instantaneous intense lightning events, with its observational data showing relatively high variability (CV = 28.01%), owing to its high sensitivity to electromagnetic signals. This discrepancy originates from the inherent differences in detection principles and environmental adaptability of the two technologies.
(2)
Key drivers of spatiotemporal discrepancy are identified
The intermonthly evolution of both datasets shows a consistent unimodal pattern (peaking in July), which is dominated by the large-scale climatic background (EASM-induced warm and moist airflows and thermal convection). Pearson correlation analysis verified a moderately strong and highly significant positive correlation in monthly lightning counts between the two datasets (r = 0.7354, p = 0.000220 < 0.01), statistically validating that the consistent intermonthly variation trend was driven by stable climatic forcing rather than accidental consistency. However, their diurnal distributions differ significantly (bimodal pattern for LMI vs. unimodal pattern for ADTD) due to the optical interference of solar radiation on LMI and the stable electromagnetic detection of ADTD. Spatially, the high-density lightning areas of LMI are concentrated in the southern Yanshan-eastern Taihang plains (favorable for shallow convection detection), while those of ADTD are in the Yanshan piedmont and Bohai Sea vapor channel (prone to intense convective storms), reflecting the synergistic regulation of topography, water vapor, and underlying surface characteristics.
(3)
Complementarity and application potential are highlighted
FY-4A LMI is superior in characterizing long-term regional lightning climatic trends, providing support for climatological research and long-term disaster risk assessment. ADTD excels in short-term severe convection early warning by capturing instantaneous intense lightning. The combination of the two datasets realizes full-temporal (day-night coverage) and full-spatial (plain-piedmont-vapor channel) lightning monitoring, which can be applied to power grid trip-out early warning, wildfire prediction, and lightning protection engineering design in the BTH region.
(4)
A three-factor coupled core regulatory mechanism and technical implications are proposed
The spatiotemporal characteristics of lightning activity in the BTH region are jointly regulated by three factors: climatic background (long-term constraint), topographic forcing (spatial modulation), and detection technology characteristics (inherent discrepancy). This study confirms that satellite-ground data fusion is a key direction to improve regional lightning monitoring accuracy, which can provide a technical reference for high-resolution lightning disaster defense in similar urban agglomerations.
(5)
Limitations and future directions are supplemented
This study focuses on the 2020–2023 period and the BTH region; future research can expand the time scale and study area to verify the universality of the conclusions. Additionally, the quantitative fusion model of satellite and ground-based lightning data can be further constructed to enhance the application efficiency of multi-source data in disaster prevention and early warning.

Author Contributions

Conceptualization, Y.W., J.W. and S.Y.; methodology, Y.W., J.W. and S.Y.; software, Y.W., J.W. and J.S.; validation, Y.W., J.W. and F.X.; formal analysis, Y.W. and Q.M.; investigation, Y.W. and X.Z.; resources, Q.M.; data curation, Y.W. and X.M.; writing—original draft preparation, Y.W., J.W. and S.Y.; writing—review and editing, J.S., X.Z. and Q.M.; visualization, Y.W. and Y.H.; supervision, Q.M.; project administration, J.S.; funding acquisition, Q.M. All authors have read and agreed to the published version of the manuscript.

Funding

This research was funded by National Key R&D Program of China, grant number China (2023YFD2202001).

Data Availability Statement

The data presented in this study are available on request from the corresponding authors. The data are not publicly available due to privacy.

Acknowledgments

We would like to thank all colleagues of the Institute of Electrical Engineering, Chinese Academy of Sciences for their support. We also appreciate the valuable revision suggestions provided by the reviewers, which have significantly improved the quality of this manuscript.

Conflicts of Interest

The authors declare no conflicts of interest.

References

  1. Huo, H.; Wang, D.; Chen, H.; Zhao, C.; Cheng, Q. Considering the Methods of Lightning Protection and Early Warning for Power Transmission Lines Based on Lightning Data Analysis. IEEE Access 2024, 12, 54168–54181. [Google Scholar] [CrossRef] [Scilit]
  2. Jin, C.; Shu, Y.; Han, Z.; Chen, Q.; He, J.; Wang, S. Lightning Disaster Risk Zoning in Jiangsu Province of China Based on the Analytic Hierarchy Process and Entropy Weight Method. Front. Environ. Sci. 2022, 10, 943000. [Google Scholar] [CrossRef] [Scilit]
  3. Cai, Z.; Luo, S.; Zhao, H.; Zhou, Y.; Bashir, B.; Alsafadi, K. A study of lightning disaster assessment and zoning on the Qinghai Plateau. All Earth 2024, 37, 2447657. [Google Scholar] [CrossRef] [Scilit]
  4. Zhang, Y.; Han, J.; Yuan, C.; Yang, S.; Sun, X. A Rasterized Lightning Disaster Risk Method for Imbalanced Sets Using Neural Network. Comput. Mater. Contin. 2020, 66, 563–574. [Google Scholar] [CrossRef] [Scilit]
  5. Chen, Z.; Qie, X.; Sun, J.; Xiao, X.; Zhang, Y.; Cao, D.; Yang, J. Evaluation of Fengyun-4A Lightning Mapping Imager (LMI) Performance during Multiple Convective Episodes over Beijing. Remote Sens. 2021, 13, 1746. [Google Scholar] [CrossRef] [Scilit]
  6. Sun, H.; Yang, J.; Zhang, Q.; Song, L.; Gao, H.; Jing, X.; Lin, G.; Yang, K. Effects of Day/Night Factor on the Detection Performance of FY4A Lightning Mapping Imager in Hainan, China. Remote Sens. 2021, 13, 2200. [Google Scholar] [CrossRef] [Scilit]
  7. Chan, Y.W.; So, C.K. The applications of Feng Yun 4 A satellite products for weather monitoring over the asian regions. In Proceedings of the American Meteorological Society Meeting Abstracts, Phoenix, AZ, USA, 6–10 January 2019; p. TJ20-3. [Google Scholar]
  8. Hui, W.; Zhang, W.; Lyu, W.; Li, P. Preliminary Observations from the China Fengyun-4A Lightning Mapping Imager and Its Optical Radiation Characteristics. Remote Sens. 2020, 12, 2622. [Google Scholar] [CrossRef] [Scilit]
  9. Yang, J.; Zhang, Z.; Wei, C.; Lu, F.; Guo, Q. Introducing the New Generation of Chinese Geostationary Weather Satellites, Fengyun-4. Bull. Am. Meteorol. Soc. 2017, 98, 1637–1658. [Google Scholar] [CrossRef] [Scilit]
  10. Rui-xiao, L.I.U.; Qi-feng, L.U.; Min, C.; Yong, Z.; Wen, H.U.I.; Xiao-qing, L.I. Quality Assessment of FY-4A Lightning Data in Inland China. J. Trop. Meteorol. 2020, 26, 286–299. [Google Scholar] [CrossRef] [Scilit]
  11. Cao, D.; Huang, F.; Qie, X. Development and evaluation of detection algorithm for FY-4 Geostationary Lightning Imager (GLI) measurement. In Proceedings of the XV International Conference on Atmospheric Electricity, Norman, OK, USA, 15–20 June 2014. [Google Scholar]
  12. Cao, D.; Lu, F.; Zhang, X.; Yang, J. Lightning Activity Observed by the FengYun-4A Lightning Mapping Imager. Remote Sens. 2021, 13, 3013. [Google Scholar] [CrossRef] [Scilit]
  13. Ni, X.; Hui, W.; Zhang, Q.; Huang, F.; Liu, C. Comparison of Lightning Detection Between the FY-4A Lightning Mapping Imager and the ISS Lightning Imaging Sensor. Earth Space Sci. 2021, 8, e2020EA001099. [Google Scholar] [CrossRef] [Scilit]
  14. Kang, N.; Liu, X.; Liu, C.; Li, Y.; Yu, H.; Qiao, J. Analysis of Lightning Characteristics in Severe Convective Weather Using Integrated Satellite–Ground Lightning Data. Sens. Mater. 2024, 36, 4297. [Google Scholar] [CrossRef] [Scilit]
  15. Zhang, W.; Hui, W.; Lyu, W.; Cao, D.; Li, P.; Zheng, D.; Fang, X.; Zhang, Y. FY-4A LMI Observed Lightning Activity in Super Typhoon Mangkhut (2018) in Comparison with WWLLN Data. J. Meteorol. Res. 2020, 34, 336–352. [Google Scholar] [CrossRef] [Scilit]
  16. Zhi, S.-l.; Zhu, J.; Liu, Y.; Mao, M.-n. Characteristics of Lightning Activity in Southeast China and its Relation to the Atmospheric Background. J. Trop. Meteorol. 2024, 30, 76–88. [Google Scholar] [CrossRef] [Scilit]
  17. Liu, Y.; Wang, H.; Li, Z.; Wang, Z. A verification of the lightning detection data from FY-4A LMI as compared with ADTD-2. Atmos. Res. 2021, 248, 105163. [Google Scholar] [CrossRef] [Scilit]
  18. Yan, L.; Zheng, L.; Hongbing, W. Comparison and Analysis of Lightning Occurrence Characteristics Based on Data Obtained by Fengyun-4A Satellite and ADTD Three-Dimensional Lightning Monitoring Network in Jiangsu Province. In Proceedings of the 2019 11th Asia-Pacific International Conference on Lightning (APL), Hong Kong, China, 12–14 June 2019; pp. 1–4. [Google Scholar]
  19. Li, P.; Zhai, G.; Pang, W.; Hui, W.; Zhang, W.; Chen, J.; Zhang, L. Preliminary Research on a Comparison and Evaluation of FY-4A LMI and ADTD Data through a Moving Amplification Matching Algorithm. Remote Sens. 2020, 13, 11. [Google Scholar] [CrossRef] [Scilit]
  20. Liu, Y.; Jiang, Y.; Gao, Q.; Shi, Z.; Jiang, Z.; Hu, J. Characteristic analysis of lightning activities on the Yungui Plateau using ground-based remote sensing. Front. Environ. Sci. 2022, 10, 949271. [Google Scholar] [CrossRef] [Scilit]
  21. Cao, D. The development of product algorithm of the Fengyun-4 geostationary lightning mapping imager. Adv. Meteorol. Sci. Technol. 2016, 6, 94–98. [Google Scholar]
  22. Meng, X.; Wang, J.; Ma, Q.; Yuan, S.; Song, J.; Zhou, X.; Xiao, F.; Wang, Y. A dataset of lightning in China Based on VLF/LF Lightning Location Monitoring System. China Sci. Data 2022, 7, A156. [Google Scholar] [CrossRef] [Scilit]
  23. Wang, J.; Huang, Q.; Ma, Q.; Chang, S.; He, J.; Wang, H.; Zhou, X.; Xiao, F.; Gao, C. Classification of VLF/LF Lightning Signals Using Sensors and Deep Learning Methods. Sensors 2020, 20, 1030. [Google Scholar] [CrossRef] [Scilit]
  24. Yang, Q.; Wang, J.; Zhou, X.; Yuan, S.; Meng, X.; Xiao, F.; Jin, H.; Xue, W.; Ma, Q. Preliminary Evaluation of Hai-Nan Lightning Detection Network (HNLDN). Radio Sci. 2021, 56, 1–18. [Google Scholar] [CrossRef] [Scilit]
  25. Adiri, Z.; Lhissou, R.; Maacha, L.; Jilali, A.; Talbi, E.H.; Jellouli, A.; Chakouri, M. Comparison of ASTER GDEM3, SRTM3, NASADEM, TanDEM-X90, AW3D30, and ALOS PALSAR data with TanDEM-X12: A case study of Tagragra of Akka inlier, Moroccan Anti-Atlas. Arab. J. Geosci. 2022, 15, 1654. [Google Scholar] [CrossRef] [Scilit]
  26. Tobler, W.R. A computer movie simulating urban growth in the Detroit region. Econ. Geogr. 1970, 46, 234–240. [Google Scholar] [CrossRef] [Scilit]
  27. Shepard, D. A two-dimensional interpolation function for irregularly-spaced data. In Proceedings of the 1968 23rd ACM National Conference, New York, NY, USA, 27–29 August 1968; pp. 517–524. [Google Scholar]
  28. Zhang, J.; Duan, P. Influence of terrain factors on optimal order distance of Inverse Distance Weighted (IDW). Sci. Geogr. Sin. 2023, 43, 1281–1290. [Google Scholar]
Figure 1. Administrative Division and Topographic Distribution Map of the BTH Region.
Atmosphere 17 00096 g001
Figure 2. Monthly lightning count distribution in the BTH (2020–2023). (a) FY-4A LMI; (b) ADTD.
Atmosphere 17 00096 g002
Figure 3. Monthly average normalized lightning count distribution in BTH region (2020–2023) (normalized by annual peak monthly count).
Atmosphere 17 00096 g003
Figure 4. Diurnal distributions of lightning detected by FY-4A LMI and ADTD. (a) 2020; (b) 2021; (c) 2022; (d) 2023.
Atmosphere 17 00096 g004
Figure 5. 2020–2023 Average diurnal distribution of lightning. (a) FY-4A LMI; (b) ADTD.
Atmosphere 17 00096 g005
Figure 6. FY-4A LMI lightning density distribution (2020–2023). (a) 2020; (b) 2021; (c) 2022; (d) 2023.
Atmosphere 17 00096 g006aAtmosphere 17 00096 g006b
Figure 7. ADTD lightning density distribution (2020–2023). (a) 2020; (b) 2021; (c) 2022; (d) 2023.
Atmosphere 17 00096 g007
Figure 8. Density map. (a) FY-4A LMI annual average lightning density distribution; (b) ADTD annual average lightning density distribution.
Atmosphere 17 00096 g008
Table 1. Total Lightning Count Statistics of FY-4A LMI and ADTD in BTH Region (2020–2023, April-August).
YearFY-4A LMI (Counts/Year)ADTD (Counts/Year)
202022,294281,114
202123,922468,125
202221,437258,485
202321,267391,374
Total88,9201,399,098
Average22,230349,774.5
Disclaimer/Publisher’s Note: The statements, opinions and data contained in all publications are solely those of the individual author(s) and contributor(s) and not of MDPI and/or the editor(s). MDPI and/or the editor(s) disclaim responsibility for any injury to people or property resulting from any ideas, methods, instructions or products referred to in the content.