Abstract
The increasing frequency of extreme weather events presents serious challenges to both regional and global economies. This study focuses on quantifying the economic losses caused by three major types of extreme climate events (heatwaves, droughts, and heavy rain) in Hainan Island from 2001 to 2020. Moreover, a comprehensive dataset of related economic losses was developed. To support the analysis, we constructed an Extreme Climate Economic Loss Model (ECELM). Drought and heavy rain losses were estimated using a loss intensity index based on precipitation and typhoon landfall wind speeds. Heatwave-related losses were assessed through a threshold-based optimization approach. The results show that both heatwaves and heavy rain have exhibited increasing impacts from 2001 to 2020. Although heatwaves were the most frequent extreme event in more than half of the years, heavy rain caused the highest cumulative losses, reaching CNY 75 billion. Spatial analysis indicates that the southeastern coastal areas were the most severely affected. These findings provide valuable quantitative evidence for designing targeted regional climate adaptation strategies.
Keywords:
extreme weather; economic losses; Hainan Island; climate adaptation; heatwave; drought; heavy rain 1. Introduction
With the intensification of climate change, the frequency and intensity of extreme weather events have increased significantly, causing severe and widespread impacts on human society [1,2,3]. Especially in the economic losses, USD 143 billion of the annual costs from extreme events can be attributed to climate change [4]. These impacts have led to steadily rising economic losses across the globe [5,6,7]. According to global statistics, over 12,000 extreme weather events occurred between 1970 and 2019, resulting in economic losses exceeding USD 4.3 trillion [8]. Moreover, since the 1970s, disaster losses caused by extreme weather events have increased sevenfold [4], clearly demonstrating the close relationship between climate change and economic damages. The Sixth Assessment Report of the IPCC indicates that climate change is advancing more rapidly than previously anticipated, with various types of extreme weather events expected to become more frequent and intense across multiple regions worldwide [9]. Multiple and sequential extreme events, such as heatwaves, droughts, and heavy rain, are increasingly emerging, exerting multifaceted pressures on both ecosystems and human society [10,11,12,13]. To this end, assessing the evolving trends of major extreme weather events and quantifying their socio-economic impacts has become one of the central issues in current climate change research [14].
In recent years, high-temperature heatwave events have become more intense, prolonged, and widespread in their impact [15,16]. Prolonged exposure to extremely high-temperature environments significantly reduces labor productivity [17,18]. Studies have found that when temperatures exceed 29.4 °C (85 °F), working hours exhibit a monotonically decreasing trend [19]. This reduction in working hours indirectly undermines workers’ production capacity, thereby adversely affecting economic activities, particularly in tropical and subtropical regions [20]. For instance, studies estimate that for every 1 °C increase in temperature, the total economic impact on China will increase by 0.28–0.61% of GDP, while the economic impact of declining labor productivity will reach 1.15–2.67% of GDP by 2100 [21]. Similar projections in the United States also confirm that extreme heatwaves will exacerbate potential economic losses in the labor force [22]. During extreme events, drought and heavy rain are the top two causes of yield loss in U.S. corn production, with total losses reaching $18 billion and $10 billion, respectively, from 1989 to 2016 [23]. Globally, drought events are posing growing threats to food security by reducing crop yields and suppressing agricultural output [24,25,26]. For instance, economic losses in Germany’s crop production due to drought during the summers of 2018 and 2019 were estimated at 7.8 billion euros [27]. Similarly, DW [28] noted that summer droughts adversely impacted agricultural economies across most African countries. Heavy rain can cause maize yield losses comparable to those caused by extreme drought [23]. Moreover, extreme heavy rain events have often triggered flood disasters that have damaged farmlands and livestock, leading to irreversible economic losses in agriculture [29]. Climate change has significantly increased the frequency, intensity, duration, and scope of heavy rain events [30]. For instance, in 2019, extreme rainfall events caused more than $75 million in damages in Iran [29].
Previous studies have predominantly focused on quantitatively assessing economic losses under various types of extreme weather events in typical mainland urban agglomerations. However, interregional disparities remain insufficiently explored, particularly in tropical island regions, which have been largely understudied. As areas that are among the most significantly affected by global warming, tropical islands possess distinct economic characteristics and high ecological vulnerability [31]. Their industrial structures are highly dependent on natural climatic conditions, making them more susceptible to extreme weather events [32]. Despite this, there is currently a lack of systematic assessments of the economic impacts of prolonged heatwaves, consecutive heavy rain, and island-specific droughts driven by water scarcity in these regions [33,34,35].
Tropical islands are increasingly exposed to various extreme climate events, including heat wave, droughts, and heavy rain, which lead to significant changes in both the magnitude and spatial distribution of economic losses. This underscores the urgent need to investigate the spatial patterns of such economic losses and the differential impacts of various extreme climate events. This study focuses on the economic losses caused by extreme events in tropical islands, using empirical models to quantitatively assess the effects of three major climate extremes on economic losses in Hainan Island. The materials and methods are described in Section 2, respectively. Section 3 focuses on Hainan Island, a representative tropical island in China. It presents the characteristics and loss assessments of heatwaves, droughts, and heavy rain events, followed by a comprehensive analysis and comparison of weather-related disaster losses in the region during 1961–2020. Discussions and conclusions are provided in Section 4 and Section 5, respectively.
2. Materials and Methods
2.1. Study Area
Study Area
Hainan Island (18.80–20.10° N, 108.37–111.03° E), is the largest tropical island in the country and the second largest island across China (Figure 1). The island covers an area of approximately 34,000 km2 and comprises 18 cities and counties, with a coastline stretching 1944 km. The average annual temperature is approximately 23–26 °C, and annual precipitation ranges between 1000 and 2500 mm, exhibiting typical tropical monsoon maritime climate characteristics, with hot and humid summers (28–32 °C) and warm, relatively dry winters (18–22 °C). Relative humidity is generally high, averaging 75–85%, and the island experiences moderate to strong seasonal winds, with elevated evaporation during the summer months. The exposure of Hainan Island makes it particularly vulnerable to natural disasters such as cyclones, floods, and droughts [36,37].
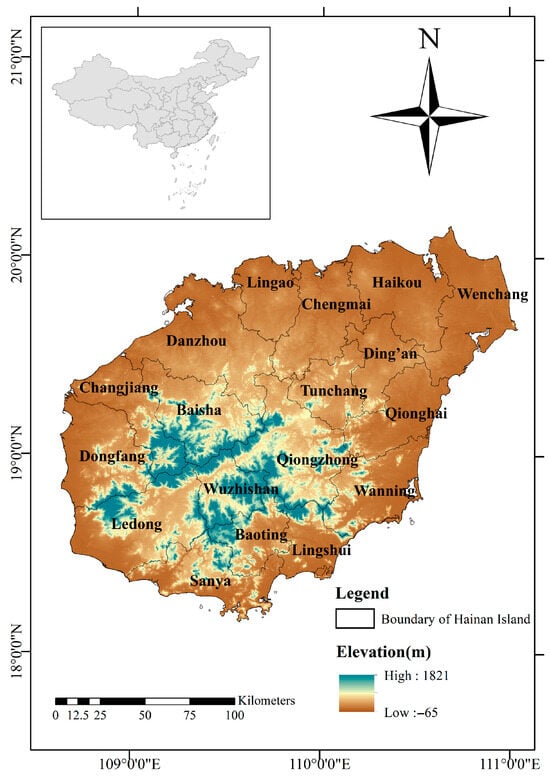
Figure 1.
Location of Hainan Island and the elevation.
Hainan Island has experienced several notable extreme events in recent decades. From January 2005 to mid-2006, the province suffered its most severe drought since 1977. The event lasted for 16 months, with some areas experiencing over 310 consecutive dry days. Nearly one million people faced water shortages, and more than 230,000 livestock suffered temporary water scarcity. Agricultural losses were extensive, and direct economic losses reached 1.83 billion RMB [38]. In the summer of 2015, persistent heat waves placed unprecedented stress on the power system. On August 18, the provincial grid reached a record peak load of 3.587 million kW, an increase of 8.2% compared with the same period the previous year [38]. In October 2008, Hainan Island was hit by widespread heavy rainfall and flooding. More than 2.6 million people were affected, and nearly 100,000 hectares of crops were damaged, including 8000 hectares completely lost. In addition, over 3000 houses were destroyed or damaged [38].
Since 2018, the Chinese government has proposed “exploring the construction of free trade ports with Chinese characteristics” and established the National Ecological Civilization Pilot Zone in Hainan. As China’s only provincial-level international tourism island, Hainan Island holds a unique economic status and ecological sensitivity [39].
Therefore, conducting assessment research on the relationship between extreme climate events and economic losses in Hainan Island carries significant practical implications and policy value.
2.2. Data Sources
2.2.1. Meteorological Data
The meteorological data comes from two sources. The first is the China Regional Surface Meteorological Elements Driving Dataset v2.0. The datasets used in this study provide quality-controlled, gridded monthly precipitation and temperature at 0.1° resolution for 1961–2020. The dataset underwent strict quality control and validation during its development and has been widely used in previous studies [40,41], indicating its reliability for long-term climate analyses. Only grids with continuous data during the study period were included to ensure temporal consistency. The datasets is provided by the National Tibetan Plateau (https://data.tpdc.ac.cn/ (accessed on 1 May 2025)) [42], with a spatial resolution of 0.1 × 0.1 degrees, covering the entire Hainan Island. It includes precipitation (daily), temperature (every 3 h), and wind speed (every 3 h) from 1951 to 2020. During usage, the data was interpolated to 1 km × 1 km resolution, dividing Hainan Island into 26,047 grid points.
Secondly, considering the impact of typhoons on torrential rainfall and the fact that Hainan Island is a typhoon-prone region, we collected historical typhoon data [41]. The landfall wind speeds of typhoons were obtained from the Hainan Island Typhoon Characteristics Dataset during 2001 to 2020, which includes information such as typhoon numbers, names, and landfall wind speeds [43].
2.2.2. Economic Loss and GDP Data
Data on economic losses caused by extreme climate events were collected from the China Meteorological Disaster Yearbook [38], the Hainan Provincial Reservoir Operation and Maintenance Bulletin, and the Flood and Drought Disaster Prevention Bulletin (https://swt.hainan.gov.cn/ (accessed on 7 May 2025)). Specifically, drought-related loss data spans from 2003 to 2020, while heavy rain-related loss data cover the period from 2001 to 2021.
To calculate heatwave-induced losses and develop downscaling factors, we collected gridded GDP data at a resolution of 1 km × 1 km for the years 2001 to 2019, ensuring alignment in projection coordinates with meteorological datasets. Due to the absence of GDP data for 2020 at grids, we gathered the total provincial GDP for 2019 and 2020 to estimate the GDP data for 2020 at grids. All losses are presented in RMB and converted to USD using the 2017 annual average exchange rate from the China Foreign Exchange Trade System (CFETS, 1 USD = 6.75 RMB).
2.2.3. Land Use Type
Considering that the primary source of drought losses stems from crop failure and total crop loss [44]. We collected land use data of Hainan Island (30 m × 30 m), which was selected from the Resource and Environment Science and Data Center of the Chinese Academy of Sciences (https://www.resdc.cn/Default.aspx (accessed on 3 May 2025)). The years are 2000, 2005, 2010, 2015, and 2020. The land use types are divided into 6 major categories: cultivated land, forest land, grassland, wetland, construction land, and unused land, as well as 18 secondary types used to distinguish agricultural land and other land uses.
2.3. Extreme Climate Economic Loss Model
To address the challenge of insufficient high-resolution data on economic losses caused by extreme climate events in typical tropical islands, we developed an extreme climate economic loss model (ECELM) based on high-resolution meteorological and gridded GDP data. Equation (1) describes the relationship between economic losses and corresponding climate indicators, as follows:
where y (%) represents the proportion of economic losses relative to regional GDP or the output value of relevant industries, and x denotes the climate indicator, such as the Standardized Precipitation Index (SPI) or cumulative rainfall, which represents the intensity of the climate event.
It should be noted that in actual observations, economic losses exhibit nonlinear characteristics as the intensity of climate events increases. Moreover, losses do not occur in the absence of extreme events, implying that when x = 0, y should also equal 0. Additionally, since y represents the proportion of economic losses, its maximum value cannot exceed 100%. Accordingly, the following two boundary conditions are established, as shown in Equations (2) and (3):
Based on Equation (1) in differential form and the boundary conditions given in Equations (2) and (3), the analytical solution describing the relationship between economic losses and corresponding climate indicators can be obtained as follows:
To assess the intensity of extreme climate events, we selected SPI to represent drought impact on crops and accumulated heavy rain exceeding 50 mm per day. Given that Hainan is a typhoon-prone region where typhoons often coincide with heavy rain, we further incorporated typhoon landfall wind speed into Equation (4) to construct the heavy rain loss model as follows:
where y is the percentage of heavy rain losses to the economy, is the cumulative rainfall amount, and is the annual cumulative amount converted from typhoon landfall wind speed.
Similarly, the drought loss model can be expressed as follows:
where y represents the percentage of drought losses relative to the economy, x is the absolute value of the cumulative sum of SPI values less than −1. When processing SPI data, considering that drought primarily affects farmland, the weights of grid-based SPI values were adjusted using land use data. When joining the model, the annual average effect and interannual decay effect were considered for SPI, the cumulative amount of rainstorm was not processed, and the cumulative amount of annual typhoon intensity was calculated as input.
2.4. Threshold Optimization
The calculation of heatwave-induced economic losses in this study primarily follows the economic assessment model-specially, the Wet Bulb Globe Temperature (WBGT)-labor productivity relationship model- proposed by Wang et al. [45] (Table 1). In this study, a heatwave is considered to occur when the temperature reaches the threshold associated with heatwave losses.

Table 1.
WBGT-labor productivity relationship model.
Based on existing research, define WBGT model as follows:
where is hourly vapor pressure and is a constant derived from an existing study [46]. represents temperature in degrees Celsius (°C).
However, due to the absent of grid-level data on industrial structure, we reconstructed new loss thresholds. Specially, we derived temperature-based economic loss thresholds for 18 county-level regions in Hainan Island by integrating county-level industrial proportions, loss percentages, and corresponding temperature records. The equations are expressed as follows:
where is the integrated temperature threshold corresponding to the overall economic threshold, represents the proportion of the i-th industry in the regional economy, and denotes the temperature loss threshold for the i-th industry under the same loss proportion. Heatwave-induced losses were calculated using the following formula:
where GDP is the gridded GDP data, and denotes the percentage of loss within each grid, is the percentage loss within the temperature threshold, is the number of days exceeding the threshold, and is the total period.
To account for the mitigating effect of air conditioning and data limitations, two assumptions were made: (1) indoor losses are zero in areas with air conditioning and (2) air conditioning coverage is uniform across facilities. Heatwave-induced losses were adjusted accordingly using the air conditioning penetration rate.
2.5. Standardized Precipitation Index (SPI)
The SPI aims to assess drought conditions based on the probability distribution of long-term precipitation using the gamma function. Precipitation is converted into normalized values, with the SPI expressed as the number of standard deviations by which the observed precipitation deviates from the long-term mean of a normally distributed random variable. Consequently, it can be used to define and compare drought conditions across different regions. This index provides a robust and reliable estimation of drought scale, severity, and spatial extent. When precipitation exceeds the long-term average, the SPI yields positive values, whereas it yields negative values if precipitation falls below the long-term average. The index is calculated as follows:
where is the rainfall during the selected time period in the year(mm), is the long-term average precipitation(mm), and σ is the standard deviation of the selected(mm), period. This study focuses primarily on drought-related losses, which are assessed using the SPI-3 to capture the impact of drought on crop production [47].
2.6. Sen’s Slope Trend
Sen’s slope has been widely applied to quantify annual-scale trends in time series data [48]. In this study, the method is used not only to assess the trends of the meteorological variables, but also to evaluate changes in economic losses over time. The Sen’s slope was calculated using the method proposed by Sen [49], as follows:
where and denote the values of the time series at time steps i and j, respectively.
2.7. Spatial Downscaling
Climate loss data were downscaled to the grid level using meteorological indicators and GDP data, enabling the conversion of provincial-level climate loss data from 2001 to 2020 into gridded datasets. The equations for this process are expressed as follows:
where represents the downscaling weight factor for each 1 km × 1 km grid, and denotes the corresponding meteorological index data or GDP data at the grid level.
By applying raster-based multiplication between the spatial weight factor and the total provincial-level economic loss data, a gridded economic loss map at 1 km × 1 km resolution is generated.
3. Results
3.1. Assessment of Heatwave Losses in Hainan Island
3.1.1. Changes in Heat Wave Risk on Hainan Island
The definition of heatwave events varies across different studies. In this study, we adopt the definition from QX/T 228-2014 [50]. According to this standard, the China Meteorological Administration issues high-temperature warnings based on daily maximum temperature thresholds of 35 °C, 37 °C, and 40 °C. A day with a maximum temperature exceeding 35 °C is considered a high-temperature day.
As shown in Figure 2a, the annual probability of heatwaves on Hainan Island increased steadily at an average rate of 0.048% per year from 1961 to 2020, indicating a rising risk of heatwave occurrence. In recent years, this probability has exceeded 8%, further indicating the growing threat of heatwaves in the region. Temporally, heatwaves mainly occur between May and August, with the highest frequency observed in May (>9%) (Figure 2b). Spatially, as illustrated in Figure 2c,d, many areas of Hainan Island exhibit average monthly high-temperature probabilities exceeding 5%. Notably, the northeastern region has experienced the most pronounced increase, with the frequency of high-temperature events rising at a rate of 0.1686% per year.
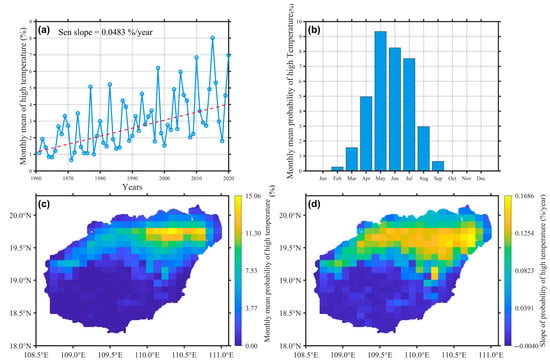
Figure 2.
Probability of high-temperature events on Hainan Island from 1961 to 2020: (a) interannual trend of the monthly mean high temperature. (b) Monthly mean distribution of high temperature probability. (c) Spatial distribution of the monthly mean high-temperature probability. (d) Spatial distribution of the slope of the monthly mean high-temperature probability.
3.1.2. Determine the Dynamic Threshold of Heatwave Risk
Due to data limitations, it is not feasible to calculate economic losses separately based on the industrial proportions at each grid. Therefore, a unified loss threshold was established, derived from the overall proportions of the primary, secondary, and tertiary industries. The annual average loss thresholds for each district and county are presented in Table 2.

Table 2.
Average high temperature loss WBGT threshold table (°C).
We found that economically developed districts and counties exhibit higher relative loss thresholds compared to less developed areas. This is primarily due to their industrial structure. These areas are dominated by the tertiary sector, which typically has a higher temperature threshold before incurring losses. In these regions, economic losses from high temperatures typically begin to occur when the WBGT exceeds 28 °C.
3.1.3. GDP Loss Assessment of Heatwave Disaster
After calculating the heatwave-induced loss thresholds and accounting for air conditioning penetration rates, we derived multi-year estimates of heatwave-related economic losses were in Hainan Island. The annual variations in total heatwave-induced losses then calculated, as illustrated in Figure 3a. Results show that the cumulative heatwave-induced losses over multiple years exceeded CNY 50 billion, with an average annual increase of approximately CNY 48 million. Heatwave-induced losses mainly occurred from May to July, with the highest loss in June, reaching CNY 12 billion (Figure 3b).
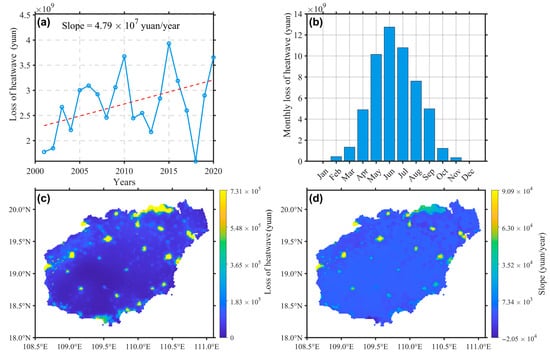
Figure 3.
Heatwave-induced economic losses on Hainan Island from 2001 to 2020: (a) Interannual trend of annual losses. (b) Monthly distribution of total annual losses. (c) Spatial distribution of cumulative heatwave losses. (d) Spatial distribution of the slope in heatwave losses.
Spatially, our analysis indicates that annual economic losses in high-loss areas exceeded CNY 731,000, mainly concentrated in regions with higher GDP. These losses display a scattered spatial distribution across Hainan Province (Figure 3c). Furthermore, the spatial distribution of annual growth rates in heatwave-induced losses reveals that regions with the fastest increases largely overlap with areas already incurring high losses, with the maximum annual increase exceeding CNY 90,900. A declining trend in losses is observed only in a few areas, primarily along the southern coastal edge (Figure 3d).
3.2. Assessment of Drought Losses in Hainan Island
3.2.1. Drought Change Characteristics of Hainan Island
To assess the historical drought conditions in Hainan Island, we calculated the annual SPI for the period from 1961 to 2020 (Figure 4a). The results showed a slight downward trend in the annual SPI (trend = −0.000038/year), suggesting a general reduction in drought severity over time. In terms of temporal trends, drought severity has generally weakened across most parts of the island, except for the southeastern region, where no clear weakening is observed. The most significant weakening trend is found in the northeastern region (Figure 4b).
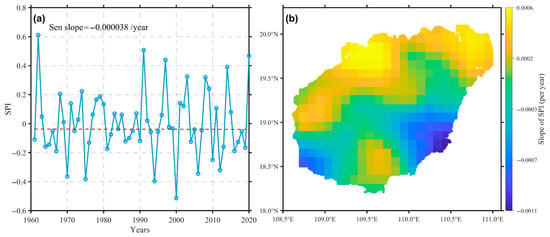
Figure 4.
SPI on Hainan Island from 1961 to 2020: (a) Interannual trend of annual SPI. (b) Spatial distribution of the SPI slope.
3.2.2. Characteristics of Land Use Change in Hainan Island
Since drought losses mainly stem from agriculture, SPI was processed using land use data to isolate the portion corresponding to farmland. Table 3 shows land use changes, revealing that 35% of farmland was converted to other types, while 16% of forest was converted to farmland. Farmland is the main area of land use type change. During the simulation process, we first calculated a drought severity index based on SPI values. Using this index, drought loss simulations were conducted. Figure 5 presents the comparison between simulated and observed drought losses from 2001 to 2020, with a coefficient of determination (R2) of 0.8744, indicating a strong model performance.

Table 3.
Change in land use type.
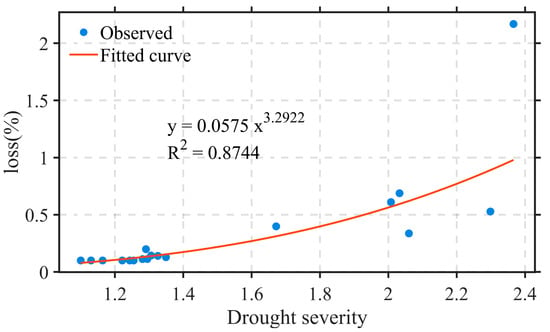
Figure 5.
Simulation effect of drought loss model from 2003 to 2020.
3.2.3. GDP Loss Assessment of Drought Disaster
Further analysis of drought-induced GDP losses confirmed this pattern. As shown in Figure 6a, the years 2005 and 2006 recorded the highest economic losses due to droughts, with total annual losses reaching CNY 1.6 billion. Moreover, monthly analysis revealed that drought losses occurred mostly in February and March, while no losses were recorded between May and November. The cumulative loss in March was the highest, reaching CNY 2 billion (Figure 6b). Additionally, drought-related losses were evenly distributed, mostly concentrated in spring and winter, with an average monthly total loss of approximately CNY 600 million (Figure 6b).
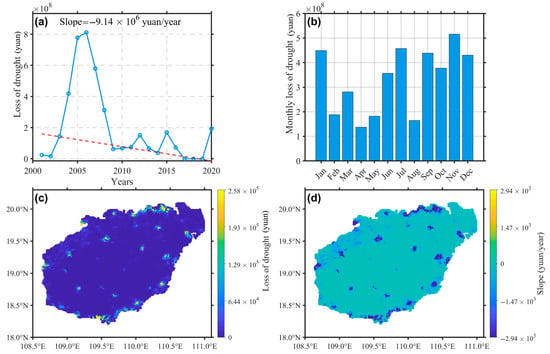
Figure 6.
Drought-induced losses on Hainan Island from 2001 to 2020: (a) Interannual trend of annual losses. (b) Total annual losses over the years of month. (c) Spatial distribution of drought losses. (d) Spatial distribution of slope of drought losses.
Spatially, areas with higher average annual drought losses and more rapid growth trends were primarily concentrated in coastal regions. The highest average annual loss reached CNY 258,000. The change in drought losses in most areas was close to 0, and the loss in some areas decreased to more than CNY 1470, while the steepest growth trend in loss over time reached CNY 2940 per year (Figure 6c,d).
3.3. Assessment of Heavy Rain in Hainan Island
3.3.1. Characteristics of Heavy Rain Variation
We analyzed three key indicators of heavy rain events-cumulative rainfall, maximum rainfall intensity, and heavy rain frequency. Heavy rain is defined as daily precipitation exceeding 50 mm. The results revealed an overall increasing trend across all indicators, with the cumulative heavy rain increasing at a rate of 2.893 mm/year, the number of heavy rain days increasing by 0.0249 days/year, and maximum monthly precipitation increasing at 0.1281 mm/day. In terms of spatial distribution, all indices exhibit similar patterns, with higher heavy rain intensity observed in central Hainan Island and along the southeastern coast. In some areas, the cumulative annual rainfall from heavy storms reaches 768.2 mm, the number of heavy rain days reaches 9 per year, and the average monthly maximum precipitation reaches 46 mm/day (Figure 7).
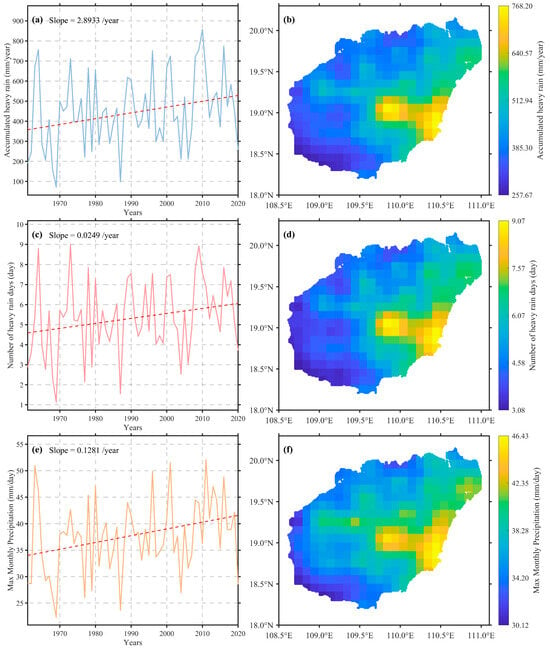
Figure 7.
Heavy rain indices on Hainan Island from 1961 to 2020: (a) Interannual trend of cumulative rainfall. (b) Spatial distribution of cumulative rainfall. (c) Interannual trend of the number of heavy rain days. (d) Spatial distribution of number of heavy rain days. (e) Interannual trend of maximum monthly precipitation. (f) Spatial distribution of maximum monthly precipitation.
3.3.2. Climate-Driven Factors of Heavy Rain Losses
To construct a heavy rain loss model, three models were developed using storm-related metrics while accounting for potential structural changes in socioeconomic exposure and climatic drivers. The dataset was divided into two 10-year periods for simulation, yielding R2 values and RMSE across the three models (Table 4). Results indicate that the storm cumulative precipitation metric demonstrated the highest overall R2 value of 0.9467 and the lowest RMSE of 0.6907. This validates the selection of storm cumulative precipitation as the primary indicator. As shown in Figure 8, the model’s validity is confirmed by R2 values exceeding 0.9 in both periods, demonstrating high precision and robustness in simulating economic losses from heavy rain events.

Table 4.
Model assessment.
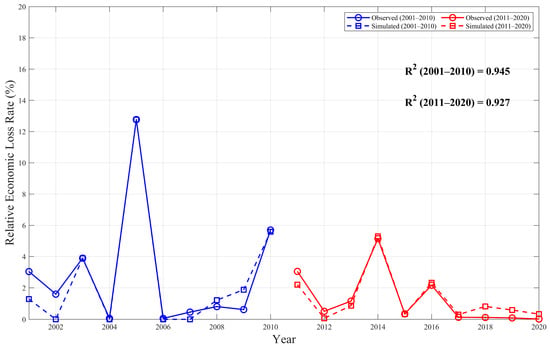
Figure 8.
Simulation effect of heavy rain loss model from 2001–2020.
3.3.3. GDP Loss Assessment of Heavy Rain Disaster
Based on model simulations, we estimated economic losses caused by storm events across Hainan Island. The results indicate that highest annual loss occurred in 2014, reaching CNY 18 billion, with an overall fluctuating trend observed during the study period. Monthly analysis shows that heavy rain losses in July, September, and October exceeded CNY 20 billion, while losses during the first half of the year were comparatively lower (Figure 9a,b).
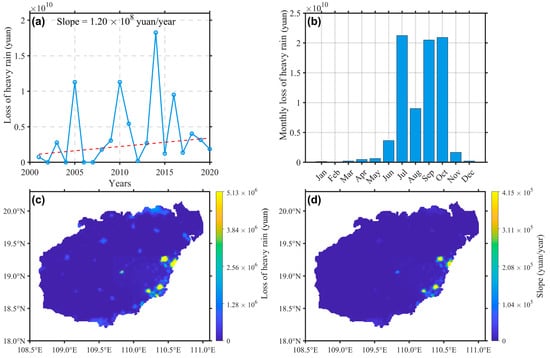
Figure 9.
Heavy rain-induced losses on Hainan Island from 2001 to 2020: (a) Interannual trend of annual losses. (b) Total annual losses over the years of month. (c) Spatial distribution of heavy rain losses. (d) Spatial distribution of slope of heavy rain losses.
Spatially, high-loss regions were primarily concentrated along the coastal zones, with some scattered high-loss areas in the interior. In several regions, the average annual losses exceeded CNY 5 million. Furthermore, the rate of increase in losses was notable in certain areas, surpassing CNY 400,000 per year, which may be largely attributed to the extreme losses record in 2015 (Figure 9c,d).
3.4. Comprehensive Analysis and Comparison of Weather-Related Disaster Losses
3.4.1. Spatio-Temporal Characteristics of Total Disaster Losses
Our analysis of aggregated losses from heat waves, droughts, and heavy rain events reveals a significant upward trend over the study period, with an average increase of CNY 169 million per year. The highest monthly losses, reaching CNY 25 billion, occurred in June and August, primarily due to the combined impact of heavy rain and heatwave events. Spatially, regions with the highest total economic losses are primarily located in areas simultaneously affected by severe high temperatures and intense rainfall, with losses exceeding CNY 5,380,000. In addition, several drought-prone regions also recorded comparable levels of economic loss. Temporally, the year 2015 experienced the highest total disaster-related economic loss, amounting to approximately CNY 20 billion, which aligns with the occurrence of multiple high-impact climate events in that year (Figure 10).
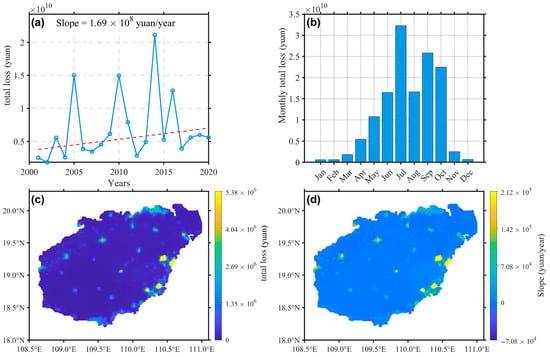
Figure 10.
Total climate-related losses on Hainan Island from 2001 to 2020: (a) Interannual trend of annual total losses. (b) Total annual losses over the years of month. (c) Spatial distribution of total losses. (d) Spatial distribution of slope of total losses.
3.4.2. Comparison of Contribution Rate of Total Disaster Losses
To evaluate the relative contributions of different extreme climate events, an attribution analysis of total economic losses was conducted. The results indicate that losses due to heat waves are the primary contributor, accounting for more than 40% of the total disaster losses in 70% of the years. Heavy rain events also had a significant impact, contributing more than 40% of annual losses in over half of the years, while droughts played a comparatively minor role, accounting for less than 10% of the total losses (Figure 11). On a monthly scale, drought-related losses were primarily concentrated in the spring, whereas heatwaves accounted for over 60% of losses during the remaining months (Figure 12). These findings underscore the dominant role of heatwaves in driving economic losses on Hainan Island and indicating the urgent need for targeted adaptation strategies to mitigate heatwave impacts.
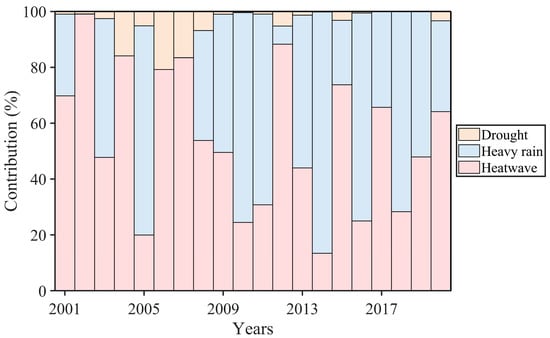
Figure 11.
Contribution of different disaster types to total economic losses on Hainan Island from 2001 to 2020.
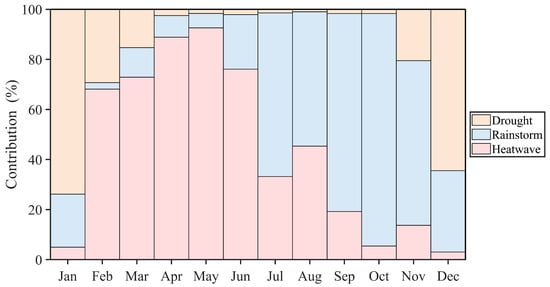
Figure 12.
Monthly contribution of different disaster types to total economic losses on Hainan Island from 2001 to 2020.
4. Discussion
4.1. Estimation of Natural Meteorological Disaster Losses
We constructed a dataset of natural meteorological disaster-induced economic losses for Hainan Island. The results reveal a significant upward trend, particularly in losses caused by high temperature, heat waves, and heavy rain. This pattern is broadly consistent with global trends in the escalation of extreme climate-related losses. Global warming not only increases temperatures but also prolongs the duration and intensifies the severity of heatwaves, thereby exacerbating their socio-economic impacts [51]. Furthermore, elevated temperatures increase energy consumption and health risks, resulting in both direct and indirect economic losses [52]. In comparison, trends associated with heavy rain events are more complex, especially in tropical and temperate regions, where uncertainties remain regarding storm variability and their specific links to human activities [53]. Some studies suggest that increased greenhouse gas emissions may intensify heavy rain, but such changes often interact with natural climate variability and local weather systems, making attribution more difficult [54].
Drought directly reduces agricultural income and results in certain economic losses [55]. This impact is particularly significant in tropical regions such as Hainan Island, where persistent high-temperature conditions have significantly hindered local agricultural development. Our findings further confirm that drought-induced GDP losses in Hainan Island primarily originate from agricultural land. Moreover, previous studies emphasize that regional heterogeneity and differences in exposure levels are critical determinants of the magnitude of disaster-related losses. With continuous population growth and rapid urbanization, an increasing number of people and economic assets are becoming exposed to extreme weather events. This trend amplifies both economic and social consequences of such events. In addition to exposure, factors such as per capita GDP and socio-political capacity also shape a region’s vulnerability to climate-related risks, such as constrained precipitation extremes, revealing unequal future socioeconomic exposure. Due to its geographic location, Hainan Island is inherently more susceptible to extreme weather hazards, especially in densely populated areas with elevated exposure levels. Global evidence supports this finding, consistently demonstrating that high-exposure regions are disproportionately affected by extreme climate disasters [56].
Research on the decreasing vulnerability to river flooding and the global benefits of adaptation suggests that implementing effective adaptation strategies can significantly reduce disaster-related losses worldwide while simultaneously enhancing regional economic resilience and supporting sustainable development. These strategies offer substantial benefits under global climate change by reducing exposure and vulnerability, especially to river flooding. Therefore, strengthening adaptive capacity is not only vital for tackling climate challenges but also critical for minimizing meteorological disaster losses in the decades to come.
4.2. Accuracy of Simulation Results
This study found that annual heatwave-induced losses in Hainan Island accounted for approximately 0.5% of its annual GDP. In comparison, a domestic study found that economic losses due to heatwaves in Nanjing reached 3.43% of local GDP in 2013 [57]. This difference can be attributed not only to geographical differences but also to the differing scopes of impact considered. While the present study focuses primarily on the direct effects of heatwaves, such as reduced productivity from heat stress, the Nanjing study incorporates indirect losses, including those resulting from illness-induced productivity decline.
According to a national-scale assessment, the GDP loss ratio associated with heatwave events has increased year by year, peaking in 2018, when the national loss was estimated at 0.18% of GDP. Given Hainan Island’s unique geographical location and industrial composition, the proportion of heatwave-related losses observed in this study exceeds the national average but remains within a reasonable and plausible range [58].
Compared to other countries, heatwave-induced losses in Europe from 1981 to 2010 accounted for approximately 0.2% of GDP, which is higher than China’s national average [59]. Moreover, countries in southern Europe experienced greater losses due to more intense heat events, supporting our finding that Hainan Island may be more vulnerable. Overall, the simulated disaster losses in this study account for roughly 1% of GDP, aligning well with the global estimates reported in the Emergency Events Database (EM-DAT), thereby supporting the credibility and reliability of our simulation results.
4.3. Uncertainties and Limitations
At the panel data, economic losses from extreme weather events are typically estimated using statistical yearbooks or official reports. However, the lack of comprehensive disaster data, especially those concerning indirect losses related to droughts and heavy rain, poses significant challenges for post-disaster economic assessments. Indirect losses such as declines in agricultural productivity, disruptions to supply chains, and reductions in labor productivity are often underreported in available data [60]. In the absence of high-frequency, detailed disaster data, many assessments must rely on model-based projections or assumptions, which may introduce bias.
Economic loss estimates associated with heatwaves typically rely on models incorporating air conditioning penetration rates and regional industrial structure data [45]. However, these models often oversimplify the real impact of heatwaves due to the unavailability of fine-scale, grid-based industrial statistics, particularly in labor-intensive sectors. For instance, in certain regions, the performance of labor-intensive industries remains inadequately captured, potentially leading to underestimation of heatwave-related economic losses, especially in secondary industries like manufacturing and construction [61]. Moreover, this study evaluates the economic impacts of three types of extreme climate events without accounting for their possible compound effects. This approach may result in an overestimation of total losses [62].
5. Conclusions
In this study, ECELM was constructed, and the economic impacts of three kinds of extreme climate losses in Hainan Island were quantified by threshold optimization. The results show that the heatwave-related losses have continued to rise, totaling over CNY 50 billion from 2001 to 2020, with the highest losses concentrated in high-GDP coastal regions where local annual losses exceed CNY 731,000 per grid. Drought-related losses amounted to CNY 3.8 billion over the same period. Heavy rain losses showed strong interannual variability. In 2014, the annual loss reached CNY 18.1 billion. During the period from 2001 to 2020, the total of monthly losses in July and September each exceeded CNY 20 billion. The total loss attributed to heavy rain over the entire period amounted to approximately CNY 75 billion. Comparative analysis reveals that heatwaves were the dominant contributor in more than half of the years. The seasonal distribution of losses was evident: heatwaves primarily in summer, droughts in spring, and heavy rain in summer and autumn. Spatially, coastal areas face compounded risks from both heat waves and heavy rain, with annual losses exceed CNY 5.38 million per grid. To mitigate the impacts of disasters, measures such as improving water resource management and irrigation efficiency to reduce drought impacts, implementing early warning systems to alleviate heatwave effects, and enhancing flood control infrastructure and urban drainage systems to decrease losses from heavy rain can be adopted. The proposed framework provides a robust method to quantify the impacts of different extreme climate events (heat wave, drought, and heavy rain) on tropical island regions. It also constructs an extreme climate dataset that can support future research and policymaking aimed at enhancing climate resilience.
Author Contributions
Conceptualization, J.Z. and C.Y.; methodology, C.Y.; software, C.Y.; validation, C.Y., Y.Z. (Yuxin Zhou) and Y.Z. (Yichen Zhang); formal analysis, C.Y.; investigation, C.Y.; resources, J.Z.; data curation, J.Z.; writing—original draft preparation, C.Y.; writing—review and editing, Y.Z. (Yichen Zhang); supervision, J.L.; project administration, W.L.; funding acquisition, J.Z. All authors have read and agreed to the published version of the manuscript.
Funding
This study was funded by Hainan Province Science and Technology Special Fund (No. ZDYF2023SHFZ092), the National Natural Science Foundation of China (Nos. 41901043 and 42261005), Education and Teaching Reform in Higher Education institutions in Hainan Province (Hnjg-2024-46), and the Innovative Research Projects for Postgraduates of Hainan Province (grant No. Qhyb2024-100).
Institutional Review Board Statement
Not applicable.
Informed Consent Statement
Not applicable.
Data Availability Statement
The original contributions presented in this study are included in the article. Further inquiries can be directed to the corresponding authors.
Conflicts of Interest
The authors declare no conflicts of interest.
Abbreviations
The following abbreviations are used in this manuscript:
| ECELM | Extreme Climate Economic Loss Model |
| SPI | Standardized Precipitation Index |
| WBGT | Wet Bulb Globe Temperature |
| EM-DAT | Emergency Events Database |
| GDP | Gross Domestic Product |
References
- Trenberth, K.E.; Fasullo, J.T.; Shepherd, T.G. Attribution of climate extreme events. Nat. Clim. Change 2015, 5, 725–730. [Google Scholar] [CrossRef]
- Jentsch, A.; Kreyling, J.; Beierkuhnlein, C. A new generation of climate-change experiments: Events, not trends. Front. Ecol. Environ. 2007, 5, 365–374. [Google Scholar] [CrossRef]
- ICSU. Science plan for Integrated Research on Disaster Risk: Addressing the Challenge of Natural and Human-Induced Environmental Hazards; International Council for Science: Paris, France, 2008. [Google Scholar]
- Newman, R.; Noy, I. The global costs of extreme weather that are attributable to climate change. Nat. Commun. 2023, 14, 6103. [Google Scholar] [CrossRef]
- Boyd, E.; Chaffin, B.C.; Dorkenoo, K.; Jackson, G.; Harrington, L.; N’guetta, A.; Johansson, E.L.; Nordlander, L.; De Rosa, S.P.; Raju, E.; et al. Loss and damage from climate change: A new climate justice agenda. One Earth 2021, 4, 1365–1370. [Google Scholar] [CrossRef]
- Diaz, D.; Moore, F. Quantifying the economic risks of climate change. Nat. Clim. Change 2017, 7, 774–782. [Google Scholar] [CrossRef]
- Ackerman, F.; Stanton, E.A.; Hope, C.; Alberth, S. Did the Stern Review underestimate US and global climate damages? Energy Policy 2009, 37, 2717–2721. [Google Scholar] [CrossRef]
- World Meteorological Society (WMO). WMO Atlas of Mortality and Economic Losses from Weather, Climate, and Water Extremes (1970–2019). Available online: https://library.wmo.int/idurl/4/44978 (accessed on 1 May 2025).
- IPCC. Climate Change 2024: Synthesis Report; IPCC AR6, Synthesis Report, 2-10; IPCC: Geneva, Switzerland, 2024. [Google Scholar]
- Zscheischler, J.; Westra, S.; Van Den Hurk, B.J.; Seneviratne, S.I.; Ward, P.J.; Pitman, A.; AghaKouchak, A.; Bresch, D.N.; Leonard, M.; Wahl, T.; et al. Future climate risk from compound events. Nat. Clim. Change 2018, 8, 469–477. [Google Scholar] [CrossRef]
- Zuo, J.; Pullen, S.; Palmer, J.; Bennetts, H.; Chileshe, N.; Ma, T. Impacts of heat waves and corresponding measures: A review. J. Clean. Prod. 2015, 92, 1–12. [Google Scholar] [CrossRef]
- Mishra, A.K.; Singh, V.P. A review of drought concepts. J. Hydrol. 2010, 391, 202–216. [Google Scholar] [CrossRef]
- Carlton, E.J.; Eisenberg, J.N.; Goldstick, J.; Cevallos, W.; Trostle, J.; Levy, K. Heavy rainfall events and diarrhea incidence: The role of social and environmental factors. Am. J. Epidemiol. 2014, 179, 344–352. [Google Scholar] [CrossRef]
- Jahn, M. Economics of extreme weather events: Terminology and regional impact models. Weather Clim. Extrem. 2015, 10, 29–39. [Google Scholar] [CrossRef]
- Sheridan, S.C.; Lee, C.C.; Allen, M.J.; Kalkstein, L.S. Future heat vulnerability in California, Part I: Projecting future weather types and heat events. Clim. Change 2012, 115, 291–309. [Google Scholar] [CrossRef]
- Pitman, A.J.; Sisson, S.A. Systematic differences in future 20 year temperature extremes in AR4 model projections over Australia as a function of model skill. Int. J. Climatol. 2013, 33, 1153–1167. [Google Scholar]
- Parsons, K. Human Thermal Environments: The Effects of Hot, Moderate, and Cold Environments on Human Health, Comfort, and Performance; CRC Press: Boca Raton, FL, USA, 2014. [Google Scholar]
- Sahu, S.; Sett, M.; Kjellstrom, T. Heat exposure, cardiovascular stress and work productivity in rice harvesters in India: Implications for a climate change future. Ind. Health 2013, 51, 424–431. [Google Scholar] [CrossRef]
- Graff Zivin, J.; Neidell, M. Temperature and the allocation of time: Implications for climate change. J. Labor Econ. 2014, 32, 1–26. [Google Scholar] [CrossRef]
- Haines, A.; Ebi, K. The imperative for climate action to protect health. N. Engl. J. Med. 2019, 380, 263–273. [Google Scholar] [CrossRef]
- Liu, Y.; Zhang, Z.; Chen, X.; Huang, C.; Han, F.; Li, N. Assessment of the regional and sectoral economic impacts of heat-related changes in labor productivity under climate change in China. Earth’s Future 2021, 9, e2021EF002028. [Google Scholar] [CrossRef]
- Zhang, Y.; Shindell, D.T. Costs from labor losses due to extreme heat in the USA attributable to climate change. Clim. Change 2021, 164, 35. [Google Scholar] [CrossRef]
- Li, Y.; Guan, K.; Schnitkey, G.D.; DeLucia, E.; Peng, B. Excessive rainfall leads to maize yield loss of a comparable magnitude to extreme drought in the United States. Glob. Change Biol. 2019, 25, 2325–2337. [Google Scholar] [CrossRef]
- Powell, J.P.; Reinhard, S. Measuring the effects of extreme weather events on yields. Weather Clim. Extrem. 2016, 12, 69–79. [Google Scholar] [CrossRef]
- Lesk, C.; Rowhani, P.; Ramankutty, N. Influence of extreme weather disasters on global crop production. Nature 2016, 529, 84–87. [Google Scholar] [CrossRef]
- Heino, M.; Kinnunen, P.; Anderson, W.; Ray, D.K.; Puma, M.J.; Varis, O.; Siebert, S.; Kummu, M. Increased probability of hot and dry weather extremes during the growing season threatens global crop yields. Sci. Rep. 2023, 13, 3583. [Google Scholar] [CrossRef] [PubMed]
- Trenczek, J.; Lühr, O.; Eiserbeck, L.; Sandhövel, M.; Ibens, D. Schäden der Dürre-und Hitzeextreme 2018 und 2019-eine ex-Post-Analyse; Studie im Auftrag des Bundesministeriums für Wirtschaft und Klimaschutz; Prognos AG: Berlin, Germany, 2022. [Google Scholar]
- Mazumdaru, S. Calls for Farm Support Intensify as Europe Struggles with Heat Wave, Drought; DW: Bonn, Germany, 2018. [Google Scholar]
- Yadollahie, M. The flood in Iran: A consequence of the global warming? Int. J. Occup. Environ. Med. 2019, 10, 54. [Google Scholar] [CrossRef] [PubMed]
- Bozorg-Haddad, O.; Zolghadr-Asli, B.; Chu, X.; Loáiciga, H.A. Intense extreme hydro-climatic events take a toll on society. Nat. Hazards 2021, 108, 2385–2391. [Google Scholar] [CrossRef]
- Hernández-Delgado, E.A. The emerging threats of climate change on tropical coastal ecosystem services, public health, local economies and livelihood sustainability of small islands: Cumulative impacts and synergies. Mar. Pollut. Bull. 2015, 101, 5–28. [Google Scholar] [CrossRef]
- Dey, M.M.; Rosegrant, M.W.; Gosh, K.; Chen, O.L.; Valmonte-Santos, R. Analysis of the economic impact of climate change and climate change adaptation strategies for fisheries sector in Pacific coral triangle countries: Model, estimation strategy, and baseline results. Mar. Policy 2016, 67, 156–163. [Google Scholar] [CrossRef]
- Frame, D.J.; Rosier, S.M.; Noy, I.; Harrington, L.J.; Carey-Smith, T.; Sparrow, S.N.; Stone, D.A.; Dean, S.M. Climate change attribution and the economic costs of extreme weather events: A study on damages from extreme rainfall and drought. Clim. Change 2020, 162, 781–797. [Google Scholar] [CrossRef]
- Mukherjee, S.; Mishra, A.K. Increase in compound drought and heatwaves in a warming world. Geophys. Res. Lett. 2021, 48, e2020GL090617. [Google Scholar] [CrossRef]
- Yao, Y.; Zhang, W.; Kirtman, B. Increasing impacts of summer extreme precipitation and heatwaves in eastern China. Clim. Change 2023, 176, 131. [Google Scholar] [CrossRef]
- Sun, R.; Wu, Z.; Chen, B.; Lan, G.; Qi, D.; Li, G.; Jia, P.; Yin, Y. Change features of precipitation events in Hainan Island from 1959 to 2013. Chin. J. Trop. Crops 2017, 38, 2176–2182. [Google Scholar]
- Zhou, L.; Gao, S.; Yang, Y.; Sun, R.; Wu, Z.; Chen, B.; Lan, G.; Qi, D.; Li, G.; Jia, P.; et al. Typhoon events recorded in coastal lagoon deposits, southeastern Hainan Island. Acta Oceanol. Sin. 2017, 36, 37–45. [Google Scholar] [CrossRef]
- China Meteorological Administration. China Meteorological Disaster Yearbook (2023); Meteorological Press: Beijing, China, 2023.
- Zhai, J.; Hou, P.; Cao, W.; Yang, M.; Cai, M.; Li, J. Ecosystem assessment and protection effectiveness of a tropical rainforest region in Hainan Island, China. J. Geogr. Sci. 2018, 28, 415–428. [Google Scholar] [CrossRef]
- Huang, X.; Liu, X.; Liao, L.; Li, J.; Luo, G.; Li, B.; Ma, Z.; Wang, Z. Grazing decreases carbon storage in the Qinghai-Tibet Plateau grasslands. Commun. Earth Environ. 2025, 6, 198. [Google Scholar] [CrossRef]
- Li, F.; Yang, Y.; Ali, H.; Xie, J.; Dai, Y.; Li, Z.; Wang, Z.; Pan, X.; Fowler, H.J. Assessing the consistent and divergent impacts of urbanization on heavy rainfall in Chinese urban agglomerations. Commun. Earth Environ. 2025, 6, 302. [Google Scholar] [CrossRef]
- He, J.; Yang, K.; Li, X.; Tang, W.; Shao, C.; Jiang, Y.; Ding, B. China Meteorological Forcing Dataset v2.0 (1951–2020); National Tibetan Plateau/Third Pole Environment Data Center: Beijing, China, 2024. [Google Scholar] [CrossRef]
- Lou, L.; Li, X. Radiative effects on torrential rainfall during the landfall of Typhoon Fitow (2013). Adv. Atmos. Sci. 2016, 33, 101–109. [Google Scholar] [CrossRef]
- Li, Z.; He, S.; Chen, C.; Qiu, L.; Li, M. Landfall Typhoon Characteristics Dataset in Hainan Province from 1949 to 2022. Chin. Sci. Data 2024, 9, 313–325. [Google Scholar]
- Wang, P.; Zhang, W.; Liu, J.; He, P.; Wang, J.; Huang, L.; Zhang, B. Analysis and intervention of heatwave related economic loss: Comprehensive insights from supply, demand, and public expenditure into the relationship between the influencing factors. J. Environ. Manag. 2023, 326, 116654. [Google Scholar] [CrossRef]
- Willett, K.M.; Sherwood, S. Exceedance of heat index thresholds for 15 regions under a warming climate using the wet-bulb globe temperature. Int. J. Climatol. 2012, 32, 161–177. [Google Scholar] [CrossRef]
- Ji, L.; Peters, A.J. Assessing vegetation response to drought in the northern Great Plains using vegetation and drought indices. Remote Sens. Environ. 2003, 87, 85–98. [Google Scholar] [CrossRef]
- Asad Amin, W.; Nasim, W.; Fahad, S.; Ali, S.; Ahmad, S.; Rasool, A.; Saleem, N.; Hammad, H.M.; Sultana, S.R.; Mubeen, M.; et al. Evaluation and analysis of temperature for historical (1996–2015) and projected (2030–2060) climates in Pakistan using SimCLIM climate model: Ensemble application. Atmos. Res. 2018, 213, 422–436. [Google Scholar] [CrossRef]
- Sen, P.K. Estimates of the regression coefficient based on Kendall’s tau. J. Am. Stat. Assoc. 1968, 63, 1379–1389. [Google Scholar] [CrossRef]
- QX/T 228-2014; Classification of Regional High Temperature Weather Process. China Meteorological Administration: Beijing, China, 2014.
- Martinez-Villalobos, C.; Fu, D.; Loikith, P.C.; Neelin, J.D. Accelerating increase in the duration of heatwaves under global warming. Nat. Geosci. 2025, 18, 716–723. [Google Scholar] [CrossRef]
- Zhao, C.; Huang, Y.; Cheng, Y.; Zhang, R.; Wang, Y.; Tong, S.; He, J.; Guo, J.; Xia, F.; Li, Y.; et al. Association between heatwaves and risk and economic burden of injury related hospitalizations in China. Environ. Res. 2024, 259, 119509. [Google Scholar] [CrossRef]
- Myhre, G.; Alterskjær, K.; Stjern, C.W.; Hodnebrog, Ø.; Marelle, L.; Samset, B.H.; Sillmann, J.; Schaller, N.; Fischer, E.; Schulz, M.; et al. Frequency of extreme precipitation increases extensively with event rareness under global warming. Sci. Rep. 2019, 9, 16063. [Google Scholar] [CrossRef]
- James, R.A.; Jones, R.G.; Boyd, E.; Young, H.R.; Otto, F.E.; Huggel, C.; Fuglestvedt, J.S. Attribution: How is it relevant for loss and damage policy and practice? In Loss and Damage from Climate Change. Climate Risk Management, Policy and Governance; Mechler, R., Bouwer, L., Schinko, T., Surminski, S., Linnerooth-Bayer, J., Eds.; Springer: Cham, Switzerland, 2019. [Google Scholar] [CrossRef]
- Tran, L.T.; Stoeckl, N.; Esparon, M.; Jarvis, D. If climate change means more intense and more frequent drought, what will that mean for agricultural production? A case study in northern Australia. Australas. J. Environ. Manag. 2016, 23, 281–297. [Google Scholar] [CrossRef]
- Schillerberg, T.A.; Tian, D. Global assessment of compound climate extremes and exposures of population, agriculture, and forest lands under two climate scenarios. Earth’s Future 2024, 12, e2024EF004845. [Google Scholar] [CrossRef]
- Xia, Y.; Li, Y.; Guan, D.; Tinoco, D.M.; Xia, J.; Yan, Z.; Yang, J.; Liu, Q.; Huo, H. Assessment of the economic impacts of heat waves: A case study of Nanjing, China. J. Clean. Prod. 2018, 171, 811–819. [Google Scholar] [CrossRef]
- Xie, Y.; Zhou, Z.; Sun, Q.; Zhao, M.; Pu, J.; Li, Q.; Sun, Y.; Dai, H.; Li, T. Social-economic transitions and vulnerability to extreme temperature events from 1960 to 2020 in Chinese cities. iScience 2024, 27, 109066. [Google Scholar] [CrossRef] [PubMed]
- García-León, D.; Casanueva, A.; Standardi, G.; Burgstall, A.; Flouris, A.D.; Nybo, L. Current and projected regional economic impacts of heatwaves in Europe. Nat. Commun. 2021, 12, 5807. [Google Scholar] [CrossRef]
- Hoffmann, C. Estimating the benefits of adaptation to extreme climate events, focusing on nonmarket damages. Ecol. Econ. 2019, 164, 106250. [Google Scholar] [CrossRef]
- Sun, Y.; Zhu, S.; Wang, D.; Duan, J.; Lu, H.; Yin, H.; Tan, C.; Zhang, L.; Zhao, M.; Cai, W.; et al. Global supply chains amplify economic costs of future extreme heat risk. Nature 2024, 627, 797–804. [Google Scholar] [CrossRef] [PubMed]
- Fan, X.; Zhang, Y.; Shi, K.; Peng, J.; Liu, Y.; Zhou, Y.; Liu, Y.; Zhu, Q.; Song, C.; Wan, R.; et al. Surging compound drought-heatwaves underrated in global soils. Proc. Natl. Acad. Sci. USA 2024, 121, e2410294121. [Google Scholar] [CrossRef] [PubMed]
Disclaimer/Publisher’s Note: The statements, opinions and data contained in all publications are solely those of the individual author(s) and contributor(s) and not of MDPI and/or the editor(s). MDPI and/or the editor(s) disclaim responsibility for any injury to people or property resulting from any ideas, methods, instructions or products referred to in the content. |
© 2025 by the authors. Licensee MDPI, Basel, Switzerland. This article is an open access article distributed under the terms and conditions of the Creative Commons Attribution (CC BY) license (https://creativecommons.org/licenses/by/4.0/).