Abstract
As local risk assessments are fundamental for risk management and mitigation strategies, this work introduces a methodology for assessing multi-hazard scenarios of extreme compounded events and their duration using daily time series of surface variables from high-resolution climate simulations during historical and future periods under RCP8.5. The aim was to investigate the return level extremes of 20- and 50-year periods of hazards occurring within specific durations and concurrent extreme values of other surface variables, for selected locations in Greece. In addition, future changes in the temporal occurrence of compounded hazards involving precipitation and wind with temperature extremes were performed based on temperature extreme percentiles. The assessment revealed the geographical dependence in the projected occurrence, intensity, and duration of compounded multi-hazard extremes, emphasising the need for high spatial resolution climate data for their investigation. The highlights of the findings include a significant increasing trend of compounded multi-hazard extremes, e.g., hot days and tropical nights, milder winter minimum temperatures with lower rainfall extremes, hotter and windier events of shorter duration, and longer precipitation extremes with increased extreme temperatures. The projections showcased the impact of climate change on extreme compounds with a multitude of interesting findings associated with significant changes in their duration, intensity, and temporal occurrence.
1. Introduction
The Mediterranean region, known as a climate change hot spot, has been experiencing a progressive increase in the frequency, duration, and intensity of extreme weather events since 1950, with increasing trends in temperature and changes in precipitation patterns, reported extensively in the latest Intergovernmental Panel on Climate Change (IPCC) Sixth Assessment Report (AR6) (Intergovernmental Panel on Climate Change, 2023). Recent studies used CMIP6 and the new Shared Socioeconomic Pathways (SSPs) to investigate changes in the occurrence of extreme events in the Mediterranean area (e.g., [1,2,3,4,5]). Numerous studies have focused on specific regions of the Mediterranean, highlighting, for example, in the case of Greece, significant changes in the spatial and temporal patterns of extremes across the country based on historical records [6,7,8,9] and in terms of climate projection analysis under RCP scenarios, e.g., [10,11,12,13,14,15,16,17].
The potential threat of extreme events (e.g., heat waves, extreme rainfall events, drought spells, and flash floods), with significant socioeconomic impacts and degradation of ecosystems, necessitates the assessment of risks along different future climate projections for the development of appropriate mitigation and adaptation strategies. The top global risks to well-being and infrastructure today are those associated with climate change. Estimating single-climate-related risks has been the main focus of earlier research on the impacts of climate change [18], which may have resulted in an underestimation or overestimation of risks. This imposed the need to characterise the impacts of extremes in an integrated approach. Mazdiyasni et al. (2019 [19]) proposed a multivariate method to construct heat wave Intensity, Duration, and Frequency (HIDF) curves to quantitatively describe the likelihood of heat waves with different intensities and durations in the United States. Maurya et al. [20] developed temperature intensity–duration–frequency (TIDF) curves for various durations and return periods, and observed that, for a given intensity and duration, the exceedance probability of high-temperature extremes increases under different global warming levels over India. Concerning precipitation extremes, Ragno et al. [21] derived future non-stationary IDF curves to examine future changes in the frequency (return period) of extreme precipitation intensity in several cities in the United States using an ensemble of historical and projected precipitation from the Coupled Model Intercomparison Project Phase 5 (CMIP5) to assess infrastructure resilience and revise design guidelines.
According to [22], about 19% of 16,535 disaster records in the EM-DAT global disaster database (https://www.emdat.be/, accessed on 15 April 2025) are classified as multi-hazard events. Several recent methodological approaches have been proposed to deal with multi-hazards, taking into account possible regional variations in the intensity and frequency of climate extremes to identify areas potentially more exposed to climate change. In general, a multi-hazard assessment approach takes into account the connections between the most significant hazards in a specific geographic region, as denoted by [23] (Gupta et al., 2020). These interconnections also include the coincidence of the events’ occurrence and their impacts [24]. In addition, Ming et al. [25] developed an integrated model to assess multiple risks to crops in a concurrent scenario of two hazards and measure the probability of loss. Recently, Laino and Iglesias [26] presented an indicator-based approach to assess different climate hazards in terms of coastal risk in ten European coastal cities. Furthermore, in-depth studies offer a holistic perspective on the complex nature of climate risks and the linkages between different types of hazards, which in turn provides a deeper understanding of the combined effects of multiple hazards to plan effective strategies for managing these risks [27,28]. Recently, a study by [29] proposed a framework for modelling multi-hazard risks by considering hazards, exposures, vulnerabilities, and recovery assumptions, based on the combination of single-hazard models using river floods and tropical cyclones affecting people and physical assets on a global scale in a changing climate. Moreover, Sutanto et al. [30] emphasised the importance of adopting a multi-hazard risk management approach by considering the multi-hazards of wildfires and floods rather than individual risks. Various methodologies were discussed in [31], based on extensive reviews and studies related to floods, heat waves, and wind speed that have developed—IDF curves applied worldwide (and in Greece) for disaster risk reduction. These methodologies, based on the method of Extreme Value Theory (EVT), constitute one of the most widely used tools for planning, design, and operation of a wide range of water resources-related projects, for example, [32].
Compound extreme events that are increasingly receiving scientific interest involve the combination of multiple drivers and/or hazards under the same time window that contribute to societal or environmental risk, as indicated by [33,34]. More precisely, the IPCC SREX report [35] indicated the following definition on these compound events: “In climate science, compound events can be (1) two or more extreme events occurring simultaneously i.e., on the same day and in the same region or successively according to [36] (2) combinations of extreme events with underlying conditions that amplify the impact of the events, or (3) combinations of events that are not themselves extremes but lead to an extreme event or impact when combined. The contributing events can be of similar (clustered multiple events) or different type(s)”.
So far, only a few studies have developed IDF methodologies for interpreting compounded events and future impacts due to climate change. In the past, Willems (2000 [37]) used historical records (1967–1993) to derive IDF relationships for extreme precipitation intensities at Uccle/Ukkel (Belgium) for aggregation levels (duration) in 10 min to 15 days to design applications for different seasons and two storm types. Multi-hazard design scenarios for analysing compound flooding hazards in Washington were proposed by [38] by selecting marginal cumulative distributions based on multivariate return period curves for water level and river discharge and copula models to derive design quantiles. More recently, Xu et al. [39] studied flood risk in coastal cities by examining the influence of climate change on the combined effect of future rainfall changes (from GCMs in CMIP5) and changes in flood volume caused by sea level rise. Doshi et al. [40] developed a methodology for determining the joint probability of highly correlated significant pairs of compound events at the highest spatial resolution on a monthly temporal scale across Europe based on complex statistical analysis using copula to evaluate flood hazard and exposure in New York City. [41] constructed multi-hazard scenarios by considering the compounded effects of changing surge/sea level and rainfall regimes, using a coastal ocean model for offshore water-level time series.
A few studies have, until now, concentrated on the investigation of the spatio-temporal patterns of compound and cascading hazards using historical data for heatwaves, droughts, fires, and wet–cold extreme events across the continental scale of Europe [42,43,44] and not at the country level. Moreover, previous works have relied either on observational data from specific locations [45] or modelled data across the Mediterranean region [46,47,48]. Thus far, only the research conducted by Markantonis [13,49] has focused on the spatio-temporal analysis, specifically of wet–cold compound events in Greece, which were not always characterised by extreme values, using EUROCORDEX model ensemble data under RCP4.5 and RCP8.5 scenarios, also exploring their role in the decay of cultural heritage. The goal of the present work is to investigate extreme compound events at high resolution following a multi-hazard analysis considering their intensity and duration.
The novelty of the present study lies in its utilisation of the high-resolution climate dataset that is currently available for the area of Greece at 5 × 5 km2, aiming to (a) evaluate extreme multi-hazard scenarios under different return periods using the compounded intensity–duration curve-based methodology and (b) investigate the projected effects of climate change on these curves for the first time.
The present work is also linked to the previous studies of [16,31], using the same high-resolution products for multi-hazard risk assessments in Greece. More specifically, the first study was related to identifying areas exposed to multiple climate hazards in Greece, by generating multi-hazard risk maps in the future under RCP8.5 scenarios. Those findings highlighted that the impact of global warming on the country would become more evident by the end of the century, when the extreme maximum temperature would be the most important factor against all other hazards. In addition, other predominant hazards were identified, such as extreme precipitation in the eastern mainland coasts and windstorms over Crete, the Aegean, and Ionian Seas. The study by [31] introduced a multi-hazard scenario methodology, incorporating different climate hazards based on common selection parameters, by considering intensity, duration, and different return periods (IDRPs) applied in various Greek cities to assess the risk of occurrence of extreme events in both historical and future periods under RCP8.5. It must be emphasised that high-quality, high-resolution long-term data is required to capture the spatial patterns of surface variables to estimate future changes in IDF curves, as the study by [32] demonstrated.
Hence, in this work, a new methodology is proposed based on an integrated approach to assess multi-hazard risks by examining the intensity and duration of extreme values of surface variables that occur in the same time window (e.g., dates of the year) with a specific hazard (e.g., a heat wave with strong winds) in a specific area. Presenting comprehensive data on climate extremes, especially over specific regions of Greece, at the local level for use in planning and climate change assessment is another objective of this work. This is important because of the country’s diverse local climate patterns due to a complex topography, which includes high orography that alternates with valleys, numerous islands of varying sizes, and a meandering coastline. The suggested methodology thus uses daily time series from high-resolution climate simulations to investigate multi-hazard intensities in a few selected locations with varying climate conditions during the historical period (1980–2004) and two time slices of future periods (near period: 2025–2049 and far period: 2075–2099), under RCP8.5. Depending on local climate conditions, the findings of this study can offer a deeper understanding of how different hazards are interrelated under seasonal variation and how they are projected to change locally. A description of the methodology, data provision, and information about the investigated areas is given in Section 2. Section 3 presents and describes in detail the results of the study by major hazard. The final section summarises the results and reports on the study’s key conclusions.
2. Materials and Methods
2.1. Study Area
As previously mentioned, Greece is one of the most mountainous countries in Europe, with nearly 80% of its land covered with high mountains and hills [50]. In addition, the extensive coastline and thousands of islands and islets create a mosaic of climate patterns that require careful study and close observation in the context of climate change. For this work, six representative locations (Figure 1) were selected from the Greek region, each representing a distinct climate due to its proximity to the sea, elevation, and geographical orientation.
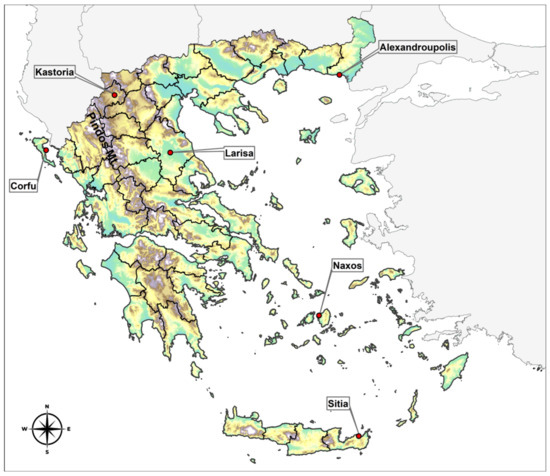
Figure 1.
Topographical map and regional units (black border lines) of Greece, with the studied locations of the nearest grid point to weather stations.
2.2. Data Provision
For each location, historical and future daily datasets of maximum near surface air temperature (TX, °C), minimum near surface air temperature (TN, °C), wind speed (WS, m/s), and total precipitation (RR, mm) were provided from long-term climate simulations with the use of the non-hydrostatic Weather Research and Forecasting model (WRF/ARW, v3.6.1) [51,52]. The WRF model dynamically downscaled EC-EARTH [53] global climate simulations for the RCP8.5 scenario to produce these high-resolution datasets of 5 km horizontal resolution for the area of Greece. Validation studies of the climate datasets with the available meteorological data from the Hellenic National Meteorological Service (HNMS) have been carried out previously by [14,54,55] and included in detail the overall description of the procedure, model setup, and results of the model performance with statistical indices. These studies demonstrated the model’s ability to accurately reproduce historical spatial and temporal climate patterns of surface variables, establishing its credibility for climate projections. Lastly, each location’s time series has been extracted using the model’s closest grid point to the HNMS station in the high-resolution domain of Greece.
2.3. Description of the Methodology
The compiled methodology aims to investigate the return level values of 20- and 50-year periods of specific hazards in selected time slices of different durations and the extreme values of other surface variables concurrently emerging in the same time windows. This study focuses on the derivation of extreme multi-hazard scenarios based on the calculation of intensity, duration, and return period of the variables examined.
The analysis focuses on four key climate variables (TX, TN, WS, and RR), each of which can be strongly associated with a climate hazard (or a primary hazard). The extreme values of the aforementioned meteorological parameters in the return period studied represent the intensity of the associated hazard (or secondary hazard). The abbreviation of each hazard is summarised in Table 1.

Table 1.
Hazard’s description per variable.
The methodology is illustrated in the workflow diagram of Figure 2 and explained in numbered steps below, considering, as an example, TX as the primary hazard and TN, WS, and RR as compounded hazards.
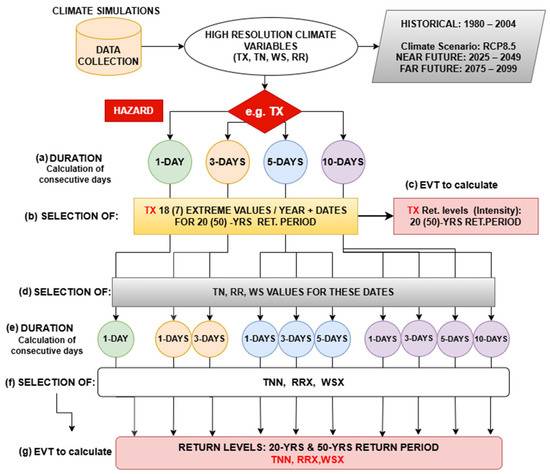
Figure 2.
Workflow of the calculation steps of the methodology followed for the case of the TX hazard.
- (a)
- Duration of primary hazard: Four distinct time series were produced from the initial daily time series dataset for each location, as shown in Figure 2, for the variable chosen as the primary hazard (e.g., TX). These time series represented four different durations (expressed as number of days), which were determined by the moving average ranging from one to ten consecutive days (for 1-, 3-, 5-, and 10-consecutive days). This was carried out for every examined variable, though it should be noted that only the precipitation duration was calculated using moving cumulative values. The calculation of consecutive days for 1-day, 3-day, 5-day, and 10-day duration was based on (1) fixed duration for precipitation that are of relevance to relevant applications, suggested by the joint CCl/CLIVAR/JCOMM Expert Team (ET) on Climate Change Detection and Indices (ETCCDI, https://etccdi.pacificclimate.org/indices.shtml, accessed on 15 June 2015) (e.g., Rx 1 day, Rx 5 day for precipitation); (2) the definition of heatwaves in Greece by the Hellenic National Meteorological Service—HNMS with 1 day of unusual values of TX or/and by [7] that proposed TX value based on at least 3 consecutive days, and finally; (3) the 10-day duration (10 consecutive days) for taking into consideration prolonged events characterised by unusual values during a long-term period (e.g., heatwaves by WMO).
- (b)
- Selection based on the return period: Subsequently, for each of the above durations, it was necessary to specify the dates that reflect the intensity for the 20- and 50-year return periods of TX. To increase the dataset size, instead of using the block maxima method to obtain the annual maxima, we assumed that the 20-year period corresponded to 5% of the highest values per year (365 days), which counts about 18 dates (e.g., the 18 highest TX values with their dates in each year correspond to a total of 450). Similarly, the 50-year return period corresponds to 2% of the highest values per year (7 highest values and dates in each year, corresponding to a total of 175).
- (c)
- EVT: The return levels for the 20- and 50-year return periods of TX were calculated by applying EVT to these datasets. The calculation of the variables’ extreme values was performed using the fitted Generalised Extreme Value distribution (GEV), a commonly used EVT method for estimating extreme weather events. The methodology of GEV distribution for multi-hazard scenarios has been described in detail in the study by Sfetsos et al., 2023 [31].
- (d)
- Selection based on the corresponding dates: For each of these dates derived, the corresponding daily TN, WS, and RR values of the initial dataset were selected with a 3-, 5-, and 10-consecutive-day window (considering as the last entry in the time window the selected date) for each year.
- (e)
- Duration of the compounded hazard: Then, the 1-, 3-, 5-, and 10-consecutive-day rolling means for the TN and WS and the rolling sum for the RR were calculated within each consecutive day window, representing four different durations for these three variables.
- (f)
- Selection of extreme values of the compounded hazard: The next step involved the selection of the extreme values for each variable corresponding to the compounded hazard (TN, WS, and RR), for each time window. To facilitate the discussion, we denoted “TNN” as the minimum of the TN, “RRX” as the maximum of RR, and “WSX” as the maximum of WS, respectively.
- (g)
- EVT: Finally, the process involved calculating the return levels—intensity values—for each of the TNN, WSX, and RRX durations. These were initially determined for a 20-year return period and then for a 50-year return period associated with the respective TX durations. The same procedure was followed for the historical and future periods. Therefore, the multi-hazard scenarios of compounded extremes for the two return periods under consideration were represented by the datasets produced by calculating the TX intensity values for four time windows (1-, 3-, 5-, and 10-consecutive days) and the respective TNN, WSX, and RRX values.
2.4. Percentiles Analysis
Finally, additional analysis was conducted to investigate the temporal occurrence of compounded multi-hazards that include extreme RR and WS associated with the secondary hazards of TX and TN. Firstly, the methodology described in the previous section was applied to obtain the 1- and 10-day time series for the variable chosen as the primary hazard, i.e., RR or WS (step (a)). Then, the maximum RR or WS values were selected by applying step (b) (i.e., 450 and 175 values), followed by the identification of dates corresponding to each of these values. Further on, the TX and TN values were drawn corresponding to the dates identified previously (step (d)). The data analysis was concluded by calculating the extreme percentiles, i.e., the 5th of TN and the 95th of TX, for the 1- and 10-day time series. In that manner, the compounded hazards related to temperature extreme percentiles were the combinations of extreme precipitation events with (a) the 5th percentile of TN and (b) the 95th of TX, and extreme wind events with (c) the 5th percentile of TN and (d) the 95th of TX. Those results, due to limited space, were included in the Appendix—Table A1.
3. Results and Discussion
In the following subsections, the results of the applied methodology are discussed for the 20-year and 50-year return periods during the historical, near-, and far-future periods under RCP8.5, according to the primary hazard (i.e., TX, TN, RR, and WS). Due to space limitations, only the case study of Sitia (see Figure 1 for location) is illustrated in the main text. This region has intense local-scale weather patterns due to highly complex topography and air–sea interaction with rapidly changing climate extreme characteristics (e.g., heatwaves and heavy thunderstorms). The Supplementary Material (SM) contains the figures for the remaining locations (e.g., Alexandroupolis, Kastoria, Larissa, Naxos, and Corfu). The main article also discusses some interesting results concerning the other locations shown in Appendix A.
3.1. Analysis per Primary Hazard
3.1.1. Primary Hazard: Extreme Values of TX
In the first subsection, the results of the multi-hazard assessment for Sitia are presented based on the extreme values for the different TX durations, considered as a primary hazard and the durations of the extreme values of the secondary compounded hazards, TNN, WSX, and RRX, shown in Figure 3, Figure 4 and Figure 5, respectively.
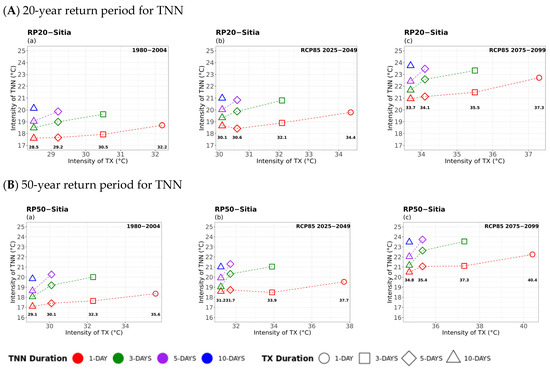
Figure 3.
Multi-hazard results based on extreme values (x-axis) for four different durations (consecutive days) of TX, as 1 day (circle), 3 days (square), 5 days (rhombus), and 10 days (triangle) along with the extreme values (y-axis) of the four different durations (1 day in red, 3 days in green, 5 days in purple, and 10 days in blue colour) for TNN of 20- (top) and 50-year (bottom) periods for (a) historical, (b) near future, and (c) far future periods. The return levels of the examined return periods for each TX duration are marked inside figures in bold.
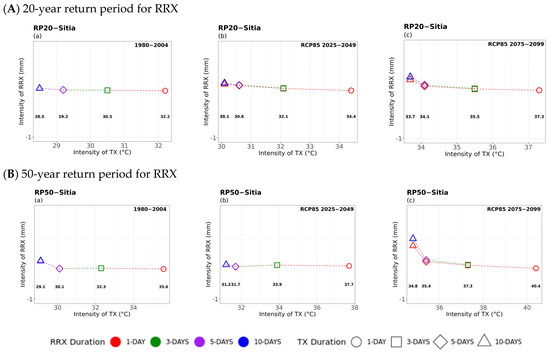
Figure 4.
Multi-hazard results based on extreme values (x-axis) for four different durations (consecutive days) of TX, as 1 day (circle), 3 days (square), 5 days (rhombus), and 10 days (triangle) along with the extreme values (y-axis) of the four different durations (1 day in red, 3 days in green, 5 days in purple, and 10 days in blue colour) of 20- (top) and 50-year (bottom) periods for RRX for (a) historical, (b) near future, and (c) far future periods. The return levels of the examined return periods for each TX duration are marked inside figures in bold.
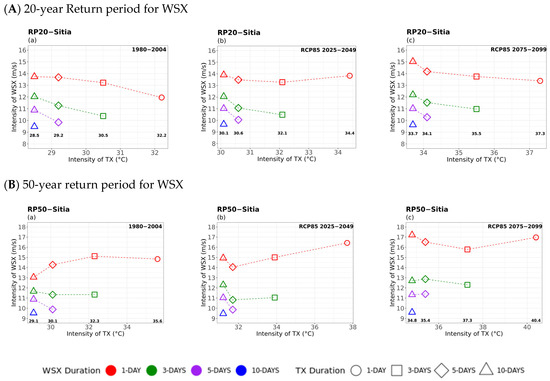
Figure 5.
Multi-hazard results based on extreme values (x-axis) for four different durations (consecutive days) of TX, as 1 day (circle), 3 days (square), 5 days (rhombus), and 10 days (triangle) along with the extreme values (y-axis) of the four different durations (1 day in red, 3 days in green, 5 days in purple, and 10 days in blue colour) of 20- (top) and 50-year (bottom) periods for WSX for (a) historical, (b) near future, and (c) far future periods. The return levels of the examined return periods for each TX duration are marked inside figures in bold.
TX–TNN Compounded Hazards
In general, similar patterns are seen between the corresponding periods in the 20- and 50-year return levels of TNN versus TX. Events of longer duration of TX were found to be associated with lower TNN return values that lasted a shorter time (e.g., 1 day and red curves). The impact of climate change on extreme hot events compounded with extreme minimum temperatures was evidenced by the increasing TX and TNN return levels for all durations, particularly in the 50-year return period and in the far future. The most important increases in TX and TNN return levels were seen in inland locations like Larissa (central mainland) and Kastoria (northern part of Greece), particularly in the far-future period. Overall, those results indicated a prolonged duration of tropical nights, which increases further in the far future, as TNN yielded values above 20 °C in all locations except for Kastoria (northern mountainous area), (Figure A1). For instance, in the case of Sitia, where 5-day and 10-day durations with TX values above 30 °C and 5-day and 10-day durations of TNN values above 20 °C were found in the near future, while both intensity values were seen to sharply increase in the far future. The increase in tropical nights and hot days is consistent with the findings of Politi et al. (2022) [14] who analysed the same datasets and found that, under RCP8.5, there was a notable increase in more than 40 days for both future periods throughout the entire country. Moreover, Founda et al. (2019 [56]) found an increase in hot extreme seasons by two months in terms of tropical nights for 2071–2100 under RCP8.5.
TX–RRX Compounded Hazards
The 20- and 50-year return values of extreme precipitation compounded with maximum temperatures, as illustrated in Figure 4, were almost insignificant and below 1 mm during the historical and future periods, with a minor increase during the longest events of 10-day TX duration in the far future period.
The analysis of RRX return levels compounded with TX concerning all locations showed that the lowest values were observed in Sitia and Naxos, where, according to HNMS, the lowest average annual precipitation values are usually found in that region (i.e., the southeastern–southern–central Aegean Sea, particularly, during summer). This outcome is in agreement with [57] where it was highlighted that the specific area would face prolonged and severe drought events, threatening water resource availability in the near- and far future due to climate change. Similarly, no extreme hot and wet events were projected in Corfu. The case of Kastoria yielded the highest changes in RRX for 10-day extreme temperature events of about 15% and 55% in the 20- and 50-year return periods, respectively. This demonstrates the occurrence of orographic rainfall during extreme hot events in mountainous areas in the summer. Overall, in inland and mountainous locations, extreme precipitation events presented higher values for longer TX events in all periods. In general, the increase in temperature and decrease in precipitation in the Mediterranean region are caused by a mechanism under the influence of global warming, as reported in the study by [58]. The process is described by the increased intensification of anticyclonic circulation of the Azores and the horizontal transfer of dry and warm air masses towards the central and eastern Mediterranean regions during the summer period. Moreover, changes in the synoptic atmospheric patterns of air mass flow were reported in the study by [11,59], which showed a projected decrease in cyclonic activity moving over the Mediterranean region, with an increasing number of events characterised by southerly air warm masses (causing heatwaves and Saharan dust transport) under RCP8.5 at the end of the twenty-first century.
TX–WSX Compounded Hazards
Considering extreme wind speed (WSX) as a compounded hazard of maximum temperature in Sitia (Figure 5), there were some discernible increases from the historical to future periods, particularly in the far future and for the 50-year WSX return levels. It can be noted that the most impacted hotter and windier events were projected to be those with maximum winds lasting 1 day (red curves). Comparison of the corresponding results from the other locations revealed a similar behaviour in the projected extreme winds compounded with hot temperature extremes for all durations. Furthermore, the most significant increases were found in the 50-year WSX return levels with much higher temperature extremes for the more prolonged events occurring in the eastern parts of the country. These differentiations, probably explained by abrupt changes in the time series, could imply the non-stationary context [60] under a climate change regime. The multi-hazard risk is important for such events as extreme maximum temperatures coupled with extreme wind speeds and dry conditions (negligible or low precipitation amount) would increase fire weather risk [61] in forested areas, like Kastoria.
3.1.2. Primary Hazard: Extreme Values of TN
Figure 6, Figure 7 and Figure 8 depict the multi-hazard 20- and 50-year return period analysis for Sitia, based on extreme values for the different durations of TN and the extreme values for the different durations of the compounded hazards, in this case, TXX, WSX, and RRX, respectively.

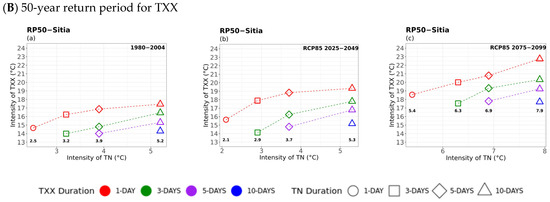
Figure 6.
Multi-hazard results based on extreme values (x-axis) for four different durations (consecutive days) of TN, as 1 day (circle), 3 days (square), 5 days (rhombus), and 10 days (triangle) along with the extreme values (y-axis) of the four different durations (1 day in red, 3 days in green, 5 days in purple, and 10 days in blue colour) of 20- (top) and 50-year (bottom) periods for TXX for (a) historical, (b) near future, and (c) far future periods. The return levels of the examined return periods for each TN duration are marked inside figures in bold.
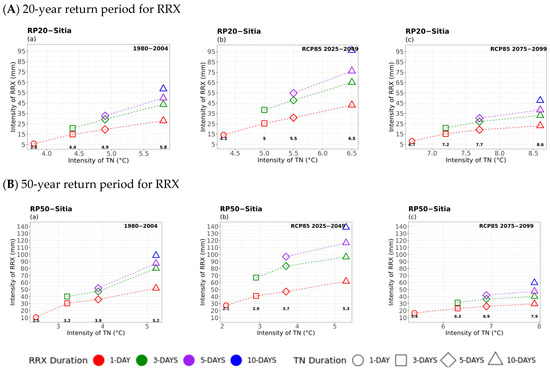
Figure 7.
Multi-hazard results based on extreme values (x-axis) for four different durations (consecutive days) of TN, as 1 day (circle), 3 days (square), 5 days (rhombus), and 10 days (triangle) along with the extreme values (y-axis) of the four different durations (1 day in red, 3 days in green, 5 days in purple, and 10 days in blue colour) of 20- (top) and 50-year (bottom) periods for RRX for (a) historical, (b) near future, and (c) far future periods. The return levels of the examined return periods for each TN duration are marked inside the figures in bold.
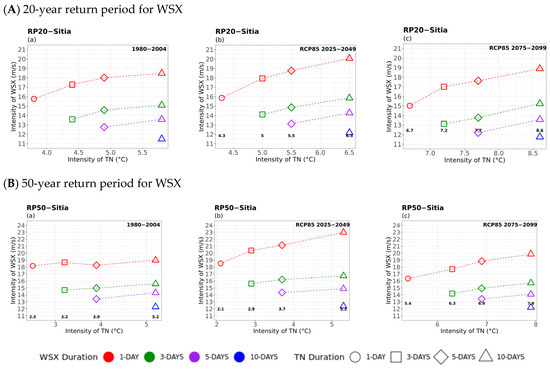
Figure 8.
Multi-hazard results based on extreme values (x-axis) for four different durations (consecutive days) of TN, as 1 day (circle), 3 days (square), 5 days (rhombus), and 10 days (triangle) along with the extreme values (y-axis) of the four different durations (1 day in red, 3 days in green, 5 days in purple, and 10 days in blue colour) of 20- (top) and 50-year (bottom) periods for WSX for (a) historical, (b) near future, and (c) far future periods. The return levels of the examined return periods for each TN duration are marked inside the figures in bold.
TN–TXX Compounded Hazards
Initially, it was observed that due to climate change, higher TN intensities, i.e., warmer minimum temperatures, were calculated between the historical and future periods, compounded with higher 20- and 50-year TXX return levels, particularly for cold events of short duration (Figure 6). Overall, more extreme (lower) values of TN were observed for the 50-year return period compared to the 20-year return period. In general, a significant increase in extreme intensity values of both TXX and TN was observed, particularly in the far future. The lowest extreme minimum temperatures compounded with maximum temperatures of all durations were observed in areas located in Central and Northern Greece, e.g., in Alexandroupolis, Kastoria, and Larissa (Figure A2), as the mountainous terrain contributes to the decrease in air temperature from the coast to the interior. As a whole, extreme cold events of all studied durations compounded with warm temperatures were found to become less intense in the future.
TN–RRX Compounded Hazards
Considering precipitation as a secondary hazard (Figure 7), noticeable amounts of RRX were estimated to increase with TN duration in the historical period, particularly for TN events of 5- and 10-day durations. Also, higher RRX intensities were observed in the near future. Overall, the 5- and 10-day durations indicate that more intense and longer extreme rainy events may occur in the near future, accompanied by cold events. The increase in precipitation was also justified by the findings in the study by Politi et al. (2022) [14], where a positive change signal was observed in certain areas of the western parts of the mainland, the Ionian Islands (e.g., in Corfu), and parts of Crete in the near future. On the other hand, the results in the far future showed that RRX would decrease significantly, so that fewer cold and rainy extremes are likely to occur compared to the historical and near future periods. Similar patterns were found regarding the 50-year return period, but with higher values of RRX, compared to the 20-year return period, particularly in the historical and near-future periods. In general, the results of all case studies indicated that precipitation intensity is not expected to differ among different RRX durations, particularly when considering the 3- and 5-day RRX durations (green and purple colours) between the historical and future periods. However, the locations of Sitia and Naxos, representing the central and southern Aegean Sea, would be impacted by more intense and extended extreme rainfall–cold events.
TN–WSX Compounded Hazards
The analysis for compounded extreme winds with cold temperatures (Figure 8) showed that, for all periods examined, the 20- and 50-year return levels of extreme winds increased with increasing TN values (warmer minimum temperatures) and duration, and for a fixed WSX time window (same colour but different symbols). Similar WSX intensities were seen to prevail in the historical and near-future periods, but they were projected to decrease in the far future. Hence, extreme winds become more intense compounded with longer cold spells, albeit with warmer minimum temperatures. Finally, a notable increase in the 50-year return levels of extreme winds (red line) was observed for the longer cold spells (of 5- and 10-day durations) in the near future, compared to the historical period.
3.1.3. Primary Hazard: Extreme Values of RR
Figure 9, Figure 10 and Figure 11 show the multi-hazard results when considering extreme precipitation RR as the primary hazard and the examined compounded hazards, TXX, TNN, and WSX, respectively, for Sitia and the 20- and 50-year return periods.
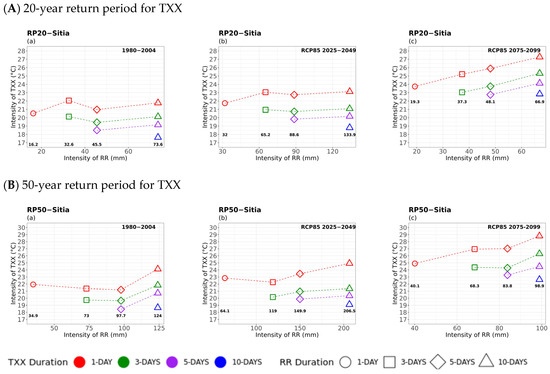
Figure 9.
Multi-hazard results based on extreme values (x-axis) for four different durations (consecutive days) of RR, as 1 day (circle), 3 days (square), 5 days (rhombus), and 10 days (triangle) along with the extreme values (y-axis) of the four different durations (1 day in red, 3 days in green, 5 days in purple, and 10 days in blue colour) of 20- (top) and 50-year (bottom) periods for TXX for (a) historical, (b) near future, and (c) far future periods. The return levels of the examined return periods for each RR duration are marked inside the figures in bold.
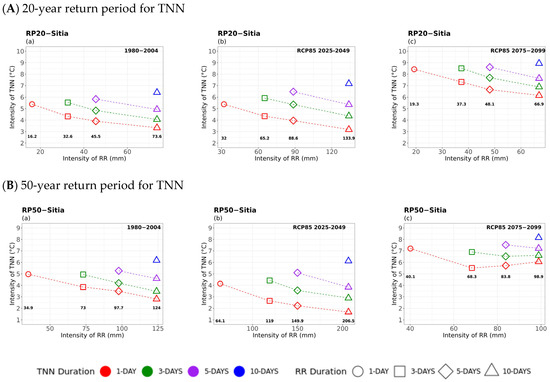
Figure 10.
Multi-hazard results based on extreme values (x-axis) for four different durations (consecutive days) of RR, as 1 day (circle), 3 days (square), 5 days (rhombus), and 10 days (triangle) along with the extreme values (y-axis) of the four different durations (1 day in red, 3 days in green, 5 days in purple, and 10 days in blue colour) of 20- (top) and 50-year (bottom) periods for TNN for (a) historical, (b) near future, and (c) far future periods. The return levels of the examined return periods for each RR duration are marked inside the figures in bold.

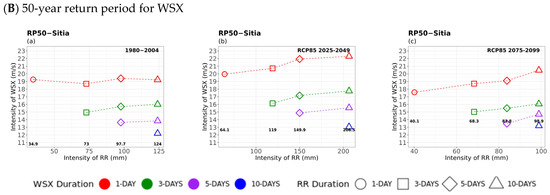
Figure 11.
Multi-hazard results based on extreme values (x-axis) for four different durations (consecutive days) of RR, as 1 day (circle), 3 days (square), 5 days (rhombus), and 10 days (triangle) along with the extreme values (y-axis) of the four different durations (1 day in red, 3 days in green, 5 days in purple, and 10 days in blue colour) of 20- (top) and 50-year (bottom) periods for WSX for (a) historical, (b) near future, and (c) far future periods. The return levels of the examined return periods for each RR duration are marked inside figures in bold.
RR–TXX Compounded Hazards
Observing the behaviour of curves in the 20-year return analysis (Figure 9), for a constant duration of extreme maximum temperatures, TXX values were seen to increase up to the 3-day duration precipitation events, decrease for the 5-day duration and then slightly increase again up to the 10-day duration precipitation events. A similar pattern of curves was observed in the near future, with a very slight increase in extreme maximum temperatures. However, the behaviour of TXX intensity curves was found to change notably in the far future, where extreme temperatures increased with the increasing duration of extreme rainfall events. In the case of the 50-year return period, TXX values increased significantly for extreme precipitation events of 5 to 10 days duration. The increasing pattern of extreme maximum temperatures with prolonged precipitation events was noticed in the near and far future. In addition, for this type of events, higher precipitation values were estimated in the near future compared to the historical and far future periods. These findings were in agreement with those of Politi et al. (2022) [14], where a positive change signal was observed in the precipitation and temperature patterns in certain areas of the western mainland, the Ionian islands, and parts of Crete in the near future, followed by a noticeable reduction in the far future under RCP8.5.
RR–TNN Compounded Hazards
Figure 10 shows the RR 20- and 50-year period results with TNN considered as a secondary hazard. In general, similar patterns of curves are observed between the 20- and 50-year return levels and the respective historical and future periods with comparable values in minimum temperatures. In general, for a given TNN time window (same colour curve), TNN values were found to decrease for an increasing RR duration. Thus, rainfall events of longer duration were found to be associated with lower minimum temperatures for all periods studied. Furthermore, the analysis for far-future events yielded significantly higher extreme minimum temperatures compounded with reduced precipitation for all rainfall durations compared to the historical and near-future periods. Such an outcome reveals the tendency for milder extreme minimum temperatures associated with lower rainfall amounts. That was also deduced for all locations studied, including the mountainous northern areas (Figure A3), where the extreme cold-wet compound events are more likely to occur [13,62]. The results highlight the impact of climate change across all geographic locations in the far future on this kind of compounded event characterised by milder extreme minimum temperatures and reduced precipitation.
The differences noted in the curves among the study areas in the case of RR–TNN compounded events (e.g., Alexandroupolis and Kastoria; see Figure A3) can be attributed to the influence of different atmospheric circulation patterns or cyclone tracks associated with extreme precipitation events, which vary among locations [63]. Several studies have examined these patterns and their roles in producing heavy rainfall across different regions of Greece. Iordanidou et al. (2015) [64] who analysed cyclones for 30 years, revealed that cyclones affecting Crete (Sitia’s case study) mainly originate from the northwest and the southwest, associated with strong and heavy rain events, during spring, followed by winter and autumn seasons. In the case of Sitia, extreme rainfall events compounded with extreme maximum temperatures usually occur in spring and autumn, and with extreme minimum temperatures during the winter season (details can be found in Table 1 in SM). On the other hand, Alexandroupolis could be affected by the Balkan or Mediterranean lows [65,66]. Moreover, it is noteworthy to highlight the effect of the north–south direction of the Pindos Mountain range, parallel to the coastline (see Figure 1), which significantly influences the spatial distribution of precipitation and associated intensities and durations, by dividing the country into high and low precipitation areas [67]. This orographic effect can enhance precipitation totals, especially in western and northern Greece [68].
RR–WSX Compounded Hazards
The investigation of rainy windstorms (Figure 11) showed that, for a given extreme wind duration, the 20- and 50-year WSX return levels increased notably with increasing rainfall intensity and duration in all periods studied. Events with a given rainfall intensity and duration were found to have extreme winds that became weaker as their duration increased. It was also deduced that the WSX return values decreased as their duration increased; hence, the strongest winds appeared to last for shorter periods (1 day) during extreme precipitation events in all periods. While a trend of increasing extreme winds during extreme precipitation events of a given duration was found from the historical to the near-future, the return values of extreme winds and rainfall significantly seemed to decrease in the far future.
3.1.4. Primary Hazard: Extreme Values of WS
The multi-hazard analysis was concluded with the investigation of the 20- and 50-year return levels of extreme winds of different durations compounded with the secondary hazards of TXX, TNN, and RRX as shown in Figure 12, Figure 13 and Figure 14, respectively, for the case of Sitia.

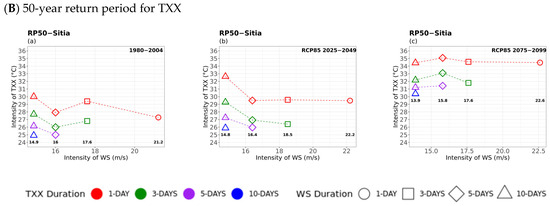
Figure 12.
Multi-hazard results based on extreme values (x-axis) for four different durations (consecutive days) of WS, as 1 day (circle), 3 days (square), 5 days (rhombus), and 10 days (triangle) along with the extreme values (y-axis) of the four different durations (1 day in red, 3 days in green, 5 days in purple, and 10 days in blue colour) of 20- (top) and 50-year (bottom) periods for TXX for (a) historical, (b) near future, and (c) far future periods. The return levels of the examined return periods for each WS duration are marked inside figures in bold.
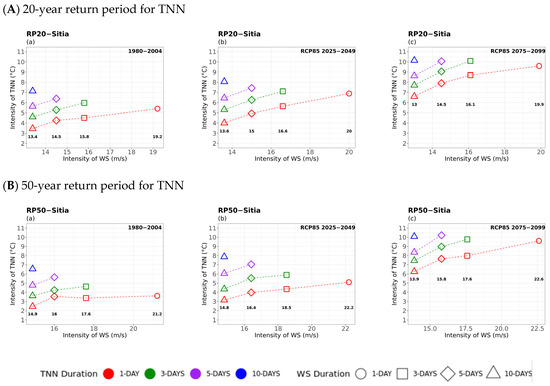
Figure 13.
Multi-hazard results based on extreme values (x-axis) for four different durations (consecutive days) of WS, as 1 day (circle), 3 days (square), 5 days (rhombus), and 10 days (triangle) along with the extreme values (y-axis) of the four different durations (1 day in red, 3 days in green, 5 days in purple, and 10 days in blue colour) of 20- (top) and 50-year (bottom) periods for TNN for (a) historical, (b) near future, and (c) far future periods. The return levels of the examined return periods for each WS duration are marked inside figures in bold.
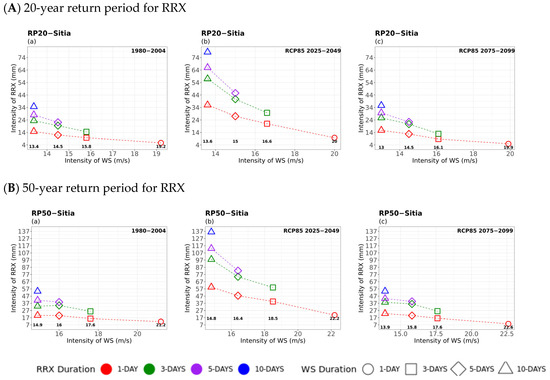
Figure 14.
Multi-hazard results based on extreme values (x-axis) for four different durations (consecutive days) of WS, as 1 day (circle), 3 days (square), 5 days (rhombus), and 10 days (triangle) along with the extreme values (y-axis) of the four different durations (1 day in red, 3 days in green, 5 days in purple, and 10 days in blue colour) of 20- (top) and 50-year (bottom) periods for RRX for (a) historical, (b) near future, and (c) far future periods. The return levels of the examined return periods for each WS duration, are marked inside figures in bold.
WS–TXX Compounded Hazards
In general, the 20- and 50-year TXX return values for fixed duration events in terms of temperature seemed to decrease slightly as extreme winds increased in intensity but decreased in duration. An important feature of the windy–hot extremes was that wind speed levels did not vary noticeably between the historical and future periods in the studied areas, while significant increases in extreme temperatures were projected everywhere particularly in the far future. Thus, the windy and hot extreme events particularly those of longer duration winds (5 and 10 days) are projected to become hotter due to climate change.
WS–TNN Compounded Hazards
According to Figure 13, windy cold spells of longer duration were found with higher extreme minimum temperatures and weaker winds. Overall, the results indicated an increase in 20- and 50-year TNN return levels for a given TNN duration with increasing wind speed, but of shorter duration during the historical period. The same pattern was also observed for both future periods, with progressively increasing extreme minimum temperatures toward the far future. Overall, while wind speed does not show any noticeable changes during extremely windy cold spells in the far future, extreme minimum temperatures tend to increase significantly in all geographic areas, including mountainous areas.
WS–RRX Compounded Hazards
Finally, the investigation of extremely windy and rainy events revealed lower 20- and 50-year RRX return values for shorter duration events, in all studied periods, as illustrated in Figure 14. An important finding is that there were no discernible differences in the levels of extreme precipitation and wind speed between the historical and far-future periods. However, in the near future, the events seemed to become more extreme in terms of precipitation (as already mentioned in previous discussions), while the winds remained at similar levels to the historical period. These results are overall comparable to the other studied areas.
3.2. Investigation of the Temporal Occurrence of Compounded Hazards Based on Temperature Extreme Percentiles
In the present section, RR and WS hazards compounded with temperature extremes were further analysed based on the dates corresponding to extreme percentiles, i.e., the 5th percentile of TN and the 95th percentile of TX over 1- and 10-day time windows to investigate their temporal occurrence for the 20- and 50-year return periods. The data analysis process was described in Section 2.4.
Initially, it should be mentioned that there were no noteworthy differences among the 1- and 10-day duration results, concerning all the examined compounded hazards. In general, the 5th TN percentile analysis, compounded with extreme precipitation events, indicated that the temporal occurrence of these compounded hazards occurred during winter (mainly), late autumn, and early spring months. Those results were consistent with the findings of the study by [1], according to which the extreme precipitation events were located in northern Greece during March–April, and in the rest of the mainland and islands during the winter months, especially in January and February. In the current analysis, the results did not show significant shifts in the temporal occurrence of the compounded events in the future. However, for the locations of Larissa (in central mainland) and Naxos Island (central Aegean Sea), some shifts have been observed from early spring or autumn months towards winter months in the far future, denoting a decrease in cold-wet extremes during the transitional seasons. Concerning the compounded hazards derived from the extreme (95th) percentile of TX along with extreme rainfall amounts, they were found to occur in the early autumn and spring months (and less frequently in the summer), often associated with thermal thunderstorms and convective storms over continental areas, as reported in the study by [9]. Only in the case of Alexandroupolis (northeastern mainland) has a shift been observed from autumn months towards summer months in the far future.
Overall, during the historical and future periods, the occurrence of extreme winds along with the extreme (95th) percentile of TX was observed mainly in the summer and early autumn months, related to the formation of the Etesian winds over the Aegean Sea [69], where the thermal low from southeast Asia extends westward and covers the Greek area, presenting characteristic zonal circulation at the upper levels over all of southern Europe and the Mediterranean Sea [66]. Moreover, future projections of these compounded events showed that their occurrence extended toward the spring or late autumn months, when windy conditions transfer warmer atmospheric masses from southern directions, favouring dust transport from North Africa. The latest finding was also verified in the study by [11]. Last, it is worth mentioning that the projected intensification of drought conditions in plain areas of major agriculture production (e.g., in Thessaly, central mainland, and the island of Crete) reported in [70] along with the increase in hot—windy extremes are expected to substantially increase the wildfire risk in those areas in the far future.
Finally, the analysis of the occurrence of extreme winds with extremely low temperature events revealed that these compounds were observed in winter months during the historical period, with no discernible differences in their occurrence in the future.
4. Conclusions
Extreme weather events are the leading global risk for environmental and infrastructure disasters and one of the critical challenges facing humanity over the next decade, according to the Global Risks Report 2025 [71]. Local risk assessment to support effective adaptation plans in Greece, which is located in the climate change hotspot region of the Mediterranean, demands detailed analysis of expected modifications in the patterns of extreme weather compound events. To serve this purpose a methodology for assessing the multi-hazard risks of climate extreme compound events was developed in this study, using daily time series of surface variables from high-resolution (5 km2) climate simulations such as wind speed, precipitation, and minimum and maximum temperatures. The investigation of compounded multi-hazard intensities was carried out for selected locations in Greece with different climate conditions during the historical and future periods under RCP8.5. The developed methodology in particular sought to investigate the return level values of 20- and 50-year periods of specific hazards of high importance in the region of different durations and the extreme values of other surface variables concurrently emerging in the same time windows. The results of the applied methodology showcased an increasing risk of compounded multi-hazard extreme events, particularly in the far future, depending on the local characteristics of the study areas.
In general, maximum temperature events of longer duration were found to be compounded with lower extreme minimum temperatures that had a short duration (1 day). The rising of compounded extreme maximum and minimum temperatures over all durations and time periods, but especially in the 50-year return period and far future, highlighted that climate change has an impact on these kinds of occurrences. Particularly toward the end of the century, northern and central mainland areas such as Kastoria and Larissa, respectively, would experience the most significant increases in compounded extreme temperatures under climate change. These results indicated a prolonged duration of compounded hot days and tropical nights with notable projected increases in temperatures in the far future.
Further on, future changes in compounded maximum temperature events with precipitation extremes revealed their dependence on the topography and geographic location. Overall, there were no notable extreme warm and wet events projected into the future, confirming the trend towards a warmer but drier period. Only in inland and mountainous locations were maximum temperature extremes of longer duration compounded with heavier precipitation found in all study periods.
In addition, the hotter and windier events most affected by climate change were projected to be those with maximum winds of short duration, such as 1 day. Also, the largest increases in 50-year return values of extreme wind speed were compounded with significantly increased temperature extremes of longer duration in the eastern parts of the country, making the region vulnerable to hot-windy extremes in the future.
The investigation of extreme cold events compounded with maximum temperatures showed that both maximum and minimum temperature extremes will increase significantly, particularly in the far future. Yet, these types of compound extremes were restricted in areas located in central and northern mainland (e.g., Alexandroupolis, Kastoria, and Larissa) in both future periods. The projections also showed that extreme cold events of all studied durations compounded with warm temperatures will become less intense in the future. Moreover, extreme cold events were compounded with more intense and prolonged rainy extremes (of 5- and 10-day durations) in the near future, while fewer extreme cold and rainy events are likely to occur in the far future compared to the historical and near future periods. However, the central and southern Aegean region will be impacted by more intense and prolonged extreme cold-precipitation events in the future under climate change. Moreover, it was found that despite the increase in minimum temperatures due to climate change, cold spells of longer duration will be compounded with more intense extreme winds, especially in the near future, with longer duration.
The analysis concerning precipitation extremes compounded with extreme maximum temperatures yielded a pattern of increasing temperatures with longer duration precipitation in the future. In particular, extreme precipitation events of 5 to 10 days duration will be compounded with significantly increased extreme temperatures, according to the analysis of the 50-year return levels.
Furthermore, the investigation of wet–cold extremes highlighted the impact of climate change on these compounds, across all geographic locations, characterised by milder minimum temperatures and significantly reduced precipitation in the far future. Overall, some differences noted in the return levels of extreme precipitation and temperatures and their duration among the study locations could be attributed to the influence of topography and different atmospheric circulation patterns or cyclone tracks associated with extreme precipitation events.
Also, events with a given rainfall intensity and duration were associated with extreme winds that became weaker with increasing duration. Projections of extreme precipitation and wind events showed that extreme winds would prevail for a shorter period of time (1 day). While a trend of increasing extreme winds during extreme precipitation events of a given duration was observed from the historical period to the near future, the return values of extreme winds and precipitation appeared to decrease significantly in the far future, indicating a potential alleviation of storms.
The study also revealed significant changes in the windy–hot compounded extremes, which were projected to become hotter, particularly those of longer wind duration (5 and 10 days), while wind speed values will remain at their historical levels.
No noticeable changes were observed in extremely windy–cold spells in the future, although extreme minimum temperatures tend to increase significantly for all durations and in all geographic areas, including mountainous areas, indicating milder compound events in terms of temperature. Regarding windy-rainy extremes, the projected wind speed values remain at similar levels to historical values, with compounded precipitation levels expected to become more extreme in the near future.
The investigation of the temporal occurrence of compounded hazards involving precipitation and wind with temperature extremes, based on temperature extreme percentiles, revealed no significant future shifts in the timing of these events for 20- and 50-year periods, with a few exceptions. These exceptions involved cold and wet extremes that were found to shift from early spring or autumn months towards winter months in the far future for the regions of central mainland and the central Aegean Sea, indicating a decrease in their occurrence during the transitional seasons. In addition, hot and wet extremes appear to be shifting from autumn to summer months in the northeastern mainland in the far future. Finally, the windy and hot extremes were projected to shift from spring months towards summer months in the far future in the region of the southern Aegean Sea.
The application of the presented methodology can be extended to different locations and regions, as long as sufficient and high-resolution long-term climate datasets exist to describe local climate as accurately as possible. Further investigation could be developed using relevant indices to estimate combined hazard extremes (e.g., Humidex, fire weather index, etc.) as future work. The interpretation of the results aimed to initially highlight the potential multi-hazards of extreme compounded events at a location for local risk assessment and eventually underline the need for domestic adaptation policies and measures for building a more resilient society under a changing climate.
Supplementary Materials
The following supporting information can be downloaded at: https://www.mdpi.com/article/10.3390/atmos16091007/s1.
Author Contributions
Conceptualization, A.S.; methodology, A.S.; software, N.P.; validation, D.V. and A.S.; formal analysis, N.P. and D.V.; investigation, A.S., N.P. and D.V.; data curation, N.P.; writing—original draft preparation, N.P.; writing—review and editing, D.V. and A.S.; visualisation, N.P.; supervision, D.V. and A.S. All authors have read and agreed to the published version of the manuscript.
Funding
This research was partially funded by the Regions4Climate (R4C) project, Grant Agreement 101093873 (HORIZON-MISS-2021-CLIMA-02).
Institutional Review Board Statement
Not applicable.
Informed Consent Statement
Not applicable.
Data Availability Statement
The data presented in this study are available on request from the corresponding author.
Acknowledgments
This work was supported by computational time granted from the Greek Research and Technology Network (GRNET) in the National HPC facility, ARIS, under projects ID HRCOG (pr004020) and HRPOG (pr006028).
Conflicts of Interest
The authors declare no conflicts of interest.
Appendix A
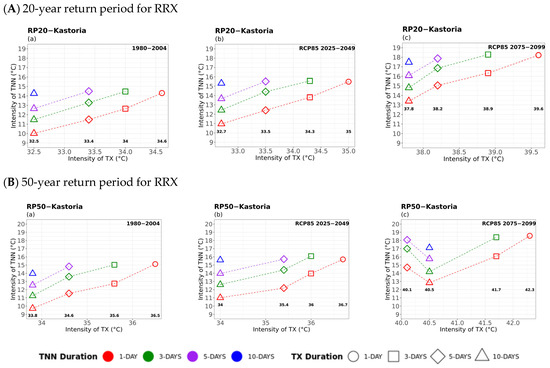
Figure A1.
A] 20-year (top) and B] 50-year (bottom) return period multi-hazard results based on extreme values (x-axis) for four different durations (consecutive days) of TX, as 1 day (circle), 3 days (square), 5 days (rhombus), and 10 days (triangle) along with the extreme values (y-axis) of the four different durations (1 day in red, 3 days in green, 5 days in purple, and 10 days in blue colour) of TNN for Kastoria, for (a) historical, (b) near future, and (c) far future periods. The return levels of the 20-year return period for each TX duration are marked inside the figures in bold.
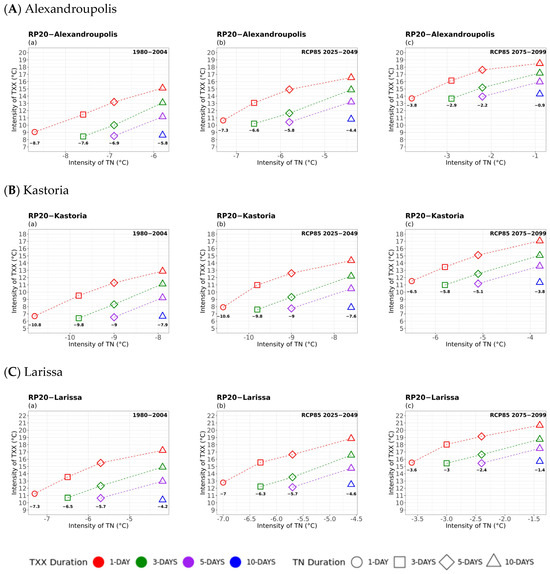
Figure A2.
20-year return period multi-hazard results based on extreme values (x-axis) for four different durations (consecutive days) of TN, as 1 day (circle), 3 days (square), 5 days (rhombus), and 10 days (triangle) along with the extreme values (y-axis) of the four different durations (1 day in red, 3 days in green, 5 days in purple, and 10 days in blue colour) for (A) Alexandroupolis (top), (B) Kastoria (middle) and (C) Larissa (bottom) for TXX for (a) historical, (b) near future, and (c) far future periods. The return levels of 20-year return period for each TX duration, are marked inside figures in bold.
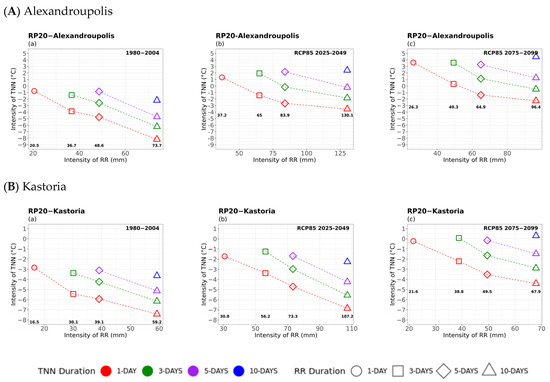
Figure A3.
20-year return period multi-hazard results based on extreme values (x-axis) for four different durations (consecutive days) of RR, as 1 day (circle), 3 days (square), 5 days (rhombus), and 10 days (triangle) along with the extreme values (y-axis) of the four different durations (1 day in red, 3 days in green, 5 days in purple, and 10 days in blue colour) for (A) Alexandroupolis (top) and (B) Kastoria (bottom) for TNN for (a) historical, (b) near future, and (c) far future periods. The return levels of 20-year return period for each RR duration, are marked inside figures in bold.

Figure A4.
20-year return period multi-hazard results based on extreme values (x-axis) for four different durations (consecutive days) of WS, as 1 day (circle), 3 days (square), 5 days (rhombus), and 10 days (triangle) along with the extreme values (y-axis) of the four different durations (1 day in red, 3 days in green, 5 days in purple, and 10 days in blue colour) for Corfu for (a) historical, (b) near future, and (c) far future periods. The return levels of 20-year return period for each WS duration are marked inside figures in bold.

Table A1.
Months characterised by the 5th and 95th percentiles extreme temperatures, TX and TN (as compounded hazards), per primary hazard RR and WS, for the 20- and 50-year return periods (rp20, rp50) of (a) 1-day and (b) 10-day duration, for historical, near (nf), and far future (ff) periods for each location.
| (a) | |||||||
| Historical | Near-Future | Far-Future | |||||
| RR | p5 ΤΝ | rp20 | rp50 | rp20 | rp50 | rp20 | rp50 |
| Alexandroupolis | January | December | November | December | December | March | |
| Corfu | November | January | December | December | January | January | |
| Larissa | January | March | December | February | November | November | |
| Naxos | January | March | March | December | February | January | |
| Kastoria | February | November | March | February | February | January | |
| Sitia | January | December | February | February | January | December | |
| p95 ΤΧ | |||||||
| Alexandroupolis | October | October | October | November | July | July | |
| Corfu | October | October | October | June | October | October | |
| Larissa | May | September | June | July | May | May | |
| Naxos | April | October | October | October | October | October | |
| Kastoria | June | June | May | July | July | August | |
| Sitia | April | April | March | March | November | April | |
| WS | p5 ΤN | hist | nf | ff | |||
| Alexandroupolis | January | January | February | January | January | January | |
| Corfu | December | December | February | February | February | January | |
| Larissa | December | March | April | March | March | February | |
| Naxos | February | December | December | March | February | February | |
| Kastoria | January | December | February | January | February | December | |
| Sitia | February | December | February | January | February | January | |
| p95 ΤΧ | |||||||
| Alexandroupolis | November | November | September | August | August | September | |
| Corfu | July | August | September | July | August | June | |
| Larissa | July | June | June | June | July | July | |
| Naxos | July | April | July | September | September | August | |
| Kastoria | May | April | June | May | May | June | |
| Sitia | May | April | April | April | July | July | |
| (b) | |||||||
References
- Antoniadou, M.; Anagnostopoulou, C. Study of the Seasonality of Extreme Precipitation Events over the Mediterranean for the Future Period 2081–2100. Environ. Sci. Proc. 2023, 26, 21. [Google Scholar] [CrossRef]
- Babaousmail, H.; Ayugi, B.; Rajasekar, A.; Zhu, H.; Oduro, C.; Mumo, R.; Ongoma, V. Projection of Extreme Temperature Events over the Mediterranean and Sahara Using Bias-Corrected CMIP6 Models. Atmosphere 2022, 13, 741. [Google Scholar] [CrossRef]
- Cos, J.; Doblas-Reyes, F.; Jury, M.; Marcos, R.; Bretonnière, P.-A.; Samsó, M. The Mediterranean Climate Change Hotspot in the CMIP5 and CMIP6 Projections. Earth Syst. Dyn. 2022, 13, 321–340. [Google Scholar] [CrossRef]
- Essa, Y.H.; Hirschi, M.; Thiery, W.; El-Kenawy, A.M.; Yang, C. Drought Characteristics in Mediterranean under Future Climate Change. npj Clim. Atmos. Sci. 2023, 6, 133. [Google Scholar] [CrossRef]
- Urdiales-Flores, D.; Zittis, G.; Hadjinicolaou, P.; Osipov, S.; Klingmüller, K.; Mihalopoulos, N.; Kanakidou, M.; Economou, T.; Lelieveld, J. Drivers of Accelerated Warming in Mediterranean Climate-Type Regions. npj Clim. Atmos. Sci. 2023, 6, 97. [Google Scholar] [CrossRef]
- Founda, D.; Katavoutas, G.; Pierros, F.; Mihalopoulos, N. Centennial Changes in Heat Waves Characteristics in Athens (Greece) from Multiple Definitions Based on Climatic and Bioclimatic Indices. Glob. Planet. Change 2022, 212, 103807. [Google Scholar] [CrossRef]
- Kotroni, V.; Bezes, A.; Dafis, S.; Founda, D.; Galanaki, E.; Giannaros, C.; Giannaros, T.; Karagiannidis, A.; Koletsis, I.; Kyros, G.; et al. Long-Term Statistical Analysis of Severe Weather and Climate Events in Greece. Atmosphere 2025, 16, 105. [Google Scholar] [CrossRef]
- Lagouvardos, K.; Dafis, S.; Kotroni, V.; Kyros, G.; Giannaros, C. Exploring Recent (1991–2020) Trends of Essential Climate Variables in Greece. Atmosphere 2024, 15, 1104. [Google Scholar] [CrossRef]
- Varlas, G.; Stefanidis, K.; Papaioannou, G.; Panagopoulos, Y.; Pytharoulis, I.; Katsafados, P.; Papadopoulos, A.; Dimitriou, E. Unravelling Precipitation Trends in Greece since 1950s Using ERA5 Climate Reanalysis Data. Climate 2022, 10, 12. [Google Scholar] [CrossRef]
- Georgoulias, A.K.; Akritidis, D.; Kalisoras, A.; Kapsomenakis, J.; Melas, D.; Zerefos, C.S.; Zanis, P. Climate Change Projections for Greece in the 21st Century from High-Resolution EURO-CORDEX RCM Simulations. Atmos. Res. 2022, 271, 106049. [Google Scholar] [CrossRef]
- Karozis, S.; Sfetsos, A.; Gounaris, N.; Vlachogiannis, D. An Assessment of Climate Change Impact on Air Masses Arriving in Athens, Greece. Theor. Appl. Climatol. 2021, 145, 501–517. [Google Scholar] [CrossRef]
- Katopodis, T.; Markantonis, I.; Vlachogiannis, D.; Politi, N.; Sfetsos, A. Assessing Climate Change Impacts on Wind Characteristics in Greece through High Resolution Regional Climate Modelling. Renew. Energy 2021, 179, 427–444. [Google Scholar] [CrossRef]
- Markantonis, I.; Vlachogiannis, D.; Sfetsos, A.; Kioutsioukis, I. Investigation of the Extreme Wet–Cold Compound Events Changes between 2025–2049 and 1980–2004 Using Regional Simulations in Greece. Earth Syst. Dyn. 2022, 13, 1491–1504. [Google Scholar] [CrossRef]
- Politi, N.; Vlachogiannis, D.; Sfetsos, A.; Nastos, P.T. High Resolution Projections for Extreme Temperatures and Precipitation over Greece. Clim. Dyn. 2022, 61, 633–667. [Google Scholar] [CrossRef]
- Varotsos, K.V.; Karali, A.; Lemesios, G.; Kitsara, G.; Moriondo, M.; Dibari, C.; Leolini, L.; Giannakopoulos, C. Near Future Climate Change Projections with Implications for the Agricultural Sector of Three Major Mediterranean Islands. Reg. Environ. Change 2021, 21, 16. [Google Scholar] [CrossRef]
- Vlachogiannis, D.; Sfetsos, A.; Markantonis, I.; Politi, N.; Karozis, S.; Gounaris, N. Quantifying the Occurrence of Multi-Hazards Due to Climate Change. Appl. Sci. 2022, 12, 1218. [Google Scholar] [CrossRef]
- Zanis, P.; Georgoulias, A.K.; Velikou, K.; Akritidis, D.; Kalisoras, A.; Melas, D. Future Projections of Precipitation Extremes for Greece Based on an Ensemble of High-Resolution Regional Climate Model Simulations. Atmosphere 2024, 15, 601. [Google Scholar] [CrossRef]
- Grünthal, G.; Thieken, A.H.; Schwarz, J.; Radtke, K.S.; Smolka, A.; Merz, B. Comparative Risk Assessments for the City of Cologne—Storms, Floods, Earthquakes. Nat. Hazards 2006, 38, 21–44. [Google Scholar] [CrossRef]
- Mazdiyasni, O.; Sadegh, M.; Chiang, F.; AghaKouchak, A. Heat Wave Intensity Duration Frequency Curve: A Multivariate Approach for Hazard and Attribution Analysis. Sci. Rep. 2019, 9, 14117. [Google Scholar] [CrossRef]
- Maurya, H.K.; Joshi, N.; Suryavanshi, S. Change in High-Temperature Intensity-Duration-Frequency under Different Warming Scenarios over India. Atmos. Res. 2024, 309, 107567. [Google Scholar] [CrossRef]
- Ragno, E.; AghaKouchak, A.; Love, C.A.; Cheng, L.; Vahedifard, F.; Lima, C.H.R. Quantifying Changes in Future Intensity-Duration-Frequency Curves Using Multimodel Ensemble Simulations. Water Resour. Res. 2018, 54, 1751–1764. [Google Scholar] [CrossRef]
- Lee, R.; White, C.J.; Adnan, M.S.G.; Douglas, J.; Mahecha, M.D.; O’Loughlin, F.E.; Patelli, E.; Ramos, A.M.; Roberts, M.J.; Martius, O.; et al. Reclassifying Historical Disasters: From Single to Multi-Hazards. Sci. Total Environ. 2024, 912, 169120. [Google Scholar] [CrossRef]
- Gupta, A.K.; Negi, M.; Nandy, S.; Kumar, M.; Singh, V.; Valente, D.; Petrosillo, I.; Pandey, R. Mapping Socio-Environmental Vulnerability to Climate Change in Different Altitude Zones in the Indian Himalayas. Ecol. Indic. 2020, 109, 105787. [Google Scholar] [CrossRef]
- Gill, J.C.; Malamud, B.D. Reviewing and Visualizing the Interactions of Natural Hazards. Rev. Geophys. 2014, 52, 680–722. [Google Scholar] [CrossRef]
- Ming, X.; Xu, W.; Li, Y.; Du, J.; Liu, B.; Shi, P. Quantitative Multi-Hazard Risk Assessment with Vulnerability Surface and Hazard Joint Return Period. Stoch. Environ. Res. Risk Assess. 2015, 29, 35–44. [Google Scholar] [CrossRef]
- Laino, E.; Iglesias, G. Multi-Hazard Assessment of Climate-Related Hazards for European Coastal Cities. J. Environ. Manag. 2024, 357, 120787. [Google Scholar] [CrossRef]
- de La Cruz Coronas, A.; Russo, B.; Evans, B.; Truchi, A.; Leone, M.; Buegelmayer-Blaschek, M.; de La Cruz Coronas, A.; Russo, B.; Evans, B.; Truchi, A.; et al. An Approach to Modeling Interactions between Extreme Weather Events during Multi-Hazard Events. In Proceedings of the EGU General Assembly Conference Abstracts, Vienna, Austria, 14–19 April 2024; p. 20217. [Google Scholar] [CrossRef]
- Laino, E.; Paranunzio, R.; Iglesias, G. Scientometric Review on Multiple Climate-Related Hazards Indices. Sci. Total Environ. 2024, 945, 174004. [Google Scholar] [CrossRef]
- Stalhandske, Z.; Steinmann, C.B.; Meiler, S.; Sauer, I.J.; Vogt, T.; Bresch, D.N.; Kropf, C.M. Global Multi-Hazard Risk Assessment in a Changing Climate. Sci. Rep. 2024, 14, 5875. [Google Scholar] [CrossRef]
- Sutanto, S.J.; Janssen, M.; de Brito, M.M.; del Pozo Garcia, M. The Effect of Wildfires on Flood Risk: A Multi-Hazard Flood Risk Approach for the Ebro River Basin, Spain. Nat. Hazards Earth Syst. Sci. 2024, 24, 3703–3721. [Google Scholar] [CrossRef]
- Sfetsos, A.; Politi, N.; Vlachogiannis, D. Multi-Hazard Extreme Scenario Quantification Using Intensity, Duration, and Return Period Characteristics. Climate 2023, 11, 242. [Google Scholar] [CrossRef]
- Kourtis, I.M.; Tsihrintzis, V.A.; Baltas, E. A Robust Approach for Comparing Conventional and Sustainable Flood Mitigation Measures in Urban Basins. J. Environ. Manag. 2020, 269, 110822. [Google Scholar] [CrossRef]
- Zscheischler, J.; Westra, S.; Van Den Hurk, B.J.J.M.; Seneviratne, S.I.; Ward, P.J.; Pitman, A.; Aghakouchak, A.; Bresch, D.N.; Leonard, M.; Wahl, T.; et al. Future Climate Risk from Compound Events. Nat. Clim. Chang. 2018, 8, 469–477. [Google Scholar] [CrossRef]
- Fan, F.; Bradley, R.S.; Rawlins, M.A. Climate Change in the Northeastern US: Regional Climate Model Validation and Climate Change Projections. Clim. Dyn. 2014, 43, 145–161. [Google Scholar] [CrossRef]
- Seneviratne, S.; Nicholls, N.; Easterling, D.; Goodess, C.; Kanae, S.; Kossin, J.; Luo, Y.; Marengo, J.; McInnes, K.; Rahimi, M.; et al. Changes in Climate Extremes and Their Impacts on the Natural Physical Environment. In Managing the Risks of Extreme Events and Disasters to Advance Climate Change Adaptation. A Special Report of Working Groups I and II of the Intergovernmental Panel on Climate Change (IPCC); Cambridge University Press: Cambridge, UK; New York, NY, USA, 2012; pp. 109–230. [Google Scholar] [CrossRef]
- Leonard, M.; Westra, S.; Phatak, A.; Lambert, M.; van den Hurk, B.; McInnes, K.; Risbey, J.; Schuster, S.; Jakob, D.; Stafford-Smith, M. A Compound Event Framework for Understanding Extreme Impacts. Wiley Interdiscip. Rev. Clim. Change 2014, 5, 113–128. [Google Scholar] [CrossRef]
- Willems, P. Compound Intensity/Duration/Frequency-Relationships of Extreme Precipitation for Two Seasons and Two Storm Types. J. Hydrol. 2000, 233, 189–205. [Google Scholar] [CrossRef]
- Sadegh, M.; Moftakhari, H.; Gupta, H.V.; Ragno, E.; Mazdiyasni, O.; Sanders, B.; Matthew, R.; AghaKouchak, A. Multihazard Scenarios for Analysis of Compound Extreme Events. Geophys. Res. Lett. 2018, 45, 5470–5480. [Google Scholar] [CrossRef]
- Xu, K.; Zhuang, Y.; Bin, L.; Wang, C.; Tian, F. Impact Assessment of Climate Change on Compound Flooding in a Coastal City. J. Hydrol. 2023, 617, 129166. [Google Scholar] [CrossRef]
- Doshi, S.C.; Lohmann, G.; Ionita, M. Hotspot Movement of Compound Events on the Europe Continent. Sci. Rep. 2023, 13, 18100. [Google Scholar] [CrossRef] [PubMed]
- Ghanbari, M.; Dell, T.; Saleh, F.; Chen, Z.; Cherrier, J.; Colle, B.; Hacker, J.; Madaus, L.; Orton, P.; Arabi, M. Compounding Effects of Changing Sea Level and Rainfall Regimes on Pluvial Flooding in New York City. Nat. Hazards 2024, 120, 6377–6400. [Google Scholar] [CrossRef]
- Manning, C.; Widmann, M.; Bevacqua, E.; Van Loon, A.F.; Maraun, D.; Vrac, M. Soil Moisture Drought in Europe: A Compound Event of Precipitation and Potential Evapotranspiration on Multiple Time Scales. J. Hydrometeorol. 2018, 19, 1255–1271. [Google Scholar] [CrossRef]
- Sutanto, S.J.; Vitolo, C.; Di Napoli, C.; D’Andrea, M.; Van Lanen, H.A.J. Heatwaves, Droughts, and Fires: Exploring Compound and Cascading Dry Hazards at the Pan-European Scale. Environ. Int. 2020, 134, 105276. [Google Scholar] [CrossRef]
- Zhang, W.; Luo, M.; Gao, S.; Chen, W.; Hari, V.; Khouakhi, A. Compound Hydrometeorological Extremes: Drivers, Mechanisms and Methods. Front. Earth Sci. 2021, 9, 673495. [Google Scholar] [CrossRef]
- Lazoglou, G.; Anagnostopoulou, C. Joint Distribution of Temperature and Precipitation in the Mediterranean, Using the Copula Method. Theor. Appl. Clim. 2019, 135, 1399–1411. [Google Scholar] [CrossRef]
- Vogel, J.; Paton, E.; Aich, V. Seasonal Ecosystem Vulnerability to Climatic Anomalies in the Mediterranean. Biogeosciences 2021, 18, 5903–5927. [Google Scholar] [CrossRef]
- Hochman, A.; Marra, F.; Messori, G.; Pinto, J.G.; Raveh-Rubin, S.; Yosef, Y.; Zittis, G. Extreme Weather and Societal Impacts in the Eastern Mediterranean. Earth Syst. Dyn. 2022, 13, 749–777. [Google Scholar] [CrossRef]
- De Luca, P.; Messori, G.; Faranda, D.; Ward, P.J.; Coumou, D. Compound Warm-Dry and Cold-Wet Events over the Mediterranean. Earth Syst. Dyn. 2020, 11, 793–805. [Google Scholar] [CrossRef]
- Markantonis, I.; Katrakazis, T.; Vlachogiannis, D.; Sfetsos, A.; Kioutsioukis, I.; Karatasios, I. Compound Climate Events and Their Role in the Decay of Greece’s Cultural Heritage. Sci. Rep. 2025, 15, 21065. [Google Scholar] [CrossRef]
- Michailidou, E.; Rokos, D. Greek Mountainous Areas: The Need for a Worthliving Integrated Development. Available online: https://www.researchgate.net/publication/215460380 (accessed on 20 June 2025).
- Skamarock, B.; Dudhia, J. The Advanced Research WRF (ARW) Dynamics Solver. Power Point Slides Presented at the November 2011 NCAS Tutorial. 2011, pp. 1–42. Available online: https://www2.mmm.ucar.edu/wrf/users/tutorial/presentation_pdfs/201201/tut_dyn_arw_201201.pptx.pdf (accessed on 20 June 2025).
- Skamarock, W.; Klemp, J.; Dudhia, J.; Gill, D.O.; Barker, D.; Duda, M.G.; Huang, X.-Y.; Wang, W.; Powers, J.G. A Description of the Advanced Research WRF Version 3. University Corporation for Atmospheric Research. (Original Work Published 2008). 2008. Available online: https://opensky.ucar.edu/islandora/object/%3A3814 (accessed on 20 June 2025).
- Hazeleger, W.; Wang, X.; Severijns, C.; Ştefănescu, S.; Bintanja, R.; Sterl, A.; Wyser, K.; Semmler, T.; Yang, S.; van den Hurk, B.; et al. EC-Earth V2.2: Description and Validation of a New Seamless Earth System Prediction Model. Clim. Dyn. 2012, 39, 2611–2629. [Google Scholar] [CrossRef]
- Politi, N.; Vlachogiannis, D.; Sfetsos, A.; Nastos, P.T. High-Resolution Dynamical Downscaling of ERA-Interim Temperature and Precipitation Using WRF Model for Greece. Clim. Dyn. 2021, 57, 799–825. [Google Scholar] [CrossRef]
- Katopodis, T.; Markantonis, I.; Politi, N.; Vlachogiannis, D.; Sfetsos, A. High-Resolution Solar Climate Atlas for Greece under Climate Change Using the Weather Research and Forecasting (WRF) Model. Atmosphere 2020, 11, 761. [Google Scholar] [CrossRef]
- Founda, D.; Varotsos, K.V.; Pierros, F.; Giannakopoulos, C. Observed and Projected Shifts in Hot Extremes’ Season in the Eastern Mediterranean. Glob. Planet. Change 2019, 175, 190–200. [Google Scholar] [CrossRef]
- Zarikos, I.; Politi, N.; Gounaris, N.; Karozis, S.; Vlachogiannis, D.; Sfetsos, A. Quantifying the Long-Term Performance of Rainwater Harvesting in Cyclades, Greece. Water 2023, 15, 3038. [Google Scholar] [CrossRef]
- Lionello, P.; Scarascia, L. The Relation between Climate Change in the Mediterranean Region and Global Warming. Reg. Environ. Change 2018, 18, 1481–1493. [Google Scholar] [CrossRef]
- Reale, M.; Cabos Narvaez, W.D.; Cavicchia, L.; Conte, D.; Coppola, E.; Flaounas, E.; Giorgi, F.; Gualdi, S.; Hochman, A.; Li, L.; et al. Future Projections of Mediterranean Cyclone Characteristics Using the Med-CORDEX Ensemble of Coupled Regional Climate System Models. Clim. Dyn. 2022, 58, 2501–2524. [Google Scholar] [CrossRef]
- Hamdi, Y.; Duluc, C.-M.; Rebour, V. Temperature Extremes: Estimation of Non-Stationary Return Levels and Associated Uncertainties. Atmosphere 2018, 9, 129. [Google Scholar] [CrossRef]
- Fan, X.; Miao, C.; Zscheischler, J.; Slater, L.; Wu, Y.; Chai, Y.; AghaKouchak, A. Escalating Hot-Dry Extremes Amplify Compound Fire Weather Risk. Earths Future 2023, 11, e2023EF003976. [Google Scholar] [CrossRef]
- Markantonis, I.; Vlachogiannis, D.; Sfetsos, A.; Kioutsioukis, I.; Politi, N. Spatiotemporal Investigation of Wet–Cold Compound Events in Greece. Adv. Sci. Res. 2023, 19, 145–158. [Google Scholar] [CrossRef]
- Houssos, E.E.; Lolis, C.J.; Bartzokas, A. Atmospheric Circulation Patterns Associated with Extreme Precipitation Amounts in Greece. Adv. Geosci. 2008, 17, 5–11. [Google Scholar] [CrossRef]
- Iordanidou, V.; Koutroulis, A.G.; Tsanis, I.K. Mediterranean cyclone characteristics related to precipitation occurrence in Crete, Greece. Nat. Hazards Earth Syst. Sci. 2015, 15, 1807–1819. [Google Scholar] [CrossRef]
- Karali, A.; Hatzaki, M.; Giannakopoulos, C.; Roussos, A.; Xanthopoulos, G.; Tenentes, V. Sensitivity and Evaluation of Current Fire Risk and Future Projections Due to Climate Change: The Case Study of Greece. Nat. Hazards Earth Syst. Sci. 2014, 14, 143–153. [Google Scholar] [CrossRef]
- Maheras, P.; Patrikas, I.; Karacostas, T.; Anagnostopoulou, C. Automatic Classification of Circulation Types in Greece: Methodology, Description, Frequency, Variability and Trend Analysis. Theor. Appl. Clim. 2000, 67, 205–223. [Google Scholar] [CrossRef]
- Baltas, E. Spatial Distribution of Climatic Indices in Northern Greece. Meteorol. Appl. 2007, 14, 69–78. [Google Scholar] [CrossRef]
- Sindosi, O.A.; Bartzokas, A.; Kotroni, V.; Lagouvardos, K. Influence of Orography on Precipitation Amount and Distribution in NW Greece; A Case Study. Atmos. Res. 2015, 152, 105–122. [Google Scholar] [CrossRef]
- Prezerakos, N.G. Etesian Winds Outbursts over the Greek Seas and Their Linkage with Larger-Scale Atmospheric Circulation Features: Two Real Time Data Case Studies. Atmosfera 2022, 35, 89–110. [Google Scholar] [CrossRef]
- Politi, N.; Vlachogiannis, D.; Sfetsos, A.; Nastos, P.T.; Dalezios, N.R. High Resolution Future Projections of Drought Characteristics in Greece Based on SPI and SPEI Indices. Atmosphere 2022, 13, 1468. [Google Scholar] [CrossRef]
- Global Risks Report 2025: A Sobering Reminder of the Challenges Ahead—Global Center on Adaptation. Available online: https://gca.org/global-risks-report-2025-a-sobering-reminder-of-the-challenges-ahead/ (accessed on 21 July 2025).
Disclaimer/Publisher’s Note: The statements, opinions and data contained in all publications are solely those of the individual author(s) and contributor(s) and not of MDPI and/or the editor(s). MDPI and/or the editor(s) disclaim responsibility for any injury to people or property resulting from any ideas, methods, instructions or products referred to in the content. |
© 2025 by the authors. Licensee MDPI, Basel, Switzerland. This article is an open access article distributed under the terms and conditions of the Creative Commons Attribution (CC BY) license (https://creativecommons.org/licenses/by/4.0/).