Article

Exploring the Spatial Distribution and Sources of OVOCs in Shenzhen Using an Optimized Source Apportionment Method

1
Key Laboratory for Urban Habitat Environmental Science and Technology, School of Environment and Energy, Peking University Shenzhen Graduate School, Shenzhen 518055, China
2
Environmental Laboratory, PKU-HKUST Shenzhen-Hong Kong Institution, Shenzhen 518057, China
*
Author to whom correspondence should be addressed.
Atmosphere 2025, 16(9), 1016; https://doi.org/10.3390/atmos16091016
Submission received: 4 July 2025 / Revised: 21 August 2025 / Accepted: 26 August 2025 / Published: 28 August 2025

Abstract

Oxygenated volatile organic compounds (OVOCs) are key precursors to atmospheric ozone (O3) and secondary organic aerosols (SOA). However, research on the sources of OVOCs is still limited, particularly in terms of multi-point observations at urban sites. This study conducted a one month continuous enhanced observation at an urban site (BA) and a suburban site (DP) in December 2024. During the study period, the average total VOCs concentration at the BA site was 29.9 ± 6.5 ppbv, significantly higher than that at the DP site (6.4 ± 1.3 ppbv). To enhance the representation of the biogenic fraction in OVOCs, isoprene was employed as a biogenic tracer; prior to source apportionment, its anthropogenic components were subtracted based on local emission ratio coefficients, thereby providing a more representative basis for biogenic source attribution. The optimized source apportionment results show that the contribution ratio of biogenic sources had decreased significantly, with a particularly noticeable decline at the urban site. Among these, the contribution rates of acetaldehyde and acetone had decreased significantly: by 14.7% and 12.2%, respectively. Based on the improved source apportionment method, the source apportionment of OVOCs at the urban site showed that methanol, acetone, and MEK were primarily dominated by anthropogenic primary sources (accounting for 44.5% to 68.5%), while acetaldehyde was primarily dominated by secondary anthropogenic generation (37.1%), indicating its key role as a photochemical product. In contrast, at the suburban site, the biogenic source contribution to acetaldehyde (37.8%) was significant. This difference highlights the necessity of optimizing biogenic source tracers and conducting OVOC source apportionment studies at multiple locations.

1. Introduction

Volatile organic compounds (VOCs) in the atmosphere are important precursors for the formation of ground-level ozone (O3) and secondary organic aerosols (SOA) [1,2,3], which have adverse effects on air quality, climate change, and human health [4,5]. Against the backdrop of rapid urbanization in China, new urbanization emphasizes low-carbon development and smart city technologies [6]. As a pilot smart city in the Pearl River Delta (PRD), Shenzhen demonstrates regional cooperation through the ‘Greater Bay Area’ emission reduction initiative. Recent studies have emphasized that comprehensive urban governance can significantly reduce secondary pollutants such as O3 and SOA [7]. Oxygenated volatile organic compounds (OVOCs) have unique characteristics due to their oxygen-containing functional groups and are a key subclass of volatile organic compounds (VOCs) [8,9,10], primarily including aldehydes, ketones, and alcohols. Global observational data indicate that OVOCs concentrations in the atmosphere exhibit significant spatial heterogeneity. Even in pristine marine environments, phytoplankton release OVOCs such as methanol, acetaldehyde, and acetone, with environmental mixing ratios typically ranging from a few to several hundred parts per trillion by volume (pptv) [11,12], while the concentration of OVOCs in polluted sites may be as high as dozens of ppbv [13,14]. Given the key role of OVOCs in atmospheric photochemical reactions and the complexity of their sources, OVOCs have recently become a widely studied topic [13,15,16]. OVOCs have complex and diverse sources [17], including major anthropogenic emissions such as automobile exhaust [18,19], industries [20], volatile chemical product use [21], and biogenic source [16,21,22]. The differences in anthropogenic VOCs sources in different regions are mainly influenced by factors such as local economic structure, energy utilization methods, industrial layout, and transportation conditions. For example, the Yangtze River Delta (YRD), the Pearl River Delta (PRD), and the North China Plain (NCP) are developed regions in China, and vehicle exhaust (source of road movement) has become the most important source of VOCs [23,24,25,26,27]. In addition to anthropogenic emissions, biogenic sources cannot be ignored due to their active chemical properties. In summer VOC sources with sufficient sunlight, biological sources account for more than 5.8% [28,29]. As for methods for source analysis, some researchers have used principal component analysis (PCA), positive matrix factorization (PMF), and chemical mass balance (CMB) models to analyze VOC sources [30,31,32]. However, they rarely considered the impact of photochemical reactions of volatile organic compounds (VOCs) in the air in their analyses, making it difficult to accurately estimate the relative contributions of primary and secondary sources. The photochemical age parameterization method used in previous studies [31,32] can address this issue. In this method, isoprene is typically used as a tracer for biogenic sources. The biogenic source of isoprene has been well established [33], but studies worldwide have reported anthropogenic sources [34,35,36,37]. Previous studies directly used isoprene as a biogenic tracer, ignoring the influence of anthropogenic sources. Therefore, it is necessary to remove the anthropogenic influence of isoprene before conducting OVOC source analysis to optimize isoprene, as the optimized results can better represent biogenic sources.
In this study, intensive observations of OVOCs were conducted at urban and suburban sites in Shenzhen during winter, and an optimized parameterization method based on photochemical age was used for analysis. This study offers a methodologically sound and practically valuable contribution to atmospheric science. It provides a more accurate picture of the complex interplay between human activity, natural emissions, and photochemical processes. For policymakers and environmental managers, it underscores the need for localized and compound-specific strategies for air pollution control.

2. Materials and Methods

2.1. Site Descriptions and Meteorological Conditions

This study was conducted in December 2024 at both urban and suburban sites in Shenzhen, focusing on intensive observations of atmospheric photochemical pollution (Figure S1). Monitoring site BA (22.73° N, 113.77° E) is located within the Shenzhen Haishangtianyuan Scenic Area, representing an urban site. The scenic area is surrounded by many industrial activities, and chemical inputs and outputs from industrial activities (such as the dye and paint industries) may influence volatile organic compound emissions; monitoring site DP (22.53° N, 114.50° E) is situated on the fifth-floor rooftop of the Nan’ao Central Primary School building near the sea (approximately 20 m above ground level). The measurement site is located in the suburban area of the Dapeng Peninsula in southern China, away from urban and industrial zones, with relatively low local pollution levels. The relevant average environmental meteorological parameters are listed in Table S1.

2.2. Online Measurement of Various VOCs

A commercial high-sensitivity proton-transfer-reaction time-of-flight mass spectrometer (PTR-ToF 1000; Ionicon, Austria) was used to monitor environmental volatile organic compound (VOC) concentrations in real time. The technique relies on proton transfer from hydronium ions (H3O+) to VOCs of higher proton affinity. Resulting protonated ions are separated by mass-to-charge ratio (m/z) based on time-of-flight and detected. Air was sampled through a ¼ inch outer-diameter polytetrafluoroethylene (PTFE) tube fitted with a 47 mm PTFE filter (2.0 µm pore) at the inlet to exclude particles. Key volatile organic compound species were monitored with a 1 min resolution; Tables S2 and S3 provide key species, molecular formulas, categories, uncertainties, and detection limits (DL). Perform monthly calibration using TO15 mixed standard (Air Environmental, Inc., Denver, CO, USA).

2.3. Calculation of O3 Formation Potential

Incremental reactive activity MIR is defined as the change in O3 concentration produced by adding or removing unit VOCs in the VOCs of a given air mass. At the same time, the contribution degree of each VOC species to O3 formation can be quantified by the following Formula (1). OFP is the product of the VOC ambient concentration and the MIR coefficient of the VOC. The calculation formula is as follows:
O F P i = V O C i × M I R i
where [VOC]i represents the ambient concentration of a VOC in the actual observation; MIRi represents the O3 formation coefficient of a VOC in the O3 maximum increment reaction. In this study, the MIR coefficient of each VOC adopts Carter’s literature value [21,38].

2.4. Source Apportionment Method of OVOC

Although some source apportionment methods have been applied in previous studies to quantify primary and secondary OVOC sources, including multiple linear regression methods [39,40], the Positive Matrix Factorization (PMF) model [41], and the photochemical age method [42,43]. Compared with other methods, the photochemical age-based parameterization method is more convenient because it does not require emission inventories and takes into account photochemical reactions and consumption. In this study, we adopted the photochemical age-based parameterization method developed by de Gouw et al. [43] to estimate the contribution of OVOCs, attributing OVOC concentrations to primary anthropogenic sources, secondary anthropogenic sources, biogenic sources, biomass burning sources, and background.
OVOC = E R o v o c × T r a c e r a p × e x p k o v o c k T r a c e r a p O H t + E R p r e c u r s o r × T r a c e r a p × k p r e c u r s o r k O V O C k p r e c u r s o r × e x p k p r e c u r s o r O H t e x p k O V O C O H t e x p k T r a c e r a p O H t + E R B i o g e n i c × i s o p r e n e B i o g e n i c + E R b b × T r a c e r b b + b a c k g r o u n d
Here, [OVOC], [Tracerap] and [Tracerbb] denote the measured concentrations of OVOC, the tracer of primary anthropogenic sources (benzene) and the biomass burning source (acetonitrile). [OH]∆t quantifies the exposure level of OH radicals and isopreneBiogenic is the initial concentration of isoprene emitted from biogenic sources (defined in Section 2.4). kOVOC, kTracerap, and kprecursor are the OH rate constants of OVOC, the tracer and precursors, respectively, where kHCHO and kTracerap are obtained from references. m represents ERHCHO and ERprecursor represent the emissions ratios of OVOC and precursor, relative to the tracer. ERBiogenic and ERbb were emission ratios of OVOC relative to isopreneBiogenic and tracers of biomass burning sources (acetonitrile), respectively. [background] represents the regional-scale background concentration of OVOC.

2.5. Optimized Biogenic Source Tracer

As noted in the Introduction, isoprene is widely used as a biogenic tracer, but its sources include both biogenic and anthropogenic contributions. To better apply isoprene as a tracer in the photochemical age-based parameterization method, it is necessary to distinguish the anthropogenic fraction. Before calculating the anthropogenic source of isoprene, we perform photochemical loss correction on isoprene, based on Formulas (3) and (4). Then, we used the ratio method to calculate the emission ratio (ER) of isoprene to benzene and then calculated the anthropogenic source of isoprene to optimize isoprene tracer. Here, we choose benzene as the anthropogenic source tracer for isoprene. Figure 1 shows the correlation between isoprene and benzene in nighttime measurements of the BA and DP sites, indicating some correlation between isoprene and tracer compounds (r2 = 0.80 and 0.31). These periods featured low oxidant levels (OH, O3), minimizing daytime isoprene depletion and better reflecting the inherent isoprene–benzene emission ratio. And as for Tracer0, we use a sliding minimum value of 48 h.
I s o p r e n e + O H 0.63 H C H O + 0.32 M V K + 0.23 M A C R              k 1 = 1.0 × 10 10 c m 3 S 1
M V K + O H P r o d u c t s              k 2 = 1.9 × 10 10 c m 3 S 1
M A C R + O H P r o d u c t s              k 3 = 3.3 × 10 10 c m 3 S 1
Based on the above three reaction equations, we can express (MVK + MACR)/Isoprene as a function of reaction time as follows:
M V K + M A C R I s o p r e n e = 0.32 k 1 k 2 k 1 1 exp k 1 k 2 O H t + 0.32 k 1 k 3 k 1 ( 1 exp k 1 k 3 O H t
I s o p r e n e s o u r c e = I s o p r e n e m e a n s × e x p ( k 1 O H t )
I s o p r e n e B i o g e n i c = I s o p r e n e s o u r c e T r a c e r T r a c e r 0 × E R

3. Results and Discussion

3.1. General Characteristics of Observed OVOCs

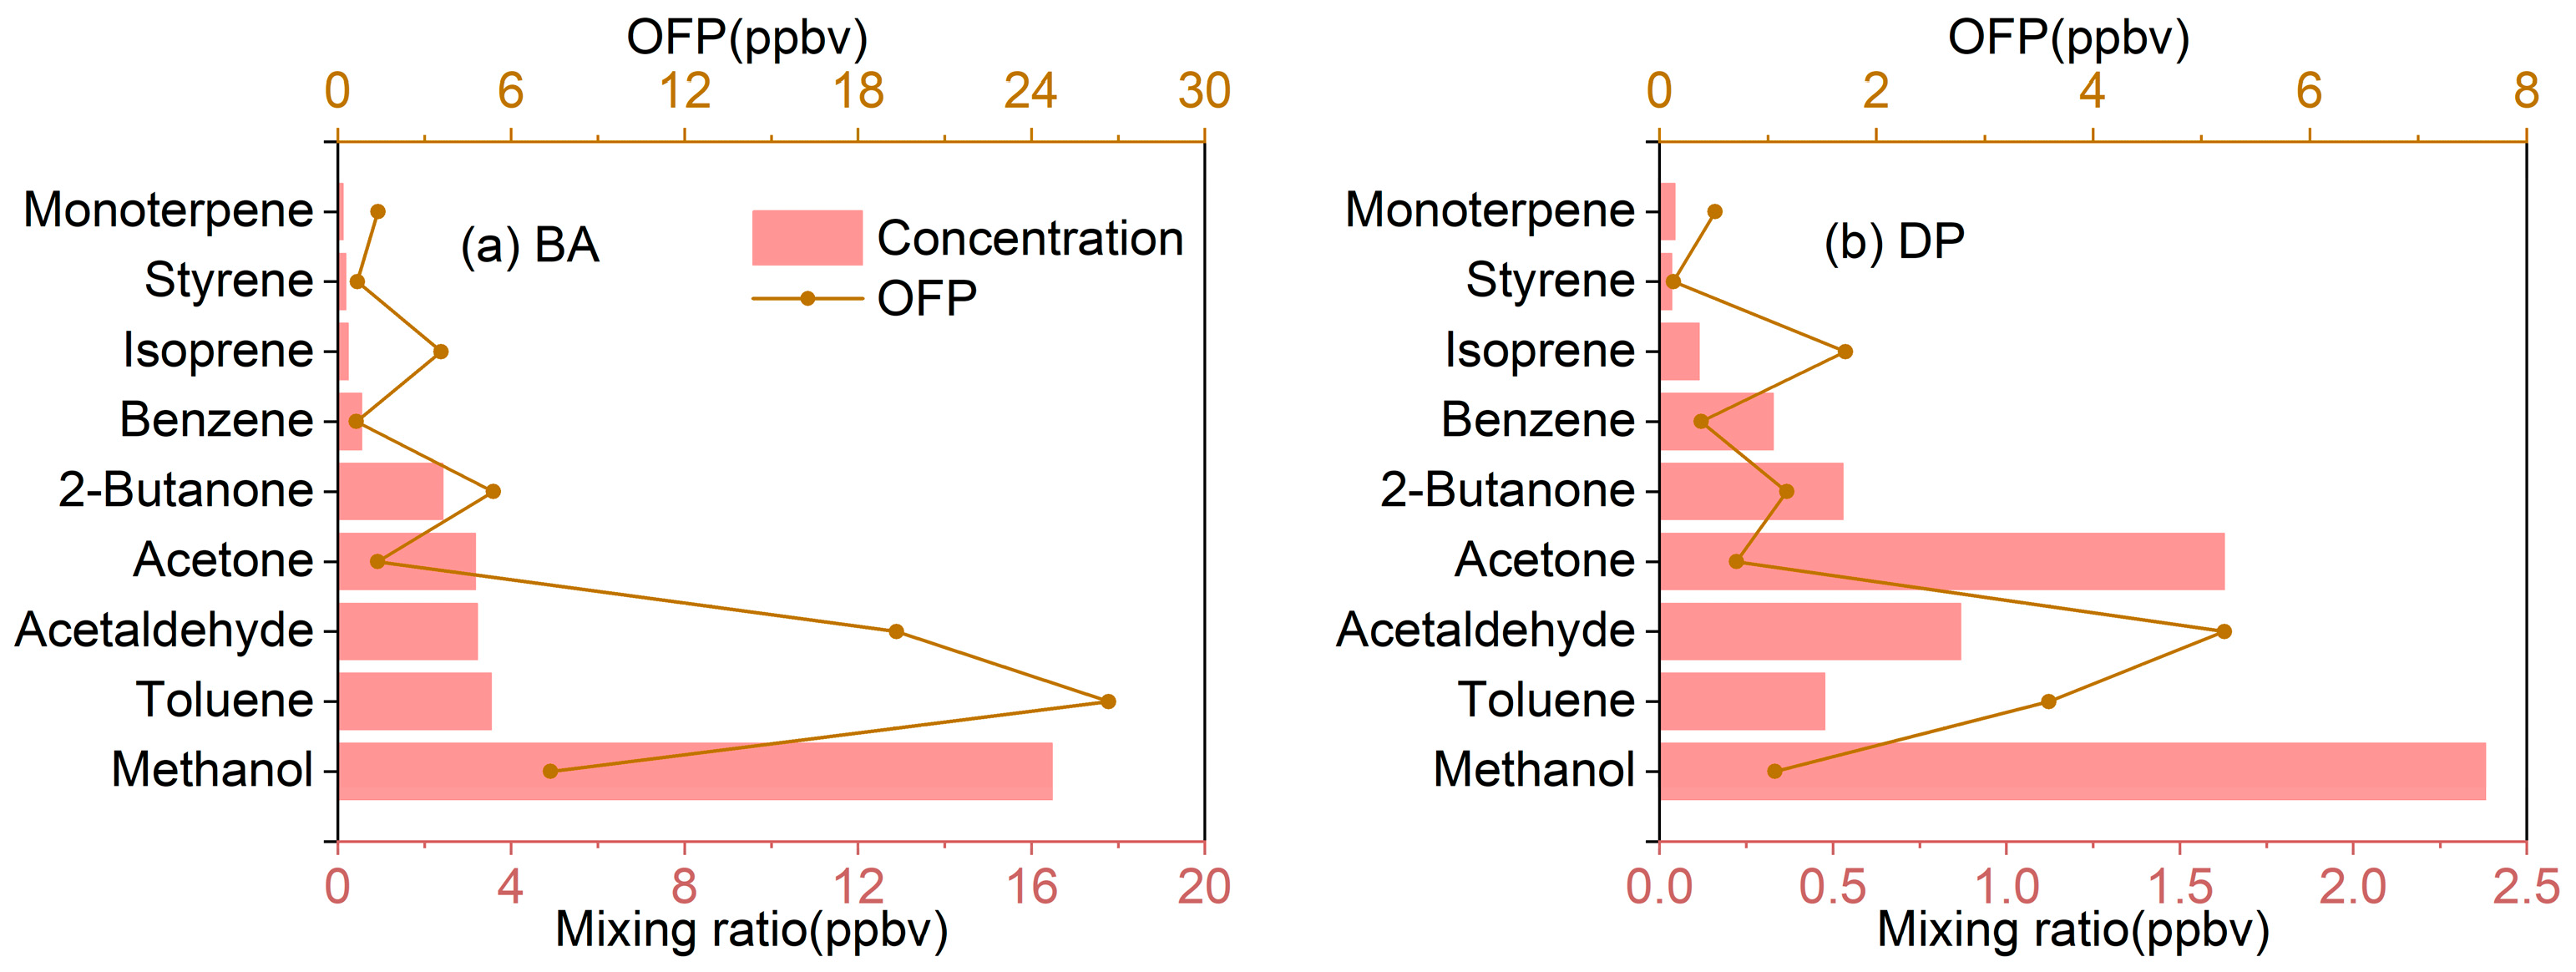
This study conducted enhanced observations at urban (BA) and suburban (DP) sites in Shenzhen during December 2024, monitoring a total of thirteen VOCs using PTR-ToF 1000, including four OVOCs (methanol, acetaldehyde, acetone, and butanone (MEK)), five aromatic hydrocarbons (benzene, toluene, styrene, C8, and C9 aromatics), three classified as biogenic (isoprene, MVK + MACR, and monoterpenes), and acetonitrile (as a tracer). Here, Monoterpene is an important grouped category of terpenes used to represent compounds with a signal of C10H16 (including α—Pinene, β—Pinene, Limonene, etc.). The average total VOC concentration in BA was 29.9 ± 6.5 ppbv (mean ± SD), which was significantly higher than that in DP (6.4 ± 1.3 ppbv). Table S4 shows a comparison of 4 OVOCs between Shenzhen BA and DP sites and other cities in China. At the BA site, methanol (16.48 ppbv) and acetone (3.17 ppbv) were significantly lower than in Beijing [44], Wangdu [45] and Guangzhou [8], but significantly higher than in Hong Kong [46] and the suburbs areas of Shenzhen [47]. In addition, the acetone concentration levels in the urban areas of Shenzhen (2.42 ppbv) were basically consistent with those in Beijing (2.53 ppbv). At the DP site, methanol (2.38 ppbv) and acetaldehyde (0.87 ppbv) showed a significant decrease compared to the observation results from December 2015 to January 2016 [47], with a decrease of nearly half. Acetone and MEK levels remained consistent and maintained at relatively low levels. Since VOCs are important precursors to O3 in the atmosphere, studying their O3 formation potential (OFP) is beneficial for further exploring key active species (as shown in Figure 2). Among these, toluene and acetaldehyde ranked among the top two in OFP rankings in both locations, accounting for 69% and 61% of the total OFP contribution from all species in urban and suburban areas, respectively. Methanol made a very significant contribution to OFP, as its atmospheric concentration is the highest among all VOCs, and the contribution of isoprene to OFP is also significant. Unlike traditional emission inventories, which only assess major emission sources, OVOCs have numerous secondary sources, such as acetaldehyde. Aldehydes not only have high reactivity but can also generate OH radicals through photolysis [16,48,49]. Therefore, aldehydes are key precursors and intermediates in atmospheric photochemical reactions.

3.2. Diurnal Variation In OVOC

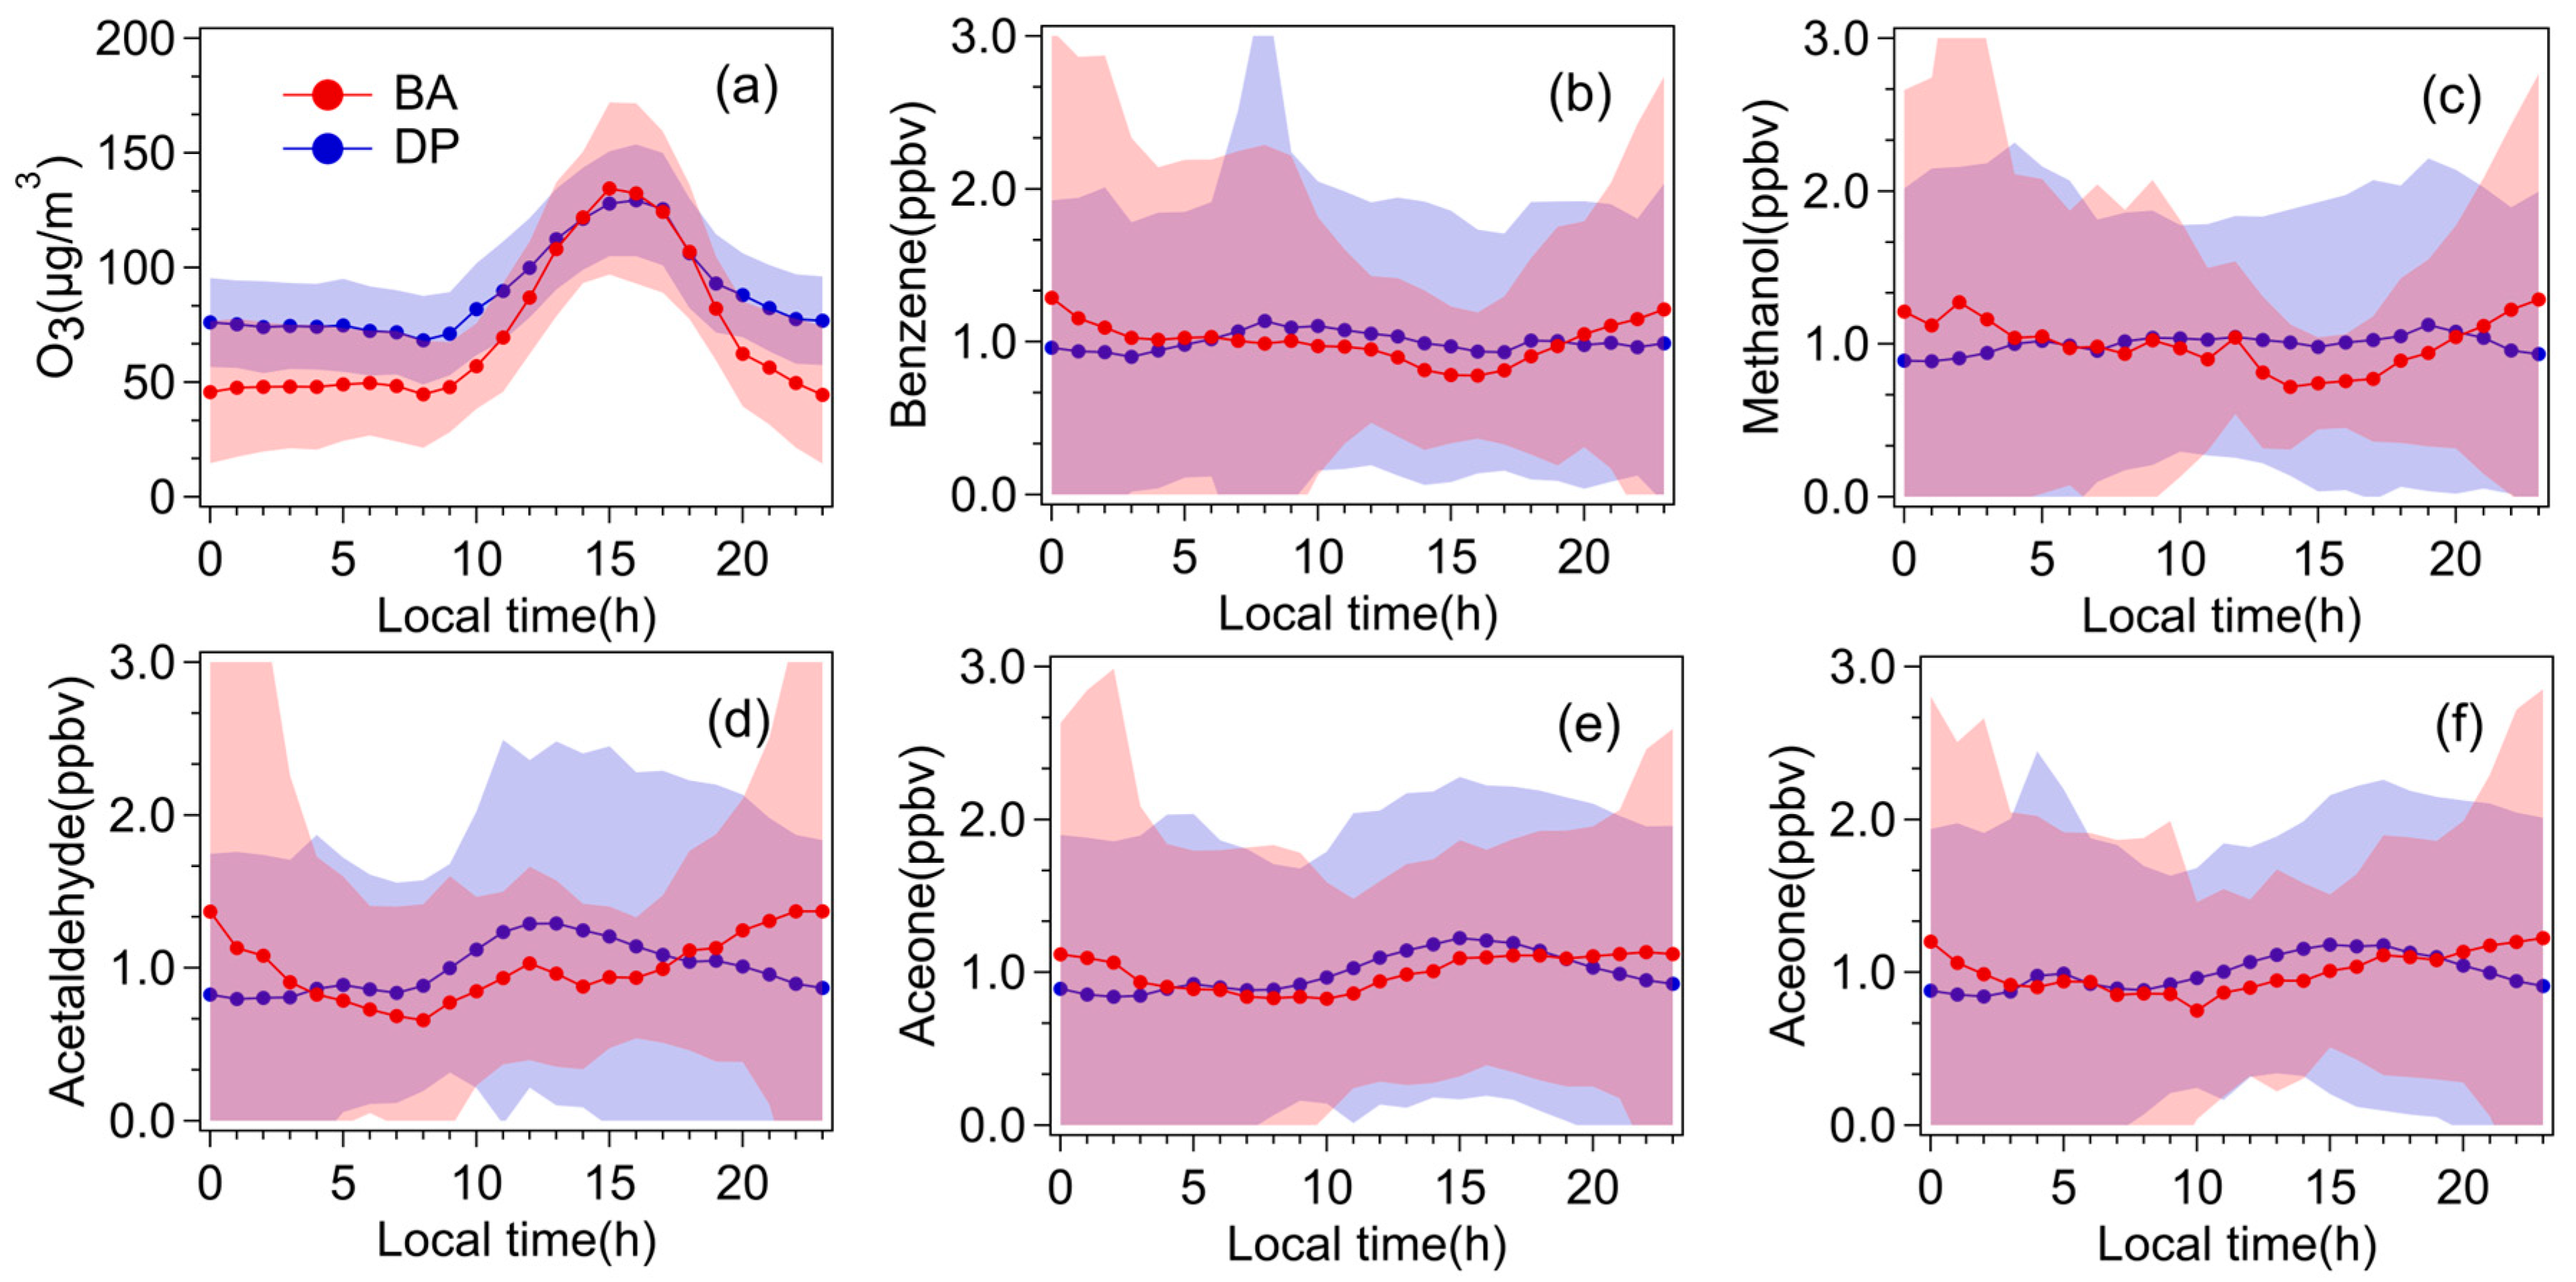
To clearly compare the diurnal variation trends of pollutants, the concentrations of benzene and four OVOCs were normalized (divided by their respective average concentrations) (as shown in Figure 3). We can observe that the daytime O3 peaks at both locations are generally consistent, but the nighttime levels at the suburban station are significantly higher than those at the urban station, primarily due to regional pollutant transport. Additionally, we present the backward trajectory simulation methods and simulation results for the urban and suburban stations, as shown in the Text S1 and Figures S2 and S3. The average O3 concentrations for each trajectory are also presented in Table S5 of the Supplementary Material appendix. Air masses from the north brought a large amount of O3, causing an increase in local background values. At urban sites, benzene exhibits a “low during the day, high at night” diurnal variation pattern. From noon onwards, benzene concentrations begin to decline, which may be due to dilution caused by the planetary boundary layer (PBL) uplift [16]. The daily variation trend of methanol is most similar to that of benzene, indicating similar primary source characteristics. Acetone and MEK also exhibit elevated concentrations at night. Acetaldehyde shows a significant upward trend during the day, indicating that photochemical production and daytime human activities related to acetaldehyde are significant. It then decreases in the afternoon, and the increase in acetaldehyde concentrations at night reflects enhanced human activities.

3.3. Anthropogenic and Biogenic Sources of Isoprene

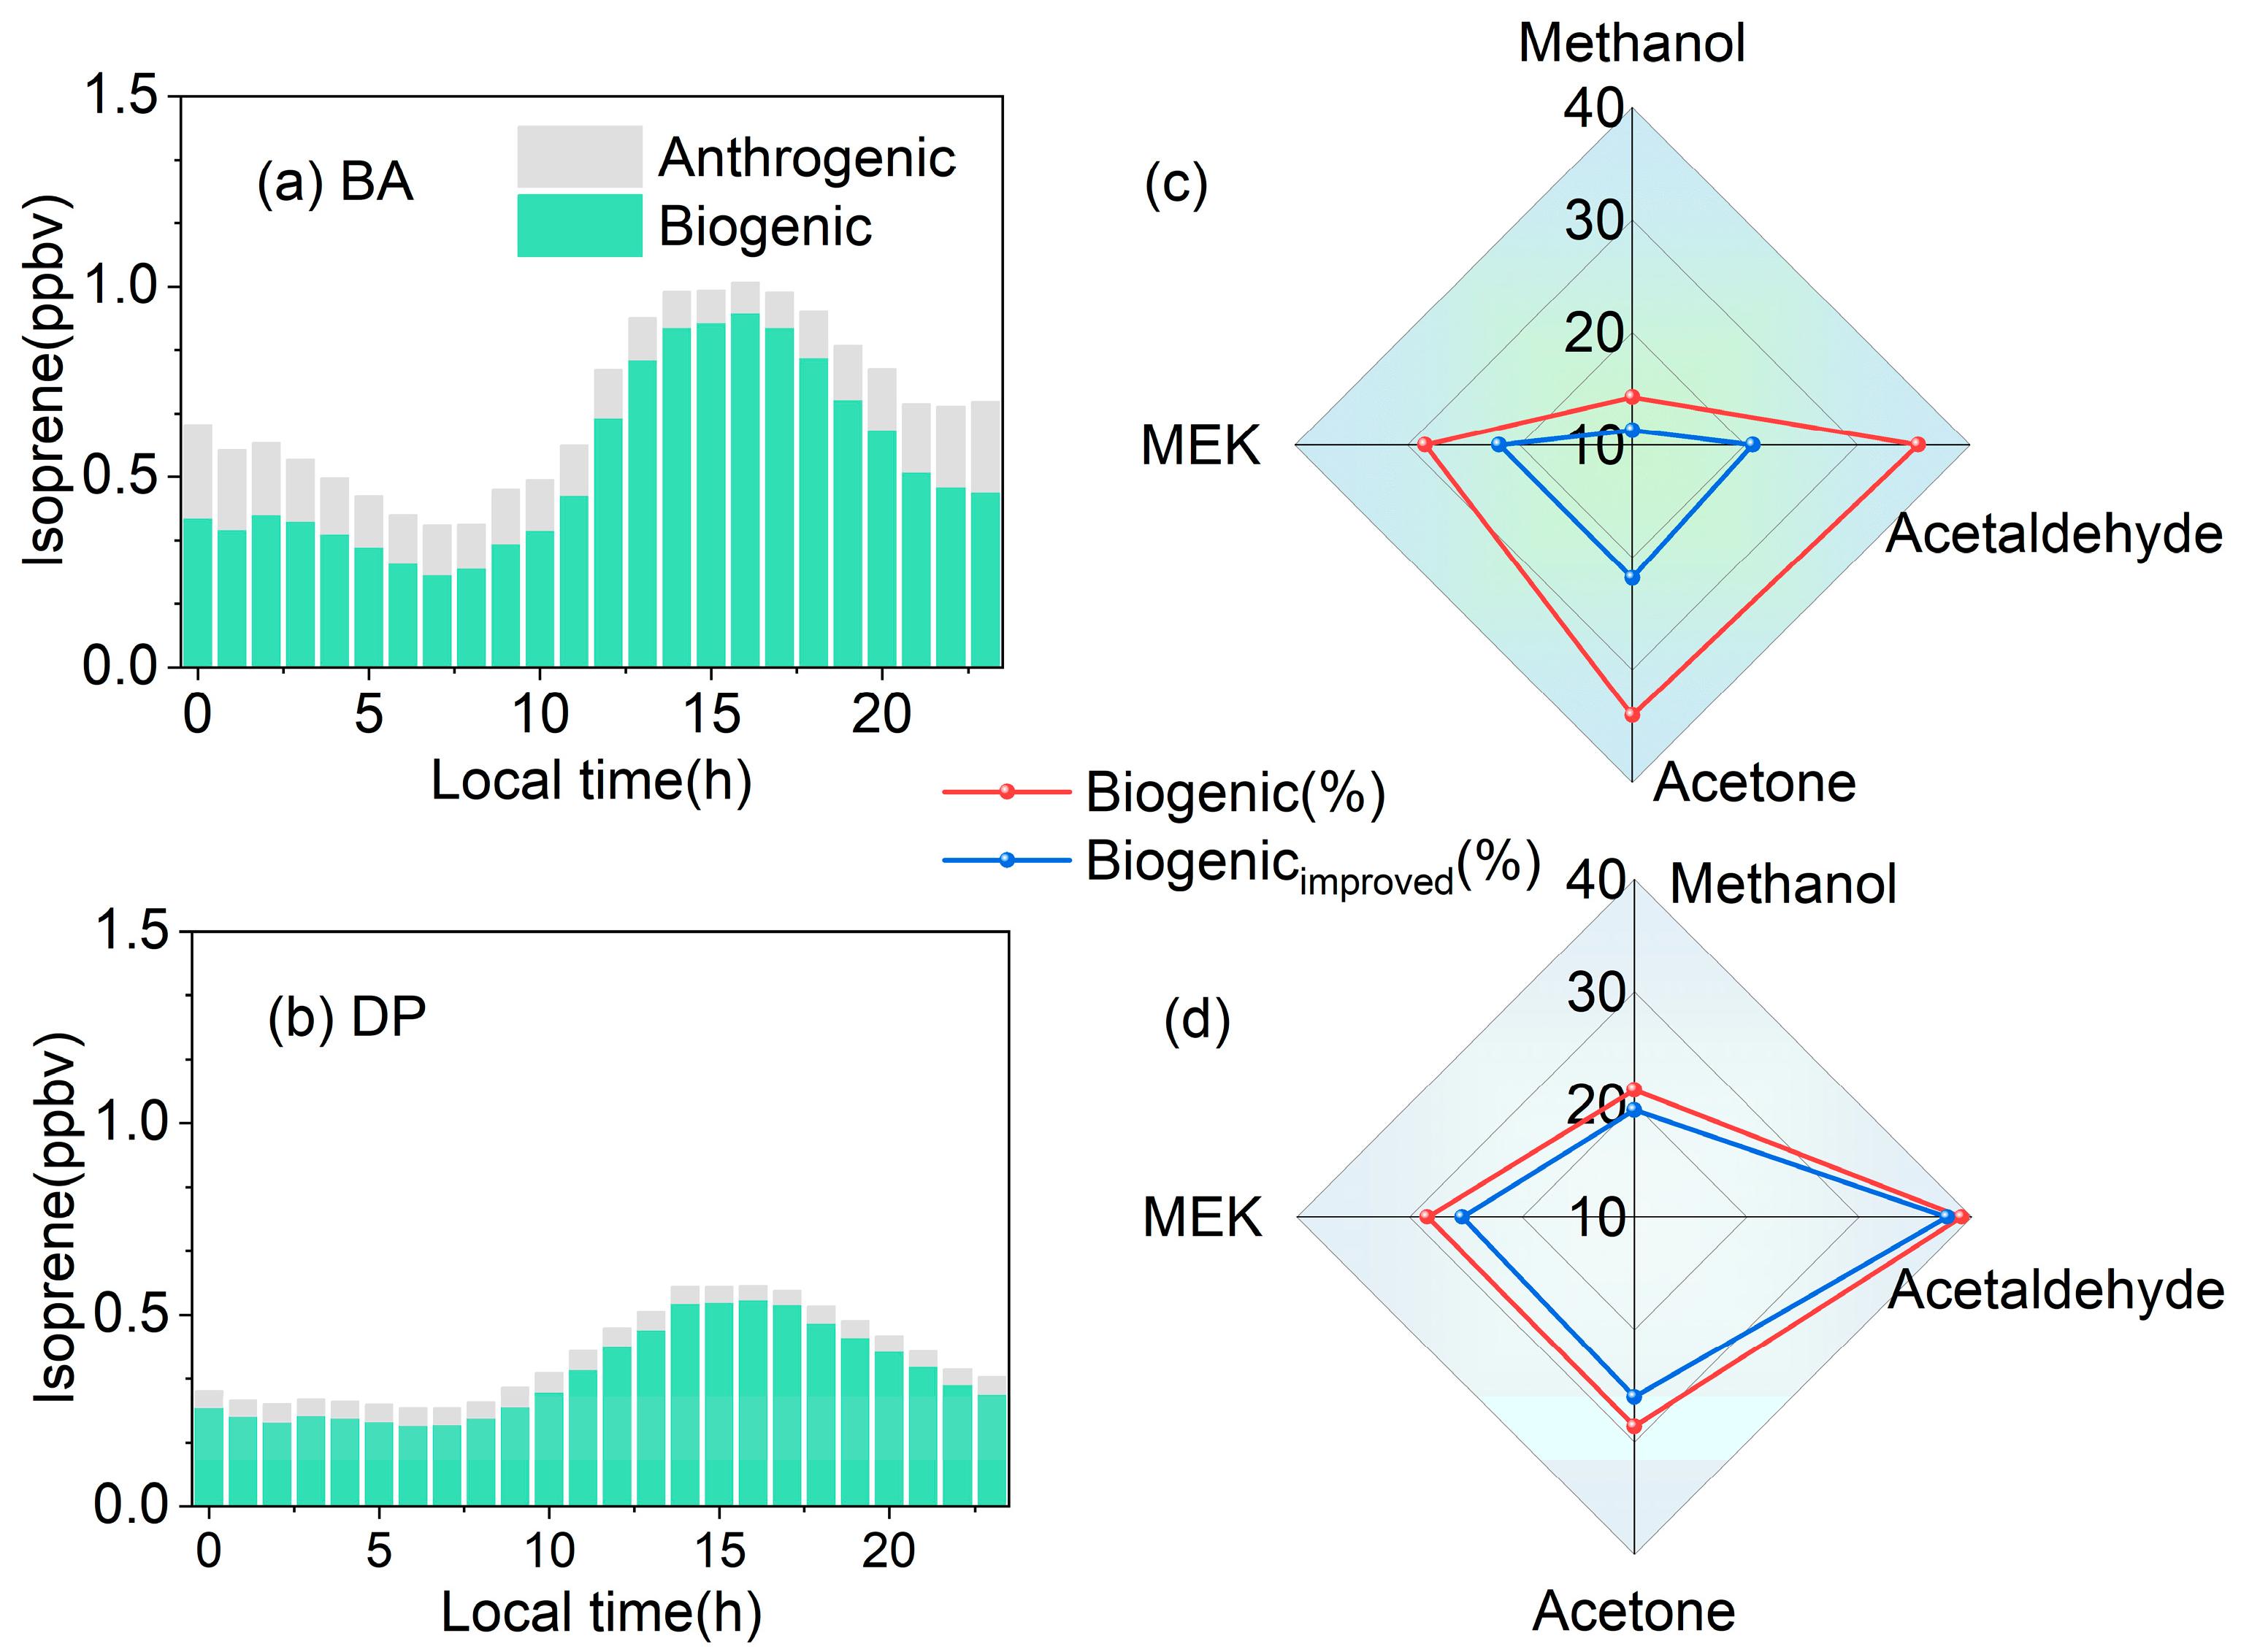
Several studies have shown that terpenoid compounds, such as isoprene, are not only derived from biogenic emissions but also from anthropogenic activities [34,36,50,51]. Before conducting isoprene source apportionment, we first performed photochemical correction on isoprene to obtain its concentration before photochemical loss (all isoprene concentrations mentioned hereafter refer to those after correction) [52,53,54]. Subsequently, we calculated the anthropogenic and biogenic sources of isoprene at the urban and suburban sites using the method described in Section 2.4, as shown in Figure 4a,b. This method employs the isoprene–benzene nighttime ratio (20:00–06:00 LT) to calculate the emission ratio (ER) [55]. The selection of the nighttime ratio assumes that photochemical effects are limited; however, the potential influence of nighttime chemistry cannot be ignored, suggesting that the estimated values can be considered upper boundaries [36]. At the suburban site, the diurnal variation in anthropogenic sources is relatively smooth, maintaining a low level throughout the day. At the urban site, anthropogenic sources exhibit a distinct “low daytime, high nighttime” variation pattern. After subtracting the anthropogenic source influence, isoprene, as a tracer, better reflects the results of natural source apportionment for OVOCs.

3.4. Improved OVOC Source Apportionment

The photochemical age-based parameterization method was employed to analyze the sources of four OVOCs (methanol, acetaldehyde, acetone, and MEK) at the urban and suburban sites in Shenzhen. The relevant fitting parameters for source apportionment are detailed in Tables S6 and S7. The results for the BA and DP sites are shown in Figures S4 and S5. The measured concentrations of OVOC species align well with the simulated concentrations (correlation coefficients R ranging from 0.72 to 0.85). In this study, isoprene was selected as a biogenic source tracer. Before conducting source apportionment, the anthropogenic primary source contribution of isoprene was identified and subtracted (to more accurately identify the biogenic source), and the changes in the proportion of biogenic source contributions of OVOC before and after subtraction were compared, as shown in Figure 4c,d. Compared with the suburban sites, the decrease in biogenic source contributions was more pronounced at the urban sites. At the urban sites, the largest decreases in biogenic contributions were observed for acetaldehyde and acetone, at 14.7% and 12.2%, respectively; MEK and methanol also showed significant decreases, at 6.6% and 3%, respectively. In contrast, the decreases in the bio-source contributions of the four species at the suburban sites were relatively low, ranging from 1.3% to 3.1%. This difference highlights the necessity of optimizing bio-source tracers and conducting OVOC source apportionment studies at multiple locations. Compared with previous source apportionment methods [16,56,57,58], the optimized method can more accurately reflect the representativeness of biogenic sources. Previous research methods overestimated the proportion of biogenic sources. This method provides an optimization approach, but it requires the selection of suitable tracers for isoprene. In the future, further optimization can be carried out in the selection of tracers.

3.5. Source Apportionment of Ambient OVOCs

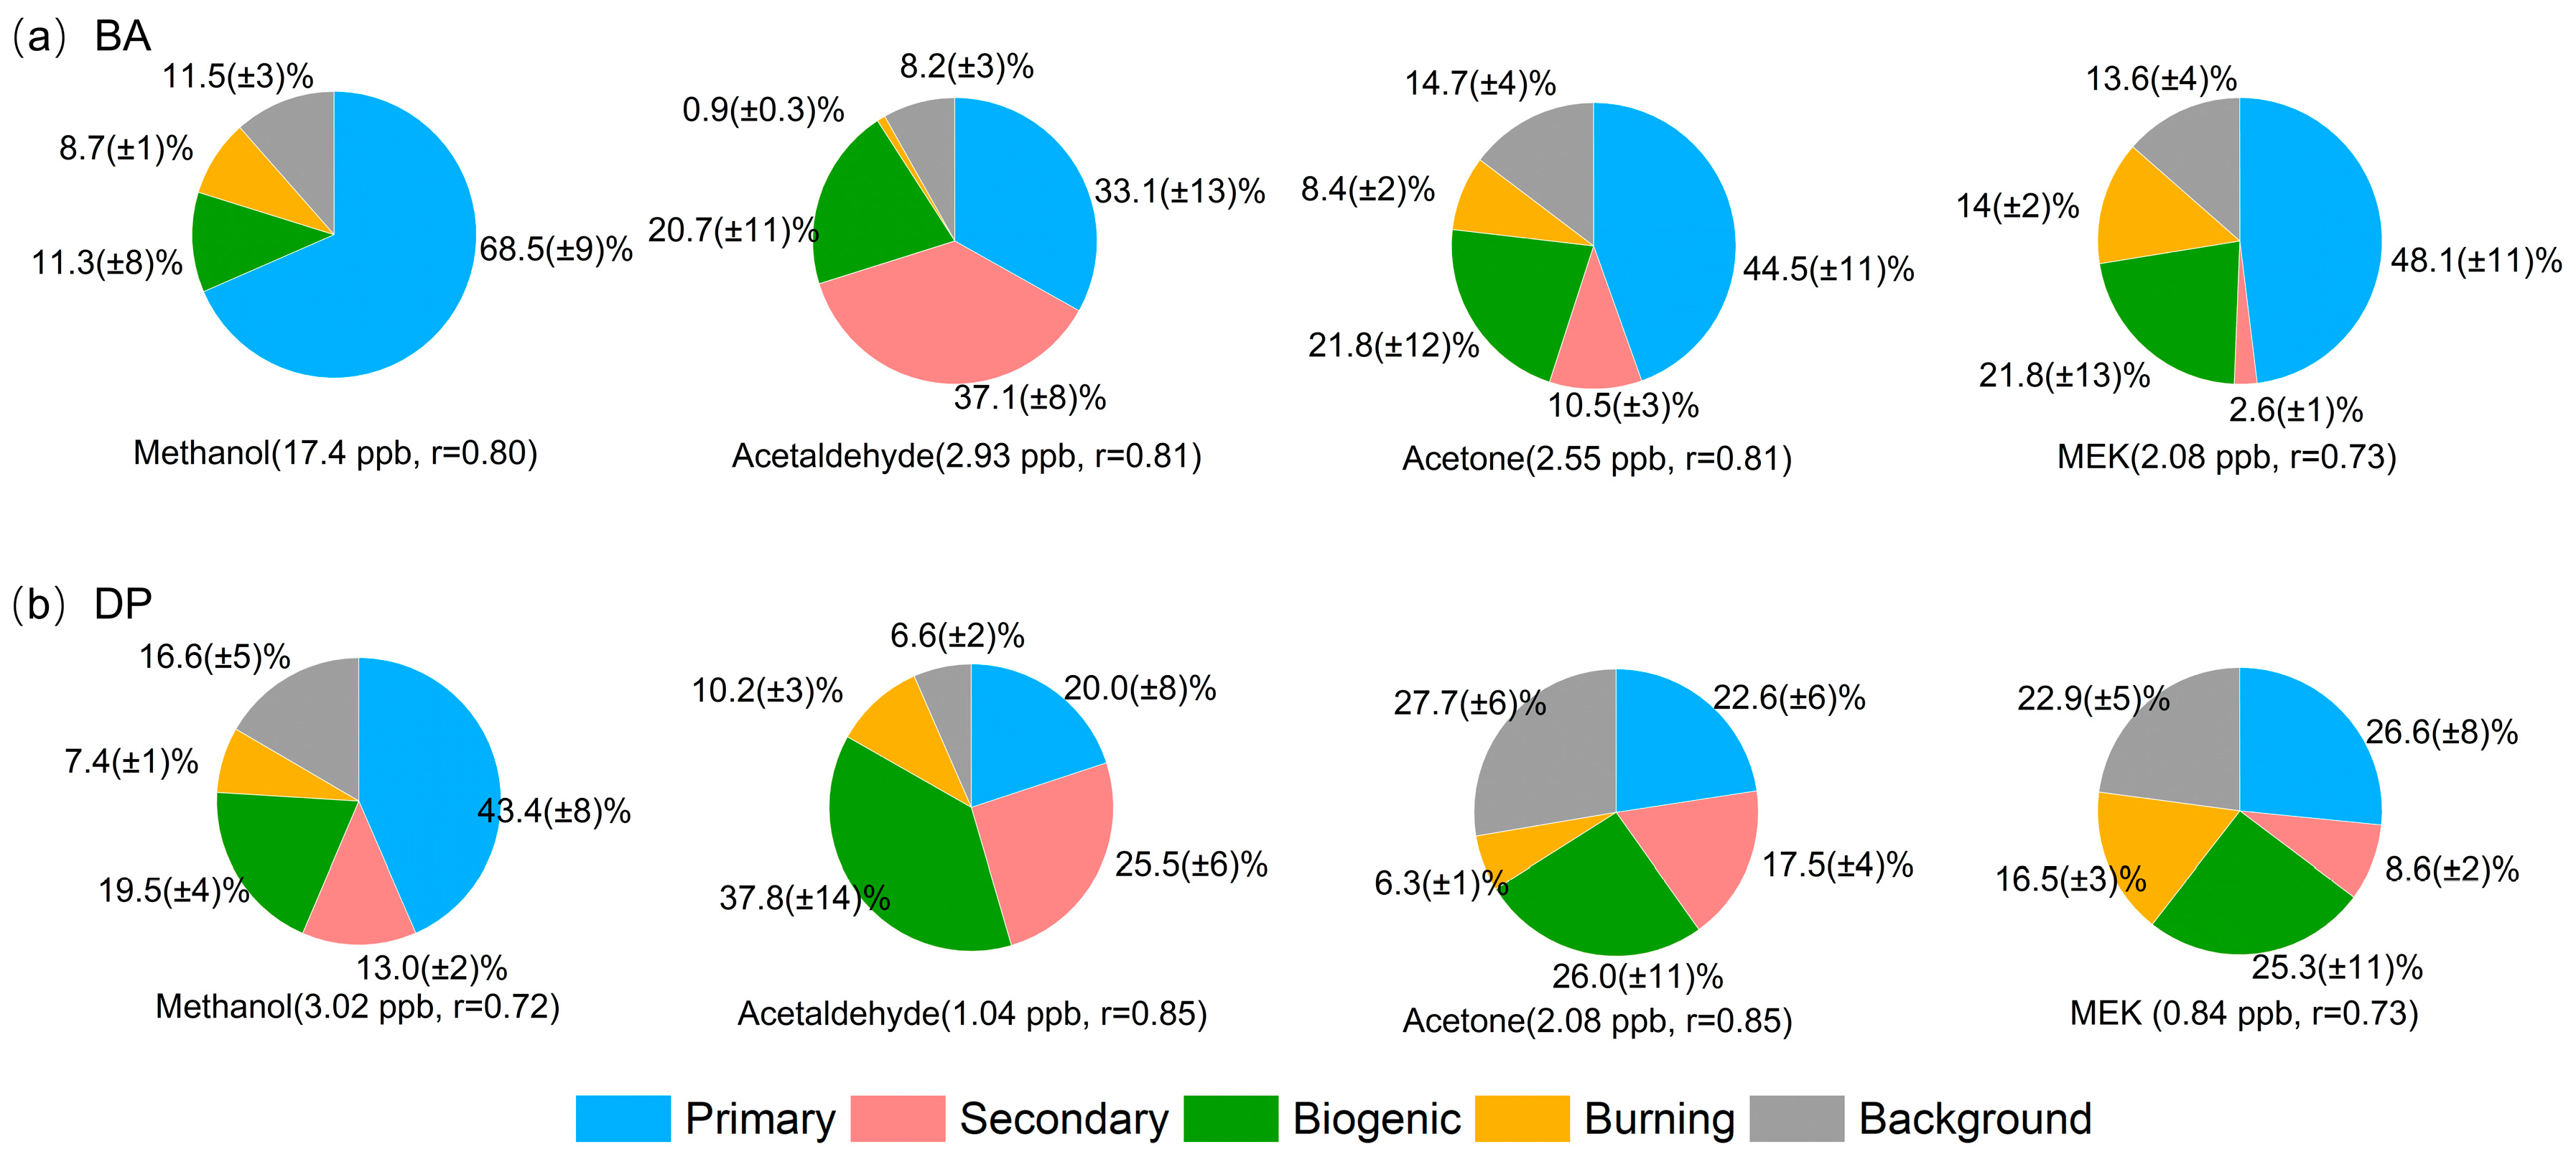
Figure 5 presents the source apportionment results for four OVOCs at urban and suburban sites. At the urban site, anthropogenic primary sources were dominant, with methanol (68.5%), acetone (44.5%), and MEK (48.1%), which is consistent with the findings of a previous study conducted in Beijing and other typical locations (such as New Zealand and Guangzhou) [43,59,60], which can be reasonably attributed to the extensive use of industrial solvents in urbanized areas. In contrast, anthropogenic primary sources account for a much smaller proportion (<43.4%) at suburban sites. For acetaldehyde, the two locations showed some differences. At the suburban sites, biogenic sources dominated acetaldehyde production (37.8%), but in the urban sites, although anthropogenic primary sources contributed significantly to acetaldehyde (33.1%), anthropogenic secondary sources (37.1%) played a more important role, indicating a secondary dominance in acetaldehyde sources [61]. The proportion of biomass combustion sources at both sites was similar, ranging from 1% to 16%. In terms of background value proportions, except for acetaldehyde, its contribution to OVOCs was 9–15% at the urban site and increased to 17–28% at the suburban site. Similar conclusions were found at the Zurich background sites [62]. Additionally, based on our previous analysis in Section 3.2, suburban sites are influenced by northern air masses, which bring a large amount of fresh pollutants, thereby increasing local background levels. Based on the analysis of pollution sources, combined with AI technology, they transform environmental decisions in multiple key dimensions and develop differentiated emission reduction strategies for different regions [63].

4. Conclusions

This study conducted enhanced observations at urban (BA) and suburban (DP) sites in Shenzhen during December 2024. The average total VOC concentration at the BA site was 29.9 ± 6.5 ppbv, which was significantly higher than that at the DP site (6.4 ± 1.3 ppbv). A photochemical age-based parameterization method was used to analyze the sources of four OVOCs (methanol, acetaldehyde, acetone, and MEK) at urban and suburban sites in Shenzhen. To enhance the representation of the biogenic fraction in OVOCs, isoprene was employed as a biogenic tracer; prior to source apportionment, its anthropogenic components were subtracted based on local emission ratio coefficients, thereby providing a more representative basis for biogenic source attribution. The optimized source apportionment results show that the contribution ratio of biogenic sources had decreased significantly, with a particularly noticeable decline at the urban site. Among these, the contribution rates of acetaldehyde and acetone have decreased significantly, by 14.7% and 12.2%, respectively.
Based on the improved source apportionment method, the source apportionment of OVOCs at urban sites showed that methanol, acetone, and MEK were primarily dominated by anthropogenic primary sources (accounting for 44.5% to 68.5%), while acetaldehyde was primarily dominated by secondary anthropogenic generation (37.1%), indicating its key role as a photochemical product. In contrast, at the suburban sites, the biogenic source contribution to acetaldehyde (37.8%) was significant, and background levels were generally higher than at the urban sites, which was attributed to regional transport of fresh pollutants carried by northern air masses. This difference highlights the necessity of optimizing biogenic source tracers and conducting OVOC source apportionment studies at multiple locations. In the future, more suitable anthropogenic tracers can be selected to optimize biogenic tracers. Given the spatiotemporal heterogeneity of biogenic contributions, this could be achieved by combining AI-enhanced source tracking with urban governance. Due to the difficulty in obtaining observational data, our work is limited to winter. In the future, we will continue to strengthen our research.

Supplementary Materials

The following supporting information can be downloaded at: https://www.mdpi.com/article/10.3390/atmos16091016/s1, Text S1: Backward trajectory analysis method; Table S1. Summary of Meteorological Parameters at BA and DP site; Table S2. Molecular formula, category, uncertainty and detection limits (DL) of key VOCs species monitored by PTR-TOF1000 in BA site; Table S3: Molecular formula, category, uncertainty and detection limits (DL) of key VOCs species monitored by PTR-TOF1000 in DP site; Table S4: Comparison of oxygenated volatile organic compound (OVOC) concentrations at different sites (unit:ppbv); Table S5: O3 concentration at different trajectories of BA and DP sites (unit:μg/m3); Table S6: Values of EROVOC, ERprecursor, ERbiogenic, kpreursor, ERbb and [background] derived from the fitting of the photochemical age-based parameterization method in BA site; Table S7: Values of EROVOC, ERprecursor, ERbiogenic, kpreursor, ERbb and [background] derived from the fitting of the photochemical age-based parameterization method in DP site; Figure S1: The location of the sampling sites; Figure S2: Backward trajectory diagram of BA site; Figure S3. Backward trajectory diagram of DP site; Figure S4. (a) and (b): Time series and correlation of source analysis results for four types of OVOCs at BA site. Figure S5. (a) and (b): Time series and correlation of source analysis results for four types of OVOCs at DP site.

Author Contributions

Conceptualization, L.H. and C.-B.W.; methodology, L.H., C.-B.W. and G.-H.Y.; software, L.-M.C. and C.-B.W.; validation, L.H.; formal analysis, C.-B.W., L.-M.C. and G.-H.Y.; data curation, L.-M.C. and C.-B.W.; writing—original draft preparation, L.H. and C.-B.W.; writing—review and editing, C.-B.W. and X.-F.H.; visualization, L.H. and C.-B.W.; supervision, X.-F.H., L.H. and L.-M.C.; project administration, G.-H.Y., X.-F.H. and L.-M.C. All authors have read and agreed to the published version of the manuscript.

Funding

This work was supported by the Science and Technology Plan of Shenzhen Municipality (JCYJ20220818100812028) and the IER foundation 2024 (NO. IERF202404).

Institutional Review Board Statement

Not applicable.

Informed Consent Statement

Not applicable.

Data Availability Statement

The data presented in this study are available on request from the corresponding author. The data are not publicly available due to privacy.

Conflicts of Interest

The authors declare that they have no known competing financial interests or personal relationships that could have appeared to influence the work reported in this paper.

References

  1. Wang, H.; Jing, S.; Luo, S.; Hu, Q.; Li, L.; Tao, S.; Cheng, H.; Qiao, L.; Cheng, C. Volatile organic compounds (VOCs) source profiles of on-road vehicle emissions in China. Sci. Total Environ. 2017, 607–608, 253–261. [Google Scholar] [CrossRef] [PubMed]
  2. Li, Y.; Liu, Y.; Hou, M.; Huang, H.; Fan, L.; Ye, D. Characteristics and sources of volatile organic compounds (VOCs) in Xinxiang, China, during the 2021 summer ozone pollution control. Sci. Total Environ. 2022, 842, 156746. [Google Scholar] [CrossRef]
  3. Nie, W.; Yan, C.; Huang, D.D.; Wang, Z.; Liu, Y.; Qiao, X.; Guo, Y.; Tian, L.; Zheng, P.; Xu, Z.; et al. Secondary organic aerosol formed by condensing anthropogenic vapours over China’s megacities. Nat. Geosci. 2022, 15, 255–261. [Google Scholar] [CrossRef]
  4. Liu, H.; Man, H.; Cui, H.; Wang, Y.; Deng, F.; Wang, Y.; Yang, X.; Xiao, Q.; Zhang, Q.; Ding, Y.; et al. An updated emission inventory of vehicular VOCs and IVOCs in China. Atmos. Chem. Phys. 2017, 17, 12709–12724. [Google Scholar] [CrossRef]
  5. Atkinson, R.; Arey, J. Gas-phase tropospheric chemistry of biogenic volatile organic compounds: A review. Atmos. Environ. 2003, 37, 197–219. [Google Scholar] [CrossRef]
  6. Zhang, W.; Xu, Y.; Bu, H.; Streets, D.G.; Wang, C. How does clean heating policy affect employment in local and neighbouring cities: Spatial quasi-experimental evidence from China. J. Clean. Prod. 2025, 503, 145399. [Google Scholar] [CrossRef]
  7. Zhang, W.; Xu, Y.; Jiang, L.; Streets, D.G.; Wang, C. Direct and spillover effects of new-type urbanization on CO2 emissions from central heating sector and EKC analyses: Evidence from 144 cities in China. Resour. Conserv. Recycl. 2023, 192, 106913. [Google Scholar] [CrossRef]
  8. Lü, H.; Cai, Q.Y.; Wen, S.; Chi, Y.; Guo, S.; Sheng, G.; Fu, J. Seasonal and diurnal variations of carbonyl compounds in the urban atmosphere of Guangzhou, China. Sci. Total Environ. 2010, 408, 3523–3529. [Google Scholar] [CrossRef]
  9. Tong, L.; Liao, X.; Chen, J.; Xiao, H.; Xu, L.; Zhang, F.; Niu, Z.; Yu, J. Pollution characteristics of ambient volatile organic compounds (VOCs) in the southeast coastal cities of China. Environ. Sci. Pollut. Res. 2013, 20, 2603–2615. [Google Scholar] [CrossRef] [PubMed]
  10. Chen, W.T.; Shao, M.; Lu, S.H.; Wang, M.; Zeng, L.M.; Yuan, B.; Liu, Y. Understanding primary and secondary sources of ambient carbonyl compounds in Beijing using the PMF model. Atmos. Chem. Phys. 2014, 14, 3047–3062. [Google Scholar] [CrossRef]
  11. Galbally, I.E.; Lawson, S.J.; Weeks, I.A.; Bentley, S.T.; Gillett, R.W.; Meyer, M.; Goldstein, A.H. Volatile organic compounds in marine air at Cape Grim, Australia. Environ. Chem. 2007, 4, 178–182. [Google Scholar] [CrossRef]
  12. Wohl, C.; Brown, I.; Kitidis, V.; Jones, A.E.; Sturges, W.T.; Nightingale, P.D.; Yang, M. Underway seawater and atmospheric measurements of volatile organic compounds in the Southern Ocean. Biogeosciences 2020, 17, 2593–2619. [Google Scholar] [CrossRef]
  13. Maji, S.; Beig, G.; Yadav, R. Winter VOCs and OVOCs measured with PTR-MS at an urban site of India: Role of emissions, meteorology and photochemical sources. Environ. Pollut. 2020, 258, 113651. [Google Scholar] [CrossRef]
  14. Zhou, X.; Li, Z.; Zhang, T.; Wang, F.; Wang, F.; Tao, Y.; Zhang, X.; Wang, F.; Huang, J. Volatile organic compounds in a typical petrochemical industrialized valley city of northwest China based on high-resolution PTR-MS measurements: Characterization, sources and chemical effects. Sci. Total Environ. 2019, 671, 883–896. [Google Scholar] [CrossRef] [PubMed]
  15. Sahu, L.K.; Tripathi, N.; Yadav, R. Contribution of biogenic and photochemical sources to ambient VOCs during winter to summer transition at a semi-arid urban site in India. Environ. Pollut. 2017, 229, 595–606. [Google Scholar] [CrossRef] [PubMed]
  16. Xia, S.-Y.; Wang, C.; Zhu, B.; Chen, X.; Feng, N.; Yu, G.-H.; Huang, X.-F. Long-term observations of oxygenated volatile organic compounds (OVOCs) in an urban atmosphere in southern China, 2014–2019. Environ. Pollut. 2021, 270, 116301. [Google Scholar] [CrossRef]
  17. Dai, J.; Zhang, K.; Feng, Y.; Yi, X.; Li, R.; Xue, J.; Li, Q.; Shi, L.; Liao, J.; Yi, Y.; et al. Significant influence of oxygenated volatile organic compounds on atmospheric chemistry: A case study in a typical industrial city in China. Atmos. Chem. Phys. 2025, 25, 7467–7484. [Google Scholar] [CrossRef]
  18. Gentner, D.R.; Worton, D.R.; Isaacman, G.; Davis, L.C.; Dallmann, T.R.; Wood, E.C.; Herndon, S.C.; Goldstein, A.H.; Harley, R.A. Chemical Composition of Gas-Phase Organic Carbon Emissions from Motor Vehicles and Implications for Ozone Production. Environ. Sci. Technol. 2013, 47, 11837–11848. [Google Scholar] [CrossRef]
  19. Wang, S.; Yuan, B.; Wu, C.; Wang, C.; Li, T.; He, X.; Huangfu, Y.; Qi, J.; Li, X.B.; Sha, Q.E.J.A.C.; et al. Oxygenated volatile organic compounds (VOCs) as significant but varied contributors to VOC emissions from vehicles. Atmos. Chem. Phys. Discuss. 2022, 22, 9703–9720. [Google Scholar] [CrossRef]
  20. Wang, S.; Zhang, J.; Zhang, Y.; Wang, L.; Sun, Z.; Wang, H. Review on Source Profiles of Volatile Organic Compounds (VOCs) in Typical Industries in China. Atmosphere 2023, 14, 878. [Google Scholar] [CrossRef]
  21. Ou, J.; Zheng, J.; Li, R.; Huang, X.; Zhong, Z.; Zhong, L.; Lin, H. Speciated OVOC and VOC emission inventories and their implications for reactivity-based ozone control strategy in the Pearl River Delta region, China. Sci. Total Environ. 2015, 530–531, 393–402. [Google Scholar] [CrossRef]
  22. Rieksta, J.; Li, T.; Davie-Martin, C.L.; Aeppli, L.C.B.; Høye, T.T.; Rinnan, R. Volatile responses of dwarf birch to mimicked insect herbivory and experimental warming at two elevations in Greenlandic tundra. Plant-Environ. Interact. 2023, 4, 23–35. [Google Scholar] [CrossRef]
  23. Zhao, S.; Yin, D.; Yu, Y.; Kang, S.; Qin, D.; Dong, L. PM2.5 and O3 pollution during 2015–2019 over 367 Chinese cities: Spatiotemporal variations, meteorological and topographical impacts. Environ. Pollut. 2020, 264, 114694. [Google Scholar] [CrossRef] [PubMed]
  24. Liu, X.; Zhang, J.; Lu, Z.; Ge, Q.; Wang, S.; Chen, D.; Chen, M.; Cui, Y. Characteristics, source apportionment, and secondary transformation of volatile organic compounds during different seasons at an urban site in southeast China. J. Environ. Sci. 2025, in press. [Google Scholar] [CrossRef]
  25. Xu, Z.; Zou, Q.; Jin, L.; Shen, Y.; Shen, J.; Xu, B.; Qu, F.; Zhang, F.; Xu, J.; Pei, X.; et al. Characteristics and sources of ambient Volatile Organic Compounds (VOCs) at a regional background site, YRD region, China: Significant influence of solvent evaporation during hot months. Sci. Total Environ. 2023, 857, 159674. [Google Scholar] [CrossRef] [PubMed]
  26. Li, C.; Liu, Y.; Cheng, B.; Zhang, Y.; Liu, X.; Qu, Y.; An, J.; Kong, L.; Zhang, Y.; Zhang, C.; et al. A comprehensive investigation on volatile organic compounds (VOCs) in 2018 in Beijing, China: Characteristics, sources and behaviours in response to O3 formation. Sci. Total Environ. 2022, 806, 150247. [Google Scholar] [CrossRef] [PubMed]
  27. Li, B.; Ho, S.S.H.; Gong, S.; Ni, J.; Li, H.; Han, L.; Yang, Y.; Qi, Y.; Zhao, D. Characterization of VOCs and their related atmospheric processes in a central Chinese city during severe ozone pollution periods. Atmos. Chem. Phys. 2019, 19, 617–638. [Google Scholar] [CrossRef]
  28. Yu, S.; Wang, S.; Xu, R.; Zhang, D.; Zhang, M.; Su, F.; Lu, X.; Li, X.; Zhang, R.; Wang, L. Measurement report: Intra-and interannual variability and source apportionment of volatile organic compounds during 2018-2020 in Zhengzhou, central China. Atmos. Chem. Phys. 2022, 22, 14859–14878. [Google Scholar] [CrossRef]
  29. Mozaffar, A.; Zhang, Y.L.; Lin, Y.C.; Xie, F.; Fan, M.Y.; Cao, F. Measurement report: High contributions of halocarbon and aromatic compounds to atmospheric volatile organic compounds in an industrial area. Atmos. Chem. Phys. 2021, 21, 18087–18099. [Google Scholar] [CrossRef]
  30. Guo, H.; Wang, T.; Simpson, I.J.; Blake, D.R.; Yu, X.M.; Kwok, Y.H.; Li, Y.S. Source contributions to ambient VOCs and CO at a rural site in eastern China. Atmos. Environ. 2004, 38, 4551–4560. [Google Scholar] [CrossRef]
  31. Guo, H.; Cheng, H.R.; Ling, Z.H.; Louie, P.K.K.; Ayoko, G.A. Which emission sources are responsible for the volatile organic compounds in the atmosphere of Pearl River Delta? J. Hazard. Mater. 2011, 188, 116–124. [Google Scholar] [CrossRef]
  32. Yuan, B.; Hu, W.W.; Shao, M.; Wang, M.; Chen, W.T.; Lu, S.H.; Zeng, L.M.; Hu, M. VOC emissions, evolutions and contributions to SOA formation at a receptor site in eastern China. Atmos. Chem. Phys. 2013, 13, 6631–6679. [Google Scholar] [CrossRef]
  33. Wang, H.; Welch, A.M.; Nagalingam, S.; Leong, C.; Czimczik, C.I.; Tang, J.; Seco, R.; Rinnan, R.; Vettikkat, L.; Schobesberger, S.; et al. High temperature sensitivity of Arctic isoprene emissions explained by sedges. Nat. Commun. 2024, 15, 6144. [Google Scholar] [CrossRef]
  34. Borbon, A.; Fontaine, H.; Veillerot, M.; Locoge, N.; Galloo, J.C.; Guillermo, R. An investigation into the traffic-related fraction of isoprene at an urban location. Atmos. Environ. 2001, 35, 3749–3760. [Google Scholar] [CrossRef]
  35. Wagner, P.; Kuttler, W. Biogenic and anthropogenic isoprene in the near-surface urban atmosphere—A case study in Essen, Germany. Sci. Total Environ. 2014, 475, 104–115. [Google Scholar] [CrossRef] [PubMed]
  36. Panopoulou, A.; Liakakou, E.; Sauvage, S.; Gros, V.; Locoge, N.; Stavroulas, I.; Bonsang, B.; Gerasopoulos, E.; Mihalopoulos, N. Yearlong measurements of monoterpenes and isoprene in a Mediterranean city (Athens): Natural vs anthropogenic origin. Atmos. Environ. 2020, 243, 117803. [Google Scholar] [CrossRef]
  37. Guenther, A.B.; Jiang, X.; Heald, C.L.; Sakulyanontvittaya, T.; Duhl, T.; Emmons, L.K.; Wang, X. The model of emissions of gases and aerosols from nature version 2.1 (MEGAN2.1): An extended and updated framework for modeling biogenic emissions. Geosci. Model Dev. 2012, 5, 1471–1492. [Google Scholar] [CrossRef]
  38. Carter, W.P.L. Development of ozone reactivity scales for volatile organic compounds. Air Waste 1994, 44, 881. [Google Scholar] [CrossRef]
  39. Garcia, A.R.; Volkamer, R.; Molina, L.T.; Molina, M.J.; Samuelson, J.; Mellqvist, J.; Galle, B.; Herndon, S.C.; Kolb, C.E. Separation of emitted and photochemical formaldehyde in Mexico City using a statistical analysis and a new pair of gas-phase tracers. Atmos. Chem. Phys. 2006, 6, 4545–4557. [Google Scholar] [CrossRef]
  40. Ma, Y.; Diao, Y.; Zhang, B.; Wang, W.; Ren, X.; Yang, D.; Wang, M.; Shi, X.; Zheng, J. Detection of formaldehyde emissions from an industrial zone in the Yangtze River Delta region of China using a proton transfer reaction ion-drift chemical ionization mass spectrometer. Atmos. Meas. Tech. 2016, 9, 6101–6116. [Google Scholar] [CrossRef]
  41. Chen, W.; Xu, X.; Liu, W. Combined PMF modelling and machine learning to identify sources and meteorological influencers of volatile organic compound pollution in an industrial city in eastern China. Atmos. Environ. 2024, 334, 120714. [Google Scholar] [CrossRef]
  42. Yuan, Q.; Zhang, Z.; Chen, Y.; Hui, L.; Wang, M.; Xia, M.; Zou, Z.; Wei, W.; Ho, K.F.; Wang, Z.; et al. Origin and transformation of volatile organic compounds at a regional background site in Hong Kong: Varied photochemical processes from different source regions. Sci. Total Environ. 2024, 908, 168316. [Google Scholar] [CrossRef] [PubMed]
  43. de Gouw, J.A.; Middlebrook, A.M.; Warneke, C.; Goldan, P.D.; Kuster, W.C.; Roberts, J.M.; Fehsenfeld, F.C.; Worsnop, D.R.; Canagaratna, M.R.; Pszenny, A.A.P.; et al. Budget of organic carbon in a polluted atmosphere: Results from the New England air quality study in 2002. J. Geophys. Res. Atmos. 2005, 110, D16305. [Google Scholar] [CrossRef]
  44. Sheng, J.; Zhao, D.; Ding, D.; Li, X.; Huang, M.; Gao, Y.; Quan, J.; Zhang, Q. Characterizing the level, photochemical reactivity, emission, and source contribution of the volatile organic compounds based on PTR-TOF-MS during winter haze period in Beijing, China. Atmos. Res. 2018, 212, 54–63. [Google Scholar] [CrossRef]
  45. Han, Y.; Huang, X.; Wang, C.; Zhu, B.; He, L. Characterizing oxygenated volatile organic compounds and their sources in rural atmospheres in China. J. Environ. Sci. 2019, 31, 150–157. [Google Scholar] [CrossRef]
  46. Ho, K.F.; Lee, S.C.; Louie, P.K.K.; Zou, S.C. Seasonal variation of carbonyl compound concentrations in urban area of Hong Kong. Atmos. Environ. 2002, 36, 1259–1265. [Google Scholar] [CrossRef]
  47. Huang, X.F.; Wang, C.; Zhu, B.; Lin, L.L.; He, L.Y.J.E.P. Exploration of sources of OVOCs in various atmospheres in southern China *. Environ. Pollut. 2019, 249, 831–842. [Google Scholar] [CrossRef]
  48. Likun, X.; Rongrong, G.; Tao, W.; Xinfeng, W.; Sandra, S.; Donald, B.; Louie, P.K.K.; Luk, C.W.Y.; Isobel, S.; Zheng, X.J.A.C.; et al. Oxidative capacity and radical chemistry in the polluted atmosphere of HongKong and Pearl River Delta region: Analysis of a severe photochemical smogepisode. Atmos. Chem. Phys. 2016, 16, 1–26. [Google Scholar]
  49. Volkamer, R.; Sheehy, P.; Molina, L.T.; Molina, M.J. Oxidative capacity of the Mexico City atmosphere-Part 1: A radical source perspective. Atmos. Chem. Phys. 2010, 10, 6969–6991. [Google Scholar] [CrossRef]
  50. Haichao, W.; Xuefei, M.; Zhaofeng, T.; Hongli, W.; Xiaorui, C.; Shiyi, C.; Yaqin, G.; Ying, L.; Yuhan, L.; Xinping, Y. Anthropogenic monoterpenes aggravating ozone pollution. Natl. Sci. Rev. 2022, 9, nwac103. [Google Scholar] [CrossRef]
  51. Borbon, A.; Dominutti, P.; Panopoulou, A.; Gros, V.; Sauvage, S.; Farhat, M.; Afif, C.; Elguindi, N.; Fornaro, A.; Granier, C.; et al. Ubiquity of Anthropogenic Terpenoids in Cities Worldwide: Emission Ratios, Emission Quantification and Implications for Urban Atmospheric Chemistry. J. Geophys. Res. Atmos. 2023, 128, e2022JD037566. [Google Scholar] [CrossRef]
  52. Hua, J.; Wang, Q.; Chen, N.; Zhu, B.; Yu, H. Quantification and source apportionment of atmospheric oxidation capacity in urban atmosphere by considering reactive chlorine species and photochemical loss of VOCs. Sci. Total Environ. 2025, 959, 178201. [Google Scholar] [CrossRef] [PubMed]
  53. Wu, Y.; Fan, X.; Liu, Y.; Zhang, J.; Wang, H.; Sun, L.; Fang, T.; Mao, H.; Hu, J.; Wu, L.; et al. Source apportionment of VOCs based on photochemical loss in summer at a suburban site in Beijing. Atmos. Environ. 2023, 293, 119459. [Google Scholar] [CrossRef]
  54. Liu, B.; Yang, Y.; Yang, T.; Dai, Q.; Zhang, Y.; Feng, Y.; Hopke, P.K. Effect of photochemical losses of ambient volatile organic compounds on their source apportionment. Environ. Int. 2023, 172, 107766. [Google Scholar] [CrossRef]
  55. Brito, J.; Wurm, F.; Yáñez-Serrano, A.M.; De Assunção, J.V.; Godoy, J.M.; Artaxo, P. Vehicular Emission Ratios of VOCs in a Megacity Impacted by Extensive Ethanol Use: Results of Ambient Measurements in São Paulo, Brazil. Environ. Sci. Technol. 2015, 49, 11381–11387. [Google Scholar] [CrossRef] [PubMed]
  56. Zhu, B.; Han, Y.; Wang, C.; Huang, X.; Xia, S.; Niu, Y.; Yin, Z.; He, L. Understanding primary and secondary sources of ambient oxygenated volatile organic compounds in Shenzhen utilizing photochemical age-based parameterization method. J. Environ. Sci. 2019, 75, 105–114. [Google Scholar] [CrossRef]
  57. Wang, C.; Huang, X.F.; Han, Y.; Zhu, B.; He, L.-Y. Sources and Potential Photochemical Roles of Formaldehyde in an Urban Atmosphere in South China. J. Geophys. Res. Atmos. 2017, 122, 11–934. [Google Scholar] [CrossRef]
  58. Wei, C.-B.; Yu, G.-H.; Cao, L.-M.; Han, H.-X.; Xia, S.-Y.; Huang, X.-F. Tempo-spacial variation and source apportionment of atmospheric formaldehyde in the Pearl River Delta, China. Atmos. Environ. 2023, 312, 120016. [Google Scholar] [CrossRef]
  59. Yuan, B.; Chen, W.; Shao, M.; Wang, M.; Lu, S.; Wang, B.; Liu, Y.; Chang, C.C.; Wang, B. Measurements of ambient hydrocarbons and carbonyls in the Pearl River Delta (PRD), China. Atmos. Res. 2012, 116, 93–104. [Google Scholar] [CrossRef]
  60. Zhang, G.; Zhou, X.; Sun, Y.; Han, C.; Xian, J.; Mu, C.; Xu, W.; Liang, L. Oxygenated volatile organic compounds in Beijing: Characteristics, chemical reactivity, and source identification. Environ. Pollut. 2025, 373, 126065. [Google Scholar] [CrossRef]
  61. Hunter, J.F.; Day, D.A.; Palm, B.B.; Yatavelli, R.L.N.; Chan, A.W.H.; Kaser, L.; Cappellin, L.; Hayes, P.L.; Cross, E.S.; Carrasquillo, A.J.; et al. Comprehensive characterization of atmospheric organic carbon at a forested site. Nat. Geosci. 2017, 10, 748–753. [Google Scholar] [CrossRef]
  62. Legreid, G.; Lööv, J.B.; Staehelin, J.; Hueglin, C.; Hill, M.; Buchmann, B.; Prevot, A.S.H.; Reimann, S. Oxygenated volatile organic compounds (OVOCs) at an urban background site in Zürich (Europe): Seasonal variation and source allocation. Atmos. Environ. 2007, 41, 8409–8423. [Google Scholar] [CrossRef]
  63. Xu, Y.; Cugurullo, F.; Zhang, H.; Gaio, A.; Zhang, W. The Emergence of Artificial Intelligence in Anticipatory Urban Governance: Multi-Scalar Evidence of China’s Transition to City Brains. J. Urban Technol. 2024, 32, 9–33. [Google Scholar] [CrossRef]
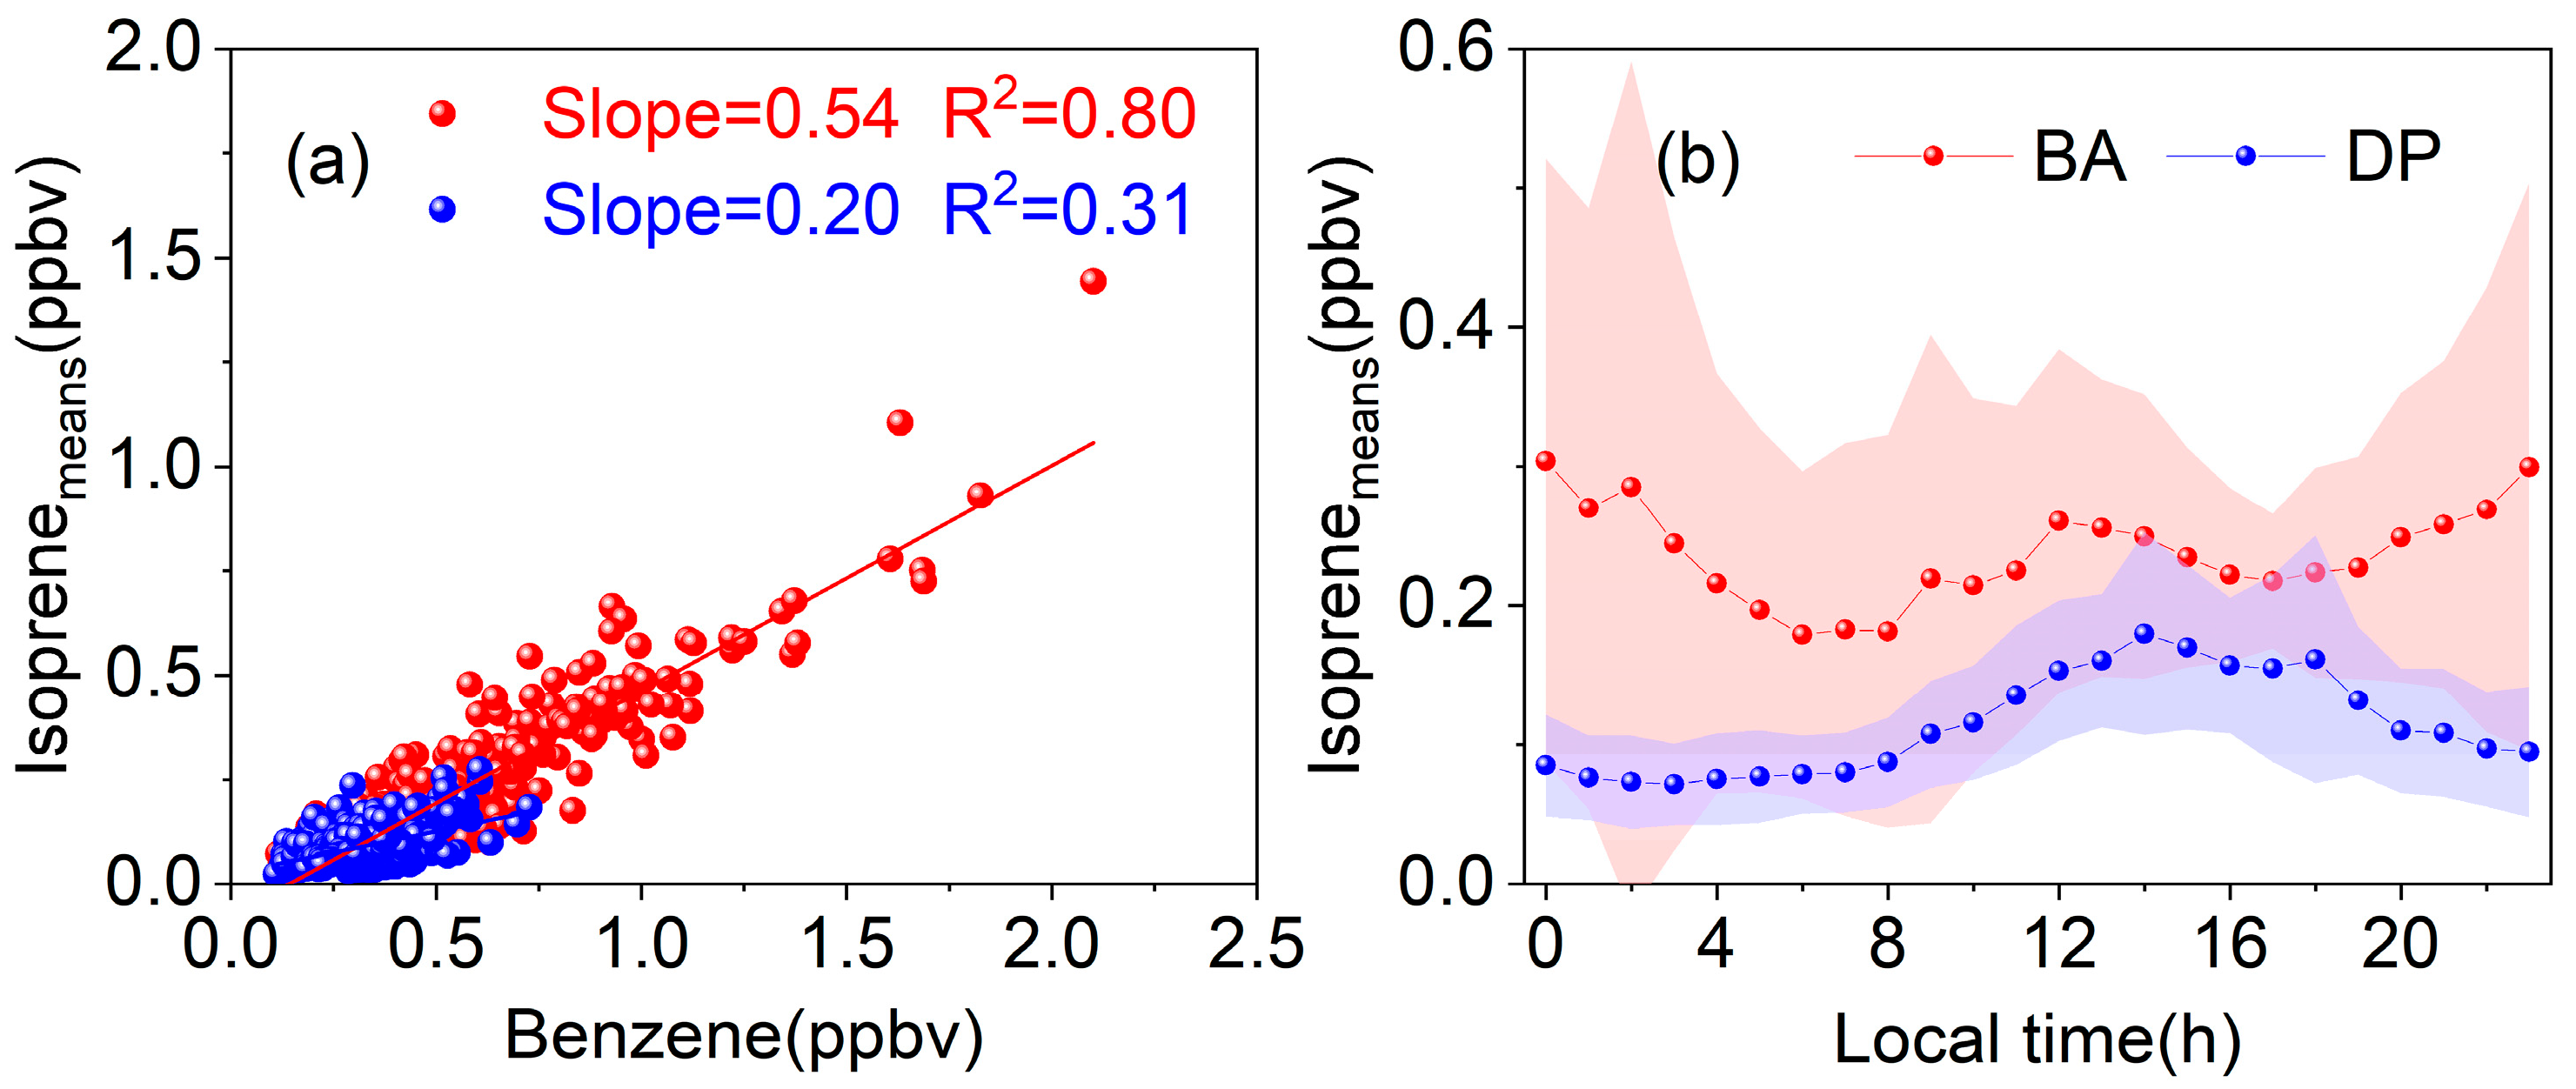
Figure 1. (a) Correlation between isoprene and benzene observed at night; (b) Daily variation characteristics of isoprene observations at BA and DP sites.
Atmosphere 16 01016 g001
Figure 2. Concentrations of measured VOCs and calculated daytime ozone formation potential (OFP) at (a) BA and (b) DP.
Atmosphere 16 01016 g002
Figure 3. Diurnal variation characteristics of observed O3 and normalized VOCs (af).
Atmosphere 16 01016 g003
Figure 4. (a) and (b): Diurnal variation in anthropogenic and biogenic sources of BA and DP isoprene; (c) and (d): Comparison of biogenic sources of OVOCs before and after improvement at BA and DP sites.
Atmosphere 16 01016 g004
Figure 5. Source apportionment results for four OVOCs at urban and suburban sites. (a) BA and (b) DP.
Atmosphere 16 01016 g005
Disclaimer/Publisher’s Note: The statements, opinions and data contained in all publications are solely those of the individual author(s) and contributor(s) and not of MDPI and/or the editor(s). MDPI and/or the editor(s) disclaim responsibility for any injury to people or property resulting from any ideas, methods, instructions or products referred to in the content.