Article

Surface Wind Monitoring at Small Regional Airport

by
Ladislav Choma
*,
Matej Antosko
and
Peter Korba
Faculty of Aeronautics, Technical University of Kosice, Rampova 7, 041 21 Kosice, Slovakia
*
Author to whom correspondence should be addressed.
Atmosphere 2025, 16(8), 917; https://doi.org/10.3390/atmos16080917
Submission received: 24 June 2025 / Revised: 21 July 2025 / Accepted: 24 July 2025 / Published: 29 July 2025
(This article belongs to the Section Meteorology)

Abstract

This study focuses on surface wind analysis at the small regional airport in Svidnik, used primarily for pilot training under daytime VFR conditions. Due to the complex local terrain and lack of prior meteorological data, an automatic weather station was installed, collecting over 208,000 wind measurements over a two-year period at ten-minute intervals. The dataset was processed using hierarchical filtering and statistical selection, and visualized via wind rose diagrams. The results confirmed a dominant southeastern wind component, supporting the current runway orientation (01/19). However, a less frequent easterly wind direction was identified as a safety concern, causing turbulence near the runway due to terrain and vegetation. This is particularly critical for trainee pilots during final approach and landing. Statistical analysis showed that easterly winds, though less common, appear year-round with a peak in summer. Pearson correlation and linear regression confirmed a significant relationship between the number of easterly wind days and their measurement frequency. Daytime winds were stronger than nighttime, justifying the focus on daylight data. The study provides practical recommendations for training flight safety and highlights the value of localized wind monitoring at small airports. The presented methodology offers a framework for improving operational awareness and reducing risk in complex environments.

1. Introduction

Monitoring surface wind is a key aspect of air traffic operations, especially at small regional airports, where shorter and less frequent flights are often conducted. Surface wind, measured near the Earth’s surface, has a significant impact on the safety of flights, take-offs, and landings. At these airports, where infrastructure and technical equipment may be limited, accurate and timely monitoring of meteorological conditions—such as wind direction and speed—is essential for the safe and efficient execution of air operations. Strong winds or sudden wind shifts can significantly affect aircraft stability during take-off or landing, thereby increasing the risk of accidents. Given the specifics of regional airports, such as shorter runways and frequent operational restrictions, proper forecasting and interpretation of surface wind play a crucial role in flight planning. Rapid changes in wind direction, turbulence, and gusts can be particularly hazardous near the surface, where aircraft perform the largest maneuvers during take-off and landing. Therefore, surface wind monitoring enables pilots to take the necessary safety measures, such as adjusting flight plans, changing runway direction, or delaying take-off time. Currently, there are numerous technical devices for monitoring meteorological conditions that provide accurate data on wind parameters. However, at small airports, it is essential that this data is processed and interpreted efficiently to ensure smooth operations. The implementation of modern meteorological technologies can significantly contribute to improving safety and operational efficiency at these airports. For this reason, it is necessary to continuously improve the processes of surface wind monitoring and the evaluation of its impact on air operations, directly contributing to risk reduction and enhancing overall aviation safety. The importance of surface wind is also documented by several studies. For example, Sumaja et al. [1] showed that changes in wind direction (especially crosswind) significantly affect the safety of take-offs and landings. At I Gusti Ngurah Rai Airport, they analyzed more than 140,000 records and identified high risks under certain wind conditions. Similar findings were presented by Han et al. [2], who identified a positive correlation between the magnitude of crosswind and the probability of overshoot during final approach, directly related to safety incidents. From a technological perspective in wind modeling, it is important to mention the study by Khattaka et al. [3], who used experimental measurements in a wind tunnel combined with modern machine learning models to predict the occurrence of strong crosswinds. Their approach demonstrated excellent predictive ability for specific airport configurations. The analysis of past accidents also highlights the importance of reliable wind monitoring—for example, incidents at airports in Warsaw [4], Charlotte [5], and Connecticut [6] were directly influenced by changing wind conditions near the runway, leading to premature touchdowns, insufficient braking, or aircraft crashes. From a methodological point of view, several approaches to wind data processing exist. As noted by Parker et al. [7], even short-term climatological data can serve as an effective tool for wind prediction, especially using wind rose diagrams. These tools are particularly beneficial in environments with a limited number of measuring devices. Additional studies by Keevallik et al. [8] and Simpson & Ramsay [9] highlight the influence of local topography and measurement accuracy on the interpretation of wind fields, which is especially relevant for small regional airports with irregular infrastructure and orographic obstacles. Thakur Gitanjali [10] uses meteorological data to model local wind conditions, including the creation of wind roses. Singh et al. [11] analyze local variations in wind in coastal areas and the parameterization of vertical wind shear, which are important for accurately modeling wind conditions that significantly affect flight stability during take-off and landing, especially at low altitudes. Hernández-Meléndez et al. [12] analyze specific locations and probabilistic wind distributions when calculating wind potential. Probabilistic wind distributions are crucial for estimating long-term wind conditions and energy yield at specific sites. The research of Prasanna et al. [13] provides valuable insights into the use of high-resolution numerical models to simulate wind fields in complex airport environments, enabling a detailed analysis of wind conditions affecting air traffic. This approach is also relevant to our research, as similar modeling could improve the interpretation of surface winds and support safety-related decision-making at small regional airports. The study by Rose et al. [14] emphasizes the importance of identifying and quantifying sources of uncertainty in derived wind data from meteorological analyses, which is key to ensuring the reliability of wind models. These findings are also important for our research, as they highlight the need for validation and caution when interpreting wind data obtained from automated systems at regional airports. Therefore, at small airports, it is essential that meteorological data is processed and interpreted efficiently. The implementation of modern technologies, such as automatic weather stations (e.g., AWOSs), combined with iterative and hierarchical data processing, can significantly contribute to improving safety and operational efficiency. Currently, methods such as iterative data filtering [15], hierarchical analysis [16], and heuristic optimization [17] have proven beneficial, increasing the accuracy of results in environments with limited data. These studies provide an overview of methods that enable a reduction in meteorological variables to the most significant factors affecting wind behavior. For these reasons, surface wind monitoring is not only an important but also a complex aspect of air traffic operations at regional airports. Research focused on its measurement, analysis, and visualization (e.g., through wind rose diagrams) is essential for improving flight safety and minimizing risks associated with sudden changes in wind conditions.
At Svidník Airport (LZSK), the most frequently used aircraft for flight training is the Viper SD-4, a light-sport category airplane certified for VFR operations. In addition to motorized flights, the airport is regularly used by hang glider and paraglider pilots, whose activity depends even more critically on suitable surface wind conditions, particularly during take-offs and slope soaring. These characteristics make the airport an ideal site for detailed wind risk assessment focused on pilot training safety.
The main objective of this research is to identify hazardous components of surface wind at a small regional airport used for initial pilot training through the creation of wind rose diagrams. Based on the above, the following research questions were formulated:
  • What are the dominant wind directions occurring at Svidnik Airport throughout the year?
  • Is there an observed occurrence of hazardous crosswinds during training flights?
  • How do the meteorological data from the station correlate with safety incidents or changes in air operations?

2. Methodology

To assess the various wind components affecting aircraft take-offs and landings at Svidnik Airport, data were obtained from the Meteohelix IoT Pro weather station, basic version. This station was acquired by the Faculty of Aeronautics at the Technical University of Kosice as part of the KEGA project 051TUKE–4/2021, titled “Integrated Laboratory for Digital Aviation Education in Selected Pilot Training Subjects” [18]. One of the prerequisites for purchasing the meteorological equipment was the guaranteed accuracy of the station’s sensor system in accordance with ICAO Annex 3 [19], and the installation was carried out following the standards of the World Meteorological Organization (WMO) [20]. When selecting the installation site, it was necessary to consider obstacles that could influence wind parameters, while ensuring that the measured data would best represent the conditions on the runway at Svidnik Airport, as prescribed by the WMO guidelines. The Meteohelix station was equipped with an ultrasonic sensor placed at a height of 4.5 m above ground level, in line with WMO recommendations for elevated locations with complex topography.

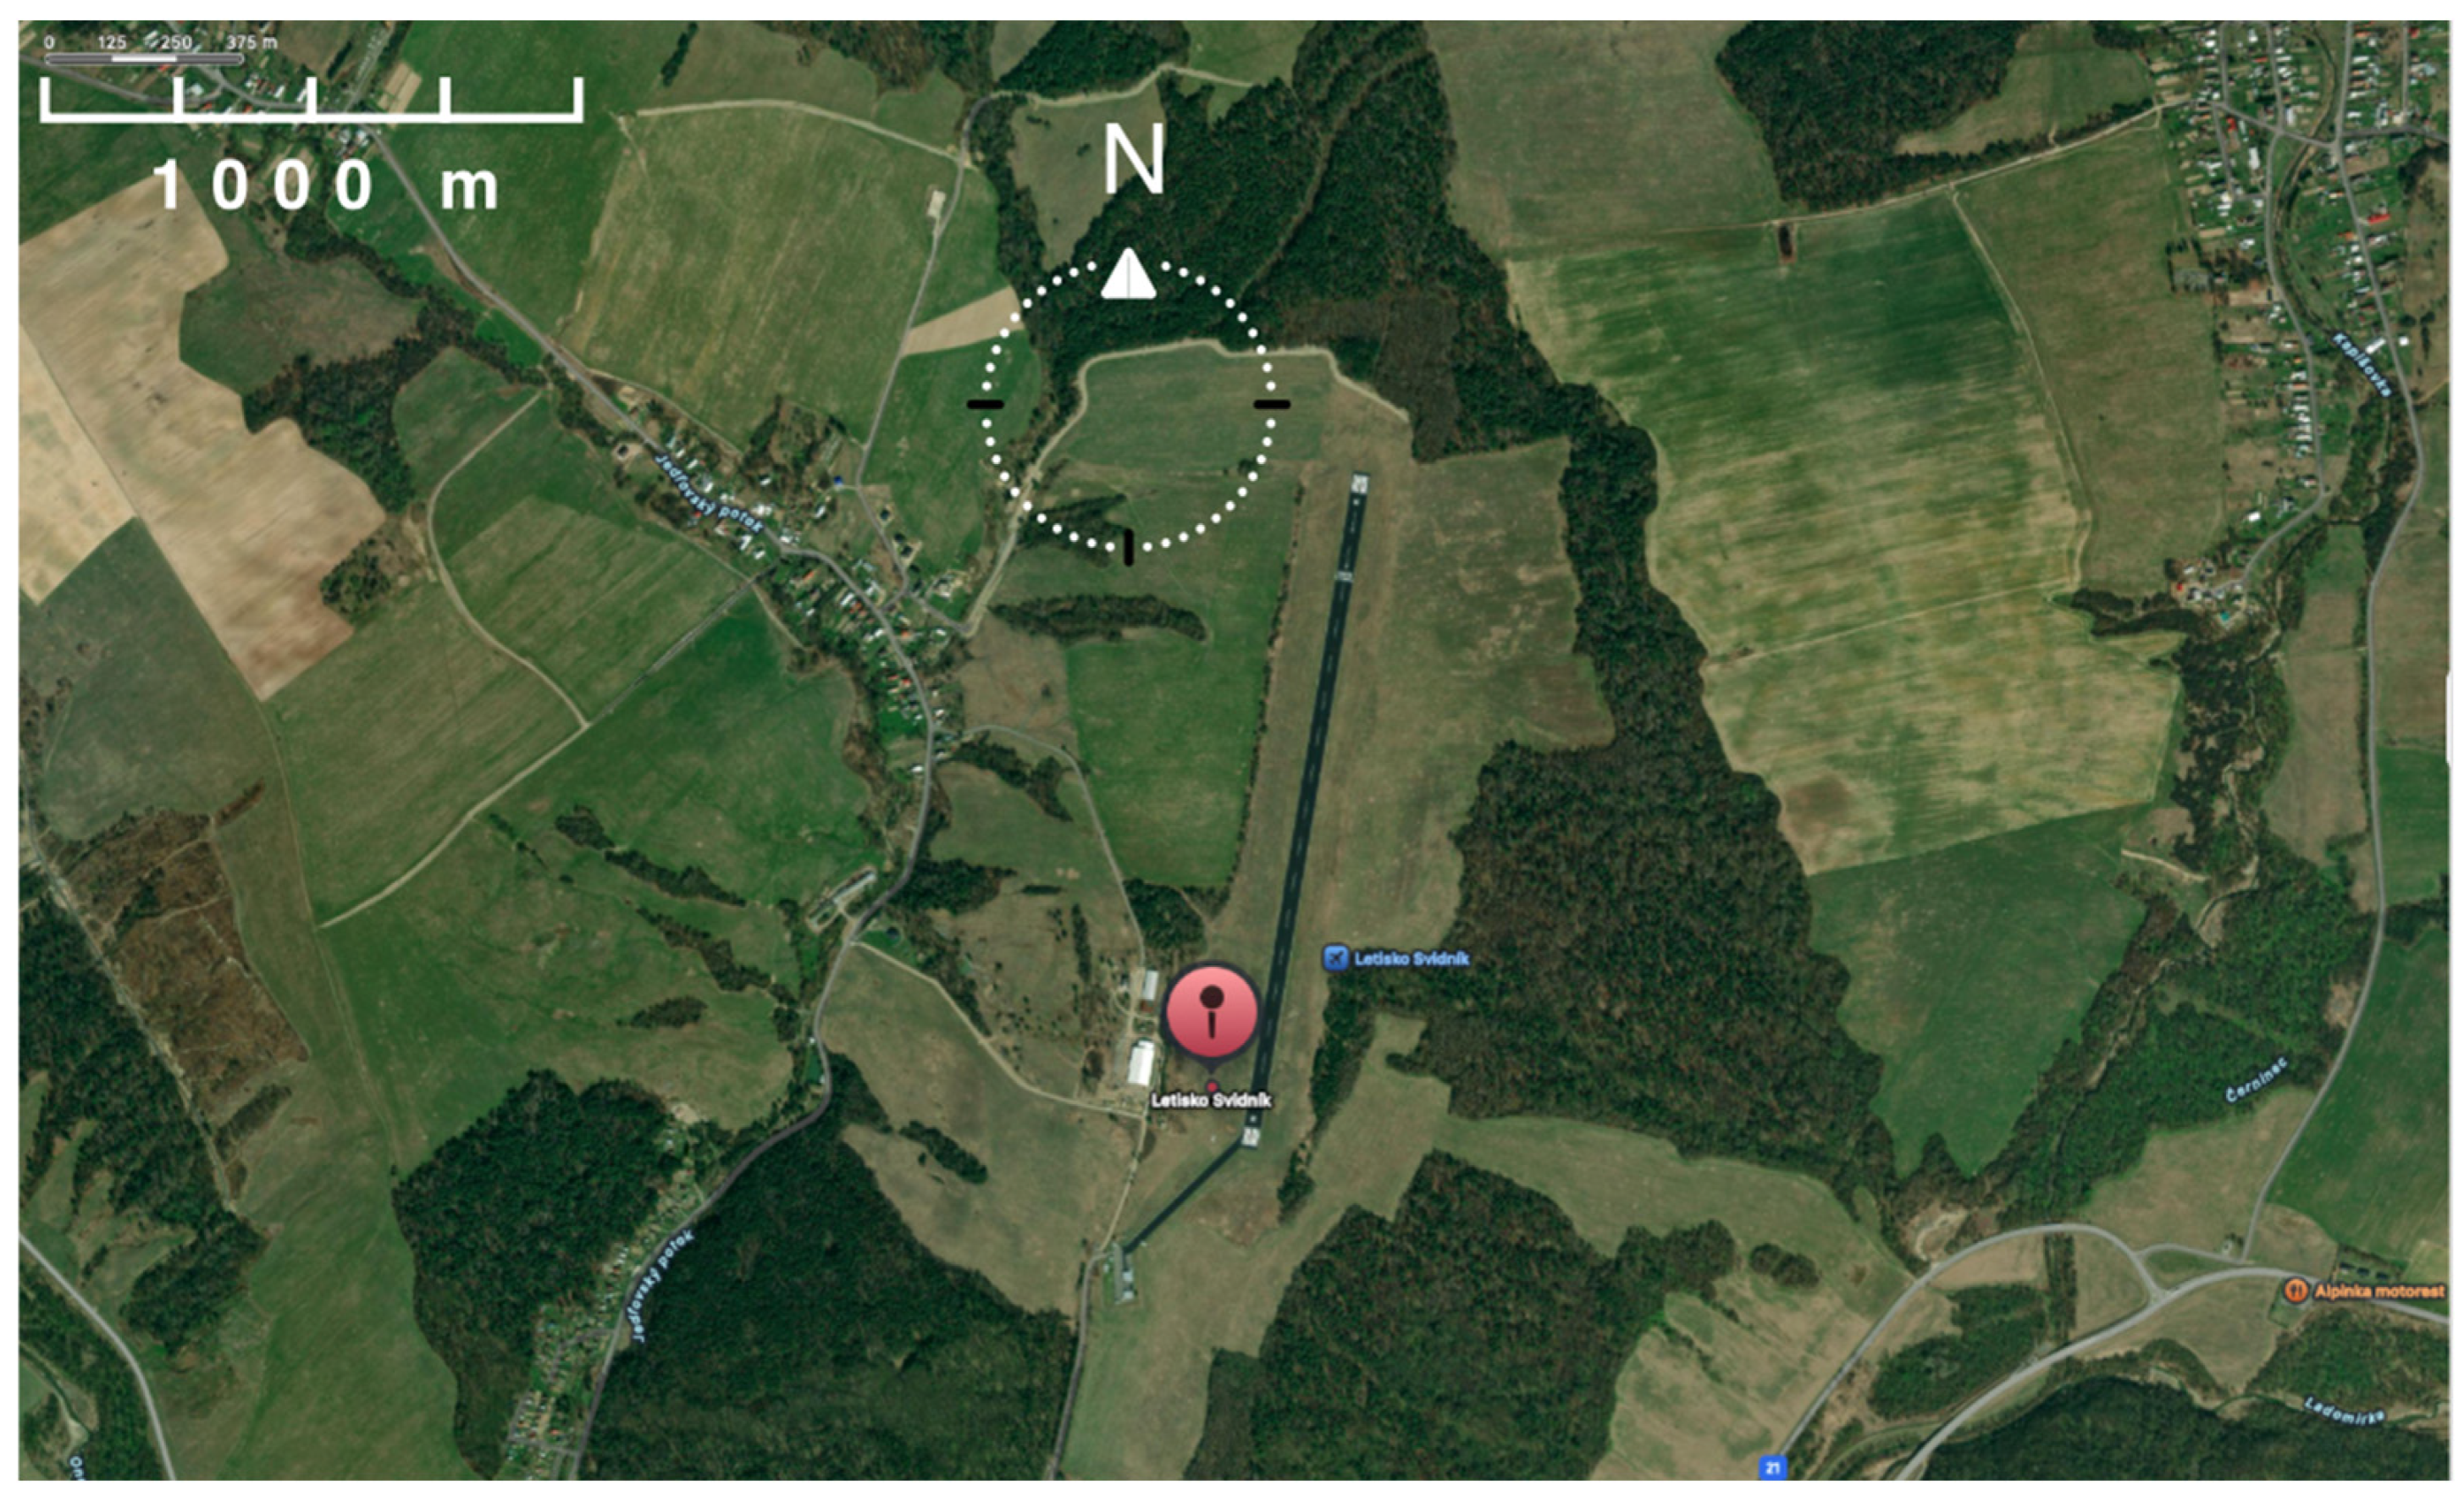
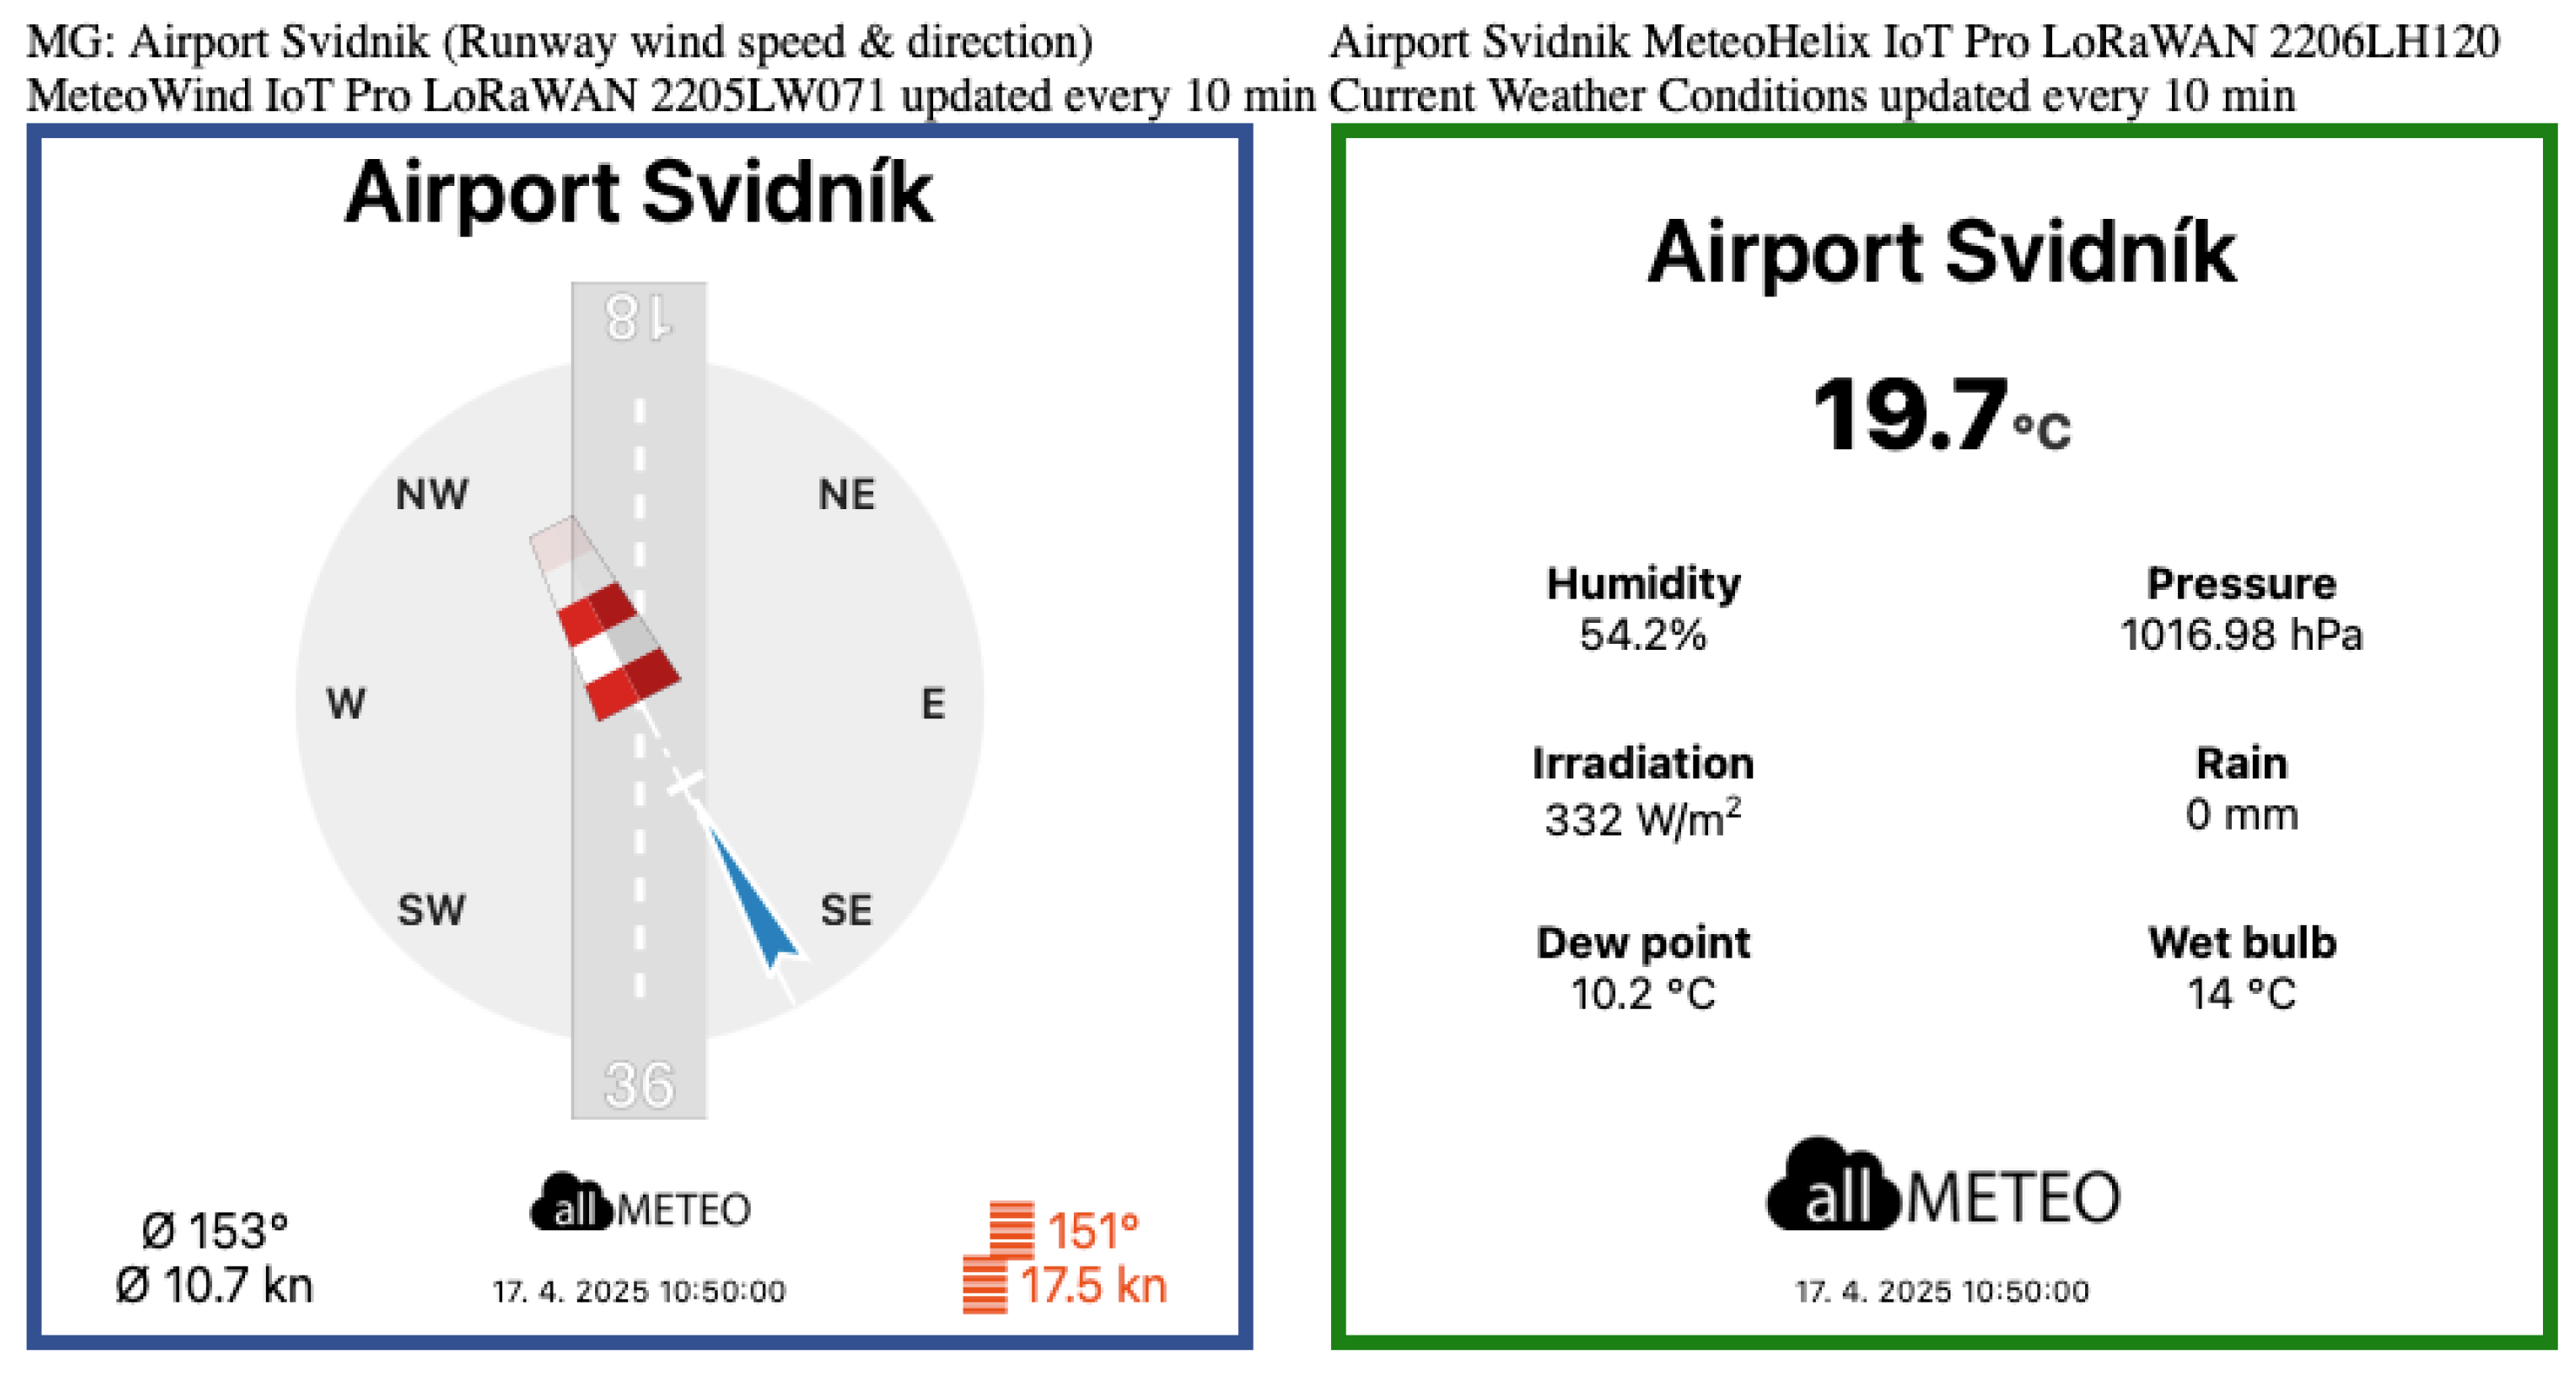
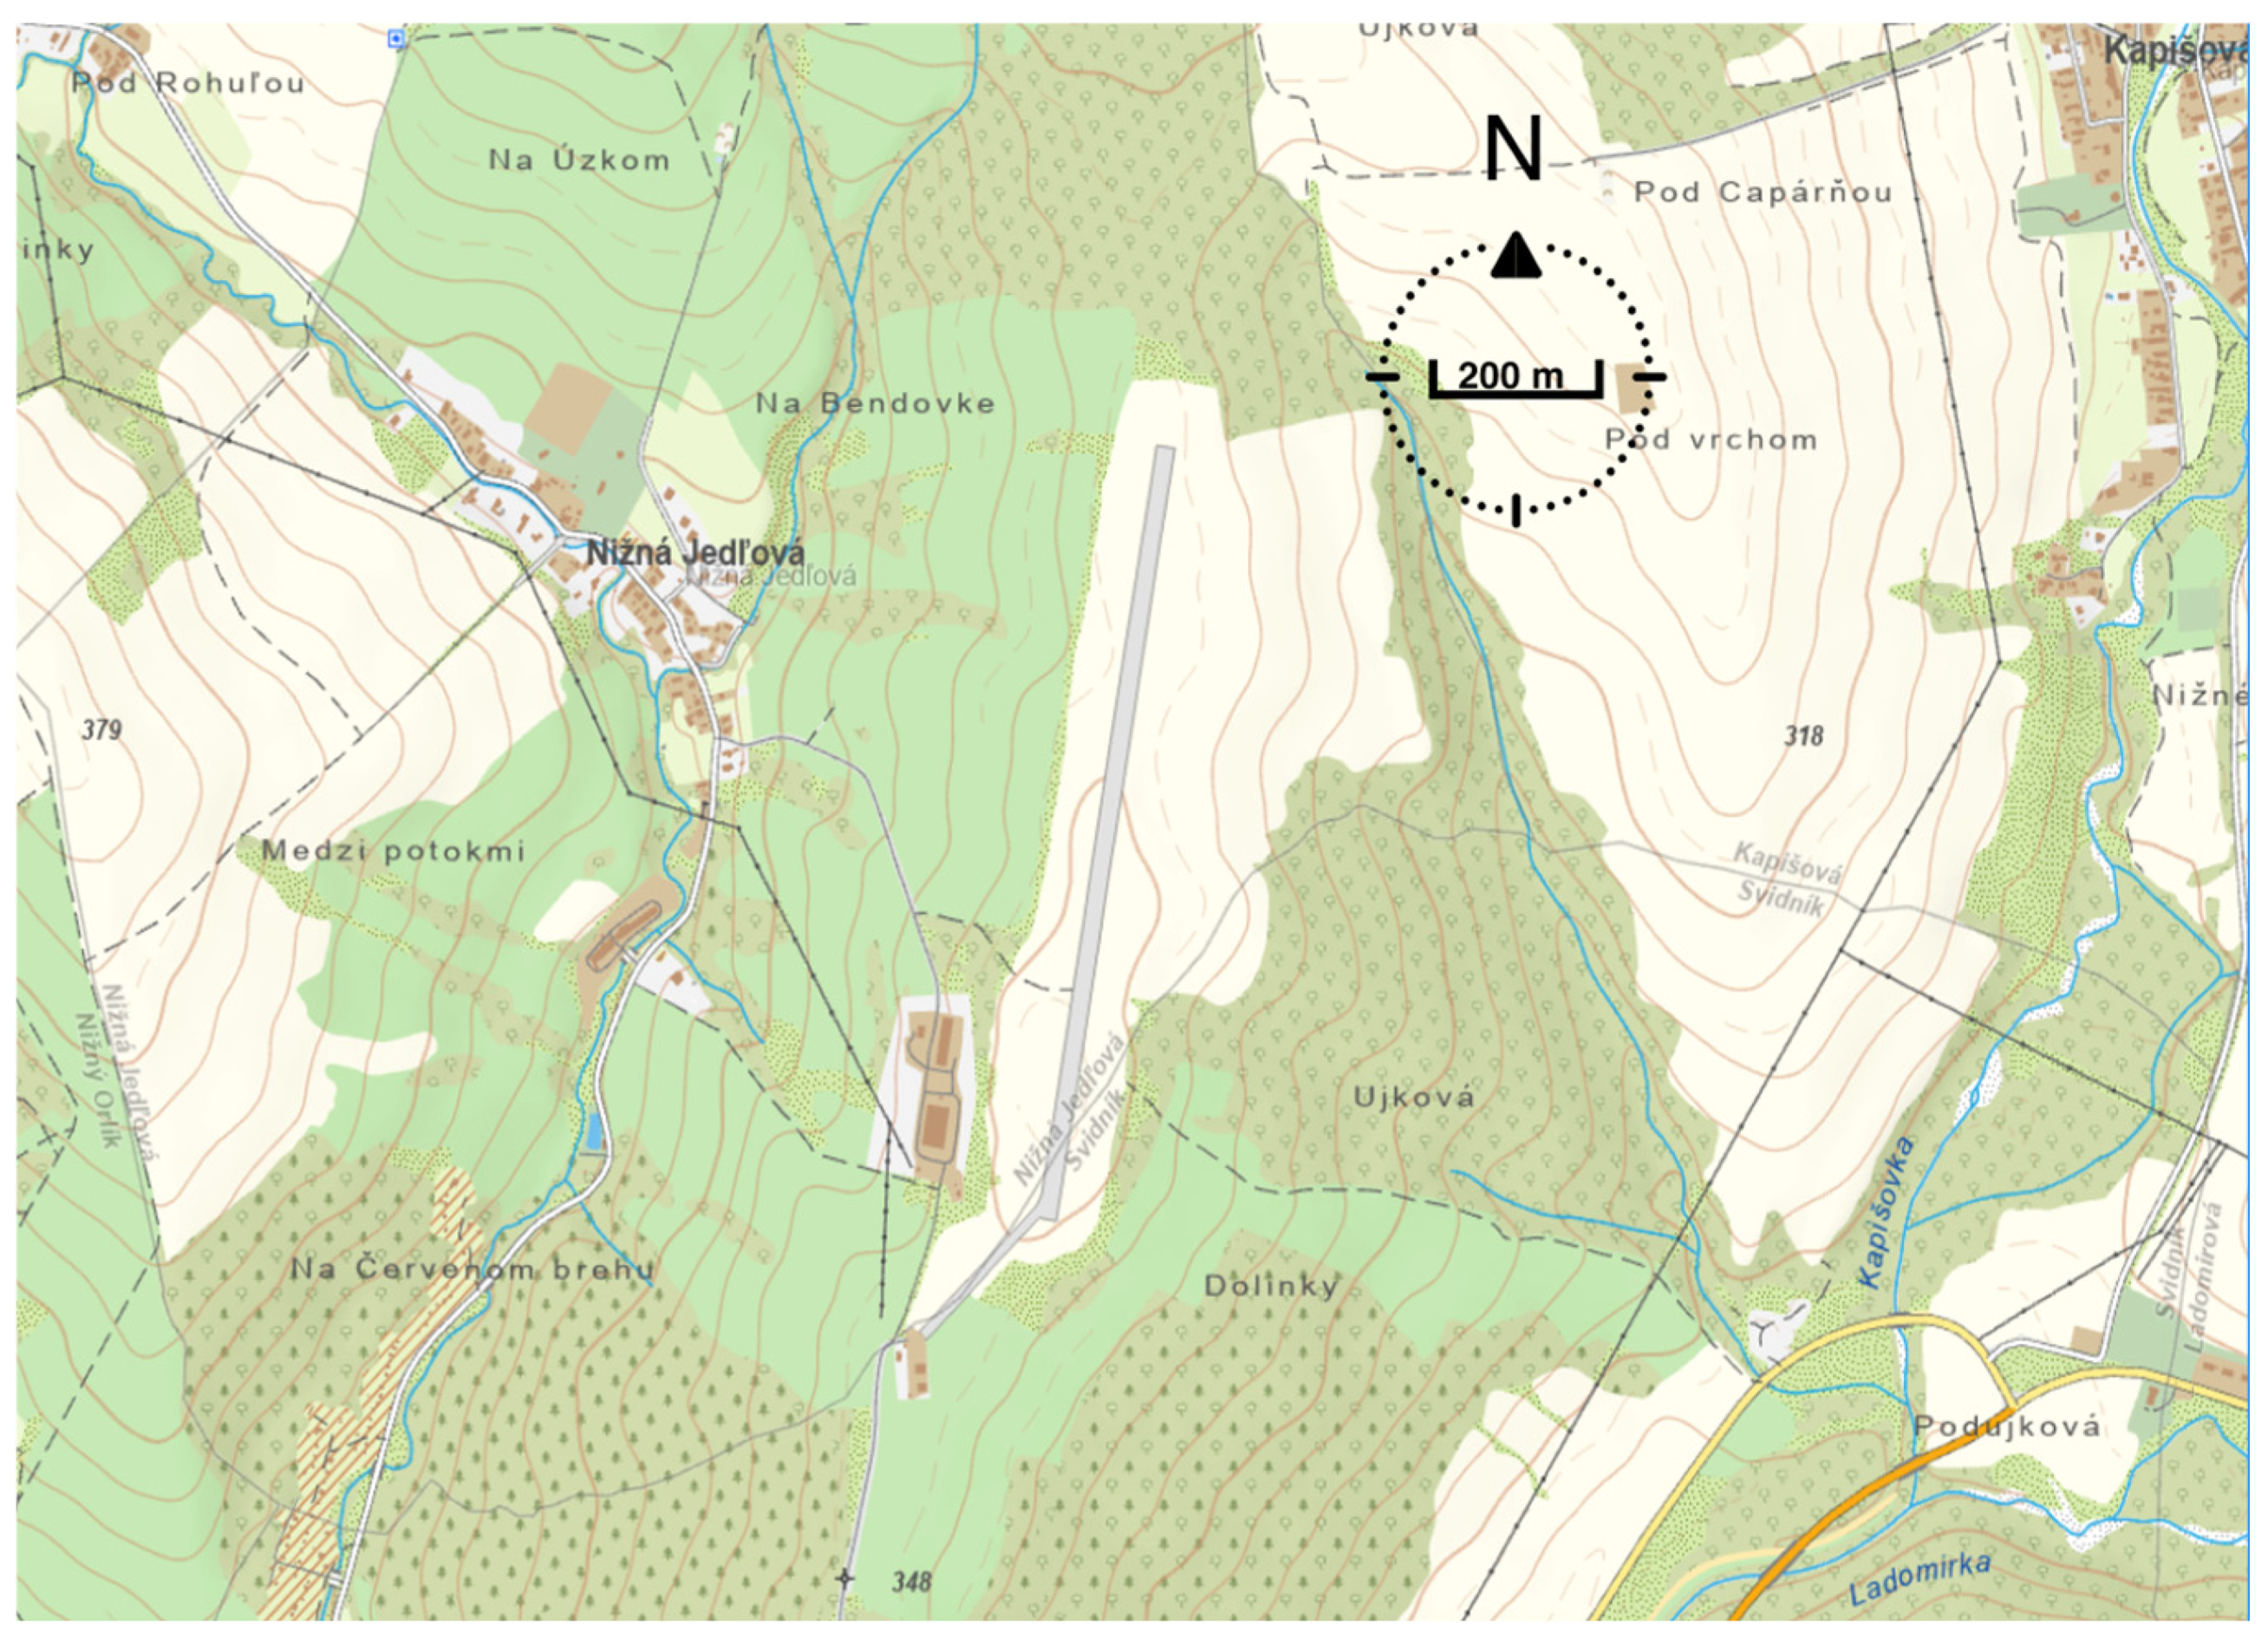
2.1. Station Location at Svidnik Airport

Svidník Airport (ICAO code LZSK) is located in the northeastern part of Slovakia, near the Slovak–Polish border. The area is characterized by complex terrain, dense forests, sparse population, and a limited number of suitable locations for airport construction. The airport itself is situated on a hill above the town of Svidník, with the runway aligned along the ridge. On both sides of the runway, the terrain gradually slopes downward. To ensure accurate wind measurements representative of both operational directions of the runway (01 and 19), the station was installed as close as possible to the side of the runway. At the same time, it was necessary to comply with the safety requirements of ICAO Annex 14—Aerodromes [21]. Installing a standard 10 m AGL mast closer to the runway was not feasible, as it would have placed the sensors at a lower elevation than the runway itself, potentially distorting the measurements due to turbulent eddies generated by the hill on which the airport is located. The WMO guidelines explicitly allow for reduced mast heights in such specific cases [20]. For this reason, the anemometer and wind vane were installed at a height of 4.5 m AGL, a compromise that ensured objective measurements while adhering to aviation safety principles concerning obstacle placement in the immediate vicinity of active runways. The station location is illustrated in Figure 1. The wind sensor position provides good exposure to both dominant and crosswind components affecting the final approach and take-off path. Instructors confirmed that the station location reflects operational wind conditions with good accuracy for runway 01/19.
Figure 1 shows the station’s location to the west of the runway. These represent the first systematic meteorological observations ever conducted at this location. The nearest aviation meteorological station to Svidnik Airport is located 50 km away at Presov Airport, while the closest climatological station is approximately 11 km away, in the village of Tisinec.

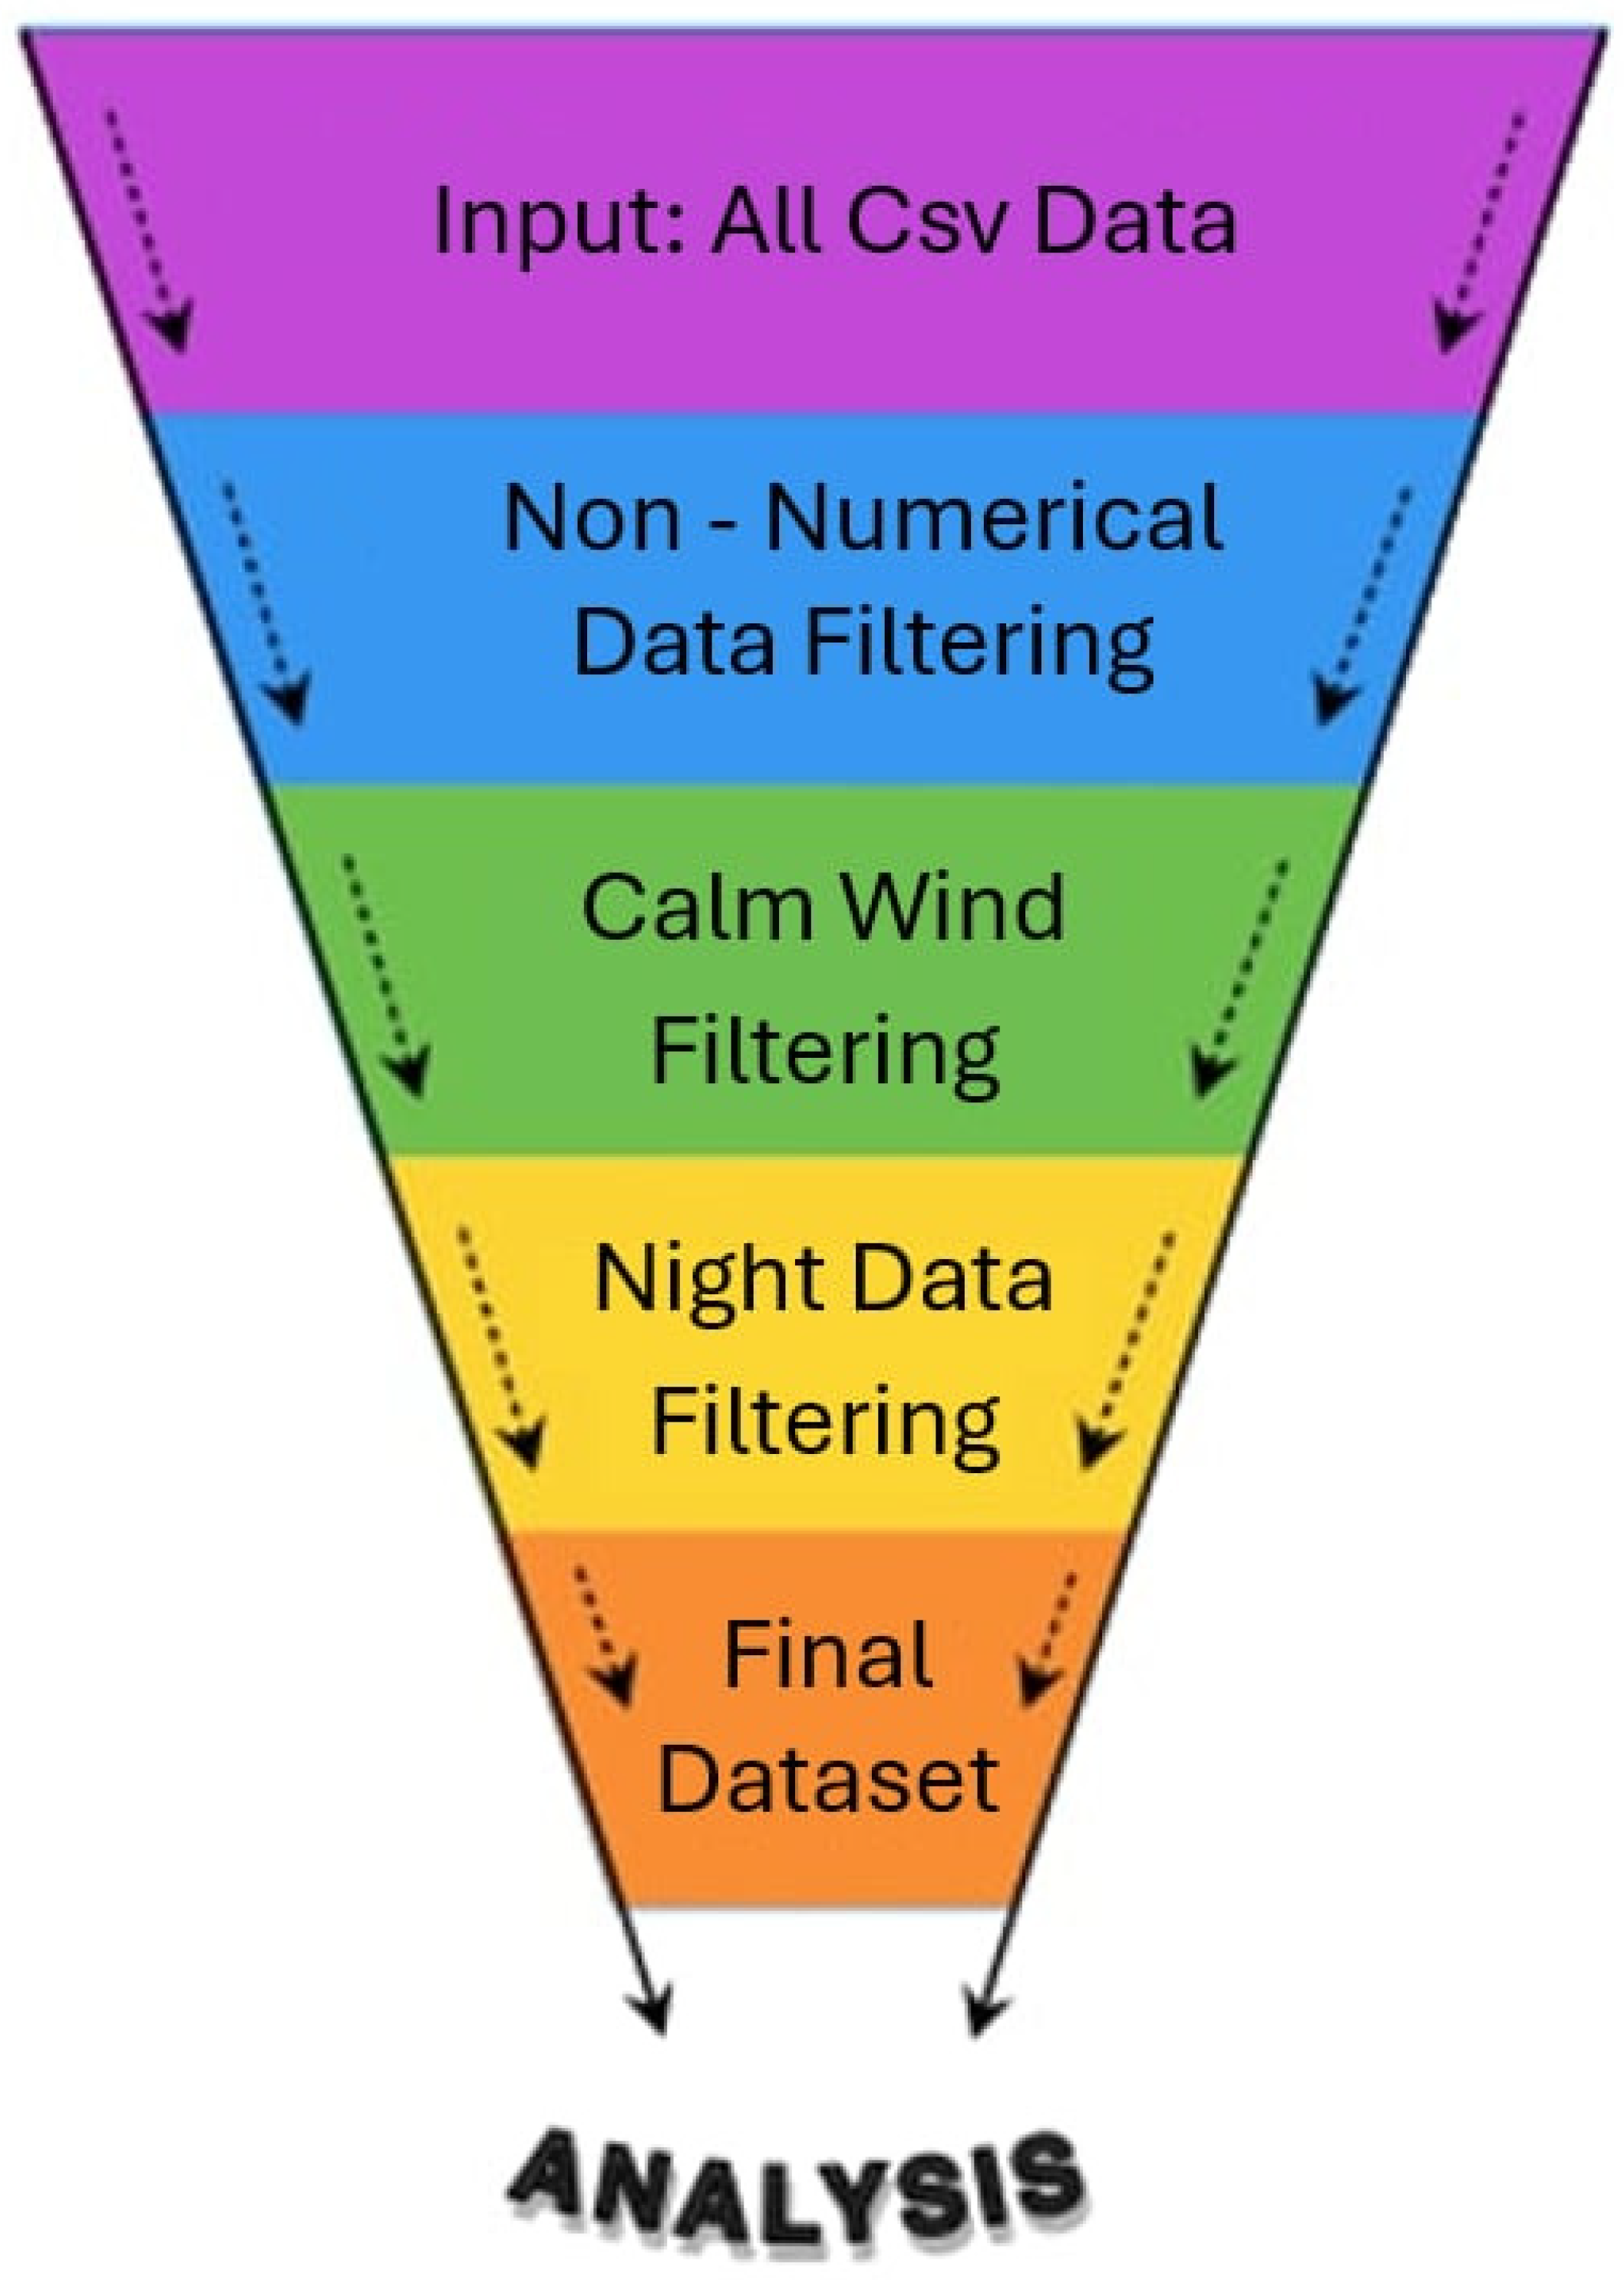
2.2. Data Mining and Filtering Method

Data collection using the station was carried out over a period of two years at ten-minute intervals and is still ongoing. The dataset, downloaded from cloud storage in CSV format, currently contains more than 208,000 individual records. For data processing and visualization, particularly the creation of wind rose diagrams, the statistical programming language R (v. 4.4.2) was used as an effective tool for displaying the frequency of wind occurrences. Such a large dataset represented raw data, from which it was necessary to extract a more refined subset. This involved filtering out erroneous strings, statistically insignificant data, or entries with timestamps that did not correspond to the desired dataset period. By applying iterative data selection using a hierarchical filtering method [22], a final dataset was obtained that met all the required quality and relevance criteria [23].
Given the large volume of raw data, it was necessary to implement a structured filtering procedure to ensure that only relevant and reliable data would be included in the statistical analysis. The following iterative hierarchical selection process was used:
  • Reduction in Matrix Columns—Columns irrelevant for statistical processing were removed from the dataset. These included variables such as maximum and minimum wind speeds, directions of maximum and minimum wind, 2 min averages, and other supplementary parameters not essential for the analysis. The dataset was reduced to include only the 10 min average wind speed and direction, as well as gust speed, aligning with the data structure required for aviation meteorological reports (METAR) [19].
  • Removal of Non-Numerical Entries—Rows containing non-numeric or incomplete values were deleted to prevent errors in statistical scripts. This ensured that no incomplete data entries, such as missing wind directions or isolated wind speeds without corresponding direction data, would affect the results.
  • Exclusion of Zero-Degree Wind Directions—Data entries showing a wind direction of 0° were excluded. According to meteorological conventions, this value is used to represent calm conditions, which are irrelevant for this study. Calm conditions do not generate turbulence and thus have no impact on operational safety at Svidnik Airport.
  • Exclusion of Zero Wind Speeds—Rows with a wind speed of 0 knots were also removed. Although these values might occur during calm conditions, they could also result from technical anomalies, such as the anemometer freezing during liquid precipitation combined with sub-zero temperatures. Such frozen states may produce constant directional readings at zero wind speed—an obvious artifact unsuitable for analysis.
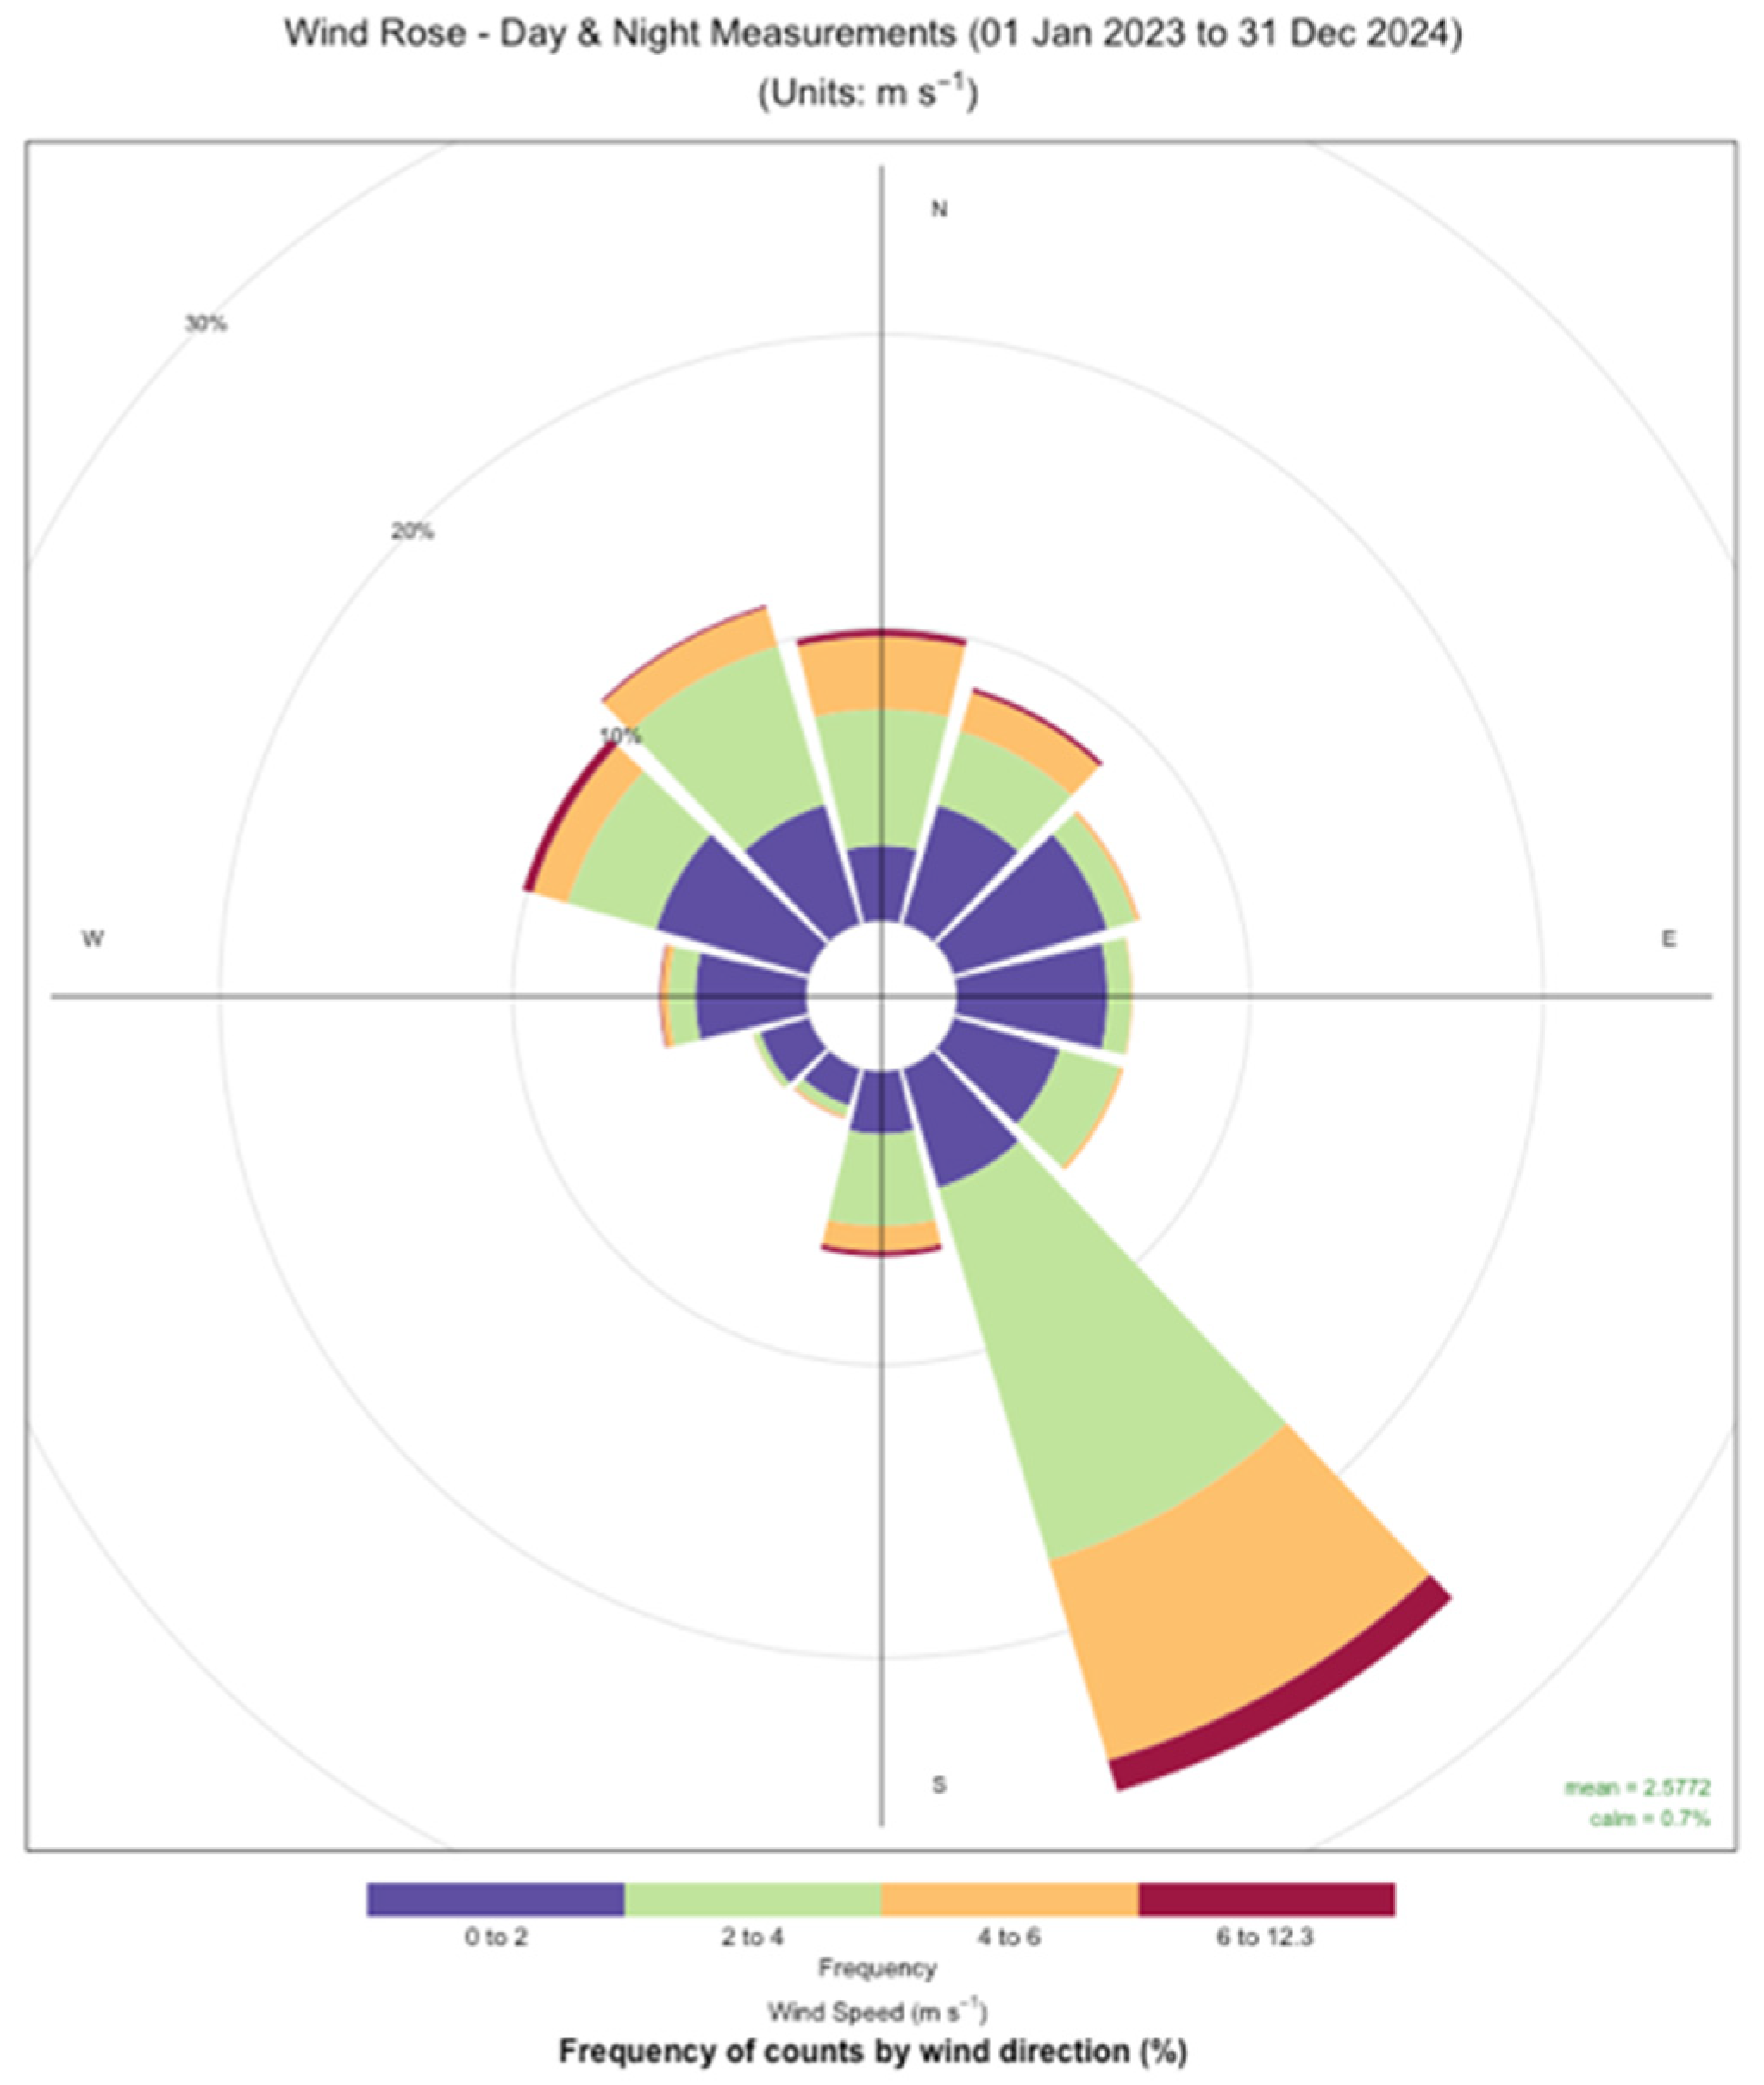
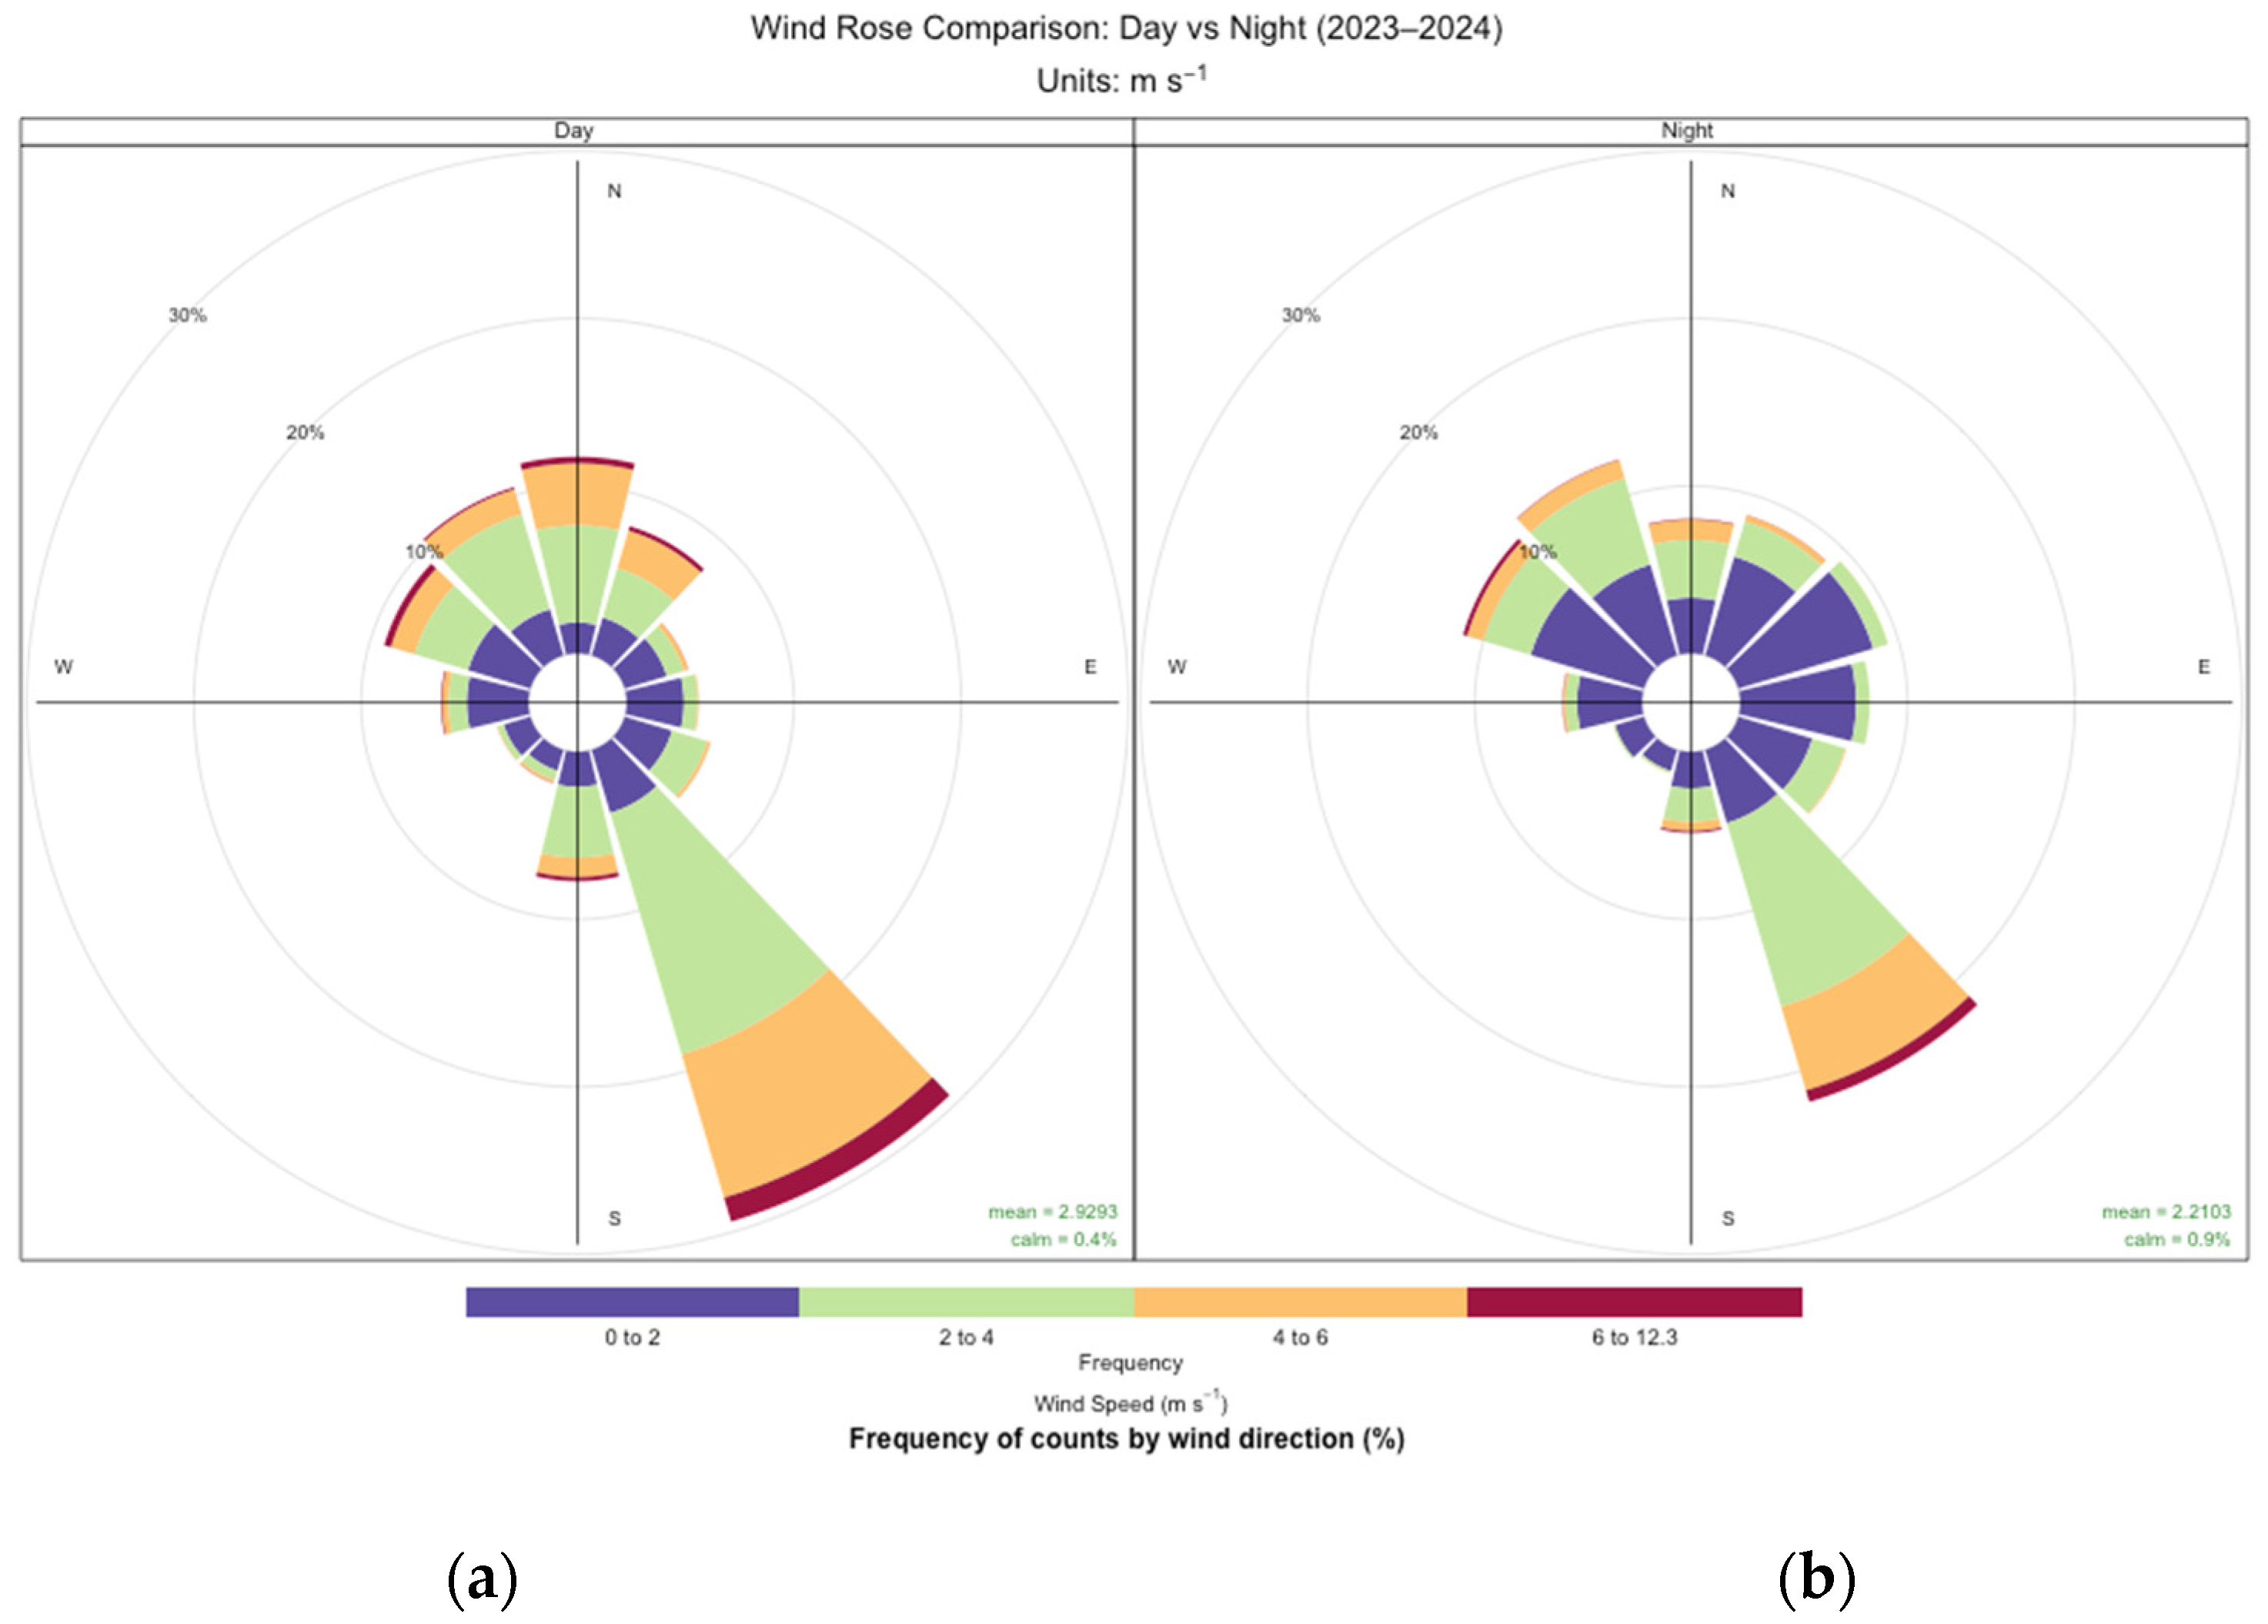
  • Filtering Based on Airport Operating Hours (Daytime Only)—As Svidnik Airport operates exclusively under daylight VFR conditions, only data corresponding to daytime hours (between sunrise and sunset) were used in the final dataset [24]. This filtering step was carried out using the “suncalc” function, which calculates sunrise and sunset times based on the GPS coordinates of the airport (published in AIP SR) for each row of the dataset. For comparison purposes, wind roses were also generated for both the complete dataset (including nighttime data) and daytime-only data. Analysis showed that nocturnal easterly winds were rare and generally decayed shortly after sunrise. Thus, daytime filtering preserved operational relevance without excluding significant hazardous cases.
  • Identification of Critical Wind Directions for Safety Analysis—Based on preliminary visualizations and analysis of wind roses, critical wind sectors affecting take-offs and landings were identified. Subsequently, pie charts representing the monthly frequency of these critical wind directions were created to identify periods of heightened risk. The most concerning wind directions were identified in the 075–105° sector, corresponding to low-level easterly flow across the terrain ridge east of runway 19. These conditions have been associated with turbulence and student go-arounds according to instructor testimony.
The aircraft most commonly used for pilot training at Svidník Airport is the Viper SD-4. According to the aircraft’s flight manual [25], its demonstrated crosswind limit is approximately 4 m/s (8 kt). For this study, a stricter operational threshold of 3 m/s was selected as the critical limit for solo student operations to ensure an adequate safety margin. All records exceeding this crosswind limit under easterly flow conditions were flagged for further statistical evaluation.
The entire process of iterative and hierarchical data filtering can be represented schematically as a funnel, progressively reducing the dataset’s volume until the final analytical subset is achieved, as illustrated in Figure 2.
Figure 2 illustrates the data flow through the selection process described in Steps 1 to 6, progressively filtering and reducing the dataset to its final analytical form. Based on the analysis of the final dataset and its visualization through wind rose diagrams, critical wind directions were identified in terms of their significance for aircraft take-off and landing operations during daylight hours. Building upon these findings, pie charts were created to represent the occurrence of these critical wind directions across individual months of the year, with the aim of identifying high-risk periods. The entire process—including data filtering, visualization, and the calculation of sunrise and sunset times based on the GPS coordinates of Svidnik Airport—was conducted using the R programming environment, which provided the necessary functionality for generating the required graphical outputs. During the monitored period, hazardous wind directions were recorded throughout the calendar year, albeit with varying frequencies across different months. It was important to determine the relationship between the number of measurements and the number of days on which such winds occurred. There was a possibility that many measurements of easterly winds might be concentrated within just a few days, while the remainder of the month could be free of such occurrences. To verify these relationships, the Pearson correlation coefficient was calculated, followed by a linear regression analysis [26].

3. Discussion and Results

The idea for conducting this research originated during a familiarization flight in the vicinity of Svidnik Airport, when one of the authors personally experienced turbulence in the surface layer during the airport traffic pattern and just before landing. Following this experience, together with students from the Faculty of Aeronautics at the Technical University of Kosice, systematic observation began, focusing on areas typically affected by turbulence under different wind directions. These initial subjective observations were later supported by structured measurements from the automatic weather station, enabling the authors to connect real operational experiences with empirical data.
The first outcome of this approach was a scientific paper presented at the NTAD international conference [27]. The results of that study led to the identification of several zones with recurring turbulence and their impact on flight safety. In accordance with aviation safety principles, and after consultations with experienced pilots, recommended pilot actions were developed for situations involving entry into these zones [28]. With thorough pre-flight preparation, even pilots with limited flight experience, or those unfamiliar with the local conditions, can prepare more effectively for flights in this area, reducing the likelihood of incorrect decisions caused by stress or insufficient situational awareness regarding the specific characteristics of Svidnik Airport. These recommendations are especially relevant considering that the airport is mainly used for training flights involving student pilots with low operational experience.
The frequency of these turbulent conditions is influenced by the typical airflow patterns shaped by the surrounding complex terrain, as this part of Slovakia lies along the Carpathian Arc [24]. The terrain generates mechanically induced turbulence and wind channeling effects, which become particularly hazardous when the wind direction aligns with the east sector.
Due to the frequent educational training flights in this region, involving large groups of students from the Faculty of Aeronautics specializing in Pilot Training, a decision was made to install the meteorological station funded by the KEGA 051TUKE–4/2021 project “Integrated Laboratory for Digital Aviation Education in Selected Pilot Training Subjects”. This installation provides students with real-time access to meteorological data from Svidnik Airport, enabling them to assess take-off and landing conditions both during pre-flight preparation and in real-time during flight operations, as shown in Figure 3. This real-time access is also used during briefings to evaluate current wind trends before departure.
The archive of this data was thus used to objectively document wind parameters and process them into a type of chart called a wind rose. It is a graphical representation of the wind direction and speed at a given location over a certain period. It takes the form of a polar diagram, with the sectors divided accordingly, and the area of each sector corresponds to the frequency of wind from that direction. These areas are also differentiated according to speed intervals. Wind roses play an important role in aviation meteorology. They allow the assessment of safety risks associated with critical wind directions based on many measurements. In this case, over 208,000 data points were collected across two years, allowing statistically robust evaluations of prevailing and hazardous wind patterns. Generally, before constructing a runway for take-off and landing, the wind direction and speed are monitored for at least five years to determine the optimal orientation of the runway. From a safety perspective, directions of wind perpendicular to the runway are excluded due to the high danger they pose, especially during landing. Since Svidnik Airport was constructed without documented wind analysis, the current study represents the first attempt to evaluate the appropriateness of runway orientation and wind risk based on actual long-term measurements.

Hierarchical Data Selection and Its Results

However, the task of this work was not to assess the direction for the construction of a future runway, as one has already been built. The work focuses on evaluating the frequency of occurrence of dangerous wind directions in relation to the existing orientation of the runway, while previous meteorological research in this area is neither known nor documented. This absence of historical wind data underlines the necessity of the present research, particularly given the training character of the airport.
  • Step 1—Filtering erroneous matrix data
After filtering out non-numeric data, measurement errors, and cases of calm wind when turbulence did not form, the first wind dataset was obtained, based on which the initial wind rose was generated and shown on Figure 4.
The runway at Svidnik Airport was constructed without a documented prior meteorological survey. Creating a wind rose for this airport provides an additional assessment of the suitability of the runway orientation in relation to the typical wind conditions in situ. From the wind rose shown in Figure 4, the prevailing wind component is from the southeast. Considering the terrain constraints that allowed only a limited range of runway orientations, the orientation of runway LZSK 01/19 is indeed suitable. This alignment benefits from frequent headwind conditions and minimizes exposure to crosswind during the majority of the year. The prevailing wind direction is, of course, just one of many factors that influence the construction of a future runway. In this case, a significant limiting factor was the terrain possibilities and surrounding mountainous obstacles (Figure 5).
From Figure 5, the position of the runway on the ridge of a raised area can be observed, with the terrain not allowing orientation in any other direction. The area with trees is shown in dark green with brown crosses and tree pictograms. With an eastern wind component, the runway is exposed to the wind shadow caused by these trees, which are located 70 to 80 m east of the area in its southern third. The central part of the area is 270 m away from the trees (measured using GIS base maps). This vegetation-induced wind shadow is one of the most significant sources of mechanical turbulence at low altitude during the final approach to runway 19.
  • Step 2—Filtering data by day/night
As already mentioned in the problem-solving methodology, Svidnik Airport is only approved for operation during daytime. The wind rose adjusted for daytime only is reduced, as shown in Figure 6, with the nighttime rose placed on the right side of Figure 6 for comparison.
For a better understanding of the differences between the prevailing wind during the day and at night, the wind roses were placed side by side, revealing both similar characteristics and differences. The dominant southeast direction remains consistent, but the frequency and strength of the wind from this direction decrease. A similar trend is evident for the northern wind direction, where both speed and frequency decline during nighttime hours. On the other hand, for eastern directions, there is a reduction in frequency during the day compared to the night. However, daytime easterly winds exhibit higher speed and gust variability, which is a key operational risk factor. Although the eastern wind is more frequent at night, its average speed at night does not exceed 4 m/s. During the day, despite being less frequent, this speed increases to the range of 4 to 6 m/s. Therefore, the eastern wind is less frequent during the day but reaches higher speeds than at night. The data are shown in Table 1.
Table 1 shows that wind speeds during nighttime hours are lower in all directions. Since the airport does not operate at night, filtering the data into day and night provides a cleaner dataset. The average all-day wind speed is influenced by the lower speeds at night. However, operations at this airport occur only during the day, when wind speeds are higher and thus have a more significant impact on flight safety. This confirms the methodological decision to exclude nighttime data from risk evaluation. This statistical processing confirms the correctness of the data selection step that excludes nighttime data from the dataset.
For a better understanding of the changes in wind during the day and at night, Figure 7 serves as a graphical representation of the numerical data from Table 1. It is evident that during the day, the wind blows stronger in all cases, and for flight safety, these filtered data are more relevant than the average all-day wind speeds.
  • Step 3—Selection of data from hazardous sector
The results of a scientific study preceding this work pointed out several typical areas near Svidník Airport with significant turbulence. The study also includes recommendations for pilots, emphasizing maintaining a high level of flight safety in this area. The turbulent areas can be safely navigated if these recommendations are followed. The exception is the area just above the surface of the runway. In the absence of altitude reserve and the simultaneous occurrence of relatively strong turbulent vortices, it is recommended for safety reasons that solo flights not be performed by inexperienced or trainee pilots. In particular, wind from the east sector has been observed to trigger irregular turbulence that causes rapid changes in pitch, angle of attack, and descent path just before touchdown. This area of hazardous turbulence occurs during eastern wind components. In Figure 1 and Figure 5, the area with a significant band of trees east of the airport is shown. In this situation, the runway is located in the wind shadow of the tree band, which results in irregular vortices that suddenly change the aircraft’s pitch and angle of attack. From a safety perspective, it is advisable to identify the months of the year that represent higher risks for flying. For this purpose, wind roses were created for each month of the year (Figure 8).
Figure 8 shows the monthly frequency of wind for the period of 2023 to 2024 between sunrise and sunset. At first glance, the dominant southeast wind direction is clearly visible. During the autumn and winter seasons, this direction completely dominates over other sectors. In the warmer part of the year, northern wind components also appear, with a significant increase in April and a marked decrease in frequency in October, when the southeast direction again prevails. From the perspective of flight safety and runway orientation, these directions provide suitable conditions for approach and touchdown. However, the eastern component, although less frequent, can appear unexpectedly and may require go-around or additional instructor supervision during solo training flights. The risky component of the eastern wind is relatively small, which does not offer many opportunities to train for such situations, representing a safety risk. After an additional level of data selection, it was possible to obtain a dataset of eastern wind components during the period between sunrise and sunset, which corresponds to the airport’s operating hours (Table 2).
After subsequent data selection from 53,119 records, 6.3% of cases corresponded to eastern wind components, with an average wind speed from these directions of 1.63 m/s, and a maximum recorded wind speed of 6.1 m/s. These data were obtained at 10 min intervals, so it is more interesting to consider on how many days this wind occurred during the two-year period.
The eastern wind component occurs throughout the year (Figure 9). Its frequency increases during the warmer half of the year, peaking in August with up to 550 cases accumulated over 54 days. A certain decline is observed in the months from October to January. However, the eastern direction cannot be practically excluded during the year, which means that landing safely at Svidnik Airport may be affected, with some deviations expressed by the Pearson correlation coefficient [26]. The high number of separate days with easterly wind confirms that these events are not isolated to a few severe days, but are spread across multiple operational days, increasing their significance for training safety.
Error bars/confidence intervals were created and calculated for monthly trends. We aggregated counts separately for each month in 2023 and 2024. For each month, we calculate the mean and standard error (SE), from which we constructed the 95% CI:
C I 95 % =   x ¯ ± t . 095 ,   n 1 s n
where n = 2 (we have two years), \bar{x} is the mean of those two years, and s is their standard deviation.
The “Monthly Measurements of East Wind (±22.5°)” with 95% confidence intervals can be interpreted as follows:
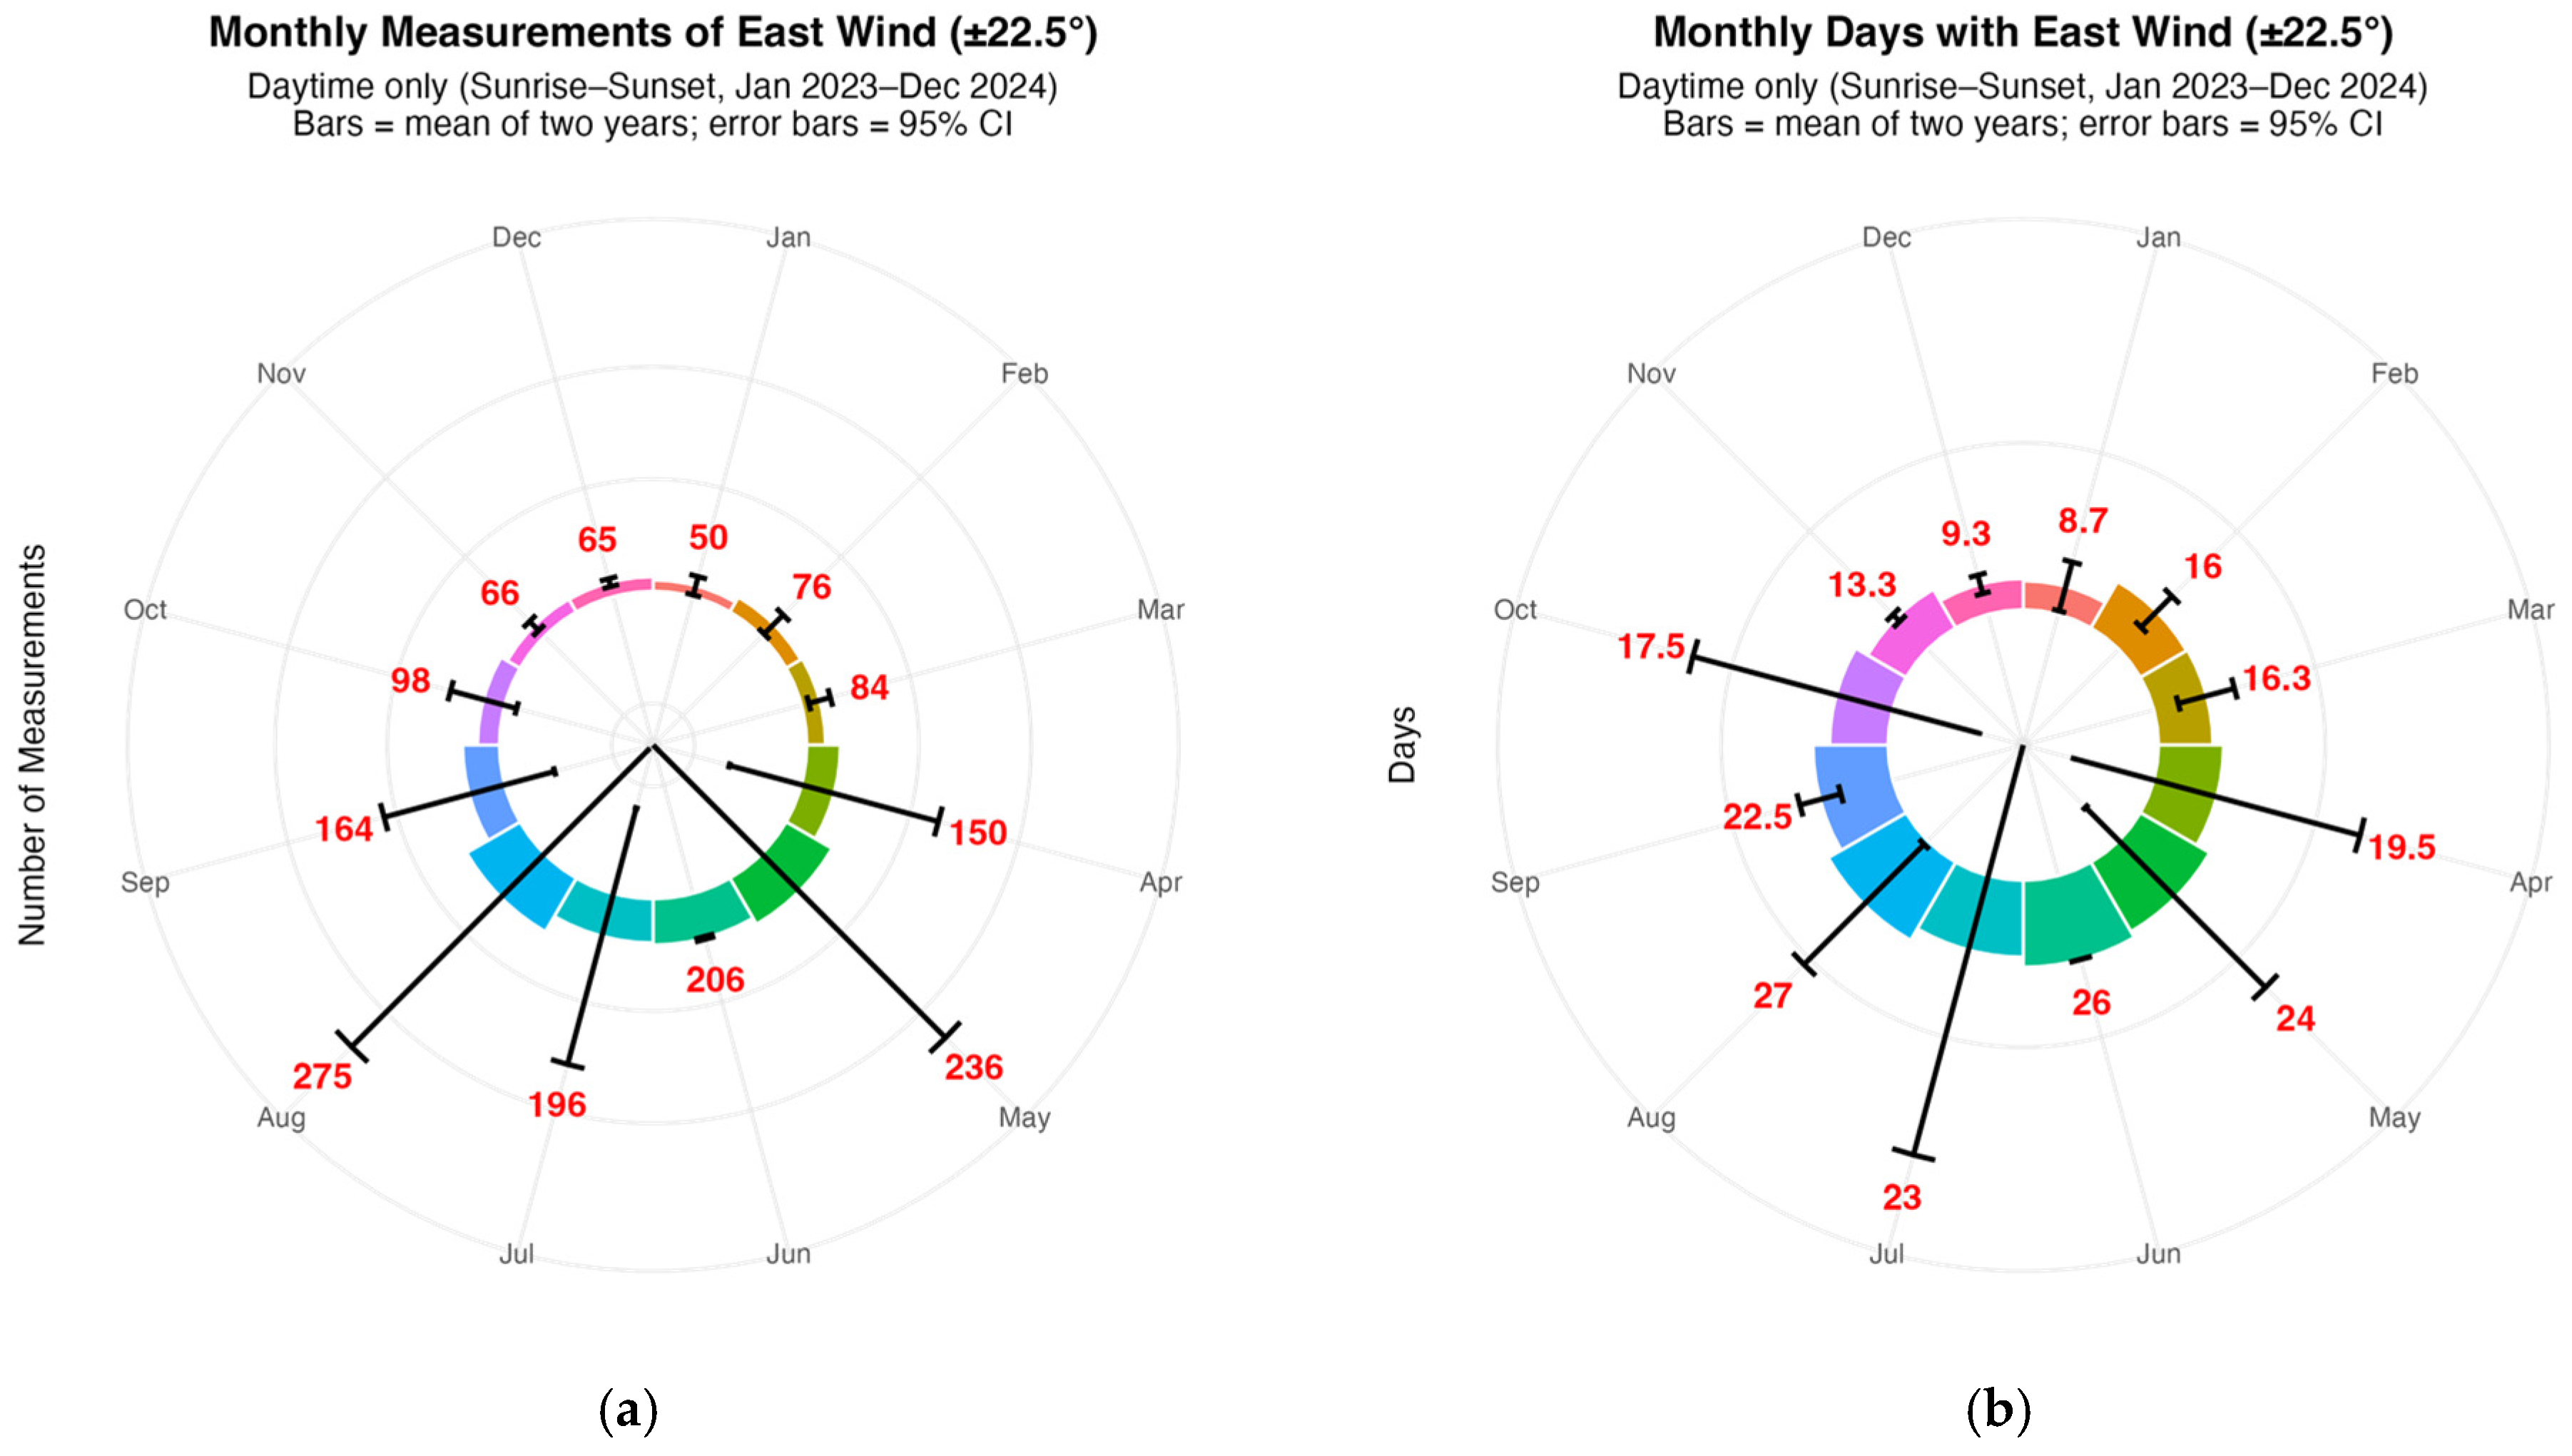
  • Average monthly measurements (red numbers):
    • In the center of each sector is the average number of east-wind records for that month (averaged over 2023 and 2024).
    • The highest average monthly frequency of measurements is in August (~275 measurements), followed by July (~196), June (~206), and May (~236).
    • Conversely, the lowest average numbers are in December (~65), January (~50), and February (~76), indicating a winter season with less frequent east winds.
  • Length of sectors (colored bar-fences):
    • The colored bars start from the center and their “radius” (length) is given by the average number of measurements.
    • For example, the August sector is the longest, while the January sector is the shortest.
  • Black bars (error bars = 95% CI):
    • Each sector has a thin black line that indicates the lower and upper limits of the 95% confidence interval for the two-year average.
    • A narrow interval (e.g., in May or June) means that between 2023 and 2024 the number of east-wind measurements was very similar, with low interannual variability.
    • A wider interval (e.g., in July and August) indicates a larger difference between the number of measurements for these months in individual years.
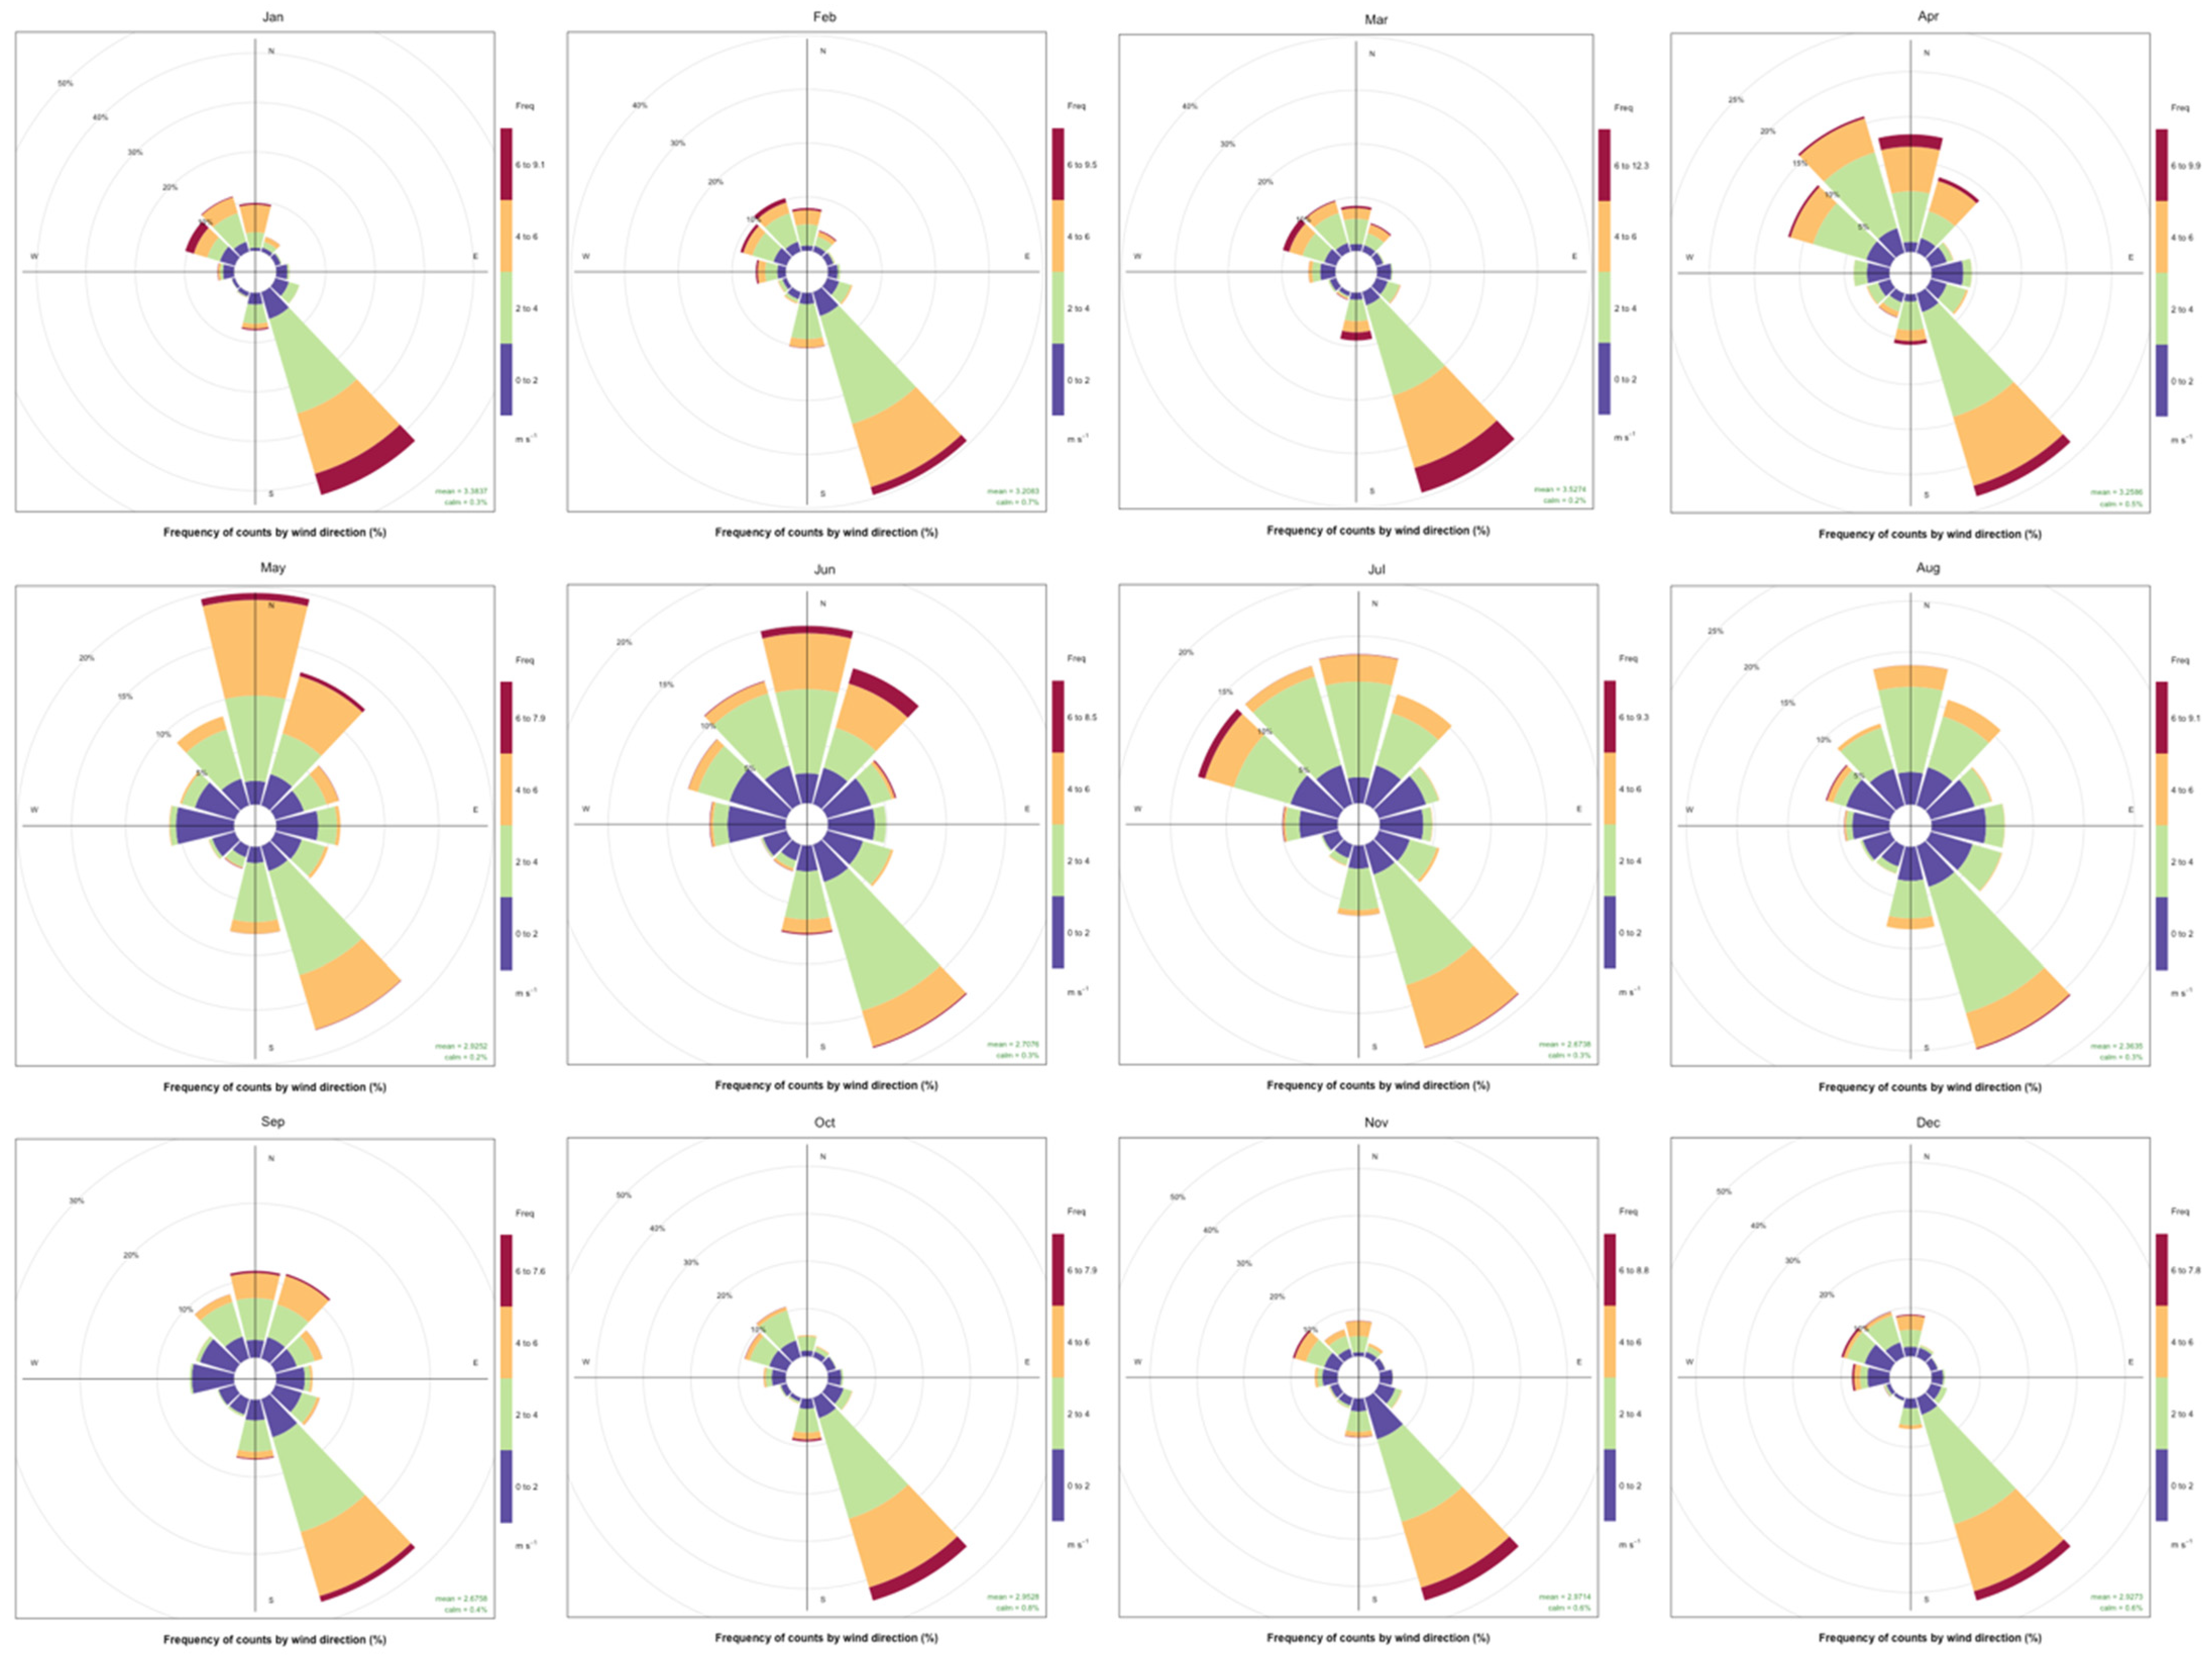
  • Seasonal tendency:
    • Summer months (May–August) dominate: Easterly winds occur significantly more frequently during the day, also visible in the form of a higher number of measurements.
    • Winter months (November–February) have a lower frequency.
  • Reliability of calculations:
    • All averages are based on only two years, so the CI can be quite wide (e.g., august approx. [X–Y] measurements).
    • If we had data for more years, the intervals would narrow and the interpretation would be more reliable.
The Pearson correlation coefficient was calculated between two variables: the monthly frequency of eastern wind occurrences and the number of days with eastern wind during which this wind occurred. The result was
r = 0.762 ,   p < 0.001
This test led to the rejection of the null hypothesis
H 0 : r = 0
which indicates a statistically significant positive correlation between the variables. Months with a higher number of days with eastern wind also tend to have a higher frequency of measurements from this direction. Subsequent linear regression showed
Y ^ = β 0 + β 1 X
where the dependent variable, the number of measurements with eastern wind, is Y, the independent variable, the number of days with eastern wind occurrences, is X, and the estimated slope parameter was
β 1   > 0
The coefficient of determination
R 2 = 0.58
indicates that 58% of the variability in the monthly occurrence of eastern wind is explained by the number of days on which the eastern wind occurred. Therefore, there is a moderately strong to strong statistically significant positive linear relationship between the number of days with eastern wind and the frequency of wind measurements from this direction monthly. The subsequent visualization of the results is shown in Figure 10. This regression confirms that summer months (May to August) pose the greatest crosswind hazard for student operations at Svidník Airport. In these months, solo flights should be limited or carefully evaluated when easterly wind exceeds 3 m/s. For this purpose, a simple crosswind checklist and briefing template is currently being tested at the Faculty of Aeronautics.
The results thus indicate not only a higher frequency of measurements in the warmer months but also a higher number of days with such occurrences. This means that in the months of May, June, July, and August, the number of measurements with an eastern wind component increases, and these measurements are spread across multiple days rather than concentrated into a smaller number of days. In these months, there is therefore a higher probability of turbulence formation over the runway due to the more frequent occurrence of eastern winds occurring over several days.

4. Conclusions

The study of near-surface wind conditions at the small regional airport of Svidník provided valuable insights into the local wind characteristics and their potential impacts on aviation safety, especially during pilot training. The use of the automated Meteohelix IoT Pro meteorological station enabled systematic and long-term wind data collection, which was subsequently processed and visualized using the R environment. This approach represents one of the first scientific efforts to evaluate meteorological conditions at Svidník Airport, where no systematic observations previously existed. The results of this study serve as a foundational dataset for ongoing operational decision-making and risk assessment at the airport.
Analysis of wind roses over various time periods revealed that the dominant wind direction is southeast, prevailing throughout the year. This finding confirms the suitability of the existing 01/19 runway’s orientation in relation to predominantly favorable wind conditions. This alignment minimizes the frequency of strong crosswind exposure during critical flight phases such as take-off and landing.
A significant finding was the identification of a hazardous east wind component, occurring regularly mainly during the warmer months (May to August), causing turbulence in the lee of a dense tree line east of the runway. These turbulent conditions pose an increased risk, particularly for less experienced pilots during approach and landing. The mechanical turbulence generated in this zone has been linked to sudden aircraft pitch changes and trajectory deviations, especially in the final approach segment to runway 19.
Statistical analysis confirmed a strong positive correlation between the number of days with east wind occurrence and the frequency of measurements from this direction, enabling better planning and safety measures during training flights. The methodological approach, combining data filtering, hierarchical selection, and visualization, proved to be an effective tool for evaluating wind-related safety risks. The hierarchical structure of data processing also allowed for the exclusion of irrelevant nighttime data while preserving operationally significant daytime turbulence patterns.
From a practical perspective, the study recommends that pilot trainees be informed about the risks associated with east winds, and that airport operational procedures consider these findings when planning flights. Specifically, we recommend that solo student flights on the Viper SD-4 be restricted when the easterly wind component exceeds 3 m/s, in line with conservative training practices and the aircraft’s handling characteristics. The proposed process can also serve as a model for other small airports with limited infrastructure. The low-cost instrumentation and open-source data processing framework allow this method to be easily adapted and replicated at other VFR-only training fields.
For future work, it is recommended to extend wind measurements to higher altitudes and complement them with lidar or sodar technologies to more precisely monitor turbulence and vertical wind shear. Additionally, investigating the relationship between meteorological conditions and operational incidents at the airport would further enhance the safety relevance of the research. Integrating these observations into flight planning tools or digital briefing systems could significantly improve situational awareness and student safety at regional training airports.

Author Contributions

Conceptualization, M.A. and L.C.; methodology, M.A., L.C. and P.K.; software, L.C.; validation, M.A. and L.C.; formal analysis, M.A. and L.C.; resources, P.K.; data curation, L.C.; writing—original draft preparation, M.A. and L.C.; writing—review and editing, L.C.; visualization, M.A.; supervision, P.K.; funding acquisition, L.C. and P.K. All authors have read and agreed to the published version of the manuscript.

Funding

This research received no external funding.

Institutional Review Board Statement

Not applicable.

Informed Consent Statement

Not applicable.

Data Availability Statement

The raw data supporting the conclusions of this article will be made available by the authors on request.

Acknowledgments

This research was supported by the “Slovak Research and Development Agency of the Ministry of Education, Research, Development and Youth of the Slovak Republik, grant number APVV-22-0107” and by the international project “Integrated laboratory for digital aviation education in the teaching of selected subjects in the field of flight training, grant number KEGA 051TUKE-4/2021”.

Conflicts of Interest

The authors declare no conflicts of interest. The funders had no role in the design of the study; in the collection, analyses, or of data; in the writing of the manuscript; or in the decision to publish the results.

Abbreviations

The following abbreviations are used in this manuscript:
AGLAbove Ground Level
AIP SRAeronautical Information Publication of the Slovak Republic
CSVComma-Separated Value
GPSGlobal Positioning System
ICAOInternational Civil Aviation Organization
KEGASlovak Grant Scheme
METARMeteorological Aerodrome Report
NTADNew Trends in Aviation Development
R(Programming Language) R
VFRVisual Flight Rules
WMOWorld Meteorological Organization

References

  1. Sumaja, K.; Satryabawa, I.; Syahdian, A. Analysing Crosswind, Headwind, and Tailwind at I Gusti Ngurah Rai Airport for Aircraft Risks Assessment During Take-Off and Landing Process. ResearchGate. 2019. Available online: https://www.researchgate.net/publication/354066002 (accessed on 10 January 2025).
  2. Han, S.; Park, B.; Lee, H.-T. Analysis of the Impacts of Wind on Final Approach Overshoot Using Historical Flight and Weather Data; AIAA SciTech Forum: Reston, VA, USA, 2024. [Google Scholar] [CrossRef]
  3. Khattak, A.; Zhang, J.; Chan, P.-W.; Chen, F.; Almujibah, H. Assessment of Crosswind Speed over the Runway Glide Path Using an Interpretable Local Cascade Ensemble Approach Aided by Wind Tunnel Experiments. Atmosphere 2023, 14, 1561. [Google Scholar] [CrossRef]
  4. Main Commission Aircraft Accident Investigation Warsaw. Report on the Accident to Airbus A320-211 Aircraft in Warsaw on 14 September 1993. Available online: https://www.baaa-acro.com/sites/default/files/2020-10/D-AIPN.pdf (accessed on 10 January 2025).
  5. National Transportation Safety Board. Aircraft Accident Report: Flight into Terrain During Missed Approach USAir Flight 1016, DC-9-31, N954VJ, Charlotte Douglas International Airport. 2 July 1994. Available online: https://www.ntsb.gov/investigations/AccidentReports/Reports/AAR9503.pdf (accessed on 10 January 2025).
  6. National Transportation Safety Board. Aircraft Accident Report: Collision with Trees on Final Approach American Airlines Flight 1572 McDonnell Douglas MD-83, N566AA East Granby, Connecticut. 12 November 1995. Available online: https://www.ntsb.gov/investigations/AccidentReports/Reports/AAR9605.pdf (accessed on 10 January 2025).
  7. Parker, M.J.; Weber, A.H.; Buckley, R.L. Short Term Climatological Wind Data as a Tool for Wind Forecasting. Savannah River National Laboratory. 2004. Available online: https://sti.srs.gov/fulltext/ms2003899/ms2003899.pdf (accessed on 10 January 2025).
  8. Keevallik, S.; Soomere, T.; Pärg, R. Outlook for Wind Measurement at Estonian Automatic Weather Stations. Est. J. Eng. 2007, 13, 192–203. Available online: http://vana.kirj.ee/public/Engineering/2007/issue_3/eng-2007-3-5.pdf (accessed on 10 January 2025). [CrossRef]
  9. Simpson, A.; Ramsay, L. Topographic Control of Wind Field in the Near-Surface Boundary Layer and Its Influence on Air Quality Assessments. ResearchGate. 2013. Available online: https://www.researchgate.net/publication/342570863 (accessed on 10 January 2025).
  10. Thakur, G. An Assessment of Roof Top Wind Resources and Its Optimum Utilization Using Roof Integrated Wind Turbines in Dublin. ResearchGate. 2019. Available online: https://www.researchgate.net/publication/331178110 (accessed on 10 January 2025).
  11. Singh, A.B.; Srinivas, C.V.; Maran, S.; Ramakrishnan, B.; Balasubramaniam, V. Wind Direction Dependent Vertical Wind Shear and Surface Roughness Parameterization in Two Different Coastal Environments. Int. J. Geol. Agric. Environ. Sci. 2016, 4, 1–9. Available online: https://www.researchgate.net/publication/307901988 (accessed on 10 January 2025).
  12. Hernández-Meléndez, C.A.; Rodríguez-Picón, L.A.; Pérez-Olguín, I.J.C.; Vázquez-Galvez, F.A.; Hernández-Hernández, J.I.; Méndez-González, L.C. A Site-Specific Wind Energy Potential Analysis Based on Wind Probability Distributions: A Ciudad Juárez-México Case Study. Sustainability 2024, 16, 9486. [Google Scholar] [CrossRef]
  13. Prasanna, V.; Choi, H.W.; Jung, J.; Lee, Y.G.; Kim, B.J. High-Resolution Wind Simulation over Incheon International Airport with the Unified Model’s Rose Nesting Suite from KMA Operational Forecasts. Asia-Pac. J. Atmos. Sci. 2018, 54, 187–203. [Google Scholar] [CrossRef]
  14. Rose, S.; Apt, J. Quantifying Sources of Uncertainty in Reanalysis Derived Wind Speed. Renew. Energy 2016, 94, 157–165. [Google Scholar] [CrossRef]
  15. Bertsimas, D.; Gupta, V.; Kallus, N. Data-Driven Robust Optimization. Math. Program. 2018, 167, 235–292. [Google Scholar] [CrossRef]
  16. Franklin, J. The Elements of Statistical Learning: Data Mining, Inference, and Prediction. Math. Intell. 2005, 27, 83–85. [Google Scholar] [CrossRef]
  17. Jolliffe, I.T.; Cadima, J. Principal Component Analysis: A Review and Recent Developments. Philos. Trans. R. Soc. A 2016, 374, 20150202. [Google Scholar] [CrossRef] [PubMed]
  18. KEGA Portal. Projekty KEGA (In Slovak), [Online]. Available online: https://projekty.portalvs.sk/projekty (accessed on 19 March 2025).
  19. International Civil Aviation Organization. Annex 3–Meteorological Service for International Air Navigation, 20th ed.; ICAO: Montreal, QC, Canada, 2018; Available online: https://store.icao.int/en/annex-3-meteorological-service-for-international-air-navigation (accessed on 10 January 2025).
  20. World Meteorological Organization. Guide to Meteorological Instruments and Methods of Observation (WMO-No. 8); WMO: Geneva, Switzerland, 2021; Available online: https://community.wmo.int/en/activity-areas/imop/wmo-no_8 (accessed on 10 January 2025).
  21. International Civil Aviation Organization. Annex 14–Aerodromes, Volume I: Aerodrome Design and Operations, 9th ed.; ICAO: Montreal, QC, Canada, 2022; ISBN 978-92-9265-735-2. Available online: https://store.icao.int/en/annex-14-aerodromes (accessed on 10 January 2025).
  22. Bertsimas, D.; O’Hair, A. Robust Data-Driven Optimization: A New Perspective on Handling Uncertainty in Decision-Making. Oper. Res. 2013, 61, 1380–1398. [Google Scholar] [CrossRef]
  23. Hastie, T.; Tibshirani, R.; Friedman, J. The Elements of Statistical Learning: Data Mining, Inference, and Prediction, 2nd ed.; Springer: New York, NY, USA, 2009; ISBN 978-0-387-84857-0. [Google Scholar] [CrossRef]
  24. Letové prevádzkové služby Slovenskej republiky, štátny podnik (Air Navigation Services of the Slovak Republic). Aeronautical Information Publication of the Slovak Republic (AIP SR); LPS SR: Bratislava, Slovakia, 2025; Available online: https://aim.lps.sk/web/index.php?fn=200&lng=en (accessed on 10 January 2025).
  25. TOMARK Aero. Aircraft Flight Manual–Viper SD-4 RTC. 2016. Available online: https://static1.squarespace.com/static/5cbd9e8265a707b68560908d/t/5ebfa682b9557a14273c3a2c/1589618338973/Viper_SD4_RTC_Flight_Manual_HA-BEW-sn21737.pdf?utm_source=chatgpt.com (accessed on 10 January 2025).
  26. Wilks, D.S. Statistical Methods in the Atmospheric Sciences, 4th ed.; Academic Press: Amsterdam, The Netherlands, 2019; ISBN 9780128158234. [Google Scholar]
  27. Choma, L.; Sabo, J.; Ščerba, M. Boundary Layer Turbulence Identification in the Vicinity of Svidnik Airport. In 2024 New Trends in Aviation Development, Proceedings of The 19th International Scientific Conference; Stary Smokovec, Slovakia, 28–29 November 2024, IEEE: Danvers, MA, USA, 2024; pp. 20–25. ISBN 979-8-3315-2773-0. [Google Scholar]
  28. Oktal, H.; Yildirim, M. An Analysis on the Wind Speed and Direction Distribution Model of a Runway. In New Frontiers in Sustainable Aviation; Kaba, A., Ed.; Springer: Cham, Switzerland, 2022; pp. 35–49. [Google Scholar] [CrossRef]
Figure 1. Meteorological station location.
Atmosphere 16 00917 g001
Figure 2. Data filtering funnel diagram for wind analysis.
Atmosphere 16 00917 g002
Figure 3. Visualization of data from meteorological station owned by Faculty of Aeronautics.
Atmosphere 16 00917 g003
Figure 4. Wind rose for Svidnik Airport.
Atmosphere 16 00917 g004
Figure 5. Svidnik Airport on a GIS map with contour lines drawn.
Atmosphere 16 00917 g005
Figure 6. (a) Daytime wind rose at Svidnik Airport; (b) nighttime wind rose at Svidnik Airport.
Atmosphere 16 00917 g006
Figure 7. Differences in wind occurrence between day and night.
Atmosphere 16 00917 g007
Figure 8. Monthly wind roses between January and December 2023–2024.
Atmosphere 16 00917 g008
Figure 9. (a) Frequency of eastern wind component from January 2023 to December 2024; (b) number of days with eastern wind component from January 2023 to December 2024.
Atmosphere 16 00917 g009
Figure 10. Relationship between number of days and corresponding frequency of occurrence of eastern wind sector measurements.
Atmosphere 16 00917 g010
Table 1. Differences between daytime and nighttime wind conditions for each 22.5° directional bin. Units: Speed in meters per second (m/s); count = number of 10 min records.
Direction BinCount DayCount NightAvg Day Speed (m/s)Avg Night Speed (m/s)Count ChangeCount Change (%)Speed Change (m/s)Speed Change (%)
437928663.552.37151334.61.1833.24
22.5°291034803.051.7657019.61.2942.30
45°173237992.051.502067119.30.5526.83
67.5°150132591.581.401758117.10.1811.39
90°182326401.661.4981744.80.1710.24
112.5°218425462.111.8136216.60.3014.22
135°11,94386093.573.14333427.90.4312.04
157.5°676245613.343.14220132.50.205.99
180°15429652.531.7657737.40.7730.43
202.5°7415331.891.1620828.10.7338.62
225°8087011.531.0710713.20.4630.07
247.5°133312251.651.301088.10.3521.21
270°333930012.622.0933810.10.5320.23
292.5°322342172.462.0099430.80.4618.7
315°387146762.692.1980520.80.5018.59
337.5°502839073.282.58112122.30.7021.34
Table 2. Daytime statistics of east-sector winds (between 075° and 105°). Units: Speed in m/s; count based on 10 min intervals.
MetricValue
Total daytime records53,119
East sector records3324
East sector % of daytime6.3%
Mean east wind speed (m/s)1.63
Max east wind speed (m/s)6.10
Disclaimer/Publisher’s Note: The statements, opinions and data contained in all publications are solely those of the individual author(s) and contributor(s) and not of MDPI and/or the editor(s). MDPI and/or the editor(s) disclaim responsibility for any injury to people or property resulting from any ideas, methods, instructions or products referred to in the content.

