Article

Demonstration of a Simplified, Two-Wavelength Optical Approach to Measuring Nitrogen Dioxide in Cities

by
Eibhlín F. Halpin
,
Rohit Vikas
,
Conor W. Dorney
,
Meng Wang
and
Dean S. Venables
*
School of Chemistry and Environmental Research Institute, University College Cork, T12 YN60 Cork, Ireland
*
Author to whom correspondence should be addressed.
Atmosphere 2025, 16(5), 599; https://doi.org/10.3390/atmos16050599
Submission received: 11 April 2025 / Revised: 12 May 2025 / Accepted: 13 May 2025 / Published: 15 May 2025

Abstract

:
Nitrogen dioxide (NO2) is a major air pollutant in urban areas, and achieving good accuracy and sensitivity in low-cost measurements is desirable to monitor NO2 levels in settings with high spatio-temporal variability. This paper describes a ratiometric approach that uses the different absorption at two nearby wavelengths to quantify NO2. The response to NO2 and other potential interferences is calculated at 437.3 and 439.4 nm for a low-resolution (1.44 nm) system. Owing to its elevated concentration and strong absorption compared to other absorbing gases, NO2 dominates the ratio of light absorption at these wavelengths in urban settings. The approach is experimentally demonstrated in a simple measurement system comprising a blue LED, narrow bandpass filters and non-dispersive detectors. The approach was validated in atmospheric simulation chamber experiments over an 8 m pathlength and achieved a high level of agreement against a reference DOAS spectral analysis (R2 = 0.97). Mixing ratios of up to 12 ppm were measured with a standard deviation of 51 ppb, suggesting that low ppb-level sensitivity can be achieved in pathlengths of a few hundred metres. The spectral stability of the ratiometric method was demonstrated in the open atmosphere using a short open-path system with a pathlength of 45 m. The standard deviation of the ratio of intensities in the two channels was 0.2%, despite changes in the transmitted intensity of almost 90%. The ratiometric two-channel approach developed in this work can be used in both in situ and remote sensing configurations, and we suggest that it has potential for use in a range of settings, including for low-cost monitoring in low-income cities and towns and continuous emission monitoring.

1. Introduction

Air pollution is a major health problem and the leading environmental cause of premature mortality around the world [1,2]. Nitrogen dioxide (NO2) is one of the air pollutants of greatest concern and is associated with a range of serious health effects, including cardiovascular and respiratory mortality [3,4,5], increased risk of asthma development and onset [6,7,8,9,10], foetal and neonatal health [11,12] and neurological impacts [13,14,15]. The atmospheric processing of NO2 also produces secondary air pollution by forming particulate matter and ground-level ozone [16,17]. Based on evidence of NO2’s health impacts, the WHO recently reduced its guideline value for annual exposure to NO2 fourfold from 40 µg m−3 to 10 µg m−3 and introduced a 24 h limit of 25 µg m−3 [2].
NO2, along with nitric oxide (NO), is largely produced under the high-temperature combustion conditions found in internal combustion engines, power plants and some industrial processes. These nitrogen oxides are therefore strongly associated with human activities, reaching mixing ratios of tens of ppb in urban areas. Petrol and (especially) diesel vehicles are a major source of NOx (NOx is defined as the sum of NO and NO2), with both primary and secondary emissions of NO2 as NO is rapidly oxidised [18,19]. NO2 is therefore elevated near busy roads and has a large spatial variability in cities [20,21].
Regulatory monitoring of ambient (outdoor) air pollution allows environmental agencies to identify areas where air quality is poor and develop air quality management plans [22]. Regulatory monitoring of NO2 typically uses chemiluminescence NOx instruments that measure NO; NO2 is determined by sequentially measuring NO and then measuring NOx by converting NO2 to NO. This approach gives an indirect measurement of NO2 and is not suited to high measurement frequencies. Chemiluminescence monitors are also susceptible to interference from O3 and other reactive nitrogen species that can lead to an overestimation of NO2 [23]. Regulatory monitoring requires expensive air quality monitoring infrastructure. As a result, even wealthy cities have relatively few monitoring stations, and the spatial distribution of NO2 is poorly captured. Another consequence of the high costs and operational demands is that cities in low-income countries, as well as towns in high-income countries, have minimal air quality-monitoring infrastructure.
Given the importance of NO2 as a primary air pollutant and its high spatial and temporal variability, the development of novel NO2 monitoring techniques is an area of active research. Low-cost approaches based on metal oxides or electrochemical sensors and gas diffusion tubes can complement expensive regulatory monitoring infrastructure and lead to deeper insight into the spatial and temporal characteristics of ambient air pollution [24,25,26,27]. However, these approaches have drawbacks. Diffusion tubes provide a time-averaged concentration over a period of weeks, losing temporal information. Electrochemical sensors for NO2 are vulnerable to chemical interference, temperature and relative humidity, depending on the characteristics of the materials used. Their time resolution of several minutes is also not suited to studying the rapid fluctuations in NO2 levels that are found in personal exposure or urban measurements. Chemiresistive sensors can have a fast recovery time and good temporal resolution, but are not yet widely used [28,29]. Low-cost electrochemical sensing has been used to map urban air pollutants, but recent work has demonstrated that their time resolution is not suitable for monitoring fast changes in NO2 [30]. Despite these limitations, low-cost sensors have been used to increase the spatial and temporal resolution of standard chemiluminescence or DOAS monitoring sites [31,32]. Low-cost sensing also led to the expansion of citizen science projects [33].
A wide range of spectroscopic approaches have been used to develop sensitive in situ and remote sensing instruments for NO2. The methods include cavity-enhanced absorption spectroscopy [34,35,36,37,38,39], cavity ring-down spectroscopy [40,41,42,43,44,45,46], differential optical absorption spectroscopy [47,48,49], differential absorption LIDAR (DIAL) [50,51], cavity attenuated phase-shift spectroscopy (CAPS) [52], photometry [53], gas correlation spectroscopy [54], photoacoustic spectroscopy [55,56,57,58,59] and laser-induced fluorescence (LIF) [60,61].
One of the notable features of NO2 is that it is the dominant absorbing gas at blue wavelengths (400 to 450 nm) in urban areas and transport microenvironments. The absorption spectrum of NO2 is also highly structured. The few atmospheric gases that absorb in this region include glyoxal (GLY), methylglyoxal (MGLY), H2O, ozone (O3) and O4. Compared to NO2, these gases either have much smaller changes in absorption cross-sections (MGLY, O3, O4 and H2O) or occur at much lower concentrations in urban settings (GLY and MGLY). Absorptions from these other gases are therefore unlikely to interfere with NO2 measurements in urban settings where NO2 concentrations are elevated [62,63,64]. We note that folded-path photometry and CAPS systems, which measure across a broader spectral window, also ignore the weak absorption of other gases compared to NO2 [52,53]. The strong and structured absorption of NO2 therefore presents an opportunity to develop a simplified optical strategy to detect NO2 in a low-cost spectroscopic system that could be used in both in situ and remote sensing configurations.
This paper presents a measurement approach based on monitoring the intensities transmitted through the sample in two narrow wavelength bands. One channel matches a strong absorption feature of NO2; the other channel matches a wavelength with weaker absorption. NO2 is quantified by measuring the ratio of intensities of the two bands. Monitoring the relative change in intensity of strong and weak NO2-absorbing wavelengths is expected to give significant selectivity to NO2 and mitigate the effect of interference from absorbers that have less structured absorption. The approach is similar to that in DIAL measurements, where “on” and “off” wavelengths are produced by a tuneable laser and beam paths are identical [51,65]. DIAL systems use closely spaced wavelengths so that changes in optical depth from other gas absorptions and aerosol extinction are modest between the “on” and “off” channels [66]. Recently, Flowerday et al. [67] demonstrated a related two-channel approach to measure ambient glyoxal to 10 ppt based on glyoxal’s large differential absorption cross-section between 450 and 460 nm.
Our approach uses light from a single broadband LED that, after passing through a gas sample, is split into two narrow spectral channels. By reducing the measurement to two wavelength bands, the cost and complexity of high-resolution spectral measurement and analysis can be avoided. The use of a single LED light source and a single optical path through the atmosphere or sample is a key feature, allowing common-mode noise such as fluctuations in the light source intensity or atmospheric transmission to be suppressed by measuring the ratiometric response of two channels. The atmosphere is a complex, dynamic environment where transmission is dependent on factors such as the refractive index, precipitation, aerosol extinction, gas absorption, polarisation and cloud cover. A ratiometric approach is advantageous for in situ and remote-sensing applications because it reduces uncertainties associated with signal changes that arise from atmospheric phenomena and instrument effects that have minimal spectral dependence.
Our goal in this work is to demonstrate that a two-wavelength band approach can achieve good selectivity and sensitivity to NO2 in urban settings. The objectives are to:
  • Develop the theory of the measurement principle and simulate the sensitivity of the approach to NO2 and potential interferences.
  • Demonstrate a two-wavelength optical system using narrowband optical filters with non-dispersive detectors and validate its response against a conventional, full-spectral DOAS analysis.
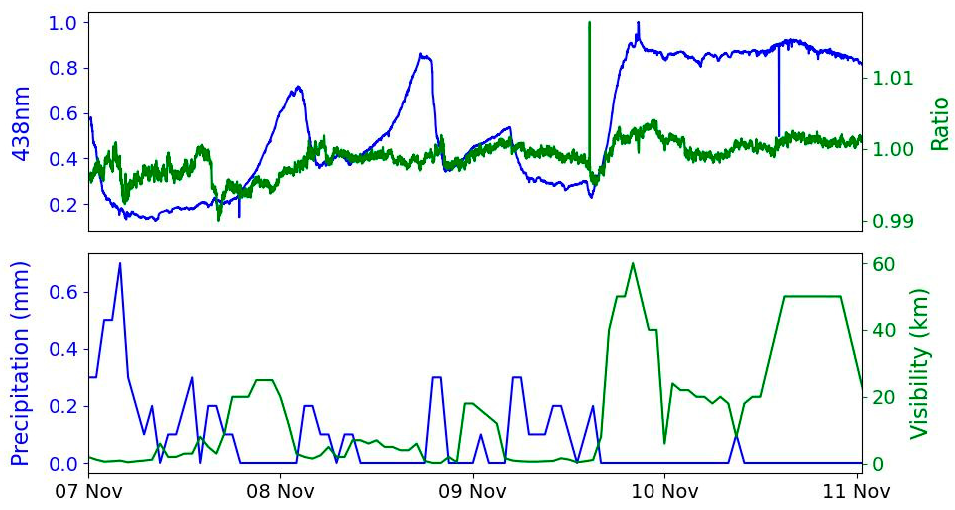
  • Demonstrate the spectral stability of the ratiometric approach in a short open-path system.
  • Discuss applications of the approach and strategies to improve sensitivity and reduce the cost of the method.

2. Materials and Methods

2.1. Dependence of Intensity Ratio on Concentration

The Beer–Lambert law relates the observed intensity to the sample’s extinction at a given wavelength, λ, and time, t:
I ( λ ,   t ) = I 0 ( λ ,   t ) exp ( ε ( λ , t ) L )
where I0(λ, t) is the initial light intensity, I(λ, t) is the light intensity after losses to sample extinction, ε ( λ , t ) is the sample extinction coefficient (cm−1) and L is the pathlength (cm). For two wavelengths λ1 and λ2, the corresponding light intensities, I1(λ1, t) and I2(λ2, t), can be written as
I 1 = I 10   exp ( ε 1 L )
I 2 = I 20   exp ( ε 2 L )
Here, the wavelength and time dependence of I0, I and ε have been omitted for brevity so that I 10 = I 10 ( λ 1 ,   t ) , etc. The ratio of the two intensities is then:
I 1 I 2 = ( I 10 I 20 ) ( exp ( ε 1 L ) exp ( ε 2 L )   )  
or more conveniently expressed as
ln ( I 1 I 2 ) = ln ( I 10 I 20 ) L ( ε 1 ε 2 )
The difference in extinction at the two wavelengths can be determined if both wavelength channels are assumed to be quasi-monochromatic and spectrally stable (i.e., that ( I 10 I 20 ) is constant with time).
In some scenarios (such as NO2 in urban environments), a single (target) absorber may dominate the difference in extinction at two wavelengths:
ε 1 = N σ 1 + ε c
ε 2 = N σ 2 + ε c
where N is the number density of the target gas (molecules cm−3), σ 1 and σ 2 are the absorption cross-sections of the target at λ1 and λ2 and ε c is the (assumed) spectrally flat extinction arising from other gases and particles (i.e., ε c ( λ 1 ) = ε c ( λ 2 ) ). In this case,
ε 1 ε 2 = N ( σ 1 σ 2 ) = N Δ σ
where Δ σ = ( σ 1 σ 2 ) . Substituting Equation (8) into Equation (5) and rearranging gives the absorber concentration:
N = ln ( I 10 I 20 ) ln ( I 1 I 2 ) L Δ σ
Thus, the concentration of the target absorber N can be determined based on the measured ratio at two intensities if the intensity ratio of the light source ( I 10 I 20 ) in the absence of sample absorption is known and the difference in the absorption of the target species dominates that of other atmospheric components at the two wavelengths.

2.2. Simulated Spectra

High-resolution spectra were simulated to calculate the dependence of the intensity ratio on the concentration of NO2, GLY, MGLY, O3 and water vapour. The simulation procedure is shown schematically in Figure 1. Synthetic intensity spectra were created with a wavelength interval of 0.01 nm, and the effect of absorption by different concentrations of the species of interest was calculated using high-resolution literature spectra for NO2 [68], GLY [63], MGLY [69] and O3 [70]. The high-resolution absorption spectrum of water vapour was calculated between 22,000 cm−1 (454.5 nm) and 23,000 cm−1 (434.8 nm) with an interval of 0.02 cm−1 using the HITRAN line parameters for H216O. A temperature of 296 K and 1 atm was assumed [71]. The intensity spectra were then convolved with a Gaussian distribution with a full width at half maximum (FWHM) of 1.44 nm, matching the resolution of the commercially available narrow bandpass filter used in the chamber optical system, smoothing some of the absorption structure. Non-Beer–Lambert Law behaviour arising from not resolving the narrow absorption lines is not expected to pose a problem as the fractional intensity change from gas absorption in this spectral region is small even over kilometre pathlengths.

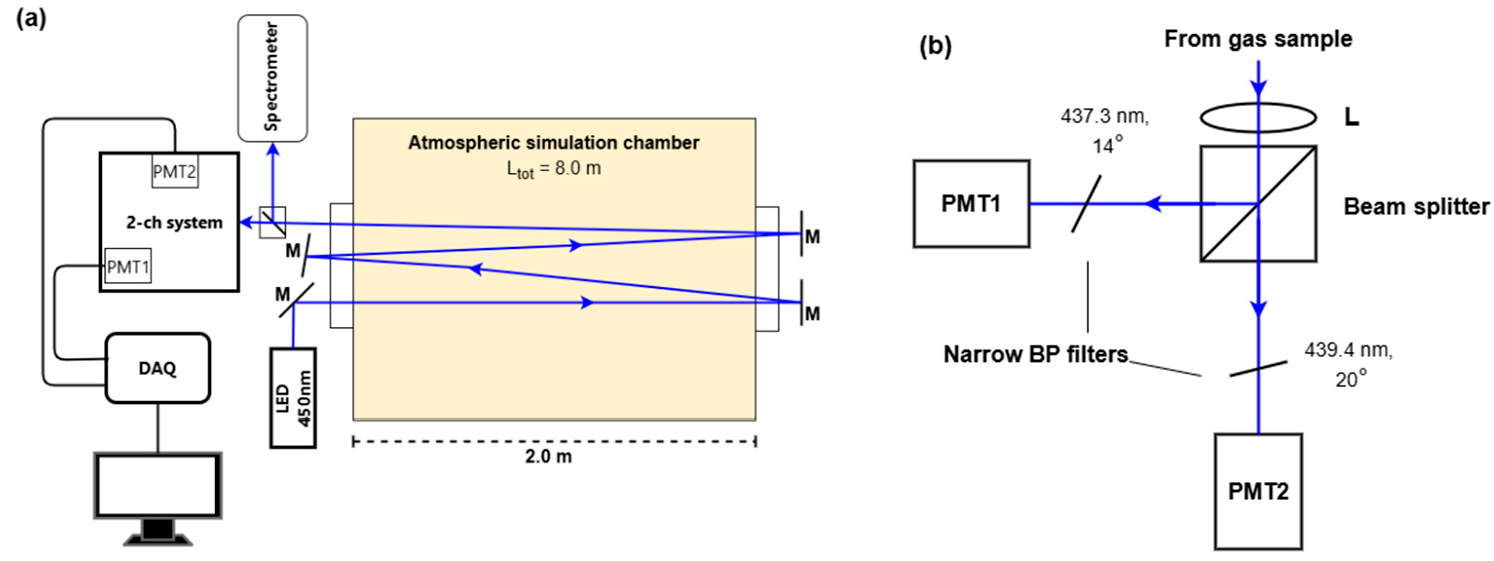
2.3. Chamber Optical System

The optical system used to demonstrate the two-wavelength approach was constructed across a 2.65 m3 atmospheric simulation chamber (Figure 2) [72]. A blue LED (Ushio LED450-06, Tokyo, Japan) with a passive heat sink produced an output spectrum centred at 450 nm with a half-width of 25 nm. A shortpass filter (Schott KG3, Mainz, Germany) removed wavelengths above 700 nm, and a convex lens focused the light through a Perspex window in the atmospheric simulation chamber. An 8 m path through the chamber interior was achieved by reflecting the LED beam four times across the chamber (length = 2.0 m) using planar mirrors.
After the fourth pass, the beam was split into two channels. In one channel, the spectrum was measured with a spectrograph (Andor, Shamrock 163, Belfast, UK) and a CCD detector (Andor iDUS, DV420A-BU, Belfast, UK) with a spectral resolution of 0.4 nm. In the other channel, the beam was collimated with a lens (a focal length of 250 mm), split into two arms (Figure 2b), each of which comprised a narrow bandpass filter (Semrock LL01-442-12.5, New York, NY, USA) and a photomultiplier tube (PMT) module (Hamamatsu H12405, Shizuoka, Japan). The narrow bandpass filters (FWHM = 1.44 nm) were oriented for maximum transmission at 437.3 nm and 439.4 nm. The angle dependence of the spectral transmission band and bandwidth is shown in Figure S2.
The signal from the ratiometric two-wavelength system was compared against the results from an analysis of the spectrograph spectra using the spectral analysis software package DOASIS 3.2. As the pathlength through the sample was accurately known, the DOAS measurements were used as a reference method for NO2 concentrations in the chamber to validate the ratiometric system [73,74]. NO2 (98.5% purity) was added stepwise to the chamber, where it was mixed with a fan to ensure a homogeneous gas sample. Given the short optical pathlength through the sample, ppm-level mixing ratios of NO2 were used in the chamber.

2.4. External Open-Path Optical System

A spectrometer similar to a DOAS system was set up to test the spectral stability of the system across an optical path of 45 m in the open atmosphere (Figure S4). The system comprised a blue LED (Ushio LED435-03, Tokyo, Japan) with a maximum intensity at 440 nm, two refracting telescopes and a spectrograph (Andor Shamrock 163 spectrograph with iDus 420A CCD, Belfast, UK). The transmitting and receiving telescopes were constructed parallel to each other in a coupled optical cage system with 25 mm diameter optics. The transmitter telescope had plano-concave and plano-convex lenses (focal lengths of −50 mm and 125 mm), and the receiving telescope used a 100 mm focal length plano-convex lens to focus the collected beam into a fibre connected to the spectrograph. The spectrograph resolution was 0.46 nm.
The transmitter–detector system was located inside a chemistry laboratory (51°53′32″ N 8°29′37″ W), and the beam was projected 22.5 m to a 100 cm2 plastic retroreflector array mounted on a fence 1.9 m above ground level. The beam path crossed a car park and road (Gaol Walk Rd) and was occasionally blocked by large vehicles or passing pedestrians.

3. Results and Discussion

3.1. Simulated Response to NO2 and Potential Interferences

Strong and weak absorption features are still appreciable in the convolved spectrum of NO2 (Figure 1). For example, the high-resolution absorption cross-sections at 435.0 and 437.3 nm are 8.0 × 10⁻¹⁹ and 3.3 × 10⁻¹⁹ cm2 molecule−1, respectively, with a ratio of σ 435 n m σ 438 n m = 2.42 . The corresponding convolved cross-sections are 6.1 × 10⁻¹⁹ and 4.2 × 10⁻¹⁹ cm2 molecule−1 ( σ 435 n m σ 438 n m = 1.45 ). Similar large differences in absorption cross-sections are found at 437.3 nm and 439.4 nm where the ratio of absorption cross-sections is also 1.5 .
The convolved absorption cross-sections at 437.3 and 439.4 nm for NO2, GLY, MGLY, O3, O4 and H2O are given in Table 1, which also reports the typical number densities of these pollutants in urban environments. We provide a lower limit for NO2 (1011 molecules cm−3, approximately 4 ppb), although its concentration in urban centres is typically much higher (e.g., [75]). In contrast, the maximum GLY concentrations reached 4 × 10¹⁰ molecules cm−3 in Mexico City [76] and 1 × 10¹¹ molecules cm−3 in Beijing in winter (with an average concentration of 3 × 10¹⁰) [77]. GLY concentrations in Mexico City were, on average, less than 10% of the concurrent NO2 concentration, indicating that GLY is a relatively small interference for NO2 measurements in this environment [52]. Concentrations of MGLY were higher than GLY in Beijing, reaching maxima of 5 × 10¹¹ molecules cm−3 and an average of 1 × 10¹¹ molecules cm−3 [77]. Nevertheless, the contribution of MGLY is expected to be small because the difference in absorption at the two wavelengths is 40 times weaker for MGLY compared to NO2. These megacities may also be exceptional, as peak concentrations of GLY and MGLY in a mid-sized Japanese city were an order of magnitude lower [78,79].
Concentrations of O3 are generally higher than those of NO2 but can be neglected since the difference in absorption cross-section is four orders of magnitude smaller than that of NO2 [75,80]. At these wavelengths and number densities, the difference in extinction coefficients is more than an order of magnitude larger for NO2 than potential interferences from other absorbers, even at these lower limits for urban NO2 concentrations. As a result, NO2 is expected to dominate the ratio of absorption at the two wavelengths.
The simulated response of a two-channel instrument, where λ1 = 437.3 nm and λ2 = 439.4 nm, is shown in Figure 3 for NO2, glyoxal and methylglyoxal under different loading conditions over a pathlength of 1000 m. The use of a narrow bandpass filter to choose the system operating wavelengths allows the selection of operating wavelengths that are less affected by these interfering compounds. As expected from Table 1, the spectral interference from methylglyoxal is negligible at these mixing ratios, especially considering that methylglyoxal is typically at sub-ppb levels in urban environments [78,79]. The response to glyoxal is larger, resulting in positive interference and the overestimation of NO2. Nevertheless, glyoxal normally occurs at sub-ppb mixing ratios in urban environments [76,77,81,82]; at these concentrations, the effect on NO2 measurements will also be minor [83,84]. Ozone absorption is negligible—for example, 40 ppb O3 would contribute 0.1% of that of 4 ppb NO2 (Table 1).
Among other absorbers, the difference in O4 absorption, caused by O2–O2 collision pairs, is less than 1% of that of NO2. Moreover, the O4 absorption is expected to be relatively constant across typical atmospheric temperature and pressure variations and could be corrected if temperature and pressure are known [85]. Absorption by water vapour will be a significant interference when NO2 concentrations are low and water vapour concentrations are elevated (at high temperatures and relative humidities). At 80% relative humidity and 25 °C, water accounts for less than 4% of the difference in extinction compared to that of 4 ppb NO2 (Table 1). The interference from water vapour absorption can be substantially reduced by shifting to shorter wavelengths where water absorption is weaker. Alternatively, the contribution from water vapour absorption can be calculated from the temperature and relative humidity and subtracted to correct Δ ε .
Interference from Mie scattering by aerosols and Raleigh scattering in the air must also be considered. Different aerosol loading parameters were considered to cover a range of scenarios. The Angstrom extinction exponent, α , increases with the aerosol concentration and depends on particle size and composition. Lv et al. [86] reported that α 0 is characteristic of clean environments with C P M 10   μ g   m 3 , while α > 1 is typical of extremely polluted environments ( C P M > 150   μ g   m 3 ) when relative humidity is less than 90%. As discussed by Papachristopoulou et al. [87], the optical depth, τ, is <0.25 for low aerosol loading, 0.25–0.5 for medium loading and >0.5 under high aerosol loading conditions. The wavelength dependence of aerosol extinction for a range of loading conditions is shown in Figure S3. Under clean conditions, the aerosol optical depth varies slowly with wavelength, with a small effect on the narrowband retrieval for a ratiometric two-channel system. As aerosol loading increases, the slope of the optical depth function increases, as shown in Figure S3, creating more interference in ratiometric two-channel measurements as the difference between nearby wavelengths is increased.
The extinction coefficient β e x t (m−1) can be calculated from the optical depth, τ, and pathlength, L (m):
β e x t = τ L
and the mass concentration, CA, of aerosols can be estimated from the mass extinction efficiency (MEE = 2 m2 g−1 at 440 nm) [88,89]:
C A = β e x t M E E
For optical depths of τ = 0.1, 0.3 and 0.6, the difference in extinction at 437.3 and 439.5 nm would be 4.5 × 10⁻⁹, 1.35 × 10⁻⁸ and 2.25 × 10⁻⁸ cm−1. These differences in extinction are comparable to the change in signal seen for low urban concentrations of NO2 (Table 1). However, NO2 is generally present at higher values than reported here, and these extinction values correspond to polluted particulate mass concentrations (50, 150 and 300 µg m−3). As a result, the interference under low aerosol loading conditions is likely to be acceptably small, whereas high concentrations of particulate matter would have a greater effect on system selectivity to NO2 since the change in ratio of intensities caused by aerosols would lead to an overestimation of NO2.
A number of strategies can be used to handle the influence of aerosols. For in situ measurements, an in-line filter can be used to remove interferences from aerosols [38,39]. In open path configurations, the contribution of aerosols can be calculated if the particulate matter (PM) concentration is known. Choosing operating wavelengths that are sufficiently close will reduce the effect of aerosols on the measured NO2 signal, although this requires a narrower filter passband [65]. Alternatively, introducing a third measurement channel, while increasing the system complexity, would allow the aerosol extinction to be separated from that of NO2 and the PM concentration to be retrieved [51].
Distinguishing small signals from large background noise may require careful consideration of light detection and amplification to achieve the desired signal-to-noise ratio (SNR) for different monitoring environments. For low NO2 mixing ratios (<1 ppb), for example, the change in ratio is below 0.1% (depending on the pathlength). Amplification strategies, such as lock-in amplification, or the use of highly sensitive detectors, such as photomultiplier tubes or silicon photomultipliers, may be required for these situations. In contrast, for applications with higher NO2 concentrations (such as continuous emissions monitoring) [90,91], the two-channel approach will have a stronger response. Increasing the optical pathlength also improves system sensitivity to small changes in intensity, although at the expense of the overall signal magnitude. In stationary or mobile measurements in the traffic microenvironment, a detection system with a high time resolution and good sensitivity to NO2 would be required to study rapid changes in NO2 concentrations [47,92,93].

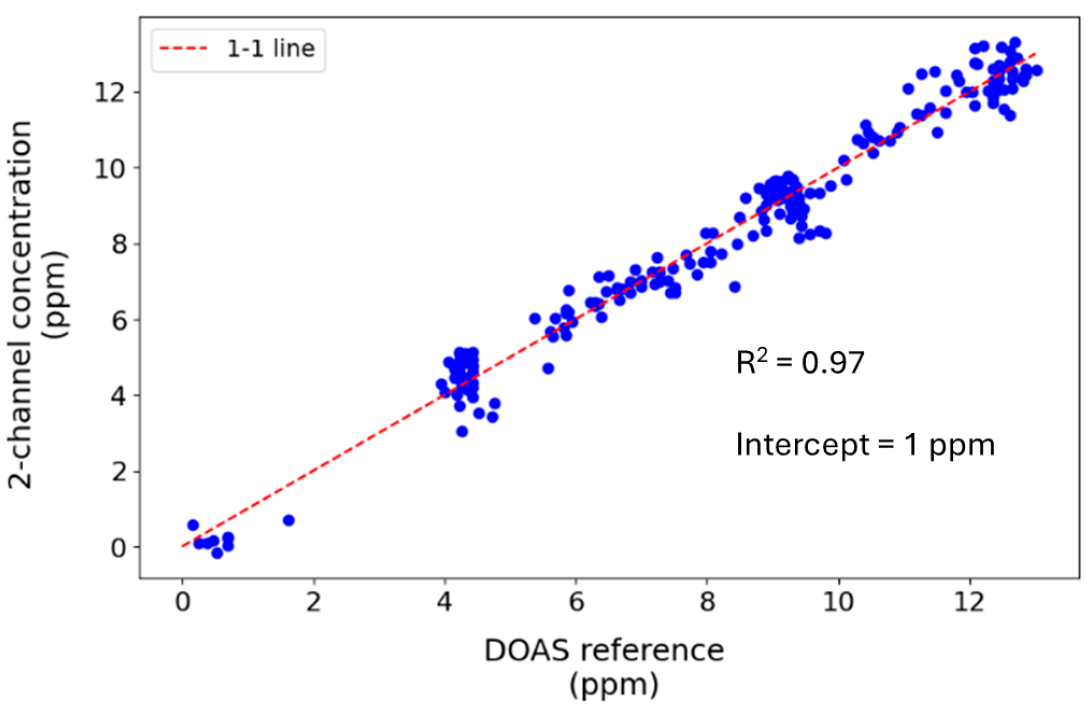
3.2. Chamber Experiments

A demonstration of the approach was carried out in a 2.65 m3 atmospheric simulation chamber with an 8.0 m optical pathlength (Figure 2). The response of both PMT detectors in the absence of NO2 in the chamber was recorded with a 1 s time resolution to characterise the time dependence of the system’s precision. Figure 4 shows the Allan deviation of the PMT signals and that of their ratio. The PMTs have distinct noise characteristics: the precision of PMT1 is worse than that of PMT2 at short times but continues to improve up to 100 s averaging time, whereas the precision of PMT2 is higher but only improves up to 20 s averaging. The ratio of the two signals reaches a minimum deviation of 6 × 10⁻⁴ over 100 s, equivalent to an NO2 mixing ratio of 152 ppb. This sensitivity is reasonable considering the short, 8 m pathlength and that the instrument was intended only as a demonstration system of the two-channel approach.
Figure 5 shows the normalised intensities of the PMTs at 437.4 and 439.3 nm, respectively, averaged over 1 s upon the addition of NO2 to the chamber. The respective absorption cross-sections at the system’s resolution (defined by the measured narrow bandpass filter bandwidth of 1.44 nm) are σ1 = 4.2 × 10⁻¹⁹ cm−2 molecule−1 and σ2 = 6.3 × 10⁻¹⁹ cm−2 molecule−1, yielding a differential absorption cross-section, Δσ, of 2.1 × 10⁻¹⁹ cm−2 molecule−1. At the maximum mixing ratio of NO2 (12.5 ppm), the expected difference in signal in the two channels is readily apparent: an 8.0% decrease is seen at 439.3 nm versus 4.5% at 437.4 nm. Before adding NO2, the standard deviations of PMT1 and PMT2 are 0.2% and 0.1%, respectively, again indicating the different noise characteristics of these photodetectors.
Based on the ratio of the measured intensities calibrated against the DOAS reference, the 1σ measurement precision of the two-channel system is 136 ppb over 1 min (Figure 6), comparing favourably with the DOAS reference, which has a limit of 145 ppb for the same averaging time. Here, the two-channel system was calibrated based on that of the DOAS reference. While our approach only has two detector channels (compared to about 90 pixels used in the DOAS spectral analysis), more light is transmitted to the detector. In contrast, a large portion of the signal is lost at the spectrometer slit in the DOAS system. Applying Savitsky–Golay filtering with a window of 60 data points sampled at 1 s intervals improved the two-channel system limit to 51 ppb. Figure 7 shows that the ratiometric two-channel method is well-correlated with the DOAS reference (R2 > 0.97, y-intercept = 0.99). Assuming that other factors do not affect the SNR, we estimate the detection limit would be 2.3 ppb over a 250 m pathlength. However, these measurements were made in a controlled environment, and ambient conditions may affect the system’s accuracy. The signal amplitude also decreases over longer pathlengths, decreasing the SNR. Nonetheless, this theoretical improvement compares favourably with a limit of detection of 2 ppb in a ratiometric open-path dual-beam laser spectroscopy instrument across a longer pathlength of 1.3 km [94]. Longer pathlengths can be realised using either long open paths or optical cavities, albeit at the cost of signal magnitude. Even so, this demonstration system is already sensitive enough to be applied over short pathlengths (for example, industrial exhaust stacks) for continuous emission monitoring, where NO2 concentrations could be much higher than ambient levels.

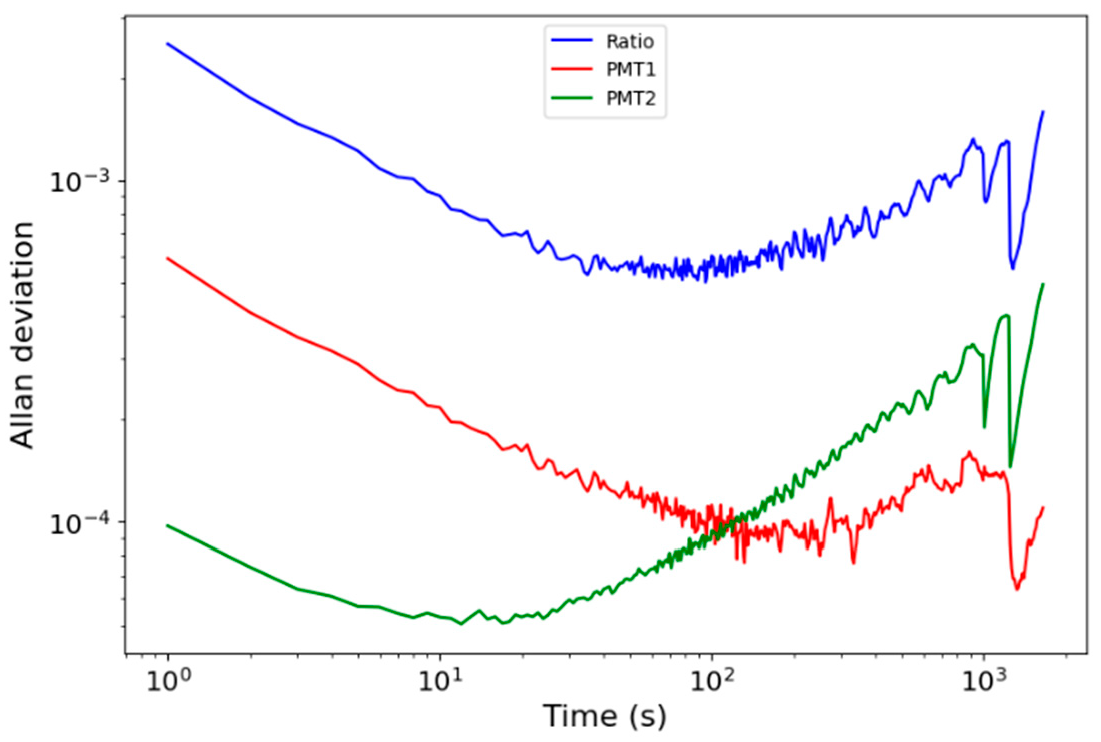
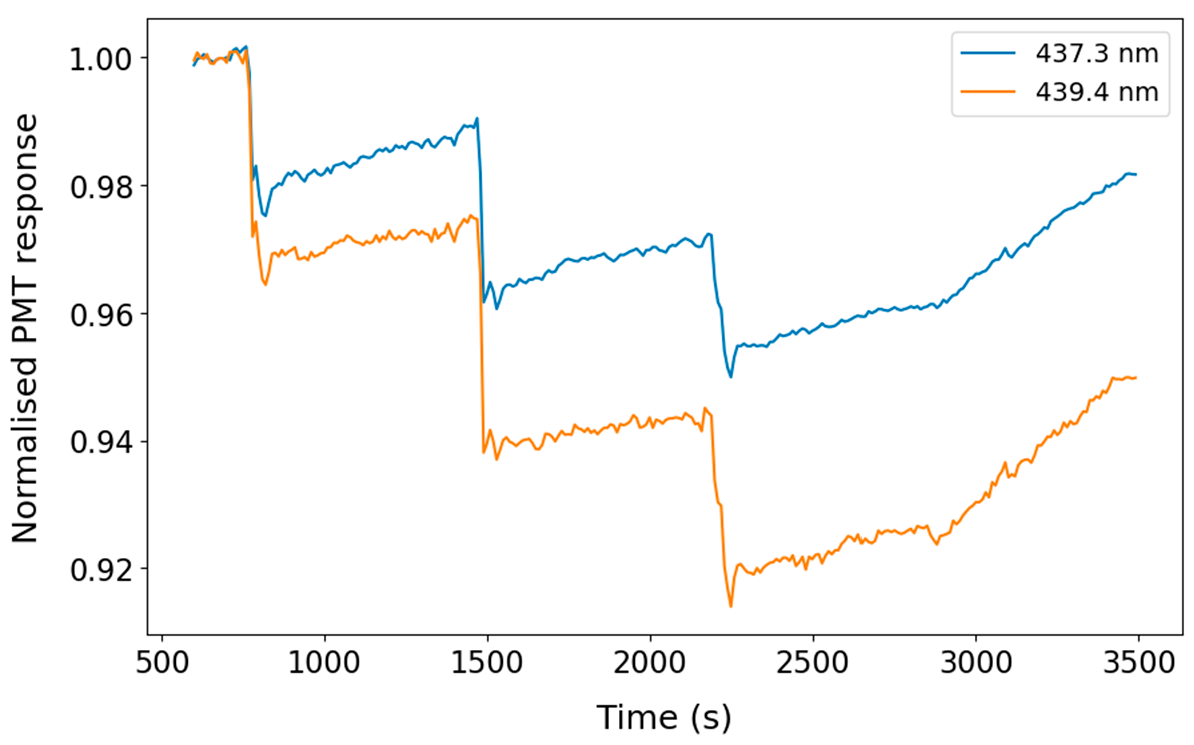
3.3. Spectral Stability in the External Atmosphere

To evaluate the spectral stability of the two-channel approach in the open atmosphere, the time dependence of the ratio of transmitted intensity in two channels (438.0 nm to 438.5 nm and 439.0 nm to 439.5 nm) was compared against their normalised intensity. The open-path system was a simple, thermally unregulated system with an optical pathlength of 45 m. The intensity measured by the system is a combination of light from the LED transmitted through the atmosphere, background light in the environment and noise associated with the spectrographs.
Figure 8 shows the variation of the two channels over four days (7 to 11 November 2024), along with the rainfall and visibility measured at Cork Airport situated 5 km to the south. Rainfall and visibility would reduce the measured intensity if they also occur at the measurement site. Large intensity changes are observed over this time, with an almost 10-fold increase from the lowest to the highest measured intensity. Some periods of relatively stable transmission were seen (e.g., on 11 November), while at other times, large and rapid intensity changes occurred, with the intensity changing by up to 50% over a few hours. Periods of low transmitted intensity corresponded to periods of rainfall and low visibility. The retroreflector array was fully exposed to rain, and residual water on the array surface reduced the amount of light returned to the receiver telescope. Analysing wide changes in absolute measured intensity over a four-day period allows the stability of the intensity ratio to be more clearly evident.
Compared to the large variations in the measured intensity, the ratio of intensities of the two wavelengths was remarkably stable. The standard deviation of the ratio of the two channels was 0.2%, two orders of magnitude smaller than the standard deviation of the transmitted intensity (27%). These measurements demonstrate the high spectral stability of this two-wavelength method, with the mean ratio being 0.998. This stability is achieved despite changes in atmospheric transmission or drifts in the measurement system (light source output, changes in the optical alignment of the telescopes and retroreflector array). Typical long-path DOAS systems have pathlengths of hundreds of metres to several kilometres, and accordingly, our system is not expected to be sensitive to NO2 over this short pathlength.

4. Conclusions

The ratiometric two-wavelength method presented in this study was demonstrated in an atmospheric simulation chamber and is a potentially useful tool for monitoring NO2 in a range of settings. It can be used in both in situ and remote sensing configurations and can enable NO2 measurements with a response time of seconds. Fast measurements are needed to study the dynamic fluctuations associated with roadside locations and in mobile measurements, and the short measurement time improves on that of standard chemiluminescence monitors. We have recently used a related CEAS approach for fast curbside monitoring in Cork City [95] (paper in preparation).
We validated the response of a demonstration two-wavelength system against a full DOAS spectral analysis in an atmospheric simulation chamber. Despite measurement at only two wavelengths, the sensitivity of the two-channel method was similar to that of the DOAS system, likely because of higher optical throughput to the detectors. The PMT modules used in the two-channel system are relatively expensive and can be replaced by other sensitive but less expensive photodetectors, such as silicon photomultipliers [38].
The two-wavelength approach also aims to be relatively inexpensive compared to conventional air quality monitoring equipment. A single, inexpensive LED was used as the light source, and the system does not require a reference lamp or gas cell as in other spectroscopic methods [54]. The LED light source is less expensive than lasers and poses minimal safety risks. These attributes make the system better suited to citizen science projects and open-path measurements. The ability to modulate the LED is also advantageous in open-path configurations to distinguish the signal from background light.
The two-channel approach has several drawbacks. It has inherently less spectral information than a full spectral measurement, limiting the measurement to a single target species. As we have shown, potential interferences must be carefully considered. In contrast, full-spectral methods like DOAS and IBBCEAS can quantify multiple absorbing compounds concurrently. The spectral resolution demonstrated in this work is not high, reducing the selectivity to the target species. The selectivity could be increased by using custom filters with narrower transmission bands, but doing so would reduce the measured intensity and signal-to-noise ratio. Extremely narrowband filters are also costly—trade-offs between selectivity, sensitivity and cost will have to be considered for any particular application.
The optical system outlined in this paper is simpler than the rotating filter design that Flowerday et al. [67] used to measure glyoxal based on its differential structure between 450–470 nm. The optics in the two-channel system are in a fixed position, minimising mechanical instabilities. The fixed alignment and absence of mechanical movement in our optical system should be more robust. In principle, a single narrow bandpass filter can be configured to select both channel wavelengths, but in practice, we found it challenging to align the one-filter configuration to achieve the desired operating wavelengths in each channel. A single filter is also more prone to beam clipping at the filter edges, an effect that introduces noise into the ratiometric measurement. The importance of reducing beam clipping in spectroscopic approaches to maximise the signal throughput and reduce instabilities has been discussed elsewhere ([96,97,98]).
The goal of this work was to expand air quality monitoring to a wider range of settings. The two-channel method presented here gives good selectivity to NO2 at a cost that could make it attractive for use in low-income countries, smaller towns and citizen science projects. For in situ measurements, a narrow two-channel system could be built for under €1600 and a remote sensing system for under €1100 using components laid out in Table S1. For ambient NO2 monitoring, in situ (e.g., using optical cavities) or long open-path configurations would be needed for pathlengths long enough to achieve a suitable sensitivity. The method could also be directly applied over short pathlengths to continuous emission monitoring across chimney stacks where elevated concentrations could occur.
Finally, we note that while the two-channel method shows promise for monitoring NO2, the approach itself can be generalised and applied to measure other gases with highly structured absorptions, such as SO2 or NH3, in other spectral regions.

Supplementary Materials

The following supporting information can be downloaded at: https://www.mdpi.com/article/10.3390/atmos16050599/s1, Figure S1: Absorption cross section spectra of NO2, glyoxal, methylglyoxal ozone and the oxygen dimer, O4, convolved with a gaussian function of the narrow bandpass filter transmission band. NO2 has the larger absorption cross section and more highly structured absorption features across most of this region compared to glyoxal and methylglyoxal.; Figure S2. (a) The change in filter centre wavelength as the angle of incidence of the narrow bandpass filter is increased. The full LED emission spectrum is overlayed. (b) The relationship between the filter angle of incidence and the transmission bandwidth and centre wavelength. Figure S3. Aerosol optical extinction for different loading parameters, τ, and size distributions, α. Figure S4. Photographs showing the open-path DOAS-type system for testing the spectral stability of two nearby wavelengths. (a) Optical path and positions of the transmitter/receiver and the retroreflector. (b) Transmitter/receiver system showing the spectrograph and cage system construction of the transmitter and receiver telescopes. (c) Plastic retroreflector assembly with dimensions of 10 cm × 10 cm. Table S1: Cost and components needed for an ideal narrow two-channel system.

Author Contributions

Conceptualization, D.S.V. and E.F.H.; methodology, E.F.H., R.V. and C.W.D.; software, E.F.H., R.V., D.S.V. and M.W.; validation, E.F.H., R.V. and D.S.V.; formal analysis, E.F.H., R.V., M.W. and D.S.V.; investigation, E.F.H., R.V. and D.S.V.; resources, E.F.H., R.V. and D.S.V.; data curation, E.F.H. and R.V.; writing—original draft preparation, E.F.H. and R.V.; writing—review and editing, D.S.V., E.F.H., R.V., M.W. and C.W.D.; visualization, E.F.H., R.V. and D.S.V.; supervision, D.S.V.; project administration, D.S.V.; funding acquisition, D.S.V. and E.F.H. All authors have read and agreed to the published version of the manuscript.

Funding

This research was funded by the Government of Ireland Postgraduate Scholarship Programme (grant number GOIPG/2020/1613) and by Taighde Éireann–Research Ireland under Grant number 21/FFP-P/10220.

Institutional Review Board Statement

Not applicable.

Informed Consent Statement

Not applicable.

Data Availability Statement

The original contributions presented in this study are included in the article/Supplementary Materials. Further inquiries can be directed to the corresponding author.

Acknowledgments

We thank the Laser Spectroscopy Group (School of Physics, University College Cork) for assisting us in fabricating optical mounts, and technical officers (School of Chemistry, University College Cork) for facilitating the open path measurements.

Conflicts of Interest

The authors declare no conflicts of interest.

Abbreviations

The following abbreviations are used in this manuscript:
CAPSCavity-Attenuated Phase Shift
CEASCavity-Enhanced Absorption Spectroscopy
DIALDifferential Absorption LIDAR
DOASDifferential Optical Absorption Spectroscopy
GLYGlyoxal
IBBCEASIncoherent Broadband Cavity-Enhanced Absorption Spectroscopy
LEDLight-emitting diode
LIDARLight Detecting and Ranging
MGLYMethylglyoxal
PMTPhotomultiplier tube
SNRSignal-to-noise ratio
WHOWorld Health Organisation

References

  1. World Health Organisation. Ambient Air Pollution: A Global Assessment of Exposure and Burden of Disease; World Health Organization: Geneva, Switzerland, 2016. [Google Scholar]
  2. World Health Organization. WHO Global Air Quality Guidelines: Particulate Matter (PM2.5 and PM10), Ozone, Nitrogen Dioxide, Sulfur Dioxide and Carbon Monoxide; World Health Organization: Geneva, Switzerland, 2021. [Google Scholar]
  3. Meng, X.; Liu, C.; Chen, R.; Sera, F.; Vicedo-Cabrera, A.M.; Milojevic, A.; Guo, Y.; Tong, S.; Coelho, M.S.Z.S.; Saldiva, P.H.N.; et al. Short Term Associations of Ambient Nitrogen Dioxide with Daily Total, Cardiovascular, and Respiratory Mortality: Multilocation Analysis in 398 Cities. BMJ 2021, 372, n534. [Google Scholar] [CrossRef]
  4. Liu, C.; Chen, R.; Lei, J.; Zhu, Y.; Zhou, L.; Meng, X.; Xuan, J.; Kan, H. Ambient Nitrogen Dioxide and Hospitalizations of Full-Spectrum Respiratory Diseases: A National Case-Crossover Study. Environ. Health 2023, 1, 130–138. [Google Scholar] [CrossRef] [PubMed]
  5. Huangfu, P.; Atkinson, R. Long-Term Exposure to NO2 and O3 and All-Cause and Respiratory Mortality: A Systematic Review and Meta-Analysis. Environ. Int. 2020, 144, 105998. [Google Scholar] [CrossRef] [PubMed]
  6. Weinmayr, G.; Romeo, E.; de Sario, M.; Weiland, S.K.; Forastiere, F. Short-Term Effects of PM10 and NO2 on Respiratory Health among Children with Asthma or Asthma-Like Symptoms: A Systematic Review and Meta-Analysis. Environ. Health Perspect. 2010, 118, 449–457. [Google Scholar] [CrossRef]
  7. Liu, Y.; Pan, J.; Zhang, H.; Shi, C.; Li, G.; Peng, Z.; Ma, J.; Zhou, Y.; Zhang, L. Short-Term Exposure to Ambient Air Pollution and Asthma Mortality. Am. J. Respir. Crit. Care Med. 2019, 200, 24–32. [Google Scholar] [CrossRef]
  8. Jacquemin, B.; Sunyer, J.; Forsberg, B.; Aguilera, I.; Briggs, D.; García-Esteban, R.; Götschi, T.; Heinrich, J.; Järvholm, B.; Jarvis, D.; et al. Home Outdoor NO2 and New Onset of Self-Reported Asthma in Adults. Epidemiology 2009, 20, 119–126. [Google Scholar] [CrossRef]
  9. Bharadwaj, P.; Zivin, J.G.; Mullins, J.T.; Neidell, M. Early-Life Exposure to the Great Smog of 1952 and the Development of Asthma. Am. J. Respir. Crit. Care Med. 2016, 194, 1475–1482. [Google Scholar] [CrossRef]
  10. Cheng, H.; Di Narzo, A.; Howell, D.; Yevdokimova, K.; Zhang, J.; Zhang, X.; Pan, Q.; Zhang, Z.; Rogers, L.; Hao, K. Ambient Air Pollutants and Traffic Factors Were Associated with Blood and Urine Biomarkers and Asthma Risk. Environ. Sci. Technol. 2022, 56, 7298–7307. [Google Scholar] [CrossRef] [PubMed]
  11. Phiri, Y.V.A.; Canty, T.; Nobles, C.; Ring, A.M.; Nie, J.; Mendola, P. Neonatal Intensive Care Admissions and Exposure to Satellite-Derived Air Pollutants in the United States, 2018. Sci. Rep. 2025, 15, 420. [Google Scholar] [CrossRef]
  12. Goin, D.E.; Sudat, S.; Riddell, C.; Morello-Frosch, R.; Apte, J.S.; Glymour, M.M.; Karasek, D.; Casey, J.A. Hyperlocalized Measures of Air Pollution and Preeclampsia in Oakland, California. Environ. Sci. Technol. 2021, 55, 14710–14719. [Google Scholar] [CrossRef]
  13. Wei, S.; Xu, T.; Jiang, T.; Yin, D. Chemosensory Dysfunction Induced by Environmental Pollutants and Its Potential As a Novel Neurotoxicological Indicator: A Review. Environ. Sci. Technol. 2021, 55, 10911–10922. [Google Scholar] [CrossRef] [PubMed]
  14. Alemany, S.; Vilor-Tejedor, N.; García-Esteban, R.; Bustamante, M.; Dadvand, P.; Esnaola, M.; Mortamais, M.; Forns, J.; van Drooge, B.L.; Álvarez-Pedrerol, M.; et al. Traffic-Related Air Pollution, APOE ε4 Status, and Neurodevelopmental Outcomes among School Children Enrolled in the BREATHE Project (Catalonia, Spain). Environ. Health Perspect. 2018, 126, 087001. [Google Scholar] [CrossRef]
  15. Li, Z.; Yan, H.; Zhang, X.; Shah, S.; Yang, G.; Chen, Q.; Han, S.; Zhang, D.; Weinberger, D.R.; Yue, W.; et al. Air Pollution Interacts with Genetic Risk to Influence Cortical Networks Implicated in Depression. Proc. Natl. Acad. Sci. USA 2021, 118, e2109310118. [Google Scholar] [CrossRef] [PubMed]
  16. Myhre, G.; Myhre, C.E.L.; Samset, B.H.; Storelvmo, T. Atmospheric Aerosols from Human Activity Influence Climate. Uncertainties in the Understanding of Their Effects Limit Our Knowledge about Climate Change. Nat. Educ. Knowl. 2013, 4, 7. [Google Scholar]
  17. Zhang, J.J.; Wei, Y.; Fang, Z. Ozone Pollution: A Major Health Hazard Worldwide. Front. Immunol. 2019, 10, 2518. [Google Scholar] [CrossRef] [PubMed]
  18. Brimblecombe, P.; Chu, M.; Liu, C.-H.; Fu, Y.; Wei, P.; Ning, Z. Roadside NO2/NOx and Primary NO2 from Individual Vehicles. Atmos. Environ. 2023, 295, 119562. [Google Scholar] [CrossRef]
  19. Lenner, M.; Lindqvist, O.; Rosén, Å. The Ratio in Emissions from Gasoline-Powered Cars: High NO2 Percentage in Idle Engine Measurements. Atmos. Environ. 1983, 17, 1395–1398. [Google Scholar] [CrossRef]
  20. Munir, S.; Mayfield, M.; Coca, D. Understanding Spatial Variability of NO2 in Urban Areas Using Spatial Modelling and Data Fusion Approaches. Atmosphere 2021, 12, 179. [Google Scholar] [CrossRef]
  21. Hewitt, C.N. Spatial Variations in Nitrogen Dioxide Concentrations in an Urban Area. Atmos. Environ. Part B 1991, 25, 429–434. [Google Scholar] [CrossRef]
  22. Yang, L.H.; Hagan, D.H.; Rivera-Rios, J.C.; Kelp, M.M.; Cross, E.S.; Peng, Y.; Kaiser, J.; Williams, L.R.; Croteau, P.L.; Jayne, J.T.; et al. Investigating the Sources of Urban Air Pollution Using Low-Cost Air Quality Sensors at an Urban Atlanta Site. Environ. Sci. Technol. 2022, 56, 7063–7073. [Google Scholar] [CrossRef]
  23. Dunlea, E.J.; Herndon, S.C.; Nelson, D.D.; Volkamer, R.M.; San Martini, F.; Sheehy, P.M.; Zahniser, M.S.; Shorter, J.H.; Wormhoudt, J.C.; Lamb, B.K.; et al. Evaluation of Nitrogen Dioxide Chemiluminescence Monitors in a Polluted Urban Environment. Atmos. Chem. Phys. 2007, 7, 2691–2704. [Google Scholar] [CrossRef]
  24. Byrne, R.; Ryan, K.; Venables, D.S.; Wenger, J.C.; Hellebust, S. Highly Local Sources and Large Spatial Variations in PM2.5 across a City: Evidence from a City-Wide Sensor Network in Cork, Ireland. Environ. Sci. Atmos. 2023, 3, 919–930. [Google Scholar] [CrossRef]
  25. Wei, L.; Donaire-Gonzalez, D.; Helbich, M.; van Nunen, E.; Hoek, G.; Vermeulen, R.C.H. Validity of Mobility-Based Exposure Assessment of Air Pollution: A Comparative Analysis with Home-Based Exposure Assessment. Environ. Sci. Technol. 2024, 58, 10685–10695. [Google Scholar] [CrossRef]
  26. Manchanda, C.; Harley, R.A.; Marshall, J.D.; Turner, A.J.; Apte, J.S. Integrating Mobile and Fixed-Site Black Carbon Measurements to Bridge Spatiotemporal Gaps in Urban Air Quality. Environ. Sci. Technol. 2024, 58, 12563–12574. [Google Scholar] [CrossRef] [PubMed]
  27. Okure, D.; Ssematimba, J.; Sserunjogi, R.; Gracia, N.L.; Soppelsa, M.E.; Bainomugisha, E. Characterization of Ambient Air Quality in Selected Urban Areas in Uganda Using Low-Cost Sensing and Measurement Technologies. Environ. Sci. Technol. 2022, 56, 3324–3339. [Google Scholar] [CrossRef]
  28. Yang, G.G.; Kim, D.H.; Samal, S.; Choi, J.; Roh, H.; Cunin, C.E.; Lee, H.M.; Kim, S.O.; Dincă, M.; Gumyusenge, A. Polymer-Based Thermally Stable Chemiresistive Sensor for Real-Time Monitoring of NO2 Gas Emission. ACS Sens. 2023, 8, 3687–3692. [Google Scholar] [CrossRef]
  29. Zhang, Y.; Liu, Q.; Sun, Q.; Li, H.; Shen, J.; Liu, H.; Chen, W.; Zhang, Y.; Chen, Y. Metalloporphyrin-Based Metal–Organic Frameworks for the Ultrasensitive Chemiresistive Detection of NO2: Effect of the Central Metal on Tuning the Sensing Performance. ACS Sens. 2023, 8, 4353–4363. [Google Scholar] [CrossRef]
  30. Schmitz, S.; Caseiro, A.; von Schneidemesser, E. How Electrochemical Sensors Measure up to Reference-Grade Nitrogen Dioxide Monitors across Temporal Scales. Sci. Total Environ. 2025, 980, 179476. [Google Scholar] [CrossRef] [PubMed]
  31. Zuidema, C.; Bi, J.; Burnham, D.; Carmona, N.; Gassett, A.J.; Slager, D.L.; Schumacher, C.; Austin, E.; Seto, E.; Szpiro, A.A.; et al. Leveraging Low-Cost Sensors to Predict Nitrogen Dioxide for Epidemiologic Exposure Assessment. J. Expo. Sci. Environ. Epidemiol. 2025, 35, 169–179. [Google Scholar] [CrossRef]
  32. Mak, H.W.L.; Laughner, J.L.; Fung, J.C.H.; Zhu, Q.; Cohen, R.C. Improved Satellite Retrieval of Tropospheric NO2 Column Density via Updating of Air Mass Factor (AMF): Case Study of Southern China. Remote Sens. 2018, 10, 1789. [Google Scholar] [CrossRef]
  33. Okorn, K.; Iraci, L.T. An Overview of Outdoor Low-Cost Gas-Phase Air Quality Sensor Deployments: Current Efforts, Trends, and Limitations. Atmos. Meas. Tech. 2024, 17, 6425–6457. [Google Scholar] [CrossRef]
  34. Fang, B.; Zhao, W.; Xu, X.; Zhou, J.; Ma, X.; Wang, S.; Zhang, W.; Venables, D.S.; Chen, W. Portable Broadband Cavity-Enhanced Spectrometer Utilizing Kalman Filtering: Application to Real-Time, In Situ Monitoring of Glyoxal and Nitrogen Dioxide. Opt. Express 2017, 25, 26910. [Google Scholar] [CrossRef] [PubMed]
  35. Venables, D.S.; Gherman, T.; Orphal, J.; Wenger, J.C.; Ruth, A.A. High Sensitivity In Situ Monitoring of NO3 in an Atmospheric Simulation Chamber Using Incoherent Broadband Cavity-Enhanced Absorption Spectroscopy. Environ. Sci. Technol. 2006, 40, 6758–6763. [Google Scholar] [CrossRef]
  36. Liang, S.; Qin, M.; Xie, P.; Duan, J.; Fang, W.; He, Y.; Xu, J.; Liu, J.; Li, X.; Tang, K.; et al. Development of an Incoherent Broadband Cavity-Enhanced Absorption Spectrometer for Measurements of Ambient Glyoxal and NO2 in a Polluted Urban Environment. Atmos. Meas. Tech. 2019, 12, 2499–2512. [Google Scholar] [CrossRef]
  37. Fiedler, S.E.; Hese, A.; Ruth, A.A. Incoherent Broad-Band Cavity-Enhanced Absorption Spectroscopy. Chem. Phys. Lett. 2003, 371, 284–294. [Google Scholar] [CrossRef]
  38. Bailey, S.A.; Hannun, R.A.; Swanson, A.K.; Hanisco, T.F. A Portable Nitrogen Dioxide Instrument Using Cavity-Enhanced Absorption Spectroscopy. Atmos. Meas. Tech. 2024, 17, 5903–5910. [Google Scholar] [CrossRef]
  39. Womack, C.C.; Brown, S.S.; Ciciora, S.J.; Gao, R.-S.; McLaughlin, R.J.; Robinson, M.A.; Rudich, Y.; Washenfelder, R.A. A Lightweight Broadband Cavity-Enhanced Spectrometer for NO2 Measurement on Uncrewed Aerial Vehicles. Atmos. Meas. Tech. 2022, 15, 6643–6652. [Google Scholar] [CrossRef]
  40. Wheeler, M.D.; Newman, S.M.; Orr-Ewing, A.J.; Ashfold, M.N.R. Cavity Ring-Down Spectroscopy. J. Chem. Soc. Faraday Trans. 1998, 94, 337–351. [Google Scholar] [CrossRef]
  41. Ball, S.M.; Jones, R.L. Broad-Band Cavity Ring-Down Spectroscopy. Chem. Rev. 2003, 103, 5239–5262. [Google Scholar] [CrossRef]
  42. Zalicki, P.; Zare, R.N. Cavity Ring-Down Spectroscopy for Quantitative Absorption Measurements. J. Chem. Phys. 1995, 102, 2708–2717. [Google Scholar] [CrossRef]
  43. Osthoff, H.D.; Brown, S.S.; Ryerson, T.B.; Fortin, T.J.; Lerner, B.M.; Williams, E.J.; Pettersson, A.; Baynard, T.; Dubé, W.P.; Ciciora, S.J.; et al. Measurement of Atmospheric NO2 by Pulsed Cavity Ring-Down Spectroscopy. J. Geophys. Res. Atmos. 2006, 111, D12305. [Google Scholar] [CrossRef]
  44. Castellanos, P.; Luke, W.T.; Kelley, P.; Stehr, J.W.; Ehrman, S.H.; Dickerson, R.R. Modification of a Commercial Cavity Ring-Down Spectroscopy NO2 Detector for Enhanced Sensitivity. Rev. Sci. Instrum. 2009, 80, 113107. [Google Scholar] [CrossRef] [PubMed]
  45. Evertsen, R.; Staicu, A.; Dam, N.; van Vliet, A.; ter Meulen, J.J. Pulsed Cavity Ring-Down Spectroscopy of NO and NO2 in the Exhaust of a Diesel Engine. Appl. Phys. B 2002, 74, 465–468. [Google Scholar] [CrossRef]
  46. Fuchs, H.; Dubé, W.P.; Lerner, B.M.; Wagner, N.L.; Williams, E.J.; Brown, S.S. A Sensitive and Versatile Detector for Atmospheric NO2 and NOx Based on Blue Diode Laser Cavity Ring-Down Spectroscopy. Environ. Sci. Technol. 2009, 43, 7831–7836. [Google Scholar] [CrossRef]
  47. Schreier, S.F.; Richter, A.; Burrows, J.P. Near-Surface and Path-Averaged Mixing Ratios of NO2 Derived from Car DOAS Zenith-Sky and Tower DOAS Off-Axis Measurements in Vienna: A Case Study. Atmos. Chem. Phys. 2019, 19, 5853–5879. [Google Scholar] [CrossRef]
  48. Lee, J.; Kim, K.H.; Kim, Y.J.; Lee, J. Application of a Long-Path Differential Optical Absorption Spectrometer (LP-DOAS) on the Measurements of NO2, SO2, O3, and HNO2 in Gwangju, Korea. J. Environ. Manag. 2008, 86, 750–759. [Google Scholar] [CrossRef]
  49. Li, M.; Chen, J.; Su, M.; Yang, H.; Ramachandran, A.; Varma, R. An LP-DOAS Instrument with a Laser Driven Light Source for Open-Path Measurement of Atmospheric NO2 in Shanghai. In Proceedings of the 2017 Progress In Electromagnetics Research Symposium-Spring (PIERS), St. Petersburg, Russia, 22–25 May 2017. [Google Scholar]
  50. Shiina, T. LED Mini Lidar for Atmospheric Application. Sensors 2019, 19, 569. [Google Scholar] [CrossRef]
  51. Su, J.; McCormick, M.P.; Johnson, M.S.; Sullivan, J.T.; Newchurch, M.J.; Berkoff, T.A.; Kuang, S.; Gronoff, G.P. Tropospheric NO2 Measurements Using a Three-Wavelength Optical Parametric Oscillator Differential Absorption Lidar. Atmos. Meas. Tech. 2021, 14, 4069–4082. [Google Scholar] [CrossRef]
  52. Kebabian, P.L.; Wood, E.C.; Herndon, S.C.; Freedman, A. A Practical Alternative to Chemiluminescence-Based Detection of Nitrogen Dioxide: Cavity Attenuated Phase Shift Spectroscopy. Environ. Sci. Technol. 2008, 42, 6040–6045. [Google Scholar] [CrossRef]
  53. Birks, J.W.; Andersen, P.C.; Williford, C.J.; Turnipseed, A.A.; Strunk, S.E.; Ennis, C.A.; Mattson, E. Folded Tubular Photometer for Atmospheric Measurements of NO2 and NO. Atmos. Meas. Tech. 2018, 11, 2821–2835. [Google Scholar] [CrossRef]
  54. Kuhn, L.; Kuhn, J.; Wagner, T.; Platt, U. The NO2 Camera Based on Gas Correlation Spectroscopy. Atmos. Meas. Tech. 2022, 15, 1395–1414. [Google Scholar] [CrossRef]
  55. Li, J.; Chen, W.; Yu, B. Recent Progress on Infrared Photoacoustic Spectroscopy Techniques. Appl. Spectrosc. Rev. 2011, 46, 440–471. [Google Scholar] [CrossRef]
  56. Wang, Q.; Wang, J.; Li, L.; Yu, Q. An All-Optical Photoacoustic Spectrometer for Trace Gas Detection. Sens. Actuators B Chem. 2011, 153, 214–218. [Google Scholar] [CrossRef]
  57. Liu, K.; Yi, H.; Kosterev, A.A.; Chen, W.; Dong, L.; Wang, L.; Tan, T.; Zhang, W.; Tittel, F.K.; Gao, X. Trace Gas Detection Based on Off-Beam Quartz Enhanced Photoacoustic Spectroscopy: Optimization and Performance Evaluation. Rev. Sci. Instrum. 2010, 81, 103103. [Google Scholar] [CrossRef]
  58. Kerschhofer, A.; Breitegger, P.; Bergmann, A. Laser Driver and Analysis Circuitry Development for Quartz-Enhanced Photoacoustic Spectroscopy of NO2 for IoT Purpose. Proc. Eurosens. 2018, 2, 1062. [Google Scholar] [CrossRef]
  59. Yi, H.; Liu, K.; Chen, W.; Tan, T.; Wang, L.; Gao, X. Application of a Broadband Blue Laser Diode to Trace NO2 Detection Using Off-Beam Quartz-Enhanced Photoacoustic Spectroscopy. Opt. Lett. 2011, 36, 481. [Google Scholar] [CrossRef]
  60. Suzuki, H.; Miyao, Y.; Nakayama, T.; Pearce, J.K.; Matsumi, Y.; Takahashi, K.; Kita, K.; Tonokura, K. Comparison of Laser-Induced Fluorescence and Chemiluminescence Measurements of NO2 at an Urban Site. Atmos. Environ. 2011, 45, 6233–6240. [Google Scholar] [CrossRef]
  61. Thornton, J.A.; Wooldridge, P.J.; Cohen, R.C. Atmospheric NO2: In Situ Laser-Induced Fluorescence Detection at Parts per Trillion Mixing Ratios. Anal. Chem. 2000, 72, 528–539. [Google Scholar] [CrossRef]
  62. Thalman, R.; Baeza-Romero, M.T.; Ball, S.M.; Borras, E.; Daniels, M.J.S.; Goodall, I.C.A.; Henry, S.B.; Karl, T.; Keutsch, F.N.; Kim, S.; et al. Instrument Intercomparison of Glyoxal, Methyl Glyoxal and NO2 under Simulated Atmospheric Conditions. Atmos. Meas. Tech. 2015, 8, 1835–1862. [Google Scholar] [CrossRef]
  63. Horowitz, A.; Meller, R.; Moortgat, G.K. The UV–VIS Absorption Cross Sections of the α-Dicarbonyl Compounds: Pyruvic Acid, Biacetyl and Glyoxal. J. Photochem. Photobiol. A Chem. 2001, 146, 19–27. [Google Scholar] [CrossRef]
  64. Thalman, R.; Volkamer, R. Inherent Calibration of a Blue LED-CE-DOAS Instrument to Measure Iodine Oxide, Glyoxal, Methyl Glyoxal, Nitrogen Dioxide, Water Vapour and Aerosol Extinction in Open Cavity Mode. Atmos. Meas. Tech. 2010, 3, 1797–1814. [Google Scholar] [CrossRef]
  65. Volten, H.; Brinksma, E.J.; Berkhout, A.J.C.; Hains, J.; Bergwerff, J.B.; Van der Hoff, G.R.; Apituley, A.; Dirksen, R.J.; Calabretta-Jongen, S.; Swart, D.P.J. NO2 Lidar Profile Measurements for Satellite Interpretation and Validation. J. Geophys. Res. Atmos. 2009, 114, D24301. [Google Scholar] [CrossRef]
  66. Liu, Z.; Lin, B.; Campbell, J.F.; Yu, J.; Geng, J.; Jiang, S. Martian Column CO2 and Pressure Measurement with Spaceborne Differential Absorption Lidar at 1.96 µm. Atmos. Meas. Tech. 2024, 17, 2977–2990. [Google Scholar] [CrossRef]
  67. Flowerday, C.E.; Thalman, R.; Asplund, M.C.; Hansen, J.C. Broadband Cavity-Enhanced Absorption Spectroscopy (BBCEAS) Coupled with an Interferometer for On-Band and Off-Band Detection of Glyoxal. Toxics 2023, 12, 26. [Google Scholar] [CrossRef] [PubMed]
  68. Coquart, B.; Jenouvrier, A.; Merienne, M.E. The NO2 Absorption Spectrum. II. Absorption Cross-Sections at Low Temperatures in the 400–500 nm Region; Kluwer Academic Publishers: Dordrecht, The Netherlands, 1995. [Google Scholar]
  69. Meller, R.; Raber, W.; Crowley, J.N.; Jenkin, M.E.; Moortgat, G.K. The UV-Visible Absorption Spectrum of Methylglyoxal. J. Photochem. Photobiol. A Chem. 1991, 62, 163–171. [Google Scholar] [CrossRef]
  70. Brion, J.; Chakir, A.; Charbonnier, J.; Daumont, D.; Parisse, C.; Malicet, J. Absorption Spectra Measurements for the Ozone Molecule in the 350–830 nm Region. J. Atmos. Chem. 1998, 30, 291–299. [Google Scholar] [CrossRef]
  71. Gordon, I.E.; Rothman, L.S.; Hargreaves, E.R.; Hashemi, R.; Karlovets, E.V.; Skinner, F.M.; Conway, E.K.; Hill, C.; Kochanov, R.V.; Tan, Y.; et al. The HITRAN2020 Molecular Spectroscopic Database. J. Quant. Spectrosc. Radiat. Transf. 2022, 277, 107949. [Google Scholar] [CrossRef]
  72. Ashu-Ayem, E.R.; Nitschke, U.; Monahan, C.; Chen, J.; Darby, S.B.; Smith, P.D.; O’Dowd, C.D.; Stengel, D.B.; Venables, D.S. Coastal Iodine Emissions. 1. Release of I2 by Laminaria digitata in Chamber Experiments. Environ. Sci. Technol. 2012, 46, 10413–10421. [Google Scholar] [CrossRef]
  73. Lange, K.; Richter, A.; Bosch, T.; Zilker, B.; Latsch, M.; Behrens, L.K.; Okafor, C.M.; Bosch, H.; Burrows, J.P.; Merlaud, A.; et al. Validation of GEMS Tropospheric NO2 Columns and Their Diurnal Variation with Ground-Based DOAS Measurements. Atmos. Meas. Tech. 2024, 17, 6315–6344. [Google Scholar] [CrossRef]
  74. Edwards, D.P.; Martinez-Alonso, S.; Jo, D.S.; Ortega, I.; Emmons, L.K.; Orlando, J.J.; Worden, H.M.; Kim, J.; Lee, H.; Park, J.; et al. Quantifying the Diurnal Variation in Atmospheric NO2 from Geostationary Environment Monitoring Spectrometer (GEMS) Observations. Atmos. Chem. Phys. 2024, 24, 8943–8961. [Google Scholar] [CrossRef]
  75. Ravina, M.; Caramitti, G.; Panepinto, D.; Zanetti, M. Air Quality and Photochemical Reactions: Analysis of NOx and NO2 Concentrations in the Urban Area of Turin, Italy. Air Qual. Atmos. Health 2022, 15, 541–558. [Google Scholar] [CrossRef] [PubMed]
  76. Volkamer, R.; Molina, L.T.; Molina, M.J.; Shirley, T.; Brune, W.H. DOAS Measurement of Glyoxal as an Indicator for Fast VOC Chemistry in Urban Air. Geophys. Res. Lett. 2005, 32, L08806. [Google Scholar] [CrossRef]
  77. Ho, K.F.; Cao, J.J.; Lee, S.C.; Kawamura, K.; Zhang, R.J.; Chow, J.C.; Watson, J.G. Dicarboxylic Acids, Ketocarboxylic Acids, and Dicarbonyls in the Urban Atmosphere of China. J. Geophys. Res. Atmos. 2007, 112, D22S27. [Google Scholar] [CrossRef]
  78. Michoud, V.; Sauvage, S.; Leonardis, T.; Fronval, I.; Kukui, A.; Locoge, N.; Dusanter, S. Field Measurements of Methylglyoxal Using Proton Transfer Reaction Time-of-Flight Mass Spectrometry and Comparison to the DNPH–HPLC–UV Method. Atmos. Meas. Tech. 2018, 11, 5729–5740. [Google Scholar] [CrossRef]
  79. Mitsuishi, K.; Iwasaki, M.; Takeuchi, M.; Okochi, H.; Kato, S.; Ohira, S.; Toda, K. Diurnal Variations in Partitioning of Atmospheric Glyoxal and Methylglyoxal between Gas and Particles at the Ground Level and in the Free Troposphere. ACS Earth Space Chem. 2018, 2, 915–924. [Google Scholar] [CrossRef]
  80. Petrus, M.; Popa, C.; Bratu, A.-M. Determination of Ozone Concentration Levels in Urban Environments Using a Laser Spectroscopy System. Environments 2024, 11, 9. [Google Scholar] [CrossRef]
  81. Liu, W.; Zhang, J.; Kwon, J.; Weisel, C.; Turpin, B.; Zhang, L.; Korn, L.; Morandi, M.; Stock, T.; Colome, S. Concentrations and Source Characteristics of Airborne Carbonyl Compounds Measured Outside Urban Residences. J. Air Waste Manag. Assoc. 2006, 56, 1196–1204. [Google Scholar] [CrossRef]
  82. Garcia, A.R.; Volkamer, R.; Molina, L.T.; Molina, M.J.; Samuelson, J.; Mellqvist, J.; Galle, B.; Herndon, S.C.; Kolb, C.E. Separation of Emitted and Photochemical Formaldehyde in Mexico City Using a Statistical Analysis and a New Pair of Gas-Phase Tracers. Atmos. Chem. Phys. 2006, 6, 4545–4557. [Google Scholar] [CrossRef]
  83. García-Alonso, S.; Pérez-Pastor, R.; Sevillano-Castaño, M.L. Determination of Glyoxal and Methylglyoxal in Atmospheric Particulate Matter by 2,4-Dinitrophenylhydrazine Derivatisation. Toxicol. Environ. Chem. 2006, 88, 445–452. [Google Scholar] [CrossRef]
  84. Li, Q.; Gong, D.; Wang, H.; Wang, Y.; Han, S.; Wu, G.; Deng, S.; Yu, P.; Wang, W.; Wang, B. Rapid Increase in Atmospheric Glyoxal and Methylglyoxal Concentrations in Lhasa, Tibetan Plateau: Potential Sources and Implications. Sci. Total Environ. 2022, 824, 153782. [Google Scholar] [CrossRef]
  85. Thalman, R.; Volkamer, R. Temperature Dependent Absorption Cross-Sections of O2–O2 Collision Pairs between 340 and 630 nm and at Atmospherically Relevant Pressure. Phys. Chem. Chem. Phys. 2013, 15, 15371–15381. [Google Scholar] [CrossRef] [PubMed]
  86. Lv, L.; Liu, W.; Zhang, T.; Chen, Z.; Dong, Y.; Fan, G.; Xiang, Y.; Yao, Y.; Yang, N.; Chu, B.; et al. Observations of Particle Extinction, PM2.5 Mass Concentration Profile and Flux in North China Based on Mobile Lidar Technique. Atmos. Environ. 2017, 164, 360–369. [Google Scholar] [CrossRef]
  87. Papachristopoulou, K.; Raptis, I.-P.; Gkikas, A.; Fountoulakis, I.; Masoom, A.; Kazadzis, S. Aerosol Optical Depth Regime over Megacities of the World. Atmos. Chem. Phys. 2022, 22, 15703–15727. [Google Scholar] [CrossRef]
  88. Dingle, J.H.; Vu, K.; Bahreini, R.; Apel, E.C.; Campos, T.L.; Flocke, F.; Fried, A.; Herndon, S.; Hills, A.J.; Hornbrook, R.S.; et al. Aerosol Optical Extinction during the Front Range Air Pollution and Photochemistry Éxperiment (FRAPPÉ) 2014 Summertime Field Campaign, Colorado, USA. Atmos. Chem. Phys. 2016, 16, 11207–11217. [Google Scholar] [CrossRef]
  89. Lagrosas, N.; Kuze, H.; Takeuchi, N.; Fukagawa, S.; Bagtasa, G.; Yoshii, Y.; Naito, S.; Yabuki, M. Correlation Study between Suspended Particulate Matter and Portable Automated Lidar Data. J. Aerosol Sci. 2005, 36, 439–454. [Google Scholar] [CrossRef]
  90. Carslaw, D.; Beevers, S. Estimations of Road Vehicle Primary NO Exhaust Emission Fractions Using Monitoring Data in London. Atmos. Environ. 2005, 39, 167–177. [Google Scholar] [CrossRef]
  91. Wang, H.; Zhang, S.; Wu, X.; Wen, Y.; Li, Z.; Wu, Y. Emission Measurements on a Large Sample of Heavy-Duty Diesel Trucks in China by Using Mobile Plume Chasing. Environ. Sci. Technol. 2023, 57, 15153–15161. [Google Scholar] [CrossRef]
  92. Bishop, G.A.; Haugen, M.J.; McDonald, B.C.; Boies, A.M. Utah Wintertime Measurements of Heavy-Duty Vehicle Nitrogen Oxide Emission Factors. Environ. Sci. Technol. 2022, 56, 1885–1893. [Google Scholar] [CrossRef]
  93. Anderson, D.C.; Lindsay, A.; DeCarlo, P.F.; Wood, E.C. Urban Emissions of Nitrogen Oxides, Carbon Monoxide, and Methane Determined from Ground-Based Measurements in Philadelphia. Environ. Sci. Technol. 2021, 55, 4532–4541. [Google Scholar] [CrossRef]
  94. Chen, J.; Wang, D.N.; Ramachandran, A.; Chandran, S.; Li, M.; Varma, R. An Open-Path Dual-Beam Laser Spectrometer for Path-Integrated Urban NO2 Sensing. Sens. Actuators A 2020, 315, 112208. [Google Scholar] [CrossRef]
  95. Halpin, E.F.; Venables, D.S.; Hellebust, S. Effect of School Traffic on Nitrogen Dioxide Levels in a Narrow Street Canyon. 2025; Manuscript in preparation, Cork, Ireland. [Google Scholar]
  96. Tuzson, B.; Mangold, M.; Looser, H.; Manninen, A.; Emmenegger, L. Compact Multipass Optical Cell for Laser Spectroscopy. Opt. Lett. 2013, 38, 257–259. [Google Scholar] [CrossRef] [PubMed]
  97. Engel, G.S.; Moyer, E.J.; Keutsch, F.N.; Anderson, J.G. Innovations in Cavity Enhanced Laser Absorption Spectroscopy: Using In Situ Measurements to Probe the Mechanisms Driving Climate Change. In In Proceedings of the NASA Earth Science Technology Conference (ESTC 2003), College Park, MD, USA, 24–26 June 2003. [Google Scholar]
  98. Das, D.; Wilson, A.C. Very Long Optical Path-Length from a Compact Multi-Pass Cell. Appl. Phys. B 2011, 103, 749–754. [Google Scholar] [CrossRef]
Figure 1. The high-resolution intensity spectrum (IHR) after NO2 absorption was convolved with a Gaussian curve that was fitted to the narrow bandpass filter transmission band, producing the lower-resolution intensity spectrum (ILR). The intensity in the absence of absorption is given as I0. Spectra for glyoxal, methylglyoxal, ozone and the oxygen dimer were obtained using the same method (Figure S1).
Atmosphere 16 00599 g001
Figure 2. (a) Optical setup across a 2.65 m3 atmospheric simulation chamber with an optical pathlength of 8.0 m through the chamber. Transmitted light was measured by a spectrometer for DOAS analysis and by the two-channel detection system. (b) Optical and detector configuration of the two-channel system.
Atmosphere 16 00599 g002
Figure 3. Simulated change in ratio of 437.3 and 439.4 nm channels for different mixing ratios of absorbing gases over a pathlength of 1000 m. Urban mixing ratios of glyoxal (GLY) and methylglyoxal (MGLY) are typically sub-ppb (see text).
Atmosphere 16 00599 g003
Figure 4. Allan deviation of two PMTs and of their ratio in the 8 m system across the atmospheric simulation chamber.
Atmosphere 16 00599 g004
Figure 5. Normalised response of PMT1 and PMT2 to NO2 additions in the atmospheric simulation chamber with an 8 m pathlength. The PMT responses were normalised to the baseline period before the first addition of NO2.
Atmosphere 16 00599 g005
Figure 6. Calibrated ratiometric two-channel response (Savitsky–Golay filtered over 60 data points) compared with DOAS reference concentrations.
Atmosphere 16 00599 g006
Figure 7. Correlation plot of 1 min averaged concentrations measured by the ratiometric two-channel and DOAS reference instruments (R2 = 0.97, intercept = 1 ppm).
Atmosphere 16 00599 g007
Figure 8. A composite time series of measurements from 7 to 11 November 2024. The upper panel shows the measured intensity at 438 nm (normalised to the peak intensity) and the ratio of intensities in two wavelength bands (438.0 nm to 438.5 nm and 439.0 nm to 439.5 nm). The lower panel shows the corresponding precipitation and visibility recorded at the Cork Airport meteorological station.
Atmosphere 16 00599 g008
Table 1. Comparison of convolved absorption cross-sections, σ , of NO2 and other absorbing gases at 437.3 and 439.4 nm, the difference in absorption cross-section, Δ σ , and typical number densities in urban environments, Ntyp. The resulting difference in extinction coefficient, Δ ε = N t y p Δ σ , is calculated. For NO2, Ntyp corresponds to a mixing ratio of 4 ppb, near the lower limit in most urban atmospheres. The number density of water vapour is given for 80% relative humidity and 25 °C. Units for the absorption cross-section of O4 are cm5 molecule−2, and the square of the O2 number density is used to calculate Δ ε .
Compoundσ437.3nmσ439.4 nmΔσNtypΔε
cm2 molecule−1molecules cm−3cm−1
NO24.2 × 10−196.1 × 10−191.9 × 10⁻¹⁹>1011>2 × 10⁻⁸
Glyoxal1.0 × 10−191.6 × 10−190.5 × 10−193 × 10101.5 × 10−9
Methylglyoxal1.00 × 10−191.05 × 10−195 × 10−2110115 × 10−10
O37.7 × 10−239.7 × 10−232.0 × 10−2310122 × 10−11
O4 4.0 × 10−487.2 × 10−483.2 × 10−48(5 × 10¹⁸)28 × 10−11
H2O0.2 × 10−271.3 × 10−271.1 × 10−276 × 10177 × 10−10
Disclaimer/Publisher’s Note: The statements, opinions and data contained in all publications are solely those of the individual author(s) and contributor(s) and not of MDPI and/or the editor(s). MDPI and/or the editor(s) disclaim responsibility for any injury to people or property resulting from any ideas, methods, instructions or products referred to in the content.

