
How Does the Location of Power Plants Impact Air Quality in the Urban Area of Bucharest?

 ,
,  ,
,  , , ,
, , ,  , , , , , , and
Abstract
1. Introduction
1.1. Methodologies for Resolving Air Pollution in Urban Areas
1.2. Focus of the Study
2. Methodology
2.1. Observations
2.1.1. Observations at Fixed Locations
2.1.2. Mobile Observation
2.1.3. Satellite Observations and CAMS Europe Ensemble Dataset
2.2. Land Regression Model
3. Results and Discussion
3.1. Comparison Between Districts of Bucharest
3.2. Comparison of the Study Area with Reference Site
3.2.1. Near-Surface Measurements
3.2.2. Satellite Observations
3.2.3. CAMS European Air Quality Reanalyses
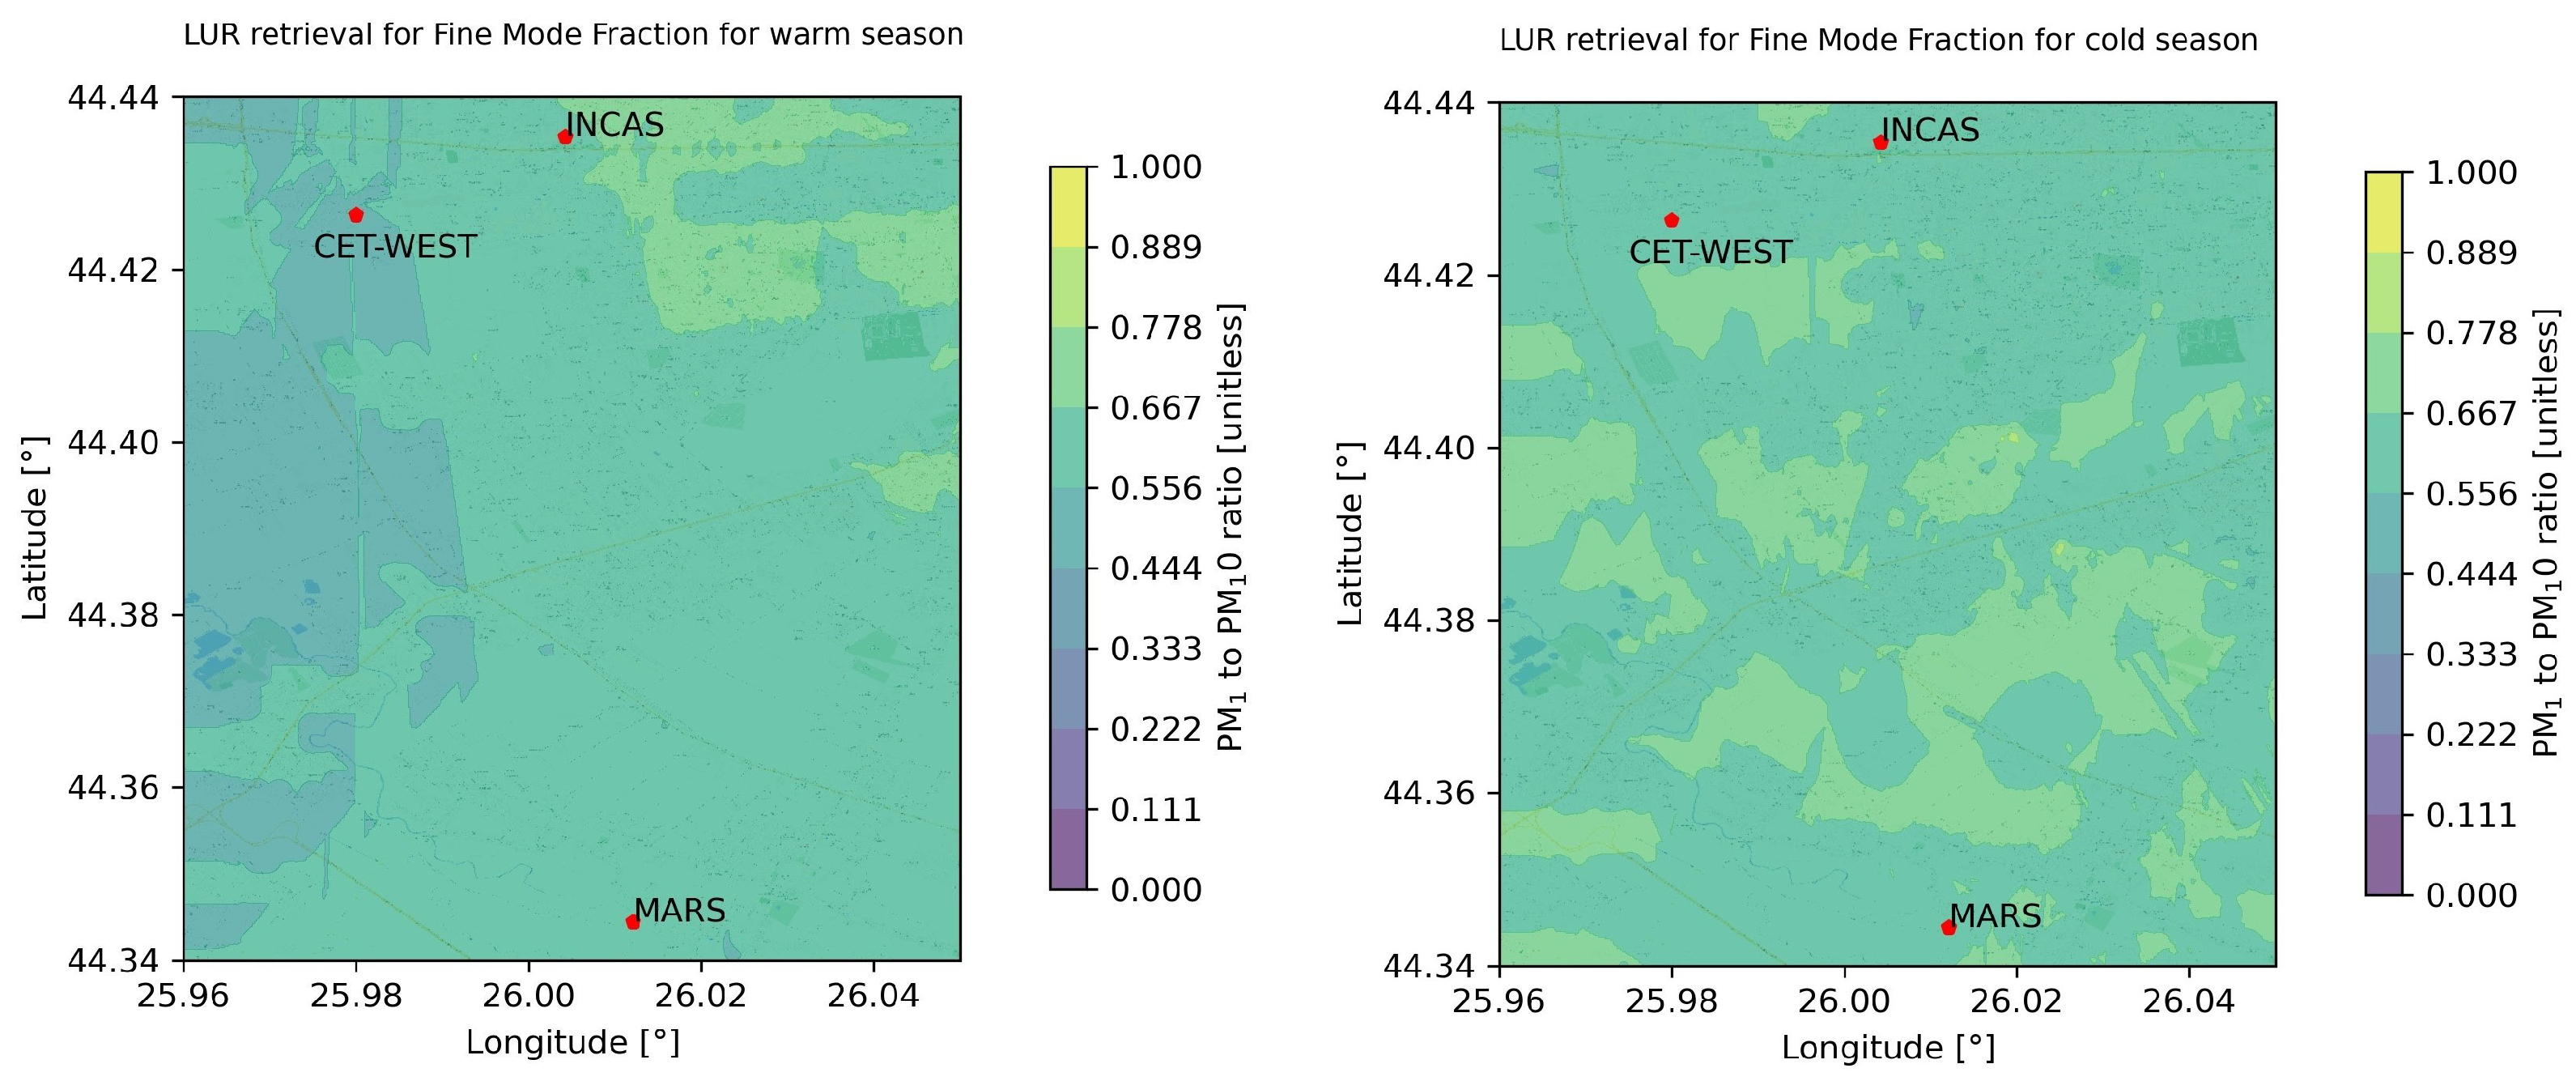
3.2.4. Fine Mapping of the Study Area
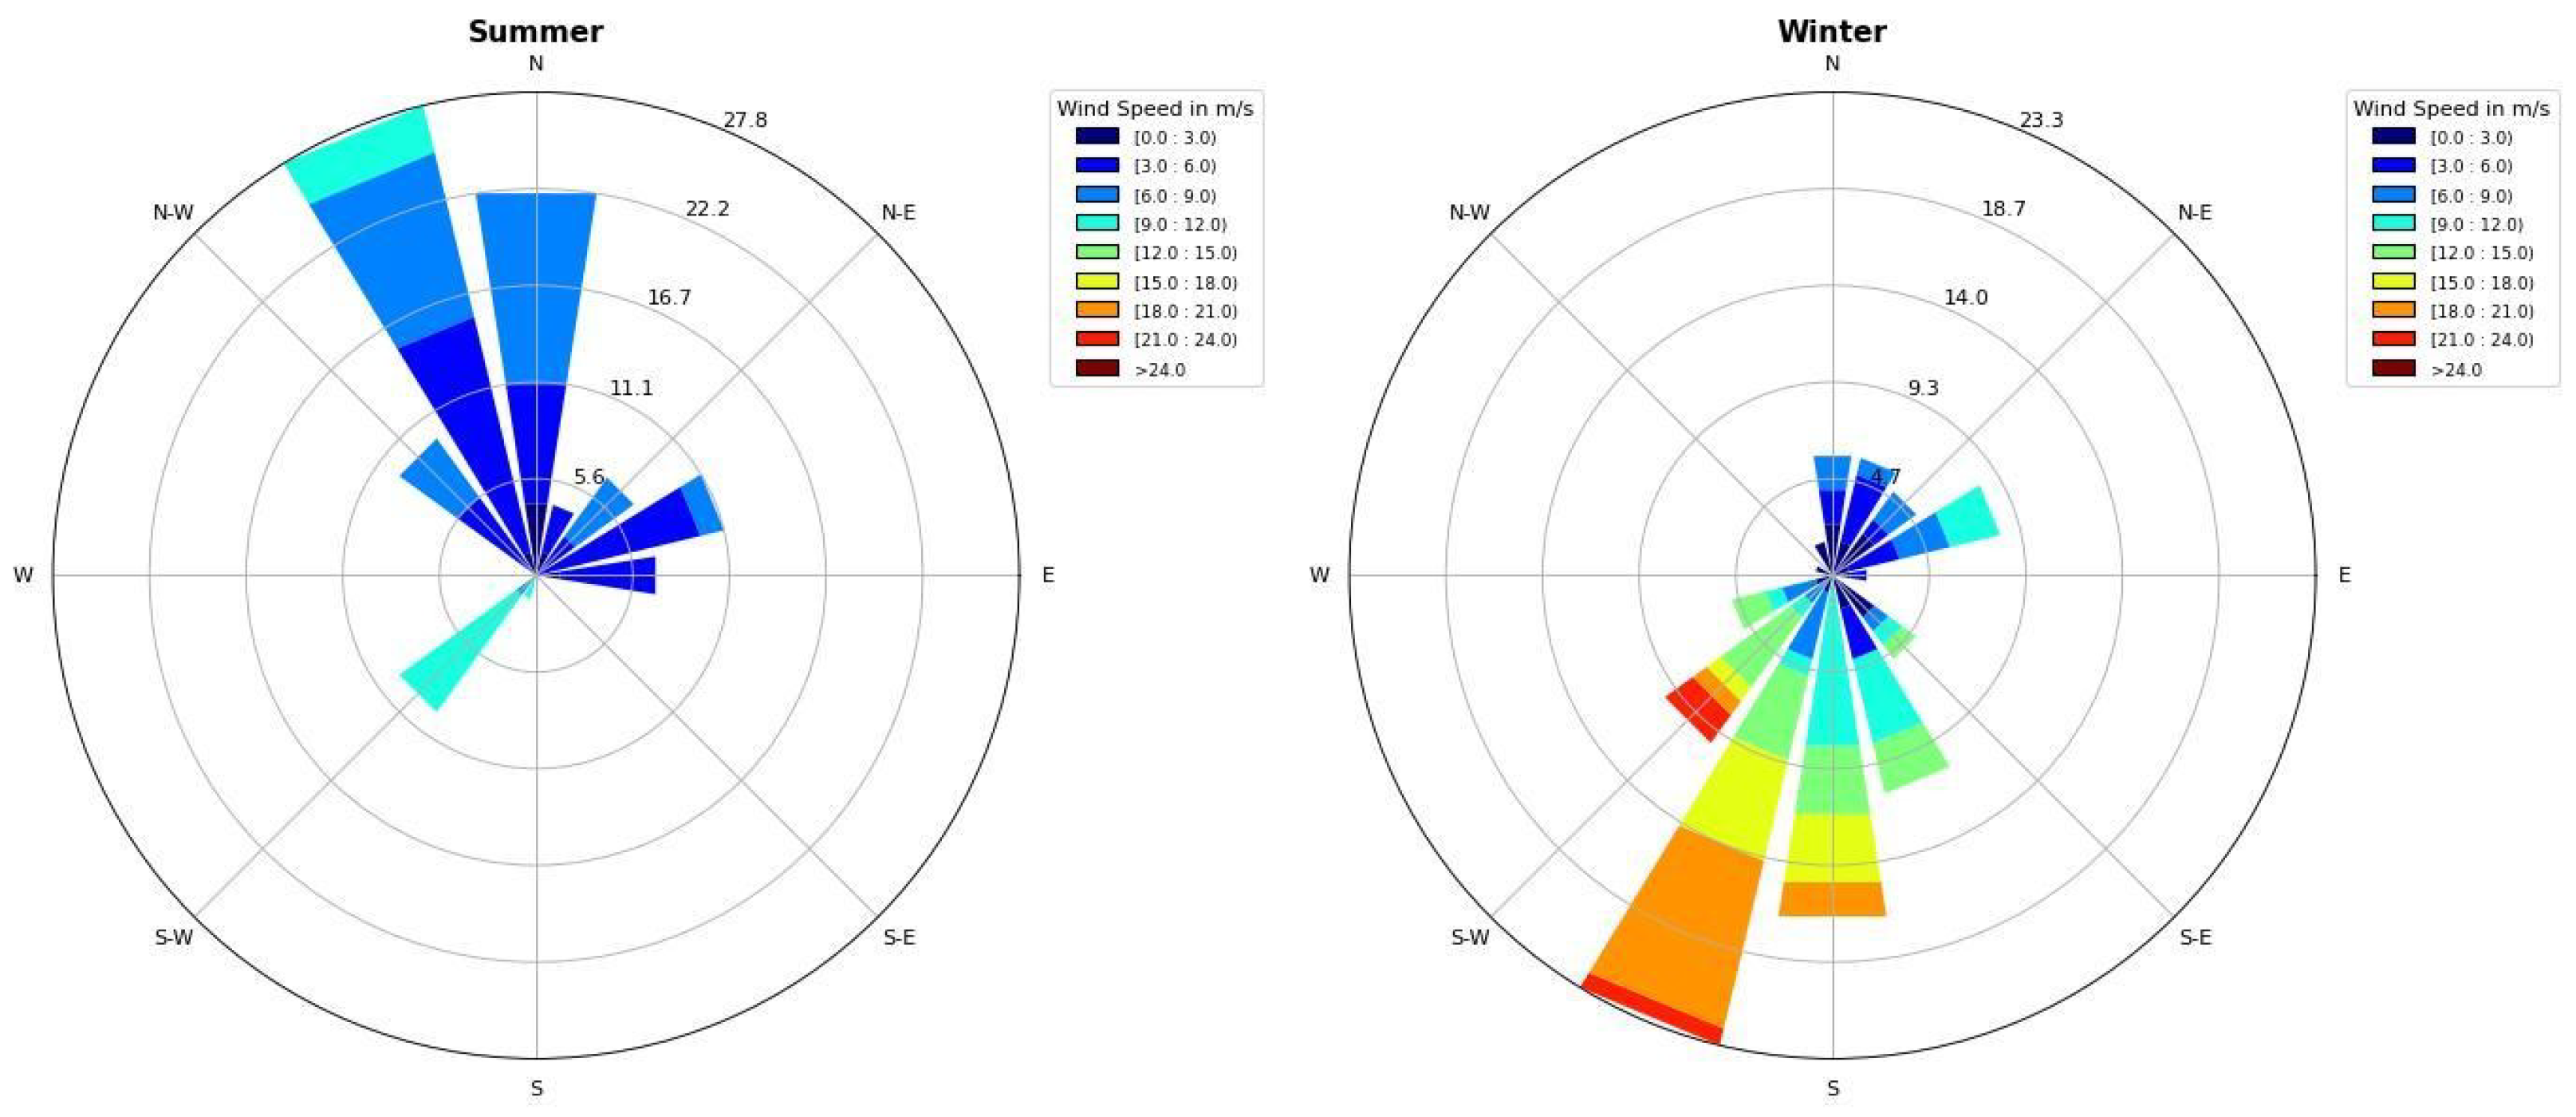
3.2.5. Typical Air Mass Circulations
3.3. Summary on the Comparative Analysis
4. Conclusions
Author Contributions
Funding
Institutional Review Board Statement
Informed Consent Statement
Data Availability Statement
Acknowledgments
Conflicts of Interest
References
- Quevauviller, P. A Review on Connecting Research, Policies and Networking in the Area of Climate-Related Extreme Events in the EU with Highlights of French Case Studies. Atmosphere 2022, 13, 117. [Google Scholar] [CrossRef]
- Nahorski, Z.; Holnicki, P.; Kałuszko, A. Towards Air Quality Protection in an Urban Area—Case Study. Atmosphere 2024, 15, 1106. [Google Scholar] [CrossRef]
- Hou, L.; Zhang, B. The Positive Effects of Linked Control Policy for Vessels Passing Through Locks on Air Quality—A Case Study of Yichang, China. Atmosphere 2025, 16, 368. [Google Scholar] [CrossRef]
- Alves Laucas e Myrrha, L.H.; Loukili, Y.F.C.; Silveira, G.d.O.; Tavella, R.A.; Bonifácio, A.d.S.; Brum, R.d.L.; Pereira, N.; da Silva Júnior, F.M.R. Health and Economic Benefits of Accelerating the PM10 Interim Targets in Brazil’s New Air Quality Resolution: A Case Study in Southern Brazil. Atmosphere 2025, 16, 270. [Google Scholar] [CrossRef]
- European Environment Agency (EEA). Health Impacts of Air Pollution in Europe. 2024. Available online: https://www.eea.europa.eu//publications/europes-air-quality-status-2024 (accessed on 23 April 2025).
- Shahrokhishahraki, N.; Rayner, P.; Silver, J.; Thomas, S.; Schofield, R. High-resolution modeling of gaseous air pollutants over Tehran and validation with surface and satellite data. Atmos. Environ. 2021, 270, 118881. [Google Scholar] [CrossRef]
- Wang, Y.; Ma, Y.F.; Muñoz-Esparza, D.; Dai, J.; Li, C.W.Y.; Lichtig, P.; Tsang, R.C.W.; Liu, C.H.; Wang, T.; Brasseur, G.P. Coupled mesoscale–microscale modeling of air quality in a polluted city using WRF-LES-Chem. Atmos. Chem. Phys. 2023, 23, 5905–5927. [Google Scholar] [CrossRef]
- Lin, C.; Wang, Y.; Ooka, R.; Flageul, C.; Kim, Y.; Kikumoto, H.; Wang, Z.; Sartelet, K. Modeling of street-scale pollutant dispersion by coupled simulation of chemical reaction, aerosol dynamics, and CFD. Atmos. Chem. Phys. 2023, 23, 1421–1436. [Google Scholar] [CrossRef]
- Jin, Y.; Sharifi, A. Machine learning for predicting urban greenhouse gas emissions: A systematic literature review. Renew. Sustain. Energy Rev. 2025, 215, 115625. [Google Scholar] [CrossRef]
- Douros, J.; Eskes, H.; van Geffen, J.; Boersma, K.; Compernolle, S.; Pinardi, G.; Blechschmidt, A.M.; Peuch, V.H.; Colette, A.; Veefkind, P. Comparing Sentinel-5P TROPOMI NO2 column observations with the CAMS regional air quality ensemble. Geosci. Model Dev. 2023, 16, 509–534. [Google Scholar] [CrossRef]
- Baldasano, J.; Pay, M.; Jorba, O.; Gassó, S.; Jimenez-Guerrero, P. An annual assessment of air quality with the CALIOPE modeling system over Spain. Sci. Total Environ. 2011, 409, 2163–2178. [Google Scholar] [CrossRef]
- Benavides, J. Development and Evaluation of a Street-Scale Air Quality Modelling System for the City of Barcelona. Ph.D. Thesis, Universitat Politècnica de Catalunya, Barcelona, Spain, 2020. [Google Scholar]
- Lugon, L.; Sartelet, K.; Kim, Y.; Vigneron, J.; Chretien, O. Simulation of primary and secondary particles in the streets of Paris using MUNICH. Faraday Discuss. 2020, 226, 432–456. [Google Scholar] [CrossRef] [PubMed]
- Sartelet, K.; Kim, Y.; Couvidat, F.; Merkel, M.; Petäjä, T.; Sciare, J.; Wiedensohler, A. Influence of emission size distribution and nucleation on number concentrations over Greater Paris. Atmos. Chem. Phys. 2022, 22, 8579–8596. [Google Scholar] [CrossRef]
- Tack, F.; Merlaud, A.; Iordache, M.D.; Pinardi, G.; Dimitropoulou, E.; Eskes, H.; Bomans, B.; Veefkind, P.; Van Roozendael, M. Assessment of the TROPOMI tropospheric NO2 product based on airborne APEX observations. Atmos. Meas. Tech. Discuss. 2020, 2020, 615–646. [Google Scholar] [CrossRef]
- Verhoelst, T.; Compernolle, S.; Pinardi, G.; Lambert, J.C.; Eskes, H.; Eichmann, K.U.; Fjaeraa, A.M.; Granville, J.; Niemeijer, S.; Cede, A.; et al. Ground-based validation of the Copernicus Sentinel-5P TROPOMI NO2 measurements with the NDACC ZSL-DOAS, MAX-DOAS and Pandonia global networks. Atmos. Meas. Tech. 2021, 14, 481–510. [Google Scholar] [CrossRef]
- Langen, J.; Meijer, Y.; Brinksma, E.; Veihelmann, B.; Ingmann, P. Copernicus Sentinels 4 and 5 Mission Requirements Traceability Document (MRTD), ESA; Technical Report, EO-SMA-/1507/JL; ESA: Paris, France, 2017; Available online: https://sentinel.esa.int/documents/247904/2506504/Copernicus-Sentinels-4-and-5-Mission-Requirements-Traceability-Document.pdf (accessed on 21 April 2024).
- Buonocore, J.; Dong, X.; Spengler, J.; Fu, J.; Levy, J. Using the Community Multiscale Air Quality (CMAQ) model to estimate public health impacts of PM2.5 from individual power plants. Environ. Int. 2014, 68C, 200–208. [Google Scholar] [CrossRef]
- Cichowicz, R.; Dobrzański, M. Modeling Pollutant Emissions: Influence of Two Heat and Power Plants on Urban Air Quality. Energies 2021, 14, 5218. [Google Scholar] [CrossRef]
- Gao, M.; Beig, G.; Song, S.; Zhang, H.; Hu, J.; Ying, Q.; Liang, F.; Liu, Y.; Wang, H.; Lu, X.; et al. The impact of power generation emissions on ambient PM2.5 pollution and human health in China and India. Environ. Int. 2018, 121, 250–259. [Google Scholar] [CrossRef]
- Kerckhoffs, J.; Khan, J.; Hoek, G.; Yuan, Z.; Ellermann, T.; Hertel, O.; Ketzel, M.; Jensen, S.; Meliefste, K.; Vermeulen, R. Mixed-Effects Modeling Framework for Amsterdam and Copenhagen for Outdoor NO2 Concentrations Using Measurements Sampled with Google Street View Cars. Environ. Sci. Technol. 2022, 56, 7174–7184. [Google Scholar] [CrossRef] [PubMed]
- Menut, L.; Bessagnet, B.; Briant, R.; Cholakian, A.; Couvidat, F.; Mailler, S.; Pennel, R.; Siour, G.; Tuccella, P.; Turquety, S.; et al. The CHIMERE v2020r1 online chemistry-transport model. Geosci. Model Dev. 2021, 14, 6781–6811. [Google Scholar] [CrossRef]
- Raducan, G.; Stefan, S. Characterization of traffic-generated pollutants in Bucharest. Atmósfera 2009, 22, 99–110. [Google Scholar]
- Kim, Y.; Lugon, L.; Maison, A.; Sarica, T.; Roustan, Y.; Valari, M.; Zhang, Y.; Andre, M.; Sartelet, K. MUNICH v2.0: A street-network model coupled with SSH-aerosol (v1.2) for multi-pollutant modelling. Geosci. Model Dev. 2022, 15, 7371–7396. [Google Scholar] [CrossRef]
- Mölter, A.; Lindley, S. Developing land use regression models for environmental science research using the XLUR tool–More than a one-trick pony. Environ. Model. Softw. 2021, 143, 105108. [Google Scholar] [CrossRef]
- Chen, L.; Shi, L. Differences in urban–rural gradient and driving factors of PM2.5 concentration in the Zhengzhou Metropolitan Area. Air Qual. Atmos. Health 2024, 17, 2187–2201. [Google Scholar] [CrossRef]
- Wan, Y.; Yuan, L.; Xu, X. Adopting urban morphological indicators to land use regression modeling of seasonal mean PM2.5 concentrations for a high-density city. Air Qual. Atmos. Health 2022, 15, 559–573. [Google Scholar] [CrossRef]
- Hoek, G. Methods for Assessing Long-Term Exposures to Outdoor Air Pollutants. Curr. Environ. Health Rep. 2017, 4, 450–462. [Google Scholar] [CrossRef] [PubMed]
- Lugon, L.; Vigneron, J.; Debert, C.; Chrétien, O.; Sartelet, K. Black carbon modeling in urban areas: Investigating the influence of resuspension and non-exhaust emissions in streets using the Street-in-Grid model for inert particles (SinG-inert). Geosci. Model Dev. 2021, 14, 7001–7019. [Google Scholar] [CrossRef]
- National Institute of Statistics (INSSE). Populatia. Available online: https://bucuresti.insse.ro/ (accessed on 11 June 2024).
- Ilie, A.; Vasilescu, J.; Talianu, C.; Ioja, C.; Nemuc, A. Spatiotemporal Variability of Urban Air Pollution in Bucharest City. Atmosphere 2023, 14, 1759. [Google Scholar] [CrossRef]
- Tomtom. Traffic Index Ranking. Available online: https://www.tomtom.com/traffic-index/ranking/ (accessed on 11 June 2024).
- National Institute of Statistics (INSSE). Inmatriculari. Available online: https://insse.ro/cms/ro/tags/comunicat-inmatriculari-noi-de-vehicule-rutiere (accessed on 11 June 2024).
- National Air Quality Monitoring Network (NAQMN). SEVESO. Available online: https://www.anpm.ro/ro/managementul-riscului-seveso (accessed on 8 February 2024).
- Primaria Bucuresti. Proiecte in Executie. Available online: https://www.pmb.ro/interes-public/menu-page (accessed on 19 June 2024).
- Santiere Online. Proiecte. Available online: https://www.santiereonline.ro/app/projects (accessed on 19 June 2024).
- Guevara, M. Emissions of Primary Particulate Matter; The Royal Society of Chemistry: Cambridge, UK, 2016; Volume 2016, pp. 1–34. [Google Scholar] [CrossRef]
- Tomlin, A.S. Air quality and climate impacts of biomass use as an energy source: A review. Energy Fuels 2021, 35, 14213–14240. [Google Scholar] [CrossRef]
- Ministry of Regional Development and Public Administration; Ministry of Energy. Report on the Assessment of the National Potential to Implement High-Efficiency Cogeneration and Efficient District Heating and Cooling; Technical Report; Ministry of Regional Development and Public Administration; Ministry of Energy: 2015. Available online: https://energy.ec.europa.eu/system/files/2016-07/RO%25202016%2520Energy%2520Efficiency%2520Annual%2520Report_en_0.pdf (accessed on 21 April 2024).
- ELCEN. Electrocentrale Bucureşti. Available online: https://www.elcen.ro/ (accessed on 8 February 2024).
- ECMWF. Copernicus Atmosphere Monitoring Service, ENSEMBLE Dataset. 2021. Available online: https://ads.atmosphere.copernicus.eu/doi/10.24381/7cc0465a (accessed on 10 June 2024).
- European Standard CEN EN 12341; Ambient Air—Standard Gravimetric Measurement Method for the Determination of the PM10 or PM2.5 Mass Concentration of Suspended Particulate Matter. Available online: https://standards.iteh.ai/catalog/standards/sist/4794d8f6-b5b1-43b7-9e95-7a7f2410b5ca/sist-en-12341-2023 (accessed on 10 June 2024).
- European Standard CEN EN 17660; Air Quality—Performance Evaluation of Air Quality Sensor Systems. Available online: https://standards.iteh.ai/catalog/standards/sist/45202731-4088-40a1-b2d4-12b9542fb1a4/sist-ts-cen-ts-17660-2-2025 (accessed on 10 June 2024).
- Chacon Mateos, M.; Laquai, B.; Vogt, U.; Stubenrauch, C. Evaluation of a low-cost dryer for a low-cost optical particle counter. Atmos. Meas. Tech. 2022, 15, 7395–7410. [Google Scholar] [CrossRef]
- Sartelet, K.; Kerckhoffs, J.; Athanasopoulou, E.; Lugon, L.; Vasilescu, J.; Zhong, J.; Hoek, G.; Joly, C.; Park, S.J.; Talianu, C.; et al. Air pollution mapping and variability over five European cities. Environ. Int. 2025, 199, 109474. [Google Scholar] [CrossRef]
- Talianu, C.; Vasilescu, J.; Nicolae, D.; Ilie, A.; Dandocsi, A.; Nemuc, A.; Belegante, L. High-resolution air quality maps for Bucharest using Mixed-Effects Modeling Framework. Atmos. Chem. Phys. 2025, 2025, 4639–4654. [Google Scholar] [CrossRef]
- ECOMESURE. EcomTrek technical specifications, 2024. Available online: https://ecomesure.com/PDF/fiches-produits/ECOMTREK-VEN.pdf (accessed on 10 June 2024).
- ESA. TROPOMI Level 2 Nitrogen Dioxide; European Space Agency: Paris, France, 2021. [Google Scholar] [CrossRef]
- ESA. TROPOMI Level 2 Carbon Monoxide Total Column; European Space Agency: Paris, France, 2021. [Google Scholar] [CrossRef]
- Tayebi, S.; Kerckhoffs, J.; Khan, J.; de Hoogh, K.; Chen, J.; Taghavi-Shahri, S.M.; Bergmann, M.L.; Cole-Hunter, T.; Lim, Y.H.; Mortensen, L.H.; et al. Comparison of NO2 and BC Predictions Estimated Using Google Street View-Based and Conventional European-Wide LUR Models in Copenhagen, Denmark. Atmosphere 2023, 14, 1602. [Google Scholar] [CrossRef]
- UNIVERSITEIT UTRECHT. European Study of Cohorts for Air Pollution Effects. Available online: https://cordis.europa.eu/project/id/211250 (accessed on 19 June 2024).
- National Air Quality Monitoring Network (NAQMN). Calitatea Aerului. Available online: https://www.calitateaer.ro/public/home-page/?__locale=ro (accessed on 8 February 2024).
- Lu, J.; Zhang, Y.; Chen, M.; Wang, L.; Zhao, S.; Pu, X.; Chen, X. Estimation of monthly 1 km resolution PM2.5 concentrations using a random forest model over “2 + 26” cities, China. Urban Clim. 2021, 35, 100734. [Google Scholar] [CrossRef]
- OpenStreetMap. OpenStreetMap Database [PostgreSQL via API]; OpenStreetMap Foundation: Cambridge, UK, 2021; Available online: https://www.openstreetmap.org (accessed on 19 June 2024).
- European Environment Agency (EEA). Health Impacts of Air Pollution in Europe. 2022. Available online: https://www.eea.europa.eu/publications/air-quality-in-europe-2022/health-impacts-of-air-pollution (accessed on 19 April 2024).
- Romanian National Meteorological Agency (RNMA). Caracterizări Climatologice Multianuale. Available online: https://www.meteoromania.ro/clim/caracterizare-multianuala/index.html (accessed on 19 June 2024).
- Pirloaga, R.; Adam, M.; Antonescu, B.; Andrei, S.; Stefan, S. Ground-Based Measurements of Wind and Turbulence at Bucharest–Măgurele: First Results. Remote Sens. 2023, 15, 1514. [Google Scholar] [CrossRef]
- Seinfeld, J.H.; Pandis, S.N. Atmospheric Chemistry and Physics: From Air Pollution to Climate Change; John Wiley & Sons: Hoboken, NJ, USA, 2016; ISBN 978-1-118-94740-1. [Google Scholar]


| Parameter/Pollutant | Cold Season | Warm Season | ||
|---|---|---|---|---|
| RMSE [μg/m3] | RMSE [μg/m3] | |||
| 0.87 | 7.41 | 0.75 | 6.07 | |
| NO2 | 0.65 | 4.99 | 0.86 | 3.61 |
| Region | District | #Points | PM1 [] | PM2.5 [] | PM10 [] | NO2 [] |
|---|---|---|---|---|---|---|
| Warm season | ||||||
| #Total | 289 | 12.51 ± 3.63 | 13.68 ± 4.18 | 20.66 ± 9.05 | 36.79 ± 20.52 | |
| South | Ferentari | 8 | 19.42 ± 1.62 | 20.69 ± 1.75 | 30.71 ± 3.14 | 30.26 ± 5.24 |
| Magurele | 32 | 16.54 ± 5.05 | 18.23 ± 5.43 | 29.04 ± 9.68 | 22.82 ± 5.45 | |
| Jilava | 16 | 11.62 ± 1.36 | 12.79 ± 1.58 | 21.31 ± 3.93 | 45.90 ± 28.74 | |
| Progresul | 15 | 12.15 ± 3.78 | 13.77 ± 4.81 | 21.99 ± 10.66 | 26.30 ± 17.72 | |
| Giurgiului | 5 | 9.82 ± 0.96 | 10.83 ± 0.99 | 15.02 ± 1.58 | 50.34 ± 8.93 | |
| Centre | Tineretului | 7 | 10.41 ± 0.91 | 11.14 ± 0.89 | 15.35 ± 1.09 | 56.71 ± 16.45 |
| Unirii | 8 | 10.16 ± 0.57 | 10.96 ± 0.61 | 14.38 ± 1.07 | 61.60 ± 5.90 | |
| Evreiesc | 14 | 8.83 ± 0.79 | 9.47 ± 0.81 | 13.07 ± 1.41 | 28.42 ± 17.84 | |
| East | Titan | 9 | 11.58 ± 1.59 | 12.85 ± 2.05 | 19.06 ± 4.37 | 52.94 ± 9.36 |
| Pantelimon | 8 | 11.17 ± 1.19 | 11.95 ± 1.19 | 16.04 ± 1.87 | 50.47 ± 15.07 | |
| Industriilor | 34 | 10.87 ± 1.96 | 11.86 ± 2.21 | 17.13 ± 4.87 | 22.35 ± 20.26 | |
| North | Aviatorilor | 7 | 11.06 ± 0.93 | 11.81 ± 0.88 | 15.62 ± 0.87 | 66.45 ± 9.43 |
| Herastrau | 25 | 9.92 ± 1.39 | 10.83 ± 1.54 | 15.48 ± 2.53 | 25.68 ± 20.22 | |
| Floreasca | 8 | 9.54 ± 0.93 | 10.23 ± 1.01 | 14.29 ± 1.80 | 38.65 ± 10.94 | |
| Gara de Nord | 7 | 12.29 ± 1.66 | 13.27 ± 1.87 | 18.56 ± 3.34 | 3064 ± 7.89 | |
| Tei-Obor | 9 | 11.13 ± 0.86 | 12.02 ± 0.95 | 16.37 ± 1.84 | 68.13 ± 9.55 | |
| West | Rahova | 8 | 16.87 ± 1.69 | 17.90 ± 1.78 | 24.65 ± 2.79 | 57.84 ± 21.60 |
| Grozavesti | 8 | 11.99 ± 0.94 | 12.77 ± 1.09 | 17.83 ± 1.78 | 56.08 ± 16.24 | |
| Militari | 24 | 12.27 ± 1.58 | 13.38 ± 1.79 | 20.41 ± 4.03 | 34.19 ± 22.80 | |
| Dr. Taberei | 16 | 14.04 ± 1.38 | 15.07 ± 1.46 | 21.29 ± 2.70 | 45.70 ± 6.76 | |
| CET WEST | 21 | 16.01 ± 4.04 | 18.27 ± 5.89 | 33.49 ± 18.35 | 30.64 ± 15.58 | |
| Cold season | ||||||
| #Total | 289 | 53.67 ± 18.76 | 54.69 ± 18.97 | 66.95 ± 23.42 | 5.35 ± 5.33 | |
| South | Ferentari | 8 | 93.75 ± 13.54 | 94.69 ± 13.49 | 109.28 ± 13.49 | 8.02 ± 3.49 |
| Magurele | 32 | 55.63 ± 20.18 | 56.92 ± 20.73 | 70.36 ± 27.54 | 1.07 ± 1.35 | |
| Jilava | 16 | 41.42 ± 2.19 | 42.37 ± 2.56 | 52.44 ± 5.78 | 3.51 ± 3.15 | |
| Progresul | 15 | 44.39 ± 6.62 | 46.22 ± 7.59 | 63.37 ± 16.51 | 4.00 ± 6.61 | |
| Giurgiului | 5 | 34.18 ± 3.63 | 34.62 ± 3.52 | 41.10 ± 4.60 | 4.39 ± 0.97 | |
| Centre | Tineretului | 7 | 37.31 ± 4.74 | 38.03 ± 4.94 | 45.77 ± 7.58 | 4.15 ± 1.88 |
| Unirii | 8 | 37.56 ± 2.13 | 38.06 ± 2.22 | 44.72 ± 3.06 | 6.05 ± 3.66 | |
| Evreiesc | 14 | 39.32 ± 2.88 | 40.09 ± 2.99 | 48.56 ± 5.19 | 2.29 ± 2.38 | |
| East | Titan | 9 | 40.87 ± 3.13 | 41.78 ± 3.27 | 51.36 ± 4.88 | 5.82 ± 3.19 |
| Pantelimon | 8 | 41.49 ± 7.45 | 42.69 ± 7.74 | 53.55 ± 11.17 | 3.85 ± 3.51 | |
| Industriilor | 34 | 40.99 ± 3.19 | 41.90 ± 3.35 | 51.40 ± 6.22 | 2.46 ± 3.19 | |
| North | Aviatorilor | 7 | 54.13 ± 11.11 | 54.69 ± 10.93 | 64.83 ± 11.48 | 10.18 ± 2.59 |
| Herastrau | 25 | 46.95 ± 11.37 | 47.76 ± 11.39 | 58.09 ± 14.82 | 4.32 ± 5.75 | |
| Floreasca | 8 | 41.10 ± 4.57 | 41.77 ± 4.74 | 51.03 ± 7.63 | 3.42 ± 2.68 | |
| Gara de Nord | 6 | 57.20 ± 6.74 | 58.30 ± 7.13 | 74.16 ± 10.85 | 4.90 ± 1.31 | |
| Tei-Obor | 9 | 44.11 ± 3.57 | 45.62 ± 4.18 | 60.10 ± 10.29 | 7.33 ± 2.65 | |
| West | Rahova | 8 | 74.20 ± 11.49 | 74.94 ± 11.64 | 88.00 ± 16.35 | 8.85 ± 2.10 |
| Grozavesti | 9 | 57.86 ± 7.43 | 59.01 ± 7.74 | 74.73 ± 11.44 | 10.34 ± 6.31 | |
| Militari | 24 | 67.61 ± 12.51 | 68.43 ± 12.83 | 80.59 ± 16.03 | 7.95 ± 7.74 | |
| Dr. Taberei | 16 | 79.17 ± 13.32 | 80.12 ± 13.39 | 94.97 ± 16.10 | 10.64 ± 3.89 | |
| CET WEST | 21 | 82.65 ± 11.22 | 84.26 ± 11.70 | 105.63 ± 17.68 | 10.54 ± 6.63 | |
| Location | [μg/m3] | [μg/m3] | [μg/m3] |
|---|---|---|---|
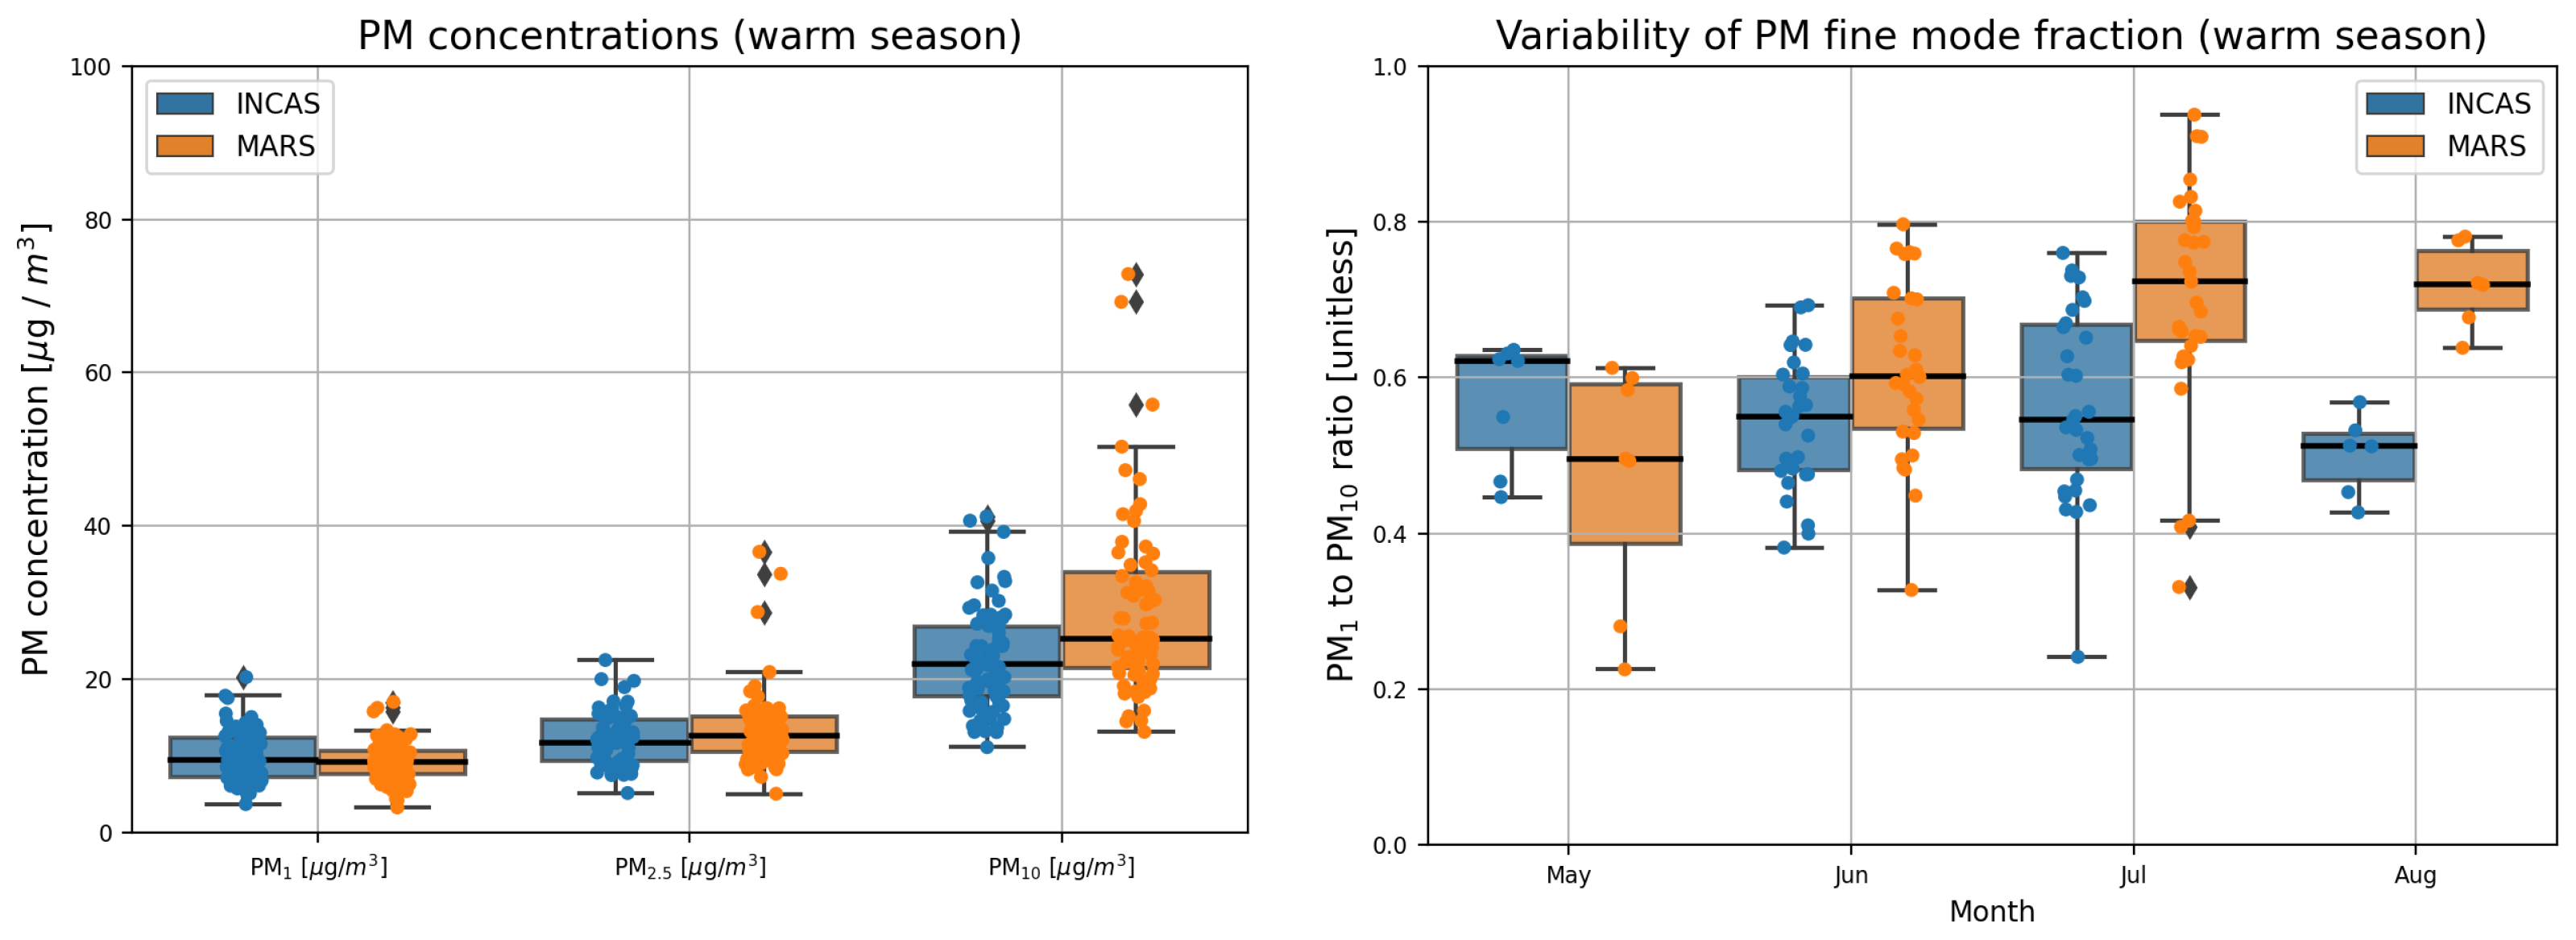
| INCAS | 10.03 ± 3.29 | 12.14 ± 3.43 | 22.66 ± 6.71 |
| MARS | 9.32 ± 2.62 | 13.44 ± 5.06 | 31.00 ± 18.66 |
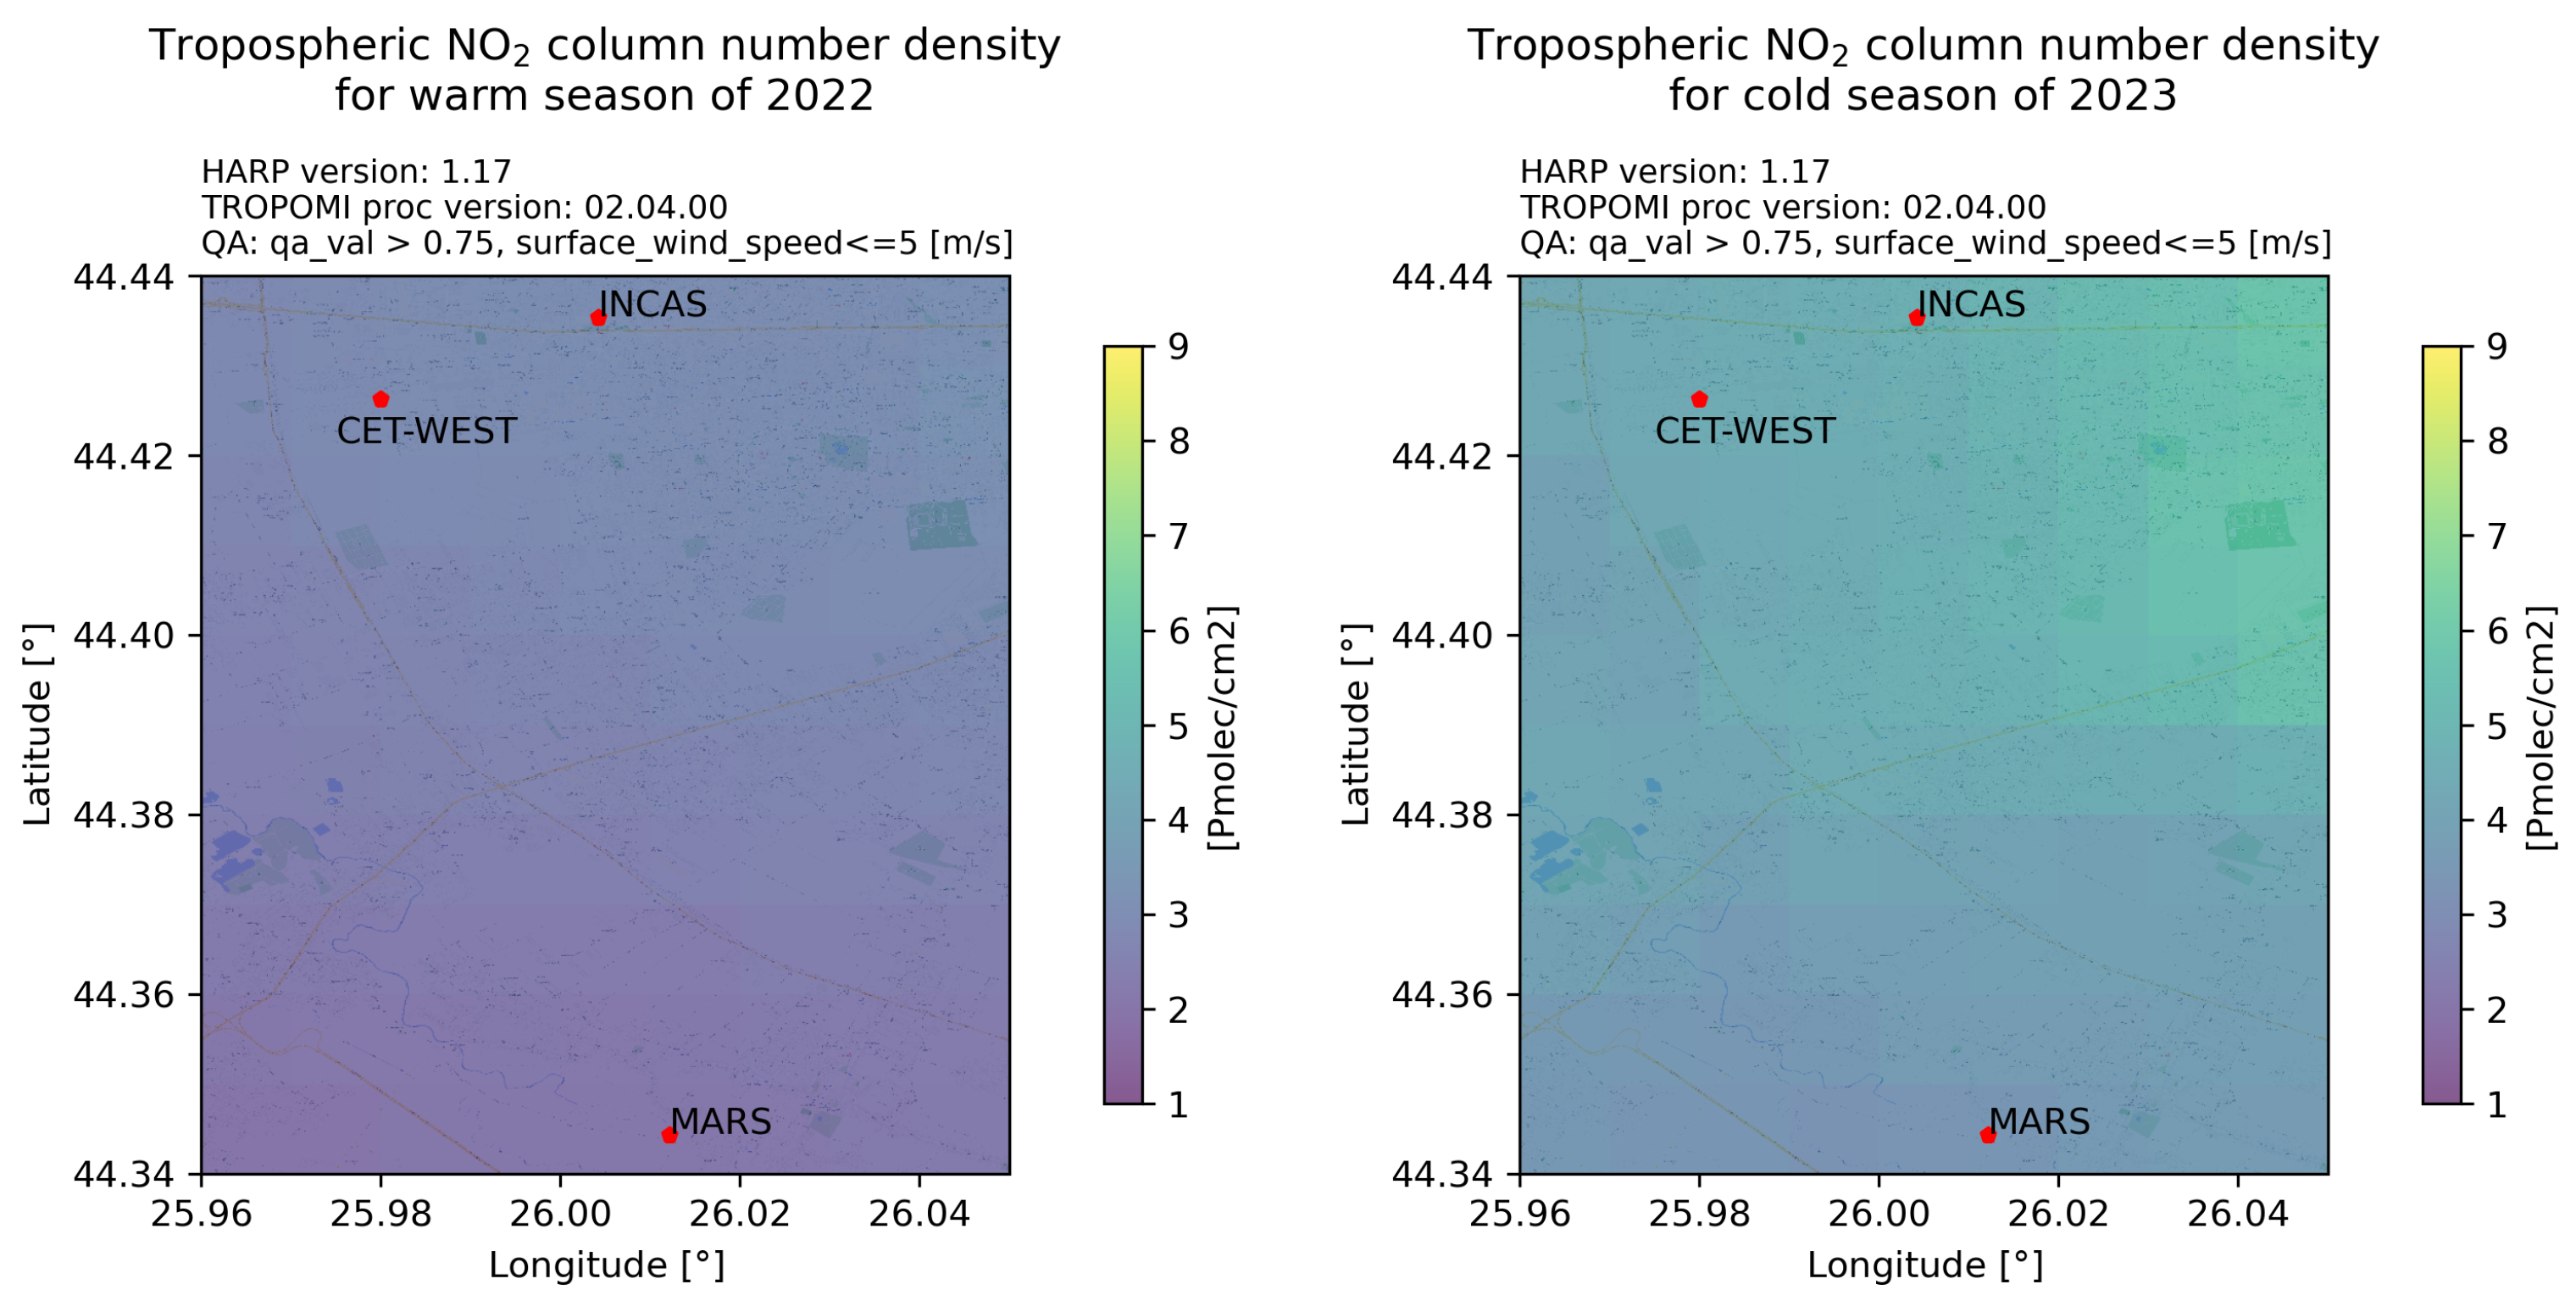
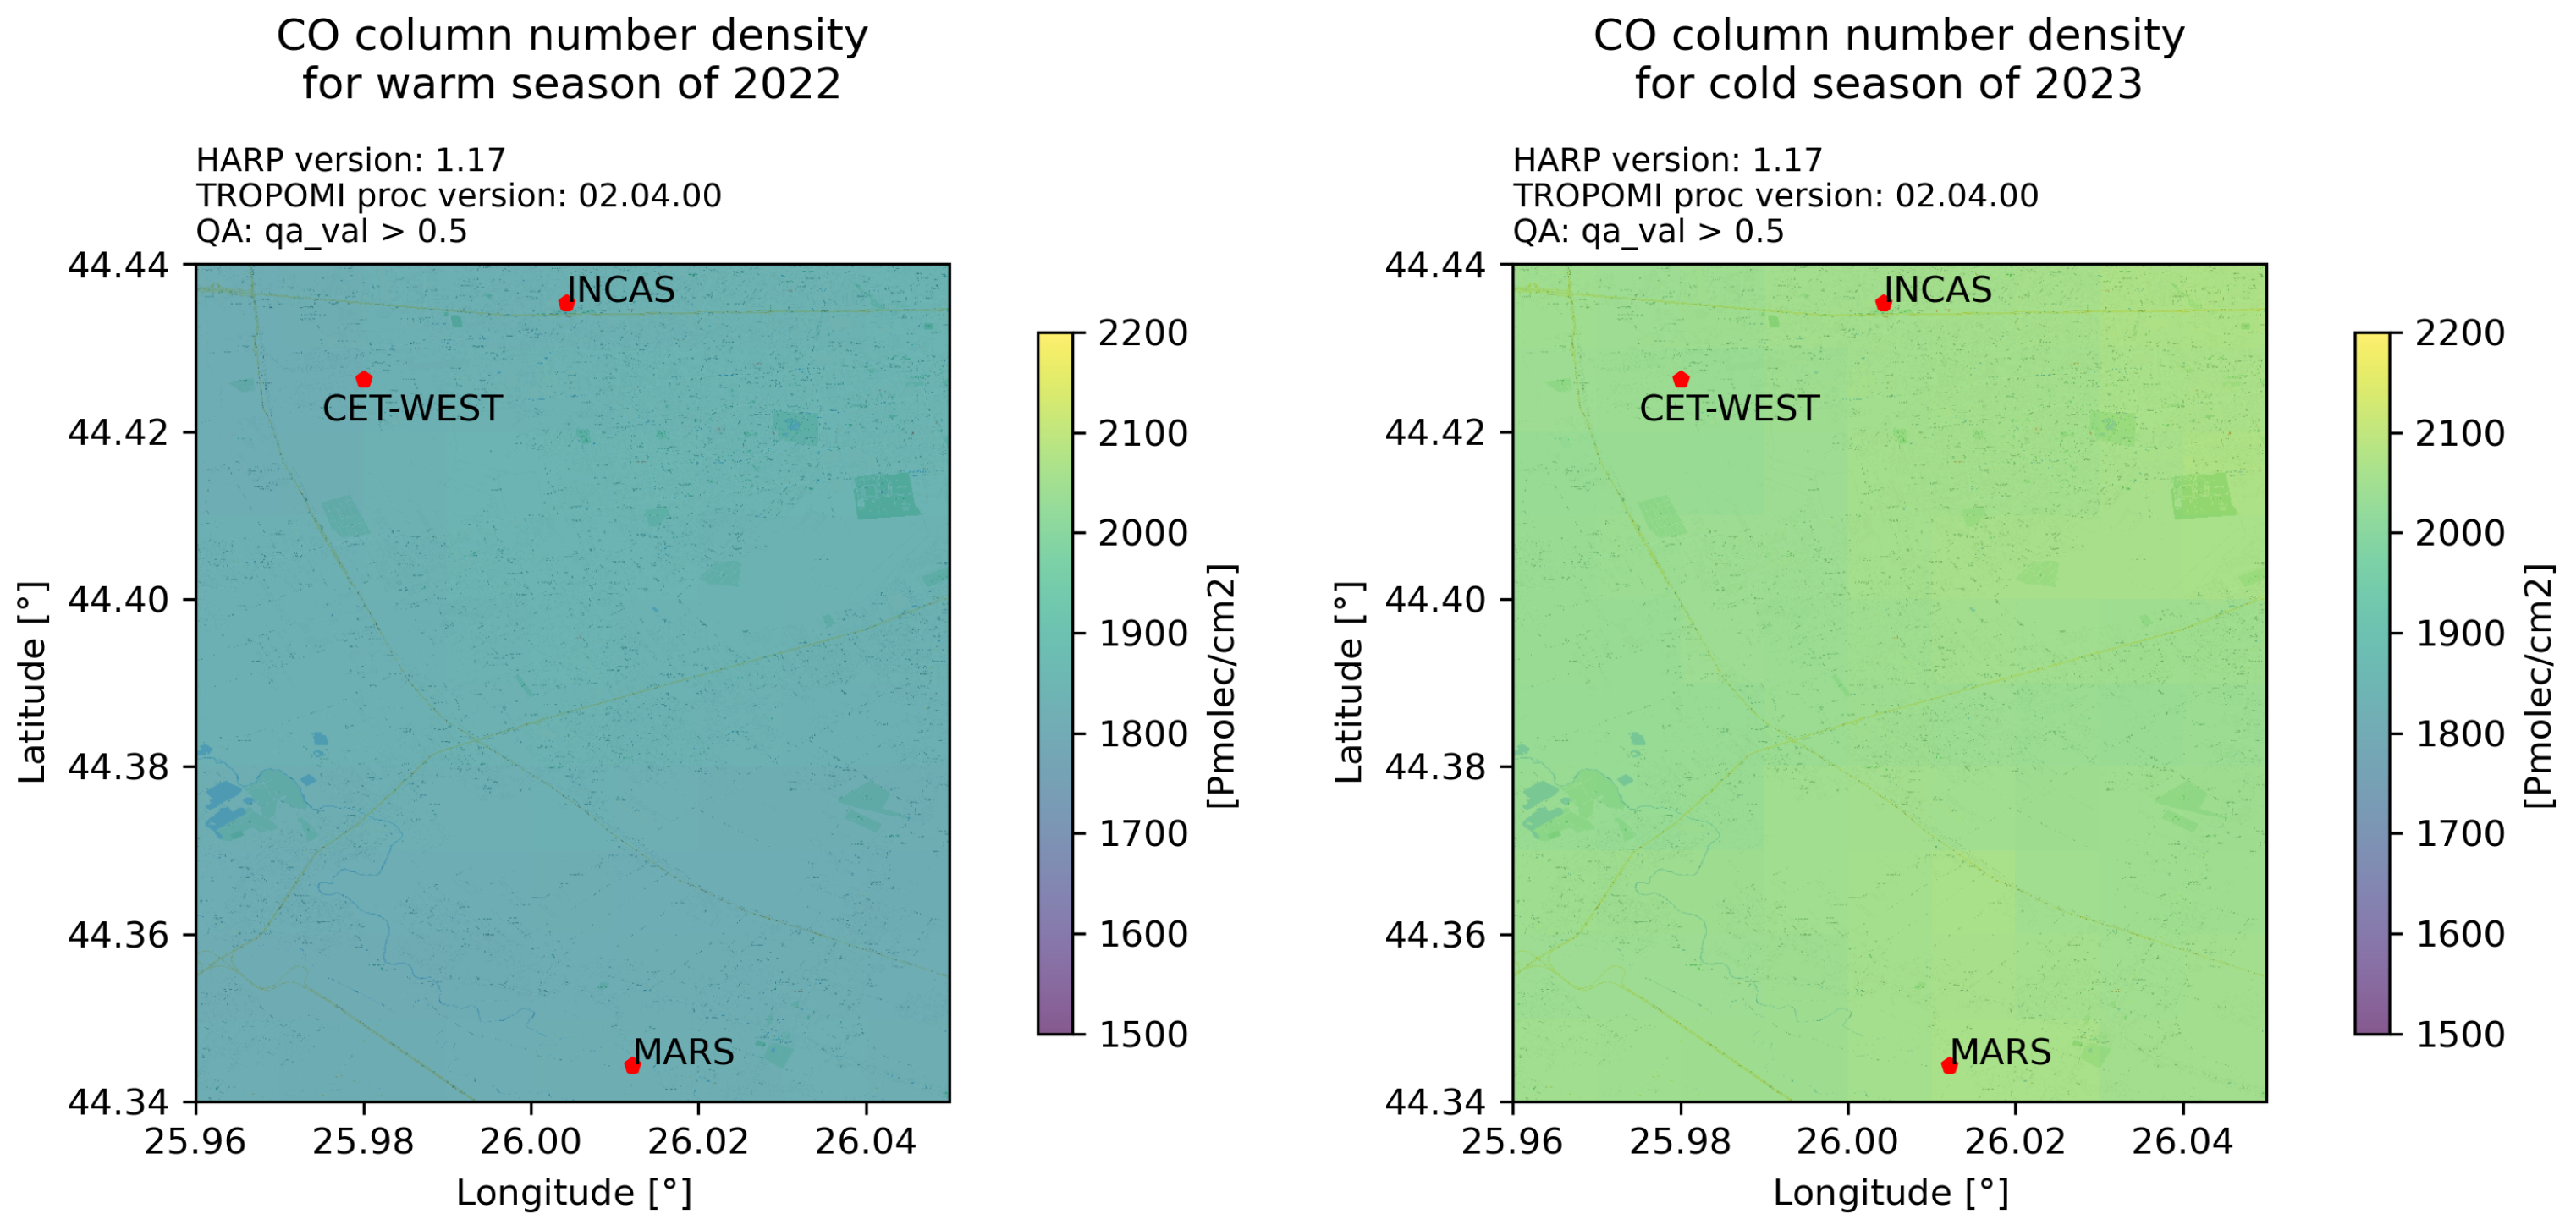
| Location | Tropospheric Column Density [] × E15 | CO Total Column Density [] × E18 |
|---|---|---|
| Warm season | ||
| INCAS | 3.23 ± 1.23 | 1.87 ± 0.11 |
| MARS | 2.09 ± 1.06 | 1.82 ± 0.17 |
| CET-West | 3.05 ± 1.44 | 1.78 ± 0.17 |
| Cold season | ||
| INCAS | 3.72 ± 1.14 | 2.05 ± 0.07 |
| MARS | 3.48 ± 2.76 | 2.00 ± 0.11 |
| CET-West | 3.05 ± 1.20 | 1.88 ± 0.03 |
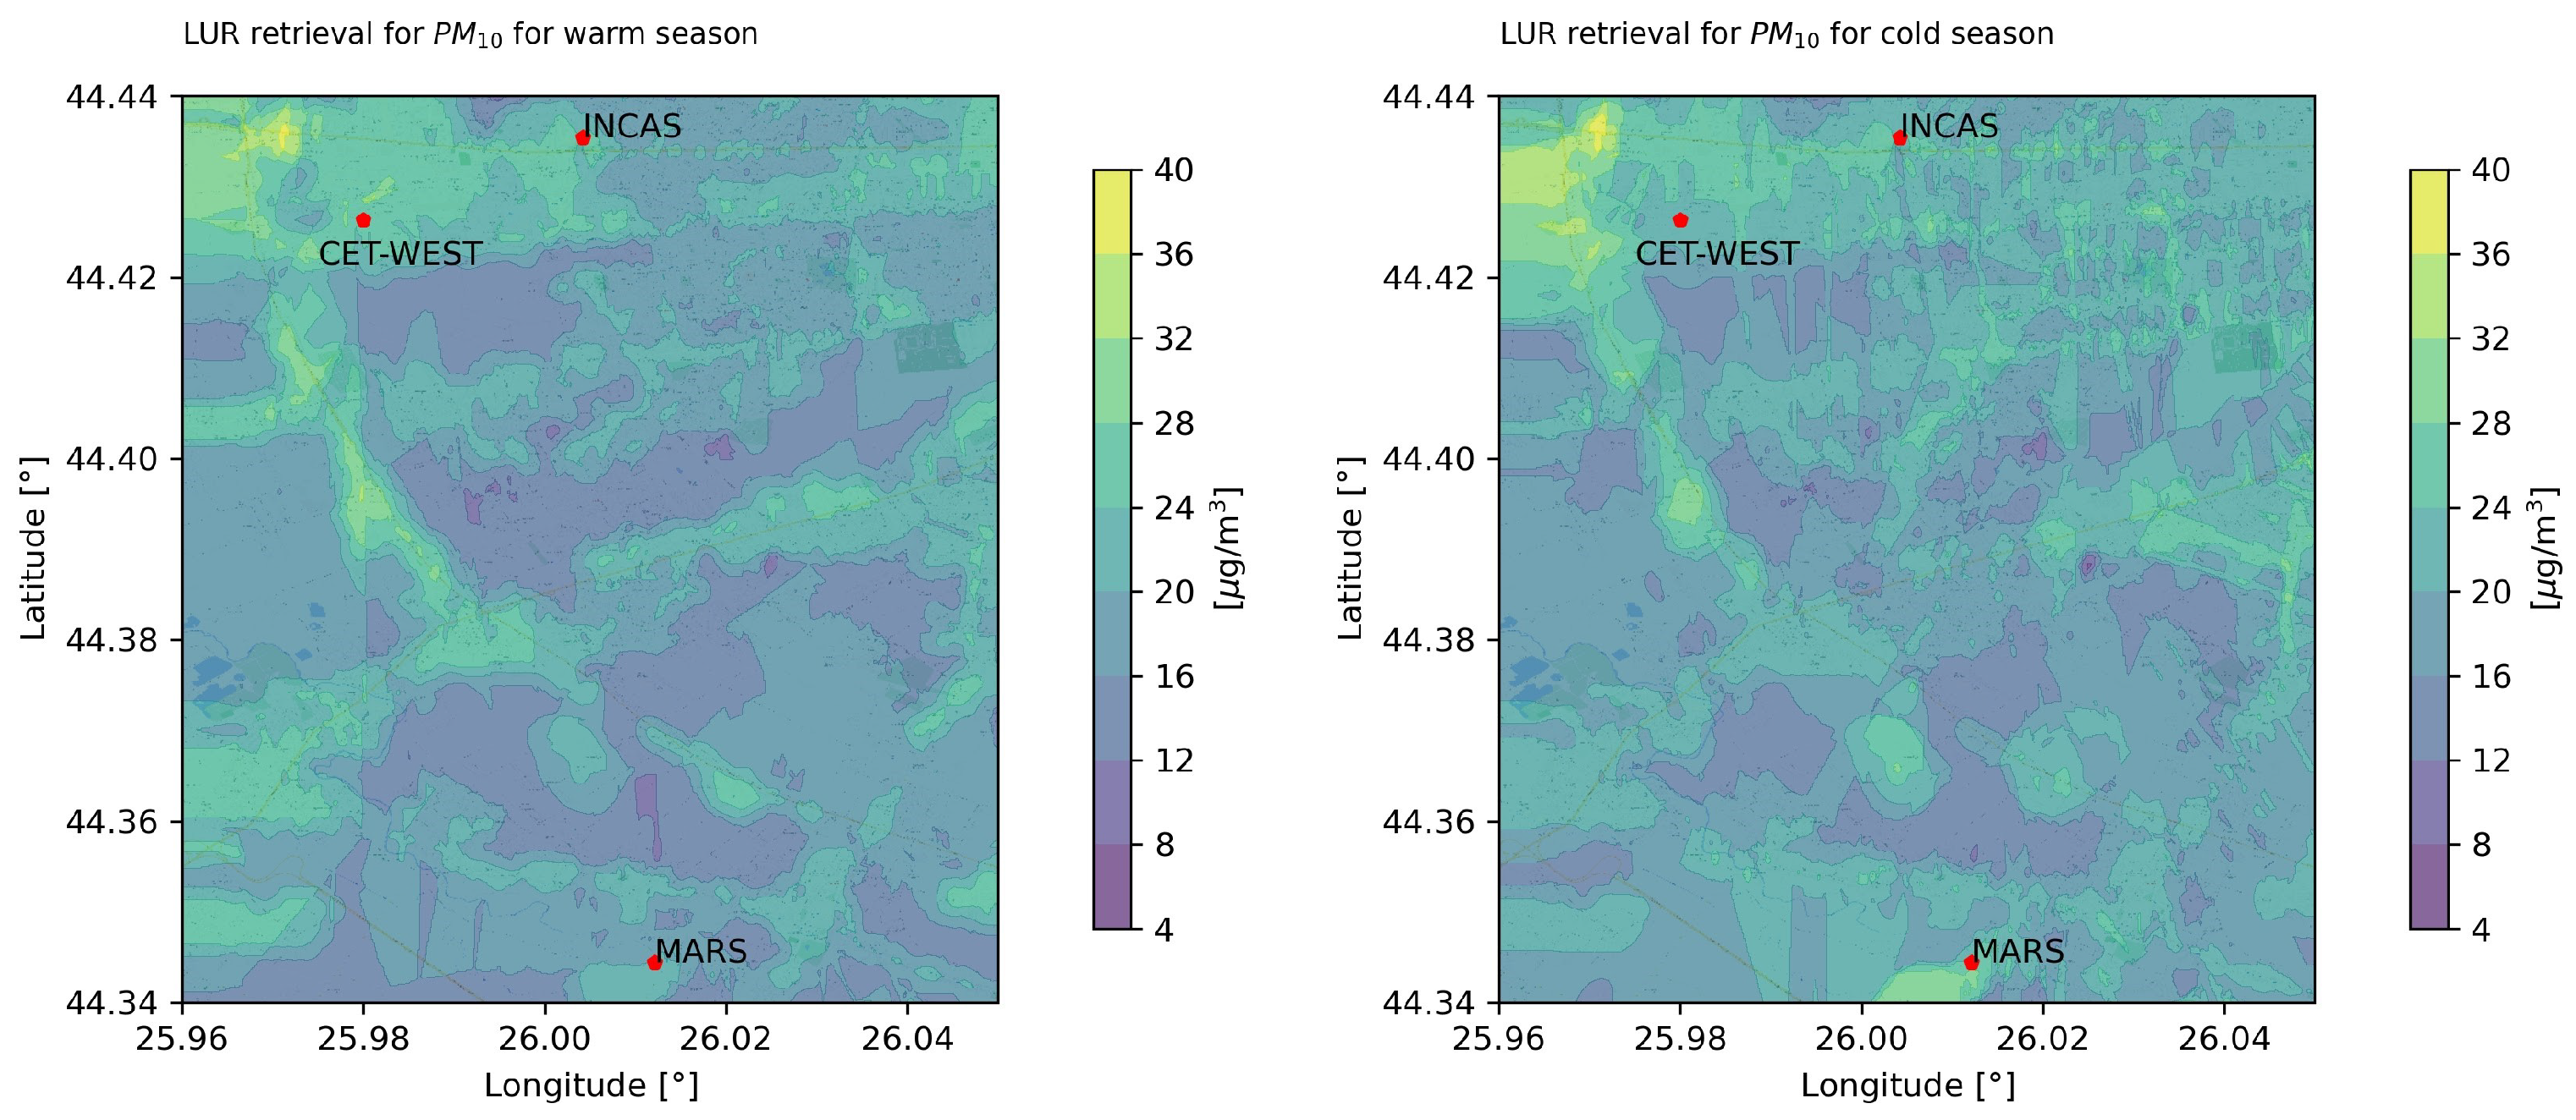
| Location | [μg/m3] | [μg/m3] | [μg/m3] | CO [μg/m3] |
|---|---|---|---|---|
| Warm season | ||||
| INCAS | 9.96 ± 2.58 | 14.40 ± 4.17 | 9.77 ± 6.09 | 135.75 ± 21.45 |
| MARS | 9.63 ± 2.45 | 14.22 ± 4.12 | 7.35 ± 4.68 | 132.72 ± 19.73 |
| CET-West | 9.66 ± 2.46 | 14.20 ± 4.11 | 7.94 ± 5.06 | 133.66 ± 19.70 |
| Cold season | ||||
| INCAS | 21.66 ± 12.14 | 28.26 ± 14.51 | 24.93 ± 14.19 | 269.54 ± 79.15 |
| MARS | 19.84 ± 10.88 | 26.37 ± 13.20 | 16.65 ± 10.05 | 251.89 ± 72.71 |
| CET-West | 21.97 ± 11.93 | 28.23 ± 14.14 | 19.57 ± 11.70 | 261.24 ± 74.27 |
| Season | Parameter | Data Source | ||||
|---|---|---|---|---|---|---|
| Calibrated | Low-Cost | Satellite | Model | Differences | ||
| Senors | Sensors | (Tropomi) | (CAMS) | |||
| Warm | Near surface | 8% | −26% | Similar | ||
| Near surface | −10% | −27% | 3% | Similar | ||
| Near surface | −27% | −30% | 1% | Lower | ||
| Near surface | 50% | 33% | Higher | |||
| Trop. column | 17% | Similar | ||||
| Near surface CO | 2% | |||||
| Trop. column CO | −0.01% | Similar | ||||
| Cold | Near surface | 22% | ||||
| Near surface | 20% | 9% | Similar | |||
| Near surface | 15% | 7% | Similar | |||
| Near surface | 641% | 50% | Higher | |||
| Trop. column | 36% | Higher | ||||
| Near surface CO | 7% | |||||
| Trop. column CO | 0.01% | Similar | ||||
Disclaimer/Publisher’s Note: The statements, opinions and data contained in all publications are solely those of the individual author(s) and contributor(s) and not of MDPI and/or the editor(s). MDPI and/or the editor(s) disclaim responsibility for any injury to people or property resulting from any ideas, methods, instructions or products referred to in the content. |
© 2025 by the authors. Licensee MDPI, Basel, Switzerland. This article is an open access article distributed under the terms and conditions of the Creative Commons Attribution (CC BY) license (https://creativecommons.org/licenses/by/4.0/).
Share and Cite
Nicolae, D.; Talianu, C.; Vasilescu, J.; Dandocsi, A.M.; Belegante, L.; Nemuc, A.; Toanca, F.; Ilie, A.; Dandocsi, A.V.; Nicolae, S.M.; et al. How Does the Location of Power Plants Impact Air Quality in the Urban Area of Bucharest? Atmosphere 2025, 16, 636. https://doi.org/10.3390/atmos16060636
Nicolae D, Talianu C, Vasilescu J, Dandocsi AM, Belegante L, Nemuc A, Toanca F, Ilie A, Dandocsi AV, Nicolae SM, et al. How Does the Location of Power Plants Impact Air Quality in the Urban Area of Bucharest? Atmosphere. 2025; 16(6):636. https://doi.org/10.3390/atmos16060636
Chicago/Turabian StyleNicolae, Doina, Camelia Talianu, Jeni Vasilescu, Alexandru Marius Dandocsi, Livio Belegante, Anca Nemuc, Florica Toanca, Alexandru Ilie, Andrei Valentin Dandocsi, Stefan Marius Nicolae, and et al. 2025. "How Does the Location of Power Plants Impact Air Quality in the Urban Area of Bucharest?" Atmosphere 16, no. 6: 636. https://doi.org/10.3390/atmos16060636
APA StyleNicolae, D., Talianu, C., Vasilescu, J., Dandocsi, A. M., Belegante, L., Nemuc, A., Toanca, F., Ilie, A., Dandocsi, A. V., Nicolae, S. M., Ciocan, G., Vulturescu, V., & Tudose, O. G. (2025). How Does the Location of Power Plants Impact Air Quality in the Urban Area of Bucharest? Atmosphere, 16(6), 636. https://doi.org/10.3390/atmos16060636