Abstract
This article explores how the location of a building in an urban area, the level of external air pollution, and the way a residence is used can affect indoor air quality. To assess this, this study used measurements of physical and chemical pollutants, as well as microbiological measurements, including counts of various bacteria and microscopic fungi. These included counts of mesophilic and psychrophilic bacteria, mannitol-positive and mannitol-negative Staphylococcus, Actinobacteria, Pseudomonas fluorescens, and microscopic fungi. The research involved analysing indoor and outdoor air quality in 38 selected spaces within buildings in the city of Poznań during the heating season. The study found that the eastern part of the city showed the highest levels of fungal contamination in the external environment. Furthermore, distinct differences were observed between the presence of microorganisms indoors and outdoors based on the results of bacterial and fungal aerosol studies. The authors advocate for including microbiological studies as part of standard air quality assessment indicators to reveal the extent and source of contamination, as similar issues may be present in cities around the world.
1. Introduction
According to studies on indoor air quality (IAQ), both microbiological air pollution and physical conditions like temperature, relative humidity, concentration of dusts (PM10, PM2.5), and gases (NOx, VOCs, SOx, benzene, O3) can have a significant negative impact on human health, comfort, and productivity [1,2,3,4,5,6,7,8,9]. The indoor air quality (IAQ) depends on, in addition to the building technical state and building materials used in the building, the quality of the air outside the building and indoor contaminant sources. Not only micro-climatic parameters (t, RH%) can affect the inside air quality, but also pollutants emitted by external sources (low emission from heating stoves and local boiler houses, transportation vehicles) [10].
Depending on the building’s age and airtightness, operation mode, and the way of occupancy level (physical activity and gender of inhabitants) and knowledge about the role of air changes, a wide range of external contaminants can have an impact on IAQ, along with contaminants from internal sources [11,12,13,14,15,16].
However, indoor air is not routinely monitored, and most of the regulations valid in some countries (Poland and Europe) mainly refer to the working standards in the building industry in terms of design requirements [17,18]. According to [19], identifying relevant carbon dioxide that correspond to ventilation rate requirements must consider the building type and its occupancy.
The percentage of the particle components of indoor and outdoor air is variable and depends on the location, orography, weather, second formation, and presence of vegetation [20,21,22,23]. The air in cities, housing estates, and industrial centres naturally contains more pollutants compared with forests, parks, or sea sides. Such activities may lead to an increase in local pollutant concentrations through biogenic emissions [24,25,26]. Air contamination, both inside and outside, includes chemical substances (gaseous substances, e.g., CO2, NOx, SOx, hydrocarbons, UFP, black carbon, VOCs, PAH, PCDD/F, PCB), physical material (particulate matter), and biological substances (bioaerosols). Good air quality is of crucial importance for humans, as airborne exposure to pollutants can lead to respiratory and circulatory diseases or allergies and other health impacts as well as effects on productivity and learning [27,28,29,30,31].
The outdoor air quality in a given location depends on the spatial distribution of the emissions from various outdoor sources, which is influenced by, among others, the thermal structure of the atmosphere, turbulence, precipitation and regional transport of polluted air masses, the landform, the nature of the building, the localisation in the built-up area, and winds [11,32,33,34]. Generally, outdoor air contains large numbers of microorganisms, usually non-pathogenic, saprophytic, and resistant to drying; however, pathogenic bacteria and fungi (moulds), as well as viruses, can also be present. The quantitative composition of bacteria and fungi in bioaerosols in various environments, internal and external, largely depends on physical, chemical, and biological factors [20,22,30,32]. Such microorganisms can originate from various environments, such as soil, water, animals, plants, humans, and other sources of emission. The number of microorganisms occurring in the air depends on the number and health of the people present, the building site (e.g., city, village, industrial plant, municipal establishment, school, hospital, or park), the climatic conditions, and the elevation. The degree of inside air contamination (e.g., in homes, schools, offices, work places, etc.) is connected not only to the quality of the outdoor and indoor air, but also to the number of persons in the room and their health condition and cleanliness, as well as the method and frequency of cleaning, the type of ventilation (natural, exhaust, hybrid, supply-exhaust), and the presence or lack of potential sources of microorganisms [8,35,36,37]. It also depends on the physical and chemical contaminants in the intake air, the temperature, the humidity, the concentration of oxygen and carbon dioxide, and the particles present in the room. Bioaerosols can be hazardous components of indoor air; they are formations of various complexes of particles composed of biological material, such as the bacteria, viruses, protozoa, cellular fragments, mycelial fragments and fungal spores, and products of metabolism, as well as endotoxins, enterotoxins, enzymes, and mycotoxins [4,13,27,33,38,39,40].
Based on the associated health risks of bad indoor air, the term “sick building syndrome” (SBS) has been coined, which defines the combination of factors negatively impacting the mood and health of people staying inside [29,31,41,42,43].
In Poland, over 20% of the territory is subject to excessive outdoor air pollution, mainly associated with sulphur, nitrogen, and carbon compounds and VOCs (volatile organic compounds) and particulate matter (PM2.5, PM10), including Górny Śląsk (Upper Silesia) and the large urban agglomerations. The main sources of pollution in Poznań (the study area in this work) and Wielkopolska (Greater Poland) have been transportation vehicles and point emission (production plants, power plants, and residential buildings with coal heating, fireplaces, and other combustion devices.). Within the last 15 years, the emission of pollutants has decreased according to the State Environmental Monitoring (SEM) [44,45]. In the long-term assessment of air quality at the SEM station, mainly physical and chemical pollutants are taken into account (PM10, PM2.5, SO2, NO2, NOx, NO, CO, C6H6). However, generally, this air quality monitoring does not include the main components of bioaerosols, namely bacteria and fungi. Taking into account the above observations, a broader perspective on indoor air quality assessment was proposed in the article. This study presented the results of both physical and chemical air quality assessments, supplemented by microbiological research. In this context, we assessed the microbiological and physical quality of indoor air in residential buildings at the beginning of the heating season and compared the measurements with the outdoor air. The tests were conducted in autumn, a season in Poland when the outdoor temperature drops and the air inside apartments is less frequently exchanged with outdoors. The research was conducted in selected representative rooms of buildings with various functions located in different parts of the city, covering an area of 261.9 km2. A novel indicator for microbiological assessment was proposed, and the research question was addressed. The research question was as follows: how does location of the building in the city, the degree of outdoor air contamination, and the way of apartment usage impact indoor air quality? Due to measurement limitations, an additional assessment of outdoor air quality in the city of Poznan was also conducted. the physical and microbiological measurements of the air quality were complemented with information from the Regional Inspectorate of Environmental Protection (WIOS). The conducted air quality assessment can be useful for planning city initiatives aimed at improving the quality of life for its residents. In areas of the city exposed to increased influence from polluted outdoor environments, technical solutions to mitigate the impact of polluted outdoor environments can be proposed (such as air purifiers, ventilation systems, sealed windows, etc.).
2. Materials and Methods
2.1. Description of the Buildings
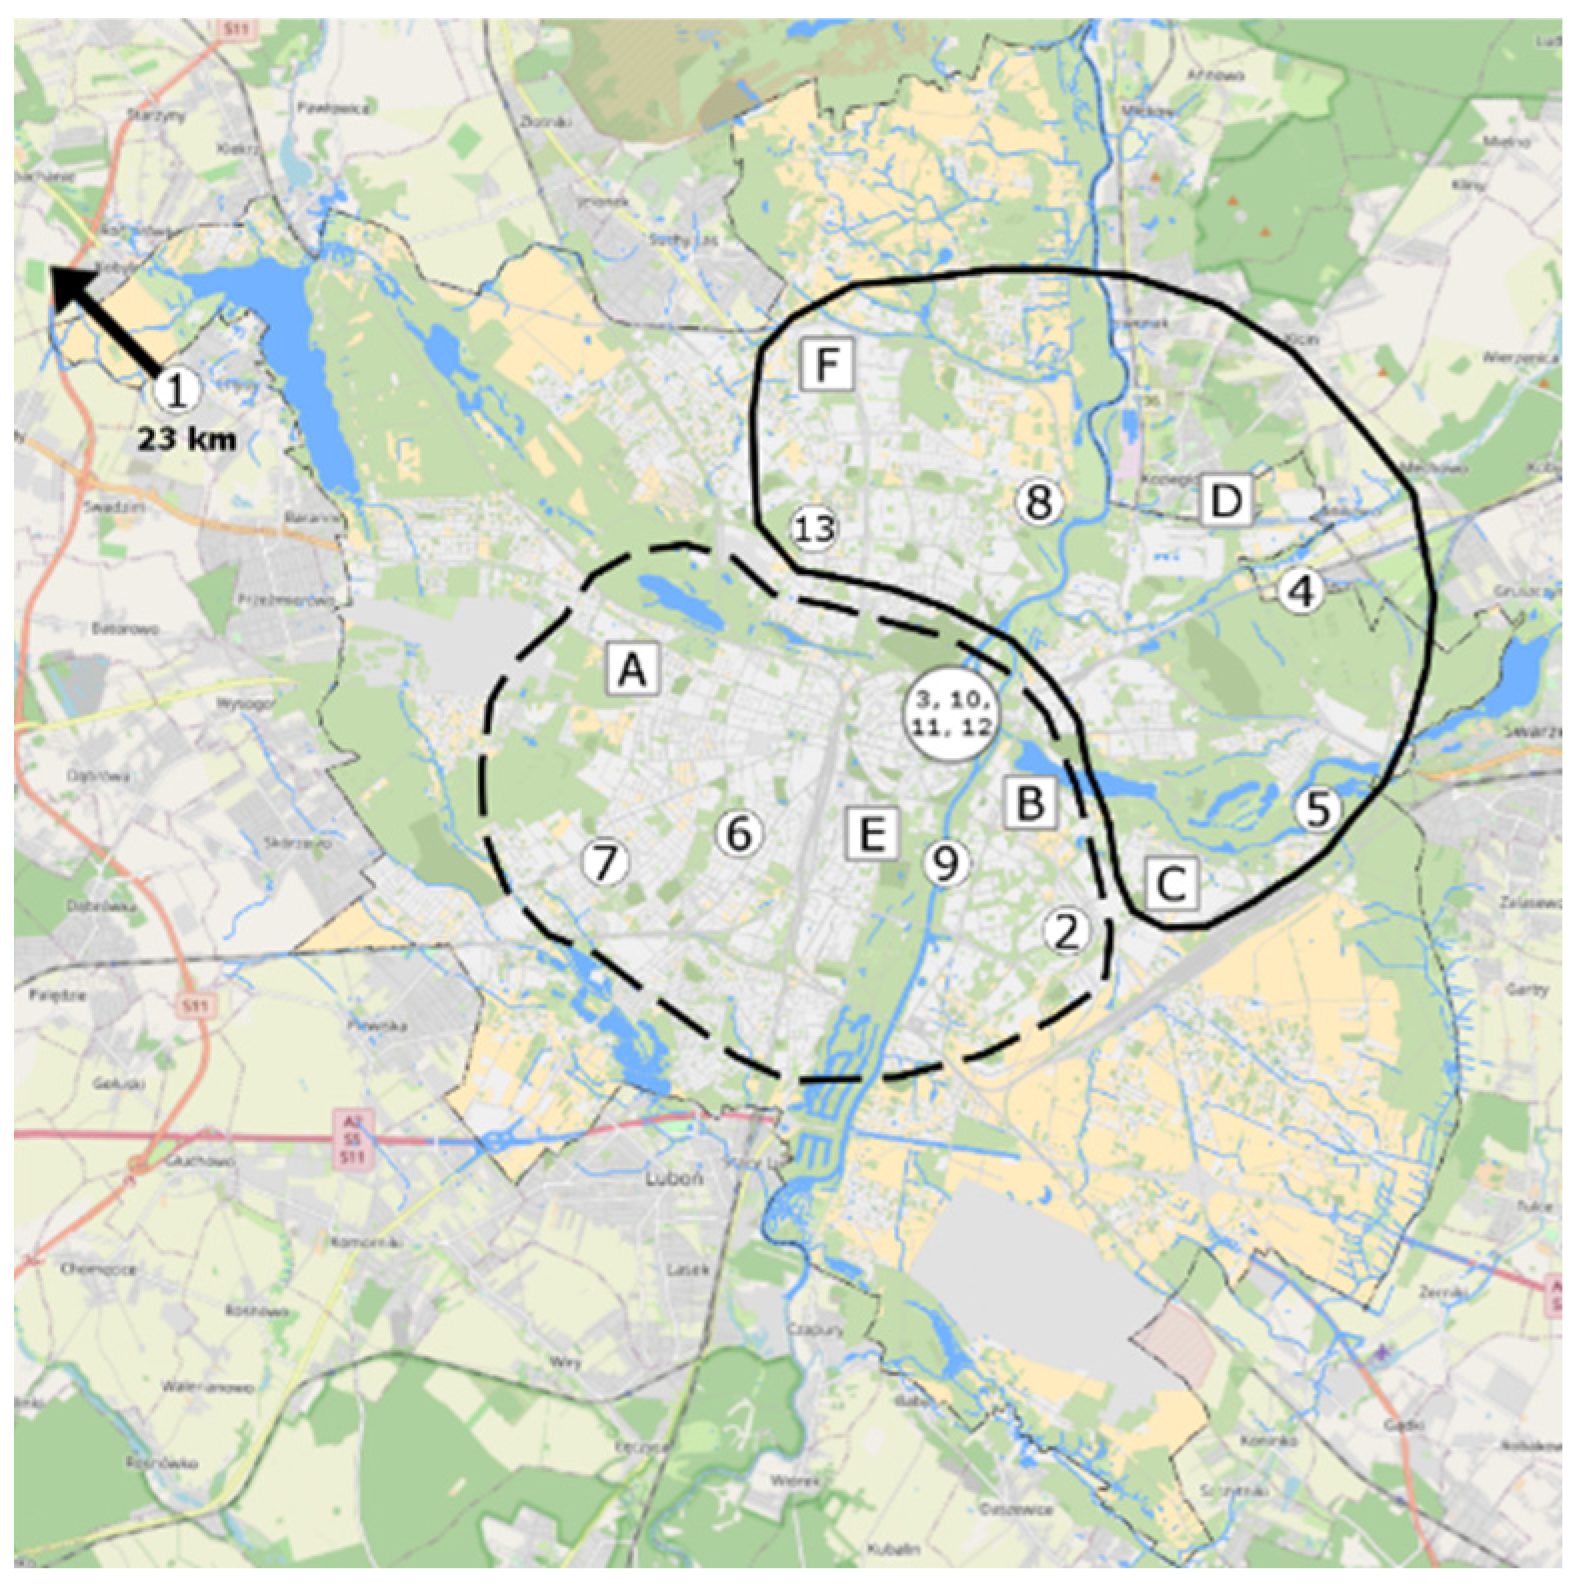
We studied 13 buildings located in the Poznań agglomeration (Greater Poland region), with a population of 1 million inhabitants (Figure 1). There is no heavy industry in the city of Poznań, and green areas represent, according to 2018 data, about 27% of the city’s area (parks, greens, city lawns, cemeteries, allotment gardens, and street greenery)—green colour in Figure 1. When selecting buildings, their representativeness was considered. The main criterion for the selection of the survey point data was location in close proximity to the urban monitoring survey points and the consent of the users of the premises to carry out the surveys. The additional selection criteria were as follows:
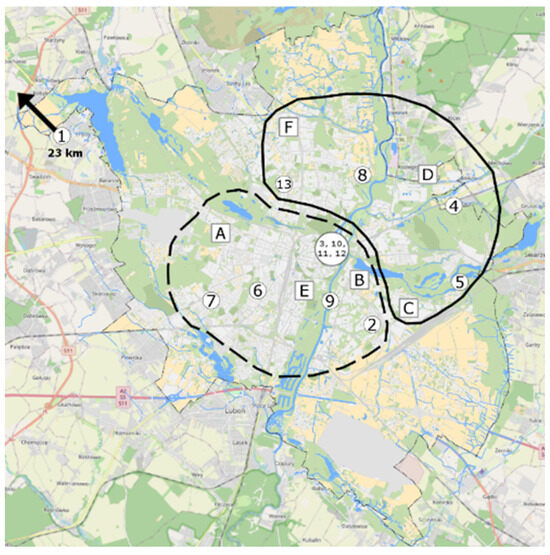
Figure 1.
Localities of the tested buildings (the numbers 1 to 13) and the Regional Inspectorate of Environmental Protection (WIOS) (the points A–F).
- Locality (centre of the city, residential area, suburbia).
- Older than 15 years (constructed according to similar building regulations, equipped with natural ventilation).
- Heating system (municipal heating network or individual heating system).
- Number of inhabitants (two to three people).
- The consent of users for conducting IAQ monitoring.
The oldest tested building had been built in 1904 (1-RB) and the youngest in 2011 (4-SB). The air flow in all buildings was generated by natural ventilation. In all buildings, except for one where the windows were triple-glazed (4-SB), the windows were double-glazed in a plastic frame or in a wooden frame. Table A1 (Appendix A) presents the characteristics of the tested buildings in terms of the structure and systems.
We selected one apartment per building. The tested apartments were inhabited by two to three people.
The tested buildings were assigned to three groups: single-family buildings (4-SB, 5-SB, 8-SB), residential multi-family buildings (1-RB, 2-RB, 6-RB, 7-RB, 9-RB), and collective residence buildings—dormitories (3-CRB, 10-CRB, 11-CRB, 12-CRB, 13-CRB), based on the arrangement and size of the rooms, the function, and the use profile. Typical single-family and residential multi-family buildings consisted of a specific room for food preparation (kitchen), a separate room for sleeping (bedrooms), day rooms, or a work studio and a toilet. In single-family buildings (SBs), the bathroom has a window. The apartments in the dormitories consisted of one room, which was the bedroom and the living room in one and also a partial kitchen. The only separate room was the toilet without a window, which was also used by other residents (e.g., two-room segment connected with the toilet). There were no animals in the rooms surveyed on a daily basis, and the users did not smoke.
Analysis was conducted for 13 localisations and N = 27 measurement points in the closed rooms and N = 11 measurement points outdoor (background tests).
2.2. Environmental Parameters
Air samples were collected in the selected rooms and outdoor in the vicinity of the buildings. Simultaneous measurements of microbiological, physical, and chemical parameters were conducted in October and November during the autumn time, when the outside air is additionally polluted by low-level emissions from energy sources.
All the measuring devices used in the tests and described below have a valid calibration certificate.
2.2.1. Physical Measurements
We measured air temperature (°C), relative air humidity (%), and carbon dioxide concentration (ppm) both inside and outside the buildings. The measurements consisted of continuous measurements of the above-mentioned parameters (method A) with a frequency of 30 s to 5 min for 2–5 days or single measurements (method B) consisting of three to five readings within 10 min, carried out during air sampling for microbiological analyses. The choice of measurement method (A) and (B) depended on the availability of measurement equipment and residents’ consent for long-term IAQ monitoring. The continuous measurements (method A) were taken using ALMEMO 2690-8 and 2890-9 instruments (Ahlborn, Holzkirchen, Germany) with a 24-bit AC/DC converter, five to nine sensors, two exits, and a memory of 100,000 measurements recorder with the following sensors: for temperature with a measuring accuracy of ±0.2 °C, for relative humidity with an accuracy of ±0.2%RH, and for carbon dioxide with an accuracy of ±50 ppm. For single measurements (method B), we used the Testo 435 measuring machine recorder (Testo, Smørum, Denmark) with the following sensors: for temperature with a measuring accuracy of ±0.2 °C, for relative humidity with an accuracy depending on probe and resolution ±0.1%RH, and for carbon dioxide with an accuracy depending on probe and resolution ±1 ppm. The number of obtained values varied from 580 to 12,762. The valid building standard [46] was employed for IAQ evaluation. In the central part of the room, the measurement devices were positioned at a height of approximately 80 cm above the floor. The outdoor air parameter recorder was installed based on the following possibilities: on the windowsill, on the balcony, or at a maximum distance of 10 m from the building in the surrounding garden.
2.2.2. Microbiological Measurements
We collected air samples using the MAS-100 Eco sampler (Merck, Darmstadt, Germany), designed for Petri dishes with a diameter of 9.0 cm (collision method). The sampler was placed 1.5 m above floor level in the middle of each room and 1.5 m above ground level for outdoor air samples. Measurements in the outdoor environment were conducted at a maximum distance of 15 m from the building, away from the street, and on rainless and windless days in the early morning hours. During microbiological measurements in the room, only one person was present, and the doors and windows were closed. On the day of scheduled measurements, users were asked not to open windows. Measurements were performed with a single repetition. We analysed the air samples for the following microorganisms: mesophilic bacteria on nutrient agar, psychrophilic bacteria on nutrient agar, mannitol-positive (M+) and mannitol-negative (M−) Staphylococcus on Chapman medium, Actinobacteria on Pochon medium, Pseudomonas fluorescens on King B medium, and identification of colonies in UV rays, as well as the total number of microscopic fungi in Czapek-Dox and Waksman medium. We used 100 dm3 of air to determine Pseudomonas fluorescens, Actinobacteria, and Staphylococcus, and we used 25–50 dm3, depending on the pollution level, for the other measurements. Microorganisms were counted after the incubation period [10], and their numbers were corrected according to the statistic Feller table; the values were expressed as colony-forming unit per 1 m3 of air (CFU·m−3). The requirements of the Polish standards define the air quality based on the numerical amount of the cultivated bacteria and microscopic fungi [17].
2.2.3. Physical Tests Conducted by the Regional Inspectorate of Environmental Protection (WIOS)
Our measurements were supplemented by hourly data from the monitoring stations of WIOS. In the Poznań area and surroundings, six monitoring stations measured outdoor air quality (Figure 1, items A–F) at different localities, delivering hourly measurements (24 h·d−1) for the following parameters: PM10, PM2.5, NO2, NOx, NO, SO2, CO, and C6H6. Five monitoring stations provided monitoring data for PM10, and five stations measured NO2 and NO; only two stations monitored PM2.5, CO, C6H6, and SO2. All results are expressed in µg·m−3. The threshold values were established by the Minister of Environment in August 2012 [47] and were as follows: SO2—125 µg·m−3, PM10—50 µg·m−3. Additionally, the annual thresholds were PM10—40 µg·m−3, PM2.5—25 up to 20 µg·m−3 (since 2020), SO2—20 µg·m−3, C6H6—5 µg·m−3, NO2—40 µg·m−3, and NOx—30 µg·m−3. For the individual air quality indices, the limits of variation of particular impurities were defined depending on the index category.
2.3. Assessment Indicators
To determine whether the bacteria/fungi counts are from an outdoor or indoor source, several indices were used and reported as the minimum value, maximum value, and mean with standard deviation.
- I/O ratio: the pollution source information index caused by microorganisms, calculated as the ratio of a specific microorganism’s value in indoor air to its value in outdoor air.
- GIMC·m−3 index: the global microbiological contamination index per cubic meter of air, calculated as the sum of all detected bacteria and fungi in the analysed air per cubic meter of air.
- IMSC·B−1 index: the psychrophilic bacteria index, calculated as the quotient of the sum of mesophilic bacteria and staphylococci divided by the sum of the remaining bacteria, i.e., psychrophilic, Pseudomonas fluorescens, and Actinobacteria.
- IMSC·BF−1 index: the index of mesophilic bacteria and staphylococci calculated as the quotient of mesophilic bacteria and staphylococci divided by the sum of the other detected bacteria and fungi.
- B·F−1 index: the ratio of the sum of all bacteria to the microscopic fungi occurring at a given location (modified version according to [48].
To help characterise the individual measurement points, we used two indicators of occupant density, the floor area per person (m2·person−1), and the volume area (m3·person−1) (Table 1). To determine the indicators, the total area and total volume of a given single-family buildings were used. In the case of the residential multi-family buildings, this was the area and volume of the apartment, whereas for the collective residence buildings, we considered the area and volume of the rooms, toilets, and kitchens.

Table 1.
Indicators of area and volume.
3. Results
3.1. Microbiological Air Contamination—Quantitative Assessment
The results regarding bacterial and fungal counts (CFU·m−3) at the individual measurement points are presented in Appendix A in Table A2. Mesophilic and psychrophilic bacteria as well as microscopic fungi occurred at larger quantities. Their numbers at the particular measurement points varied significantly, both inside and outside buildings. Inside, mesophilic bacteria dominated, whereas outside, psychrophilic bacteria were present in greater concentrations. Actinobacteria and Pseudomonas fluorescens showed low abundances, and their numbers were slightly higher outside the buildings. Regarding microscopic fungi, the counts were higher in Waksman medium, and their numbers were only higher at five control stations outside (measurement points 6*, 21*, 25*, 28*, 31*) than inside the buildings, irrespective of the growth medium.
The highest contamination by mesophilic bacteria, in the group of single-family buildings (SBs), was noticed for building 5-SB on the ground floor, where the degree of contamination was eight times higher than that in the room upstairs. In the case of the other bacteria, the average degree of contamination was higher by 3.2 times. Considering fungi, the air downstairs was 1.8 times more contaminated. The highest bacterial contamination was found for residential multi-family buildings (RBs), mainly those located in the centre of Poznań, in the highly urbanised area (6-RB, 7-RB). The measurements in the particular rooms were similar but were twice as low as those for single-family buildings.
According to the Polish norms, due to the number of mannitol-positive (M+) and mannitol-negative (M−) Staphylococcus, air pollution was average (25 and less CFU M+ and/or 50 and less 50 CFU M−) and, frequently, high (more than 25 CFU M+ and/or more than 50 CFU M−). A similar degree of contamination was found for mesophilic bacteria (from 1000 to 3000 CFU—average pollution, more than 3000 CFU—strong pollution). For some measurement points (4, 5, 26, 27, 29, 30, 36, and numerous outdoor points), less than 1000 CFU of mesophilic bacteria were noticed, indicating no pollution. The low number of Pseudomonas fluorescens and Actinobacteria indicate relatively unpolluted air, whereas the number of fungi frequently indicated average pollution levels (up to 5000 CFU·m−3) or pollution levels negatively impacting human health (more than 5000 to 10,000 CFU); in one case (6*—outdoor), air pollution posed a significant threat to human health (more than 10,000 CFU·m−3) [17].
3.1.1. I/O Assessment Indicator
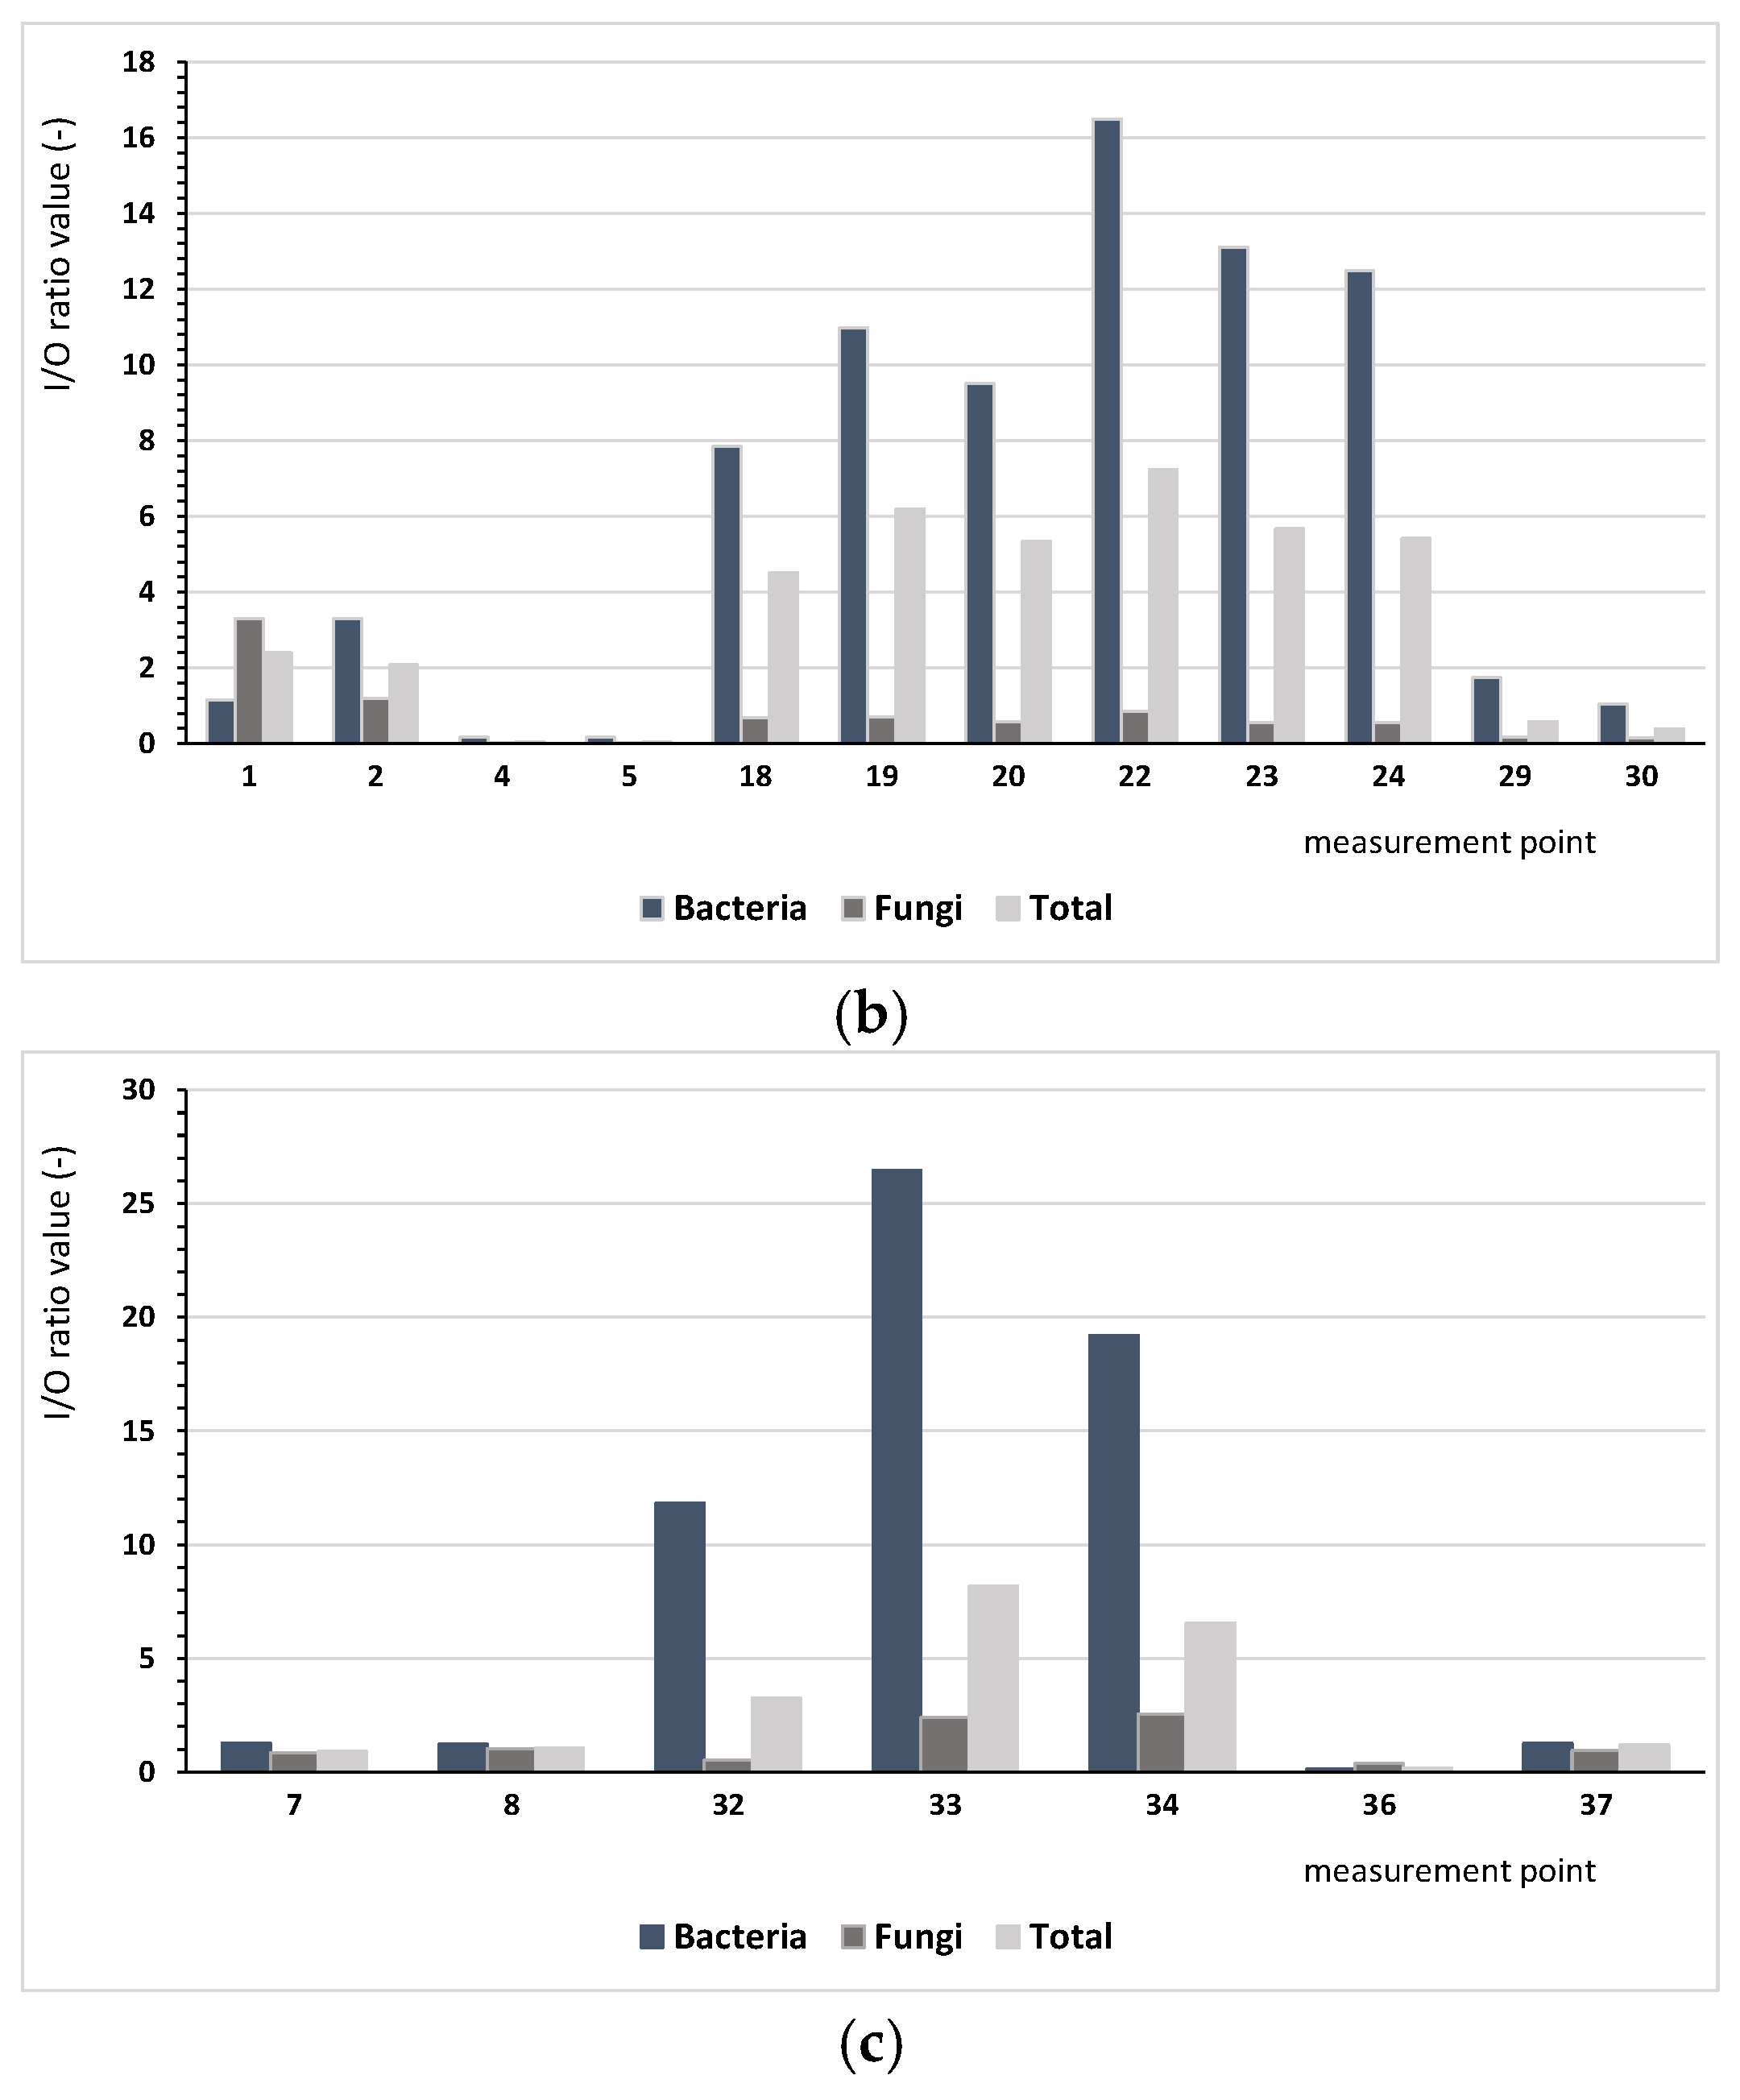
Based on the results regarding bacterial and fungal aerosols, there were clear differences between the number of microorganisms occurring indoor and outdoor. The ratio of indoor pollution to outdoor pollution (I/O) varied depending on the analysed microorganisms. Figure 2 presents the comparison I/O index for the analysed measurement points, depending on the type of the building. The conducted assessment aims to identify buildings where there is a need for ventilating indoor spaces.
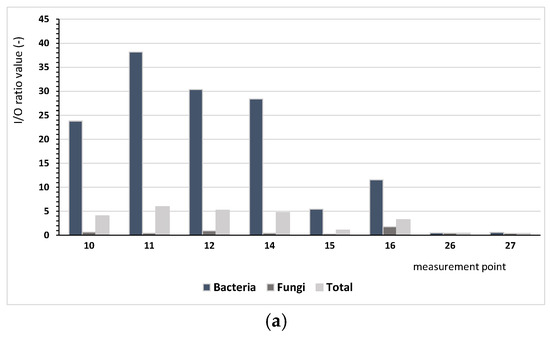
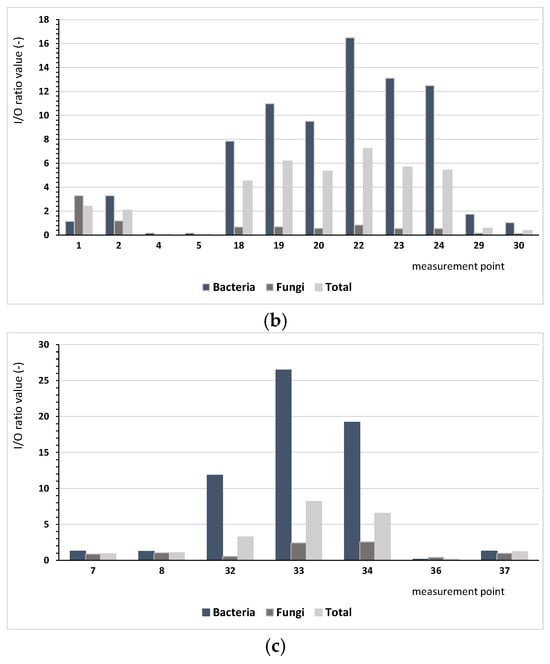
Figure 2.
Values of the I/O index for bacteria (mesophilic, psychrophilic, mannitol-positive (M+), and mannitol-negative (M−), Staphylococcus, Actinobacteria, Pseudomonas fluorescens) and microscopic fungi and the sum of all microorganisms depending on the building type: (a) single-family buildings (SBs), (b) residential multi-family buildings (RBs), (c) collective residence buildings (CRBs).
We found considerably lower values of the I/O index for microscopic fungi, ranging from 0.03 (measurement points 4 and 5) to 3.31 (measurement point no 1). Only at six points (1, 2, 8, 16, 33, 34) was the value of I/O index higher than 1.0, indicating that the indoor air was more contaminated by fungi than the air outside. For bacteria and microorganisms in bioaerosols, different patterns were observed. For bacteria, the index values ranged from 0.13 (measurement point 36) to 38.18 (measurement point 11), whereas for all microorganisms, they ranged from 0.05 (point 4 and 5) to 8.19 (measurement point 33); for five and eight points, respectively, values below one were found. These results lead us to infer that the indoor environment was the main source of bacterial emissions.
For single-family buildings (SBs), the I/O ratio for all analysed microorganisms had an average of 3.16, and for residential multi-family buildings (RBs) and collective buildings, these values were 3.33 and 3.05, respectively, depending on the locality of the building. For single-family buildings located nearby forests (4-SB), this ratio was up to 5.08 on average in comparison with building 8-SB, which showed an average level of 0.43. The high value of the coefficient for building 4-SB is a result of the high level of bacterial pollution (I/O = 30.8). For the residential multi-family buildings, the I/O index confirmed that the most important influence was bacterial pollution. For only the case of building 1-RB, fungal pollution was significant, most likely because of the building age (117 years) and technical condition.
Depending on the building’s localisation, the values of assessment indicators have differed significantly. Considering the localities of the buildings and criterion of fungal pollution, the outdoor environment was most polluted in the eastern part of Poznań, nearby the artificial lake Malta (6* or 9*). However, the I/O index did not indicate a deteriorated microbiological quality of the indoor air in the rooms 4-RB and 5-RB or 7-CRB and 8-CRB.
3.1.2. I/O Assessment Indicators GIMC·m−3, B·F−1, IMSC·B−1, and IMSC·BF−1
The results were also considered for the different types of the buildings. Table 2 presents a summary of the calculated mean values of the microbiological air pollution indices.
Table 2.
Indicators of microbiological air pollution estimation in the tested measurement points depending on their function.
When the calculated IMSC·B−1 index is less than one (12 measurement points including 9 located outside), the sum of mesophilic bacteria and Staphylococcus is smaller than that of the remaining bacteria (psychrophilic, Actinobacteria, Pseudomonas fluorescens). When this index is larger than one, the number of mesophilic bacteria and Staphylococcus is larger than the sum of the other bacteria. This clearly indicates the source of contamination of the indoor environment as the people inhabiting the rooms. When the IMSC·BF−1 index is less than one (24 measurement points, including all points outside), the sum of mesophilic bacteria and Staphylococcus is smaller that of the remaining bacteria (psychrophilic bacteria, Actinobacteria, Pseudomonas fluorescens) and microscopic fungi. This leads us to infer that the microscopic fungi and the bacteria not related to humans play a significant part in air pollution.
Analysis of the obtained calculation results showed that the lowest average values of all indices were found for the outside air samples, whereas the highest values were observed inside residential multi-family buildings (RBs) (for B·F−1, IMSC·B−1, and IMSC·BF−1) and in single-family buildings (SBs) (for GIMC·m−3). Among all analysed buildings, the dormitories (CRBs) were characterised by the lowest values for most indices (for B·F−1, IMSC·BF−1) and by the second lowest ones for GIMC·m−3. The most significant differences were noted for the indices B·F−1 and GIMC·m−3, most likely as a result of the large range between the minimum and maximum values of the bacteria and microscopic fungi detected. Based on the conducted comparative analysis of the proposed assessment indicators, we found no clear relation between building age and index values. Instead, the index values mainly depended on the internal emission and the locality.
3.2. Indoor Environmental Conditions
The physical parameters (microclimatic) of the air are important indicators of air quality. Similar to microbial contamination, humans are the main source of CO2 inside buildings, and CO2 concentration can be a very comprehensive indicator of indoor air pollution. CO2 concentrations are not intended as an overall IAQ metric but only to evaluate per person ventilation rates [49].
Table A3, presented in the Appendix A, shows the results of measurements regarding carbon dioxide (ppm), temperature (°C), and air relative humidity (%) for all analysed measurement points. The test results are summarised for CO2, RH, and t in Table 3.
Table 3.
Mean, minimum, and maximum values as well as standard deviation in the particular building categories.
Clear fluctuations of the tested microclimatic parameters were noticed in all ana-lysed building types on a daily basis. They were connected both with the people present in the rooms and the lack of the people in the apartments, activities, cleaning, airing, and lifestyles of the inhabitants (sleeping at night and activity during the day). It must be added that the tests were conducted in October and November, when the temperature drops and varies largely between day and night, with a high humidity. The mean humidity of the outdoor air was 81.6%, the mean temperature was 10.3 °C, and the mean carbon dioxide concentration in the outdoor air was 514 ppm (ranging from 316 to 830 ppm).
Among the analysed buildings, in the single-family buildings (CBs), with the largest volume, we found the lowest mean carbon dioxide concentration (707 ppm) and the smallest difference between minimum and maximum values. In contrast, in the dormitories, the mean carbon dioxide concentration was +1230 ppm), with the highest mean temperature and the lowest humidity. Although the windows of the dormitories were often unsealed, air exchange was not highly effective; also, dormitories, with their relatively small area, generally contained as many people as the larger apartments. In this sense, the important indicator is the area per person (Table 2).
In the single-family building (SB) and residential multi-family buildings (RBs), both mean temperature and humidity were similar. According to the Polish Norm [46], they are mostly classified as category II. In all apartments, the maximum values of the particular physical parameters were detected, which usually occurred when all inhabitants were present.
3.3. Outdoor Air Quality Results of the WIOS Monitoring Stations
The analysed buildings were located in various parts of the Poznań agglomeration. In the work, after the presented analysis of the local air quality (own research), the quality of the outside air using the hours data from the state institution WIOS was additionally assessed. This institution conducts continuous measurements of selected gaseous and dust pollutants at six measuring stations. The results of these studies were used to assess air quality in various parts of the city of Poznań at different times of the year. Based on data from the Regional Inspectorate for Environmental Protection (WIOS), the outdoor air quality in Poznań at the beginning of the heating season was compared for the months of October and November (O.N.) (average, minimum, and maximum values over a period of 2 to 5 years) with data from the summer period, July and August (J.A.). We noticed changes in the outdoor air quality caused by low emissions, among the others, from the heating sources. The obtained results provide a basis for determining zones with higher air quality in the city of Poznań at the beginning of the heating season (Figure 1). In the diagram, two areas with different outside air quality are marked with a solid and a dotted line. A continuous envelope refers to this part of Poznań, where a better air quality was detected.
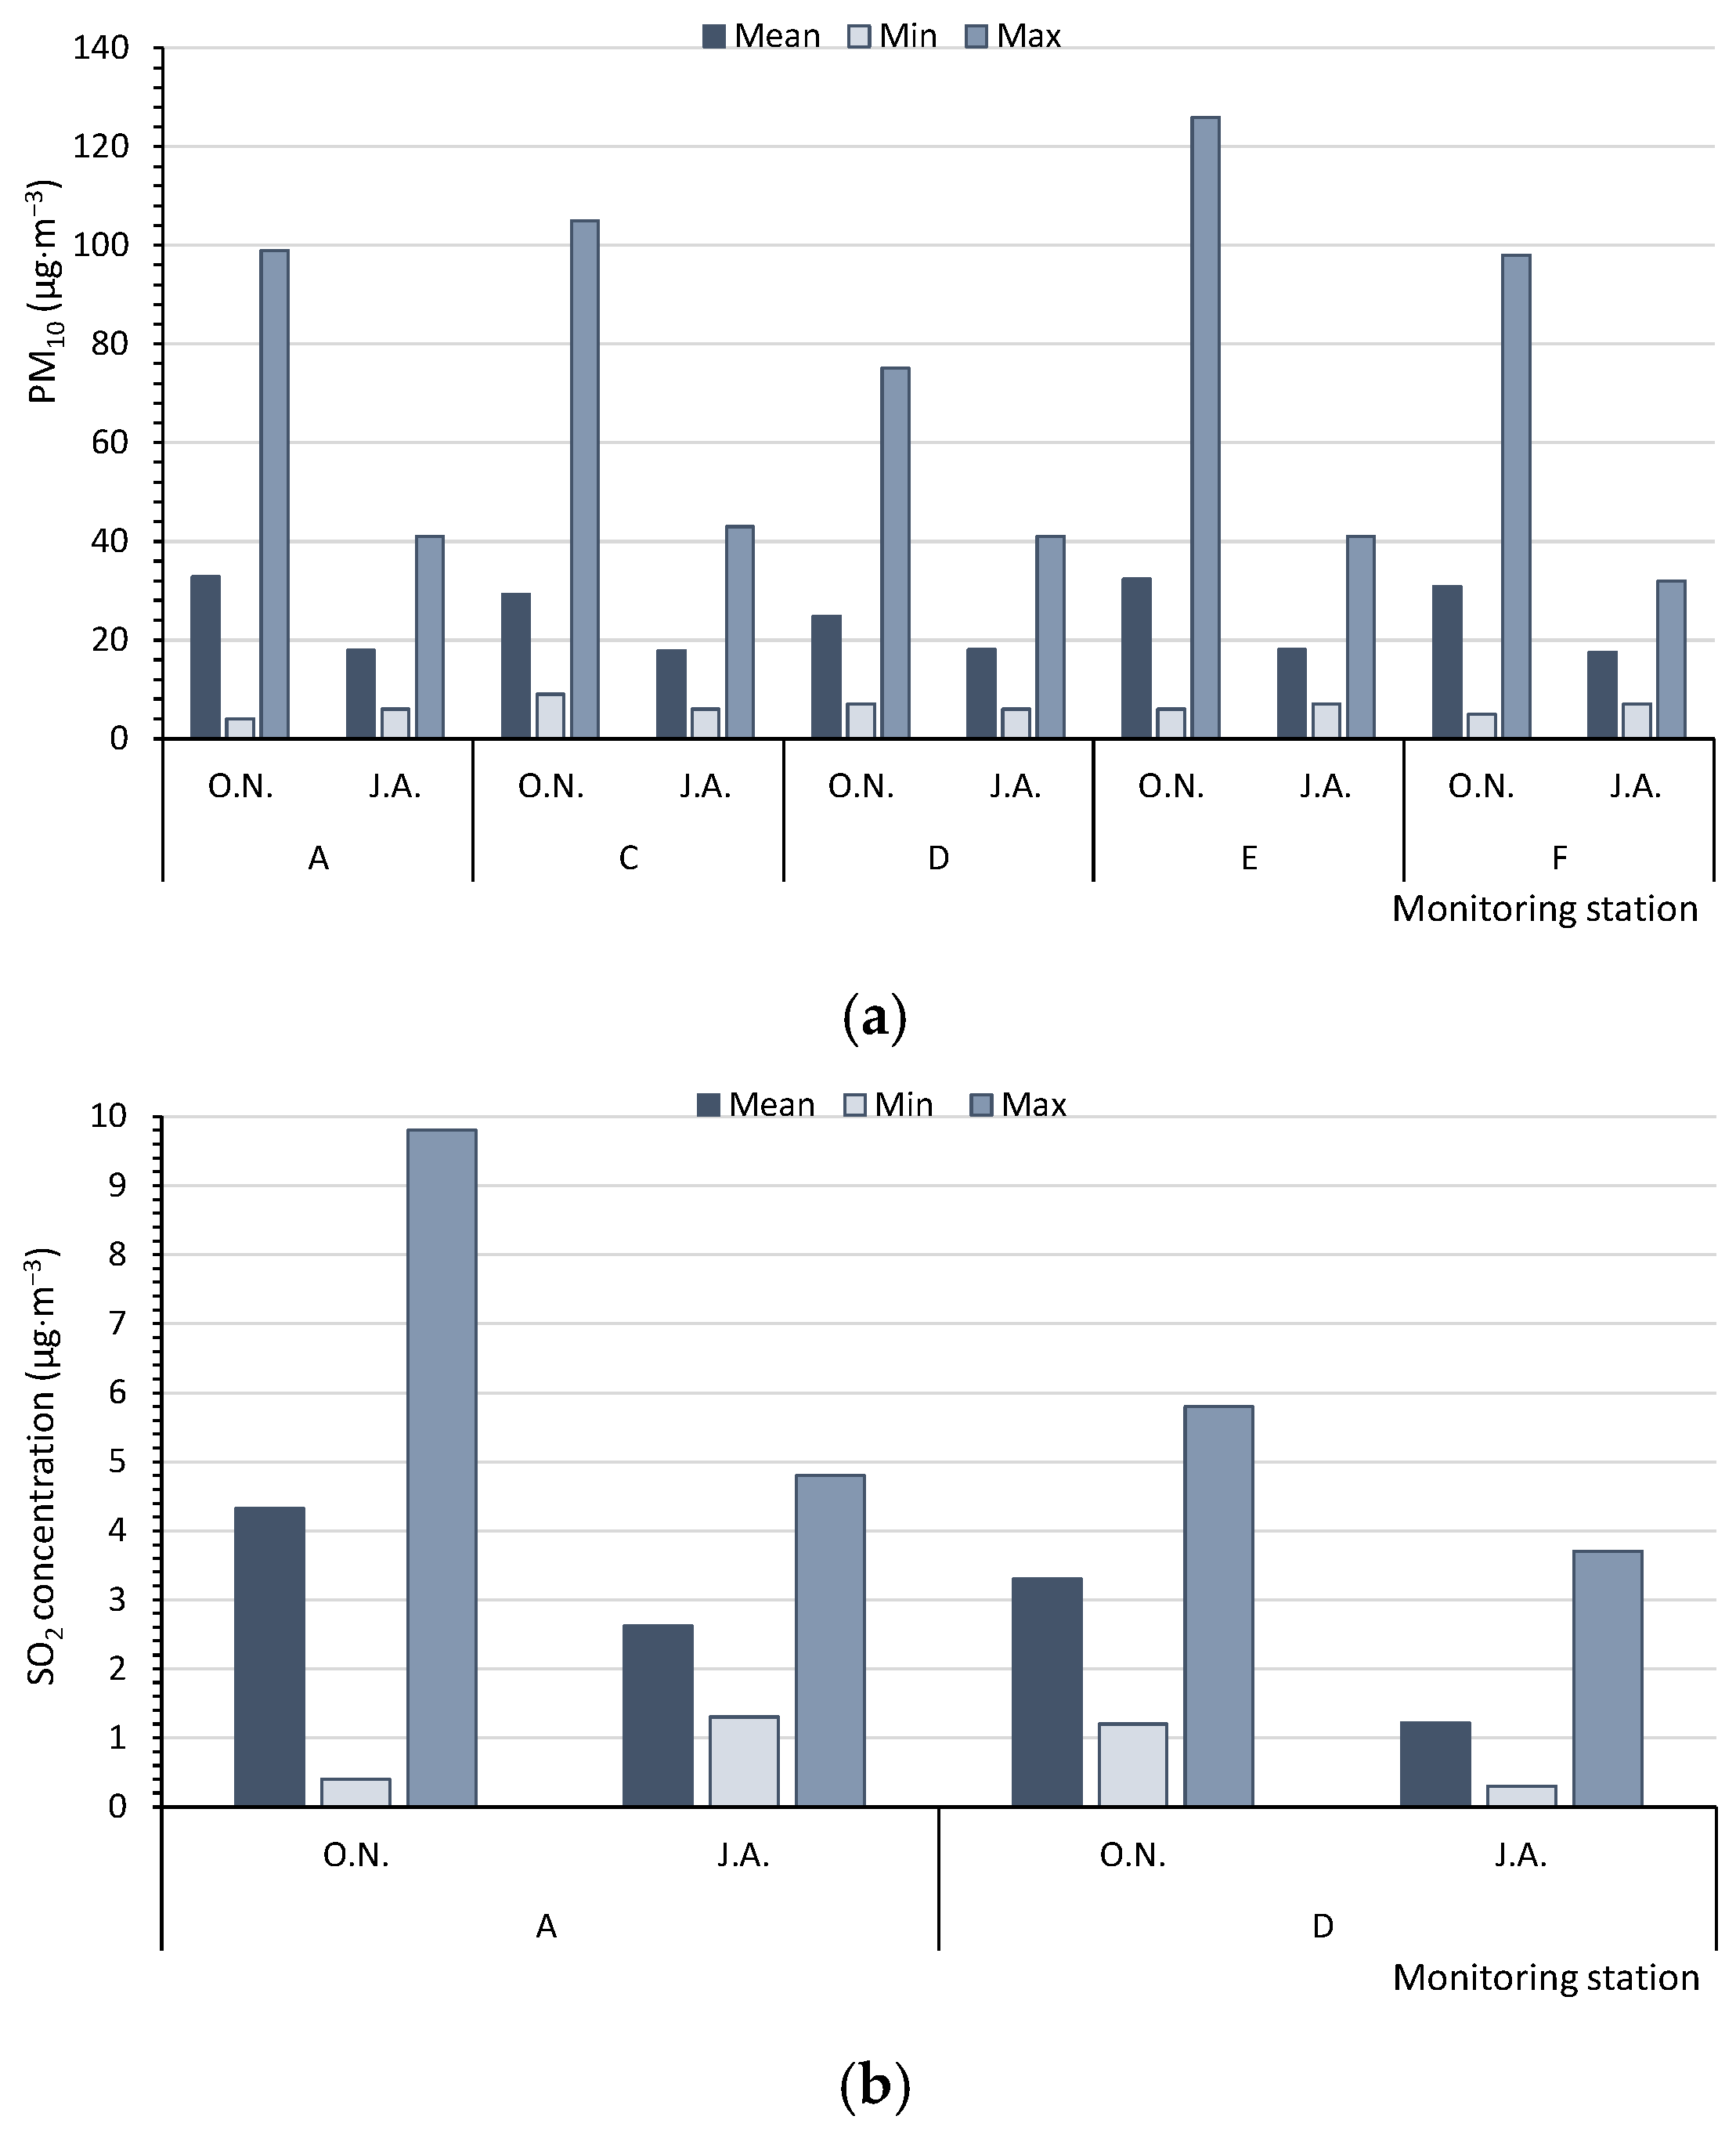
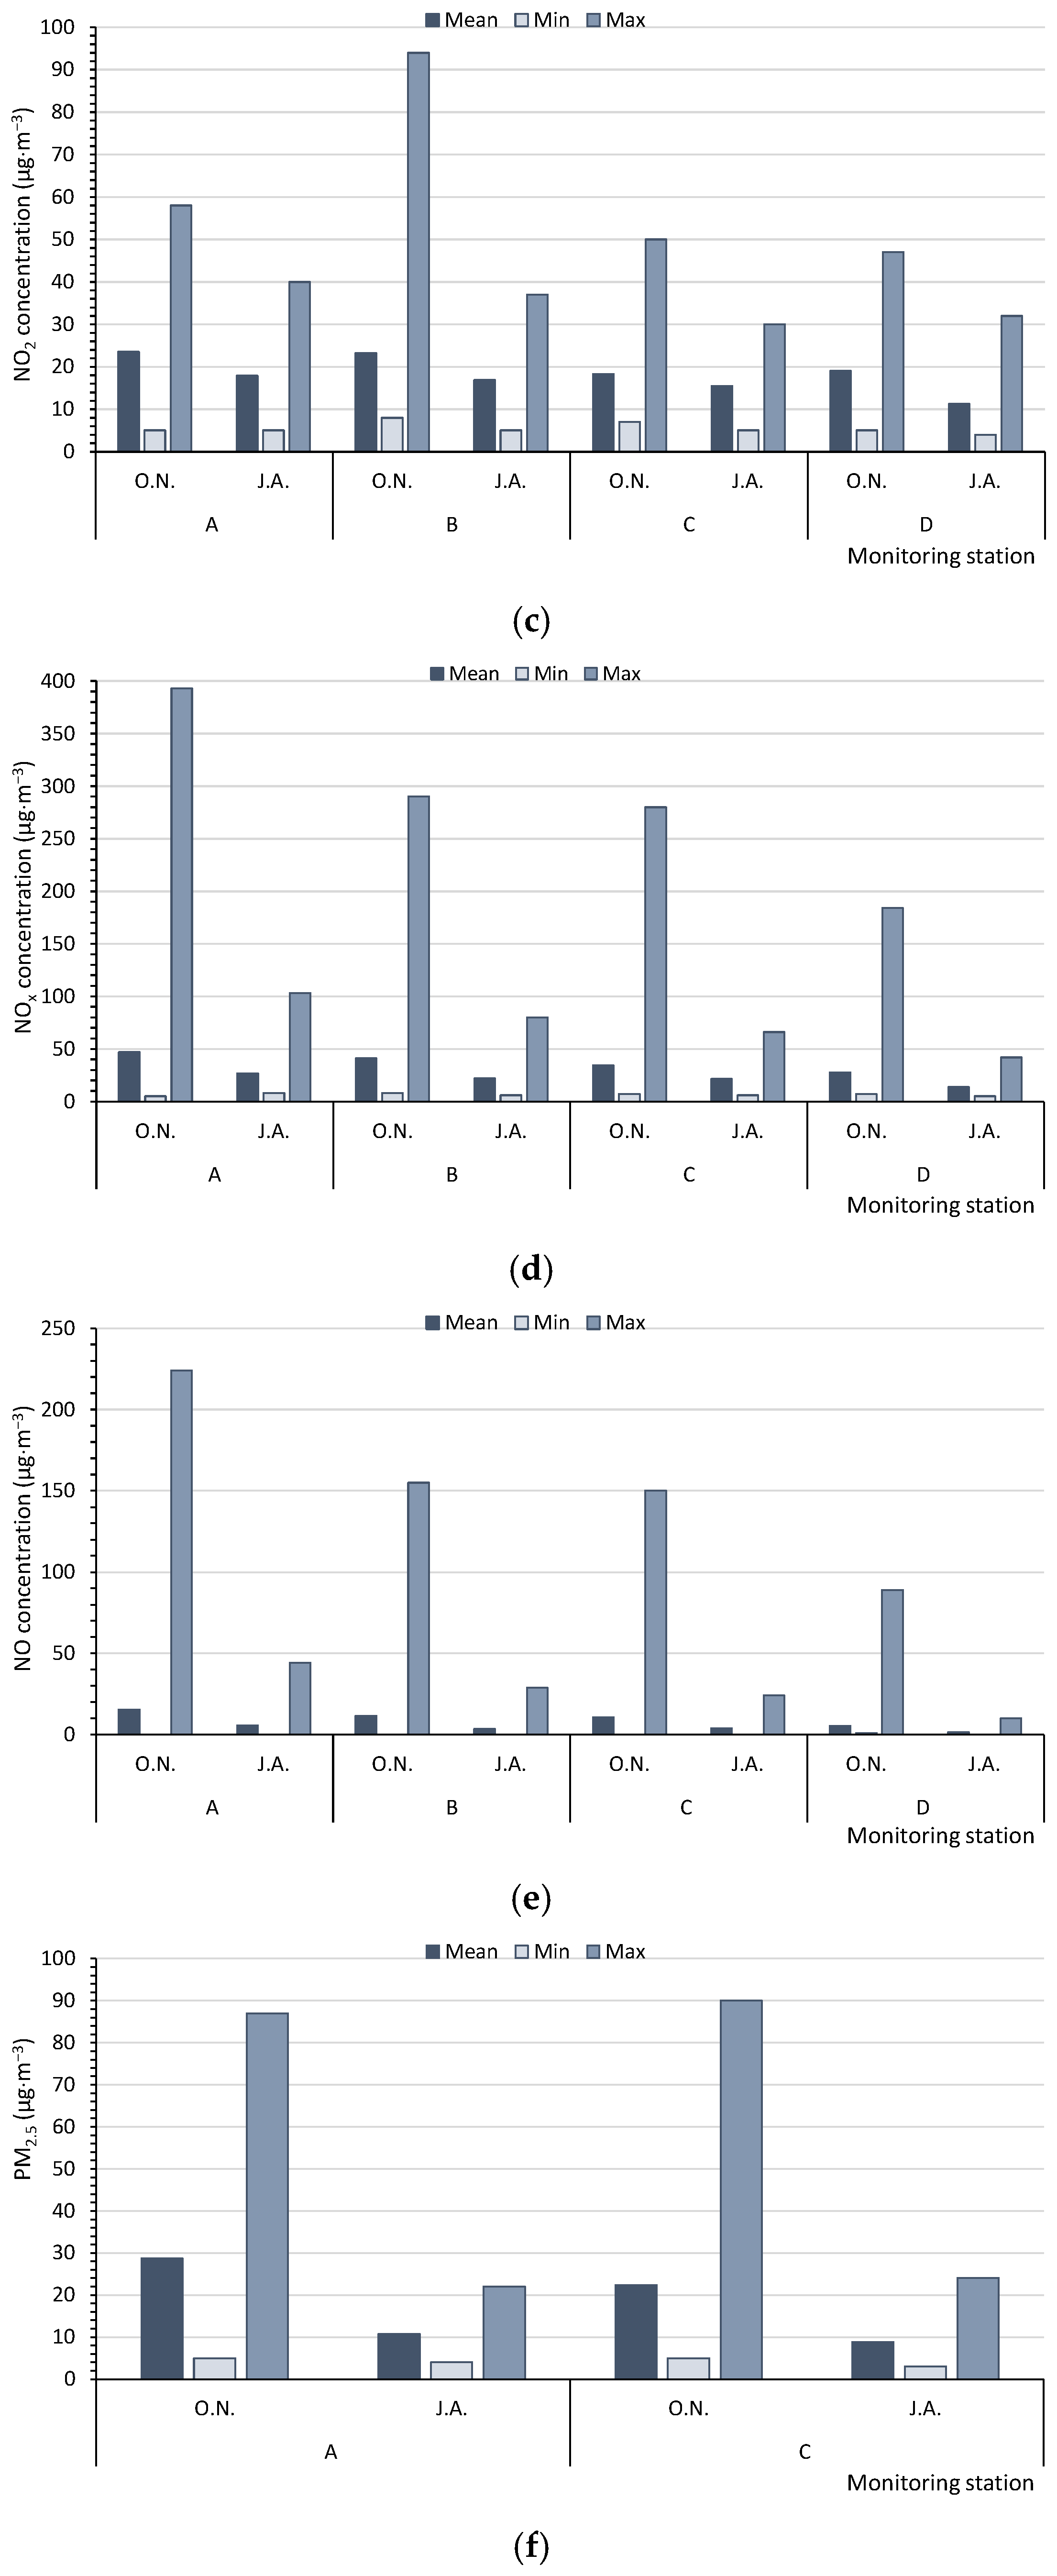
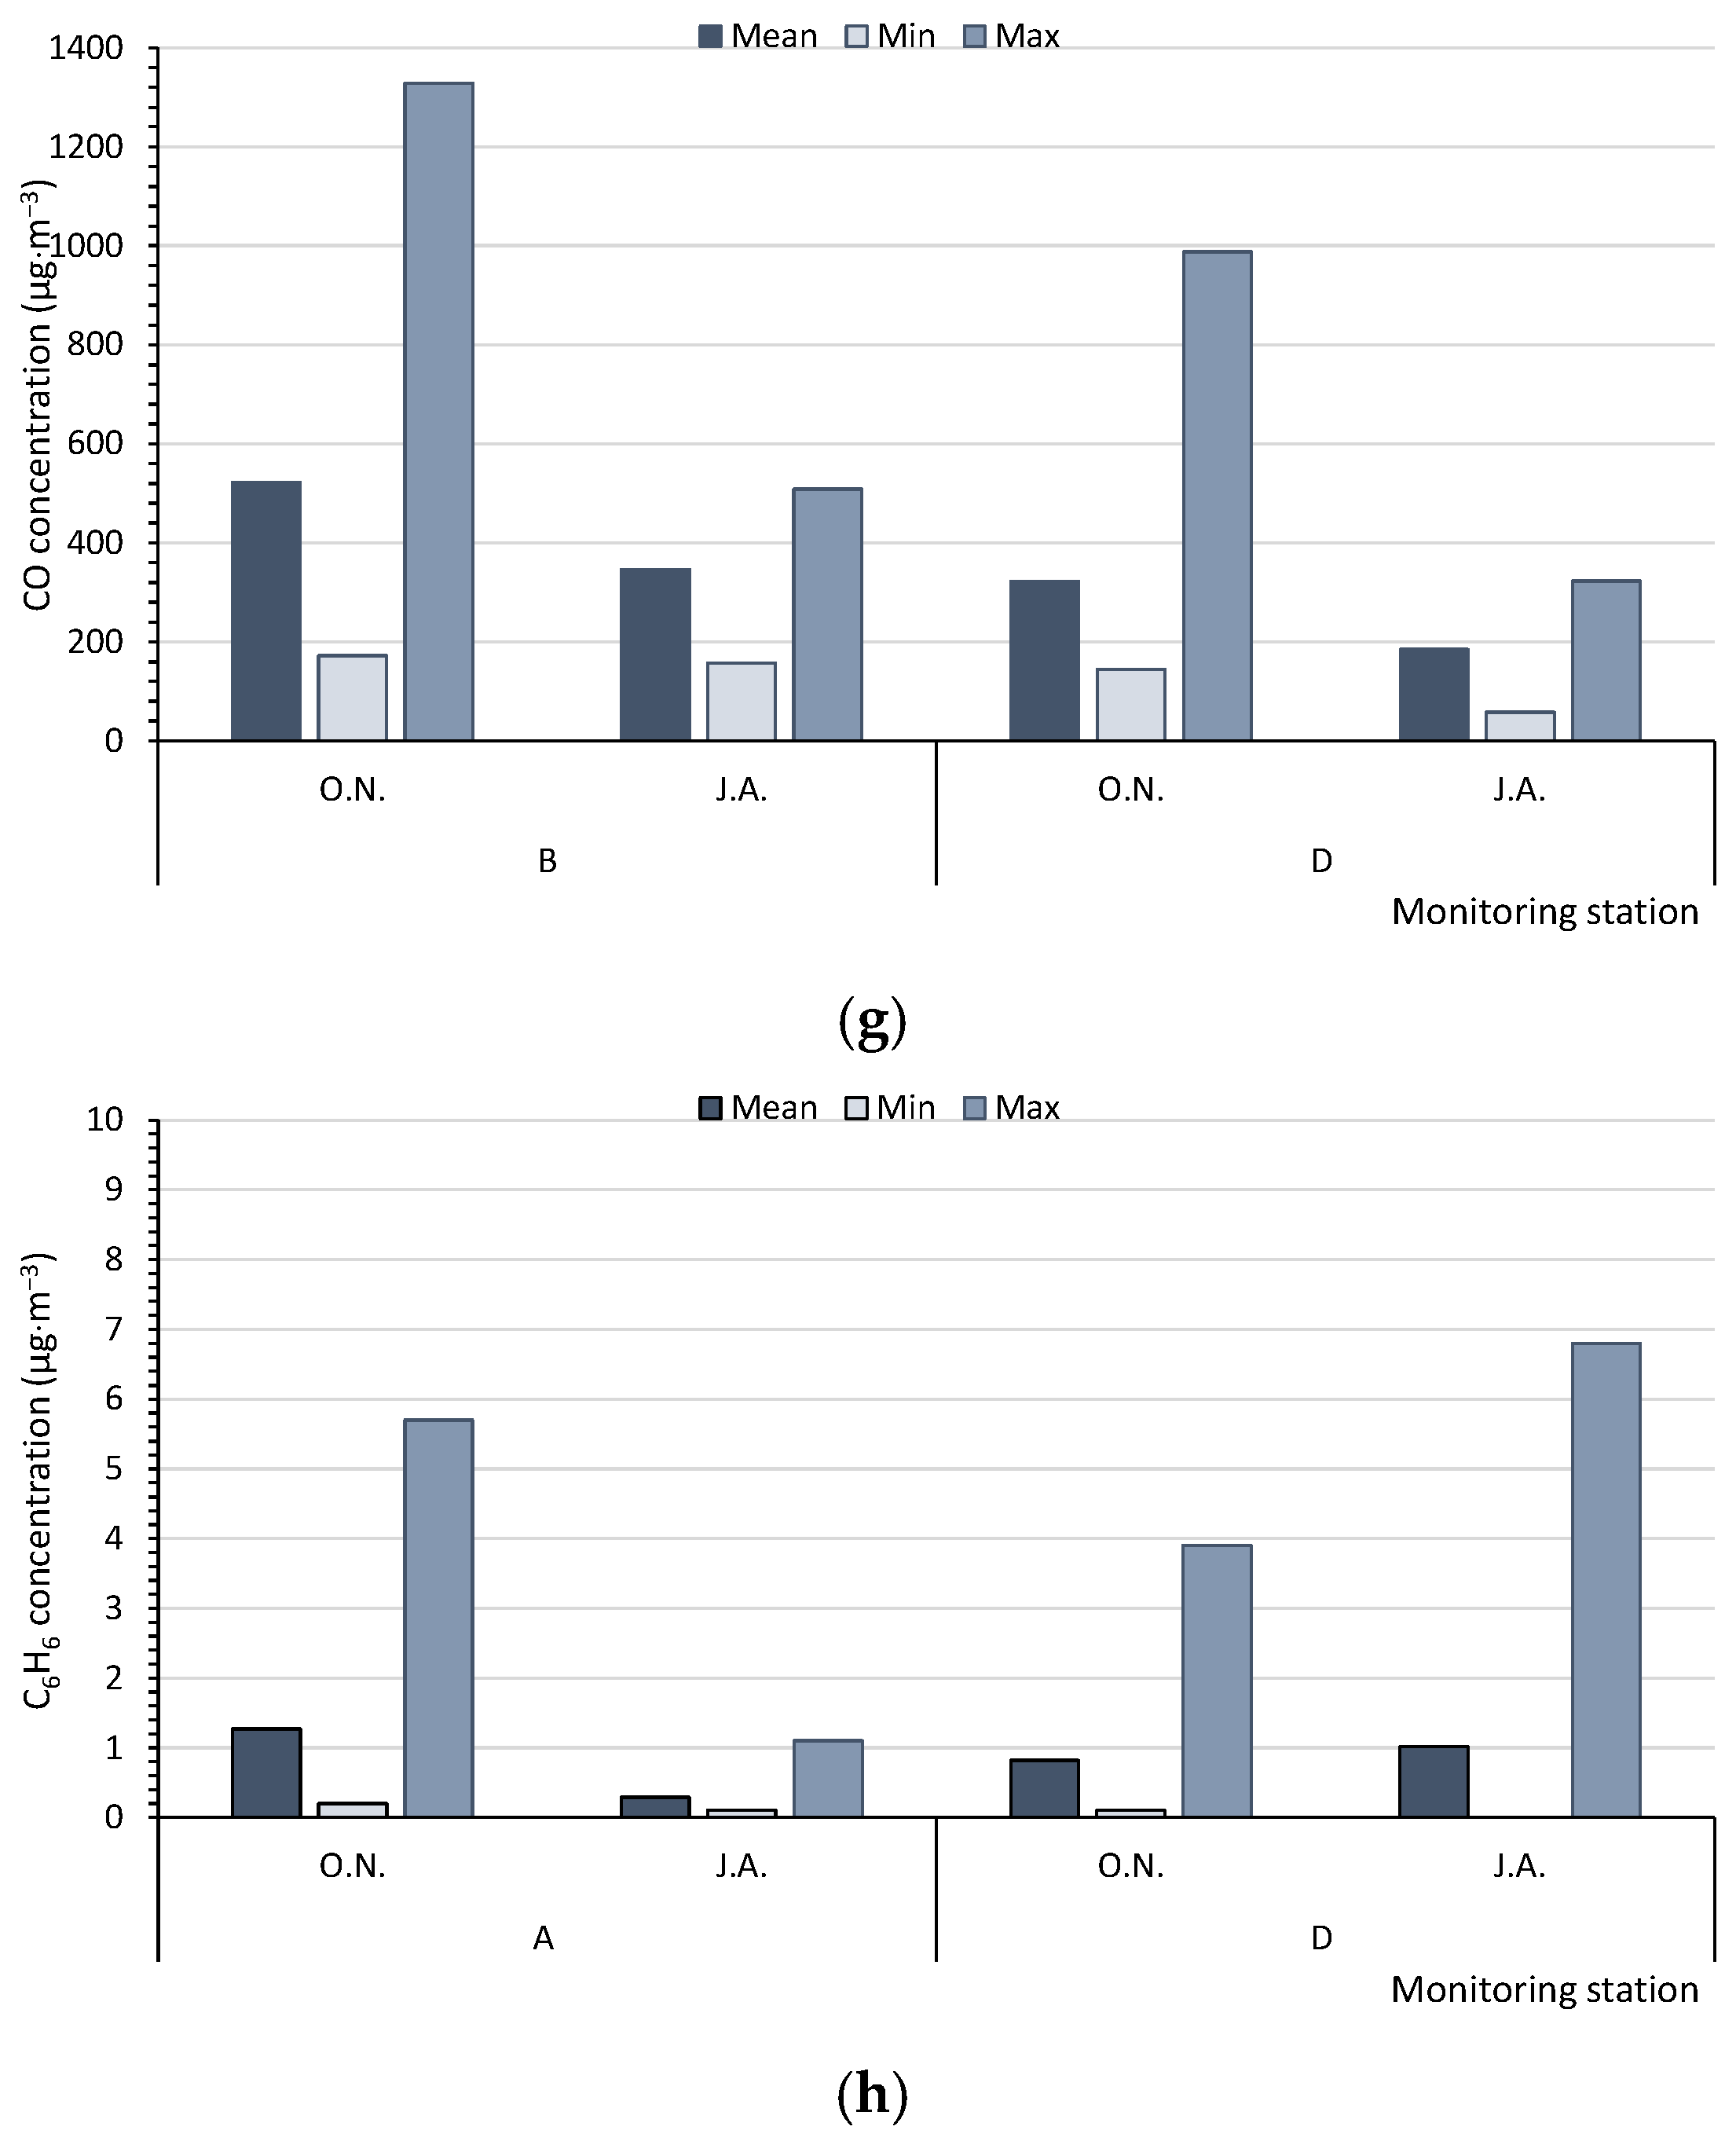
Based on the measurements of the monitoring stations, in summer (J.A.), the average concentrations of PM10 in the multiannual period (17.5–18.0 µg·m−3) and the maximum hourly values of PM10 (32.0–43.0 µg·m−3) for five monitoring stations (A, C, D, E, F) never reached the level of 50 µg·m−3. However, in autumn/winter (O.N.), the levels were significantly higher (average values: 24.8–32.8 µg·m−3, with maximum values of 75.0–126.0 µg·m−3). Therefore, in summer, the air quality could be regarded as very good [47], in contrast to a good quality at the beginning of the heating season (Figure 3a). The SO2 concentrations, measured by only two monitoring stations (A, D), were low, although they increased at the beginning of the heating season. In summer (J.A.), the average values of SO2 varied from 1.22 to 2.62 µg·m−3, with maximum values ranging from 3.7 to 4.8 µg·m−3. In October and November (O.N.), the respective values were 3.30 to 4.32 µg·m−3 and 5.8 to 9.8 µg·m−3; the air quality can be categorised as very good (Figure 3b). The concentrations of NO2, NOx, and NO were measured at four monitoring stations (A, B, C, D) (Figure 3c–e). The average concentrations of nitrogen compounds from the multiannual period and the maximum values were higher at the beginning of the heating season (O.N.). The highest differences between the average values in autumn/winter (O.N.) and summer (J.A.) were found for NO and NOx. The air quality index for NO2, based on the average values (11.2–23.5 µg·m−3), indicated a very good air quality (0–40 µg·m−3). The concentrations of PM2.5, CO, and C6H6 were only measured at two monitoring stations (Figure 3f–h). The mean, minimum, and maximum values of PM2.5 and CO were always higher at the beginning of the heating season (O.N.). For C6H6, at monitoring station A, the results were worse for the heating season, whereas at station D, they were worse for summer.
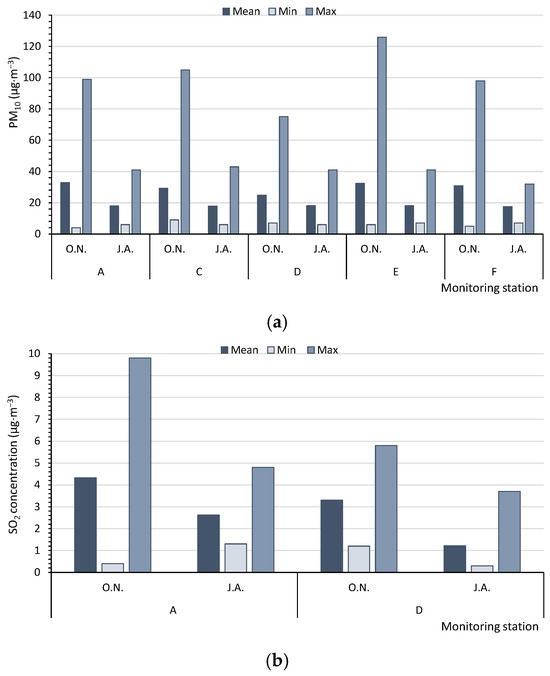
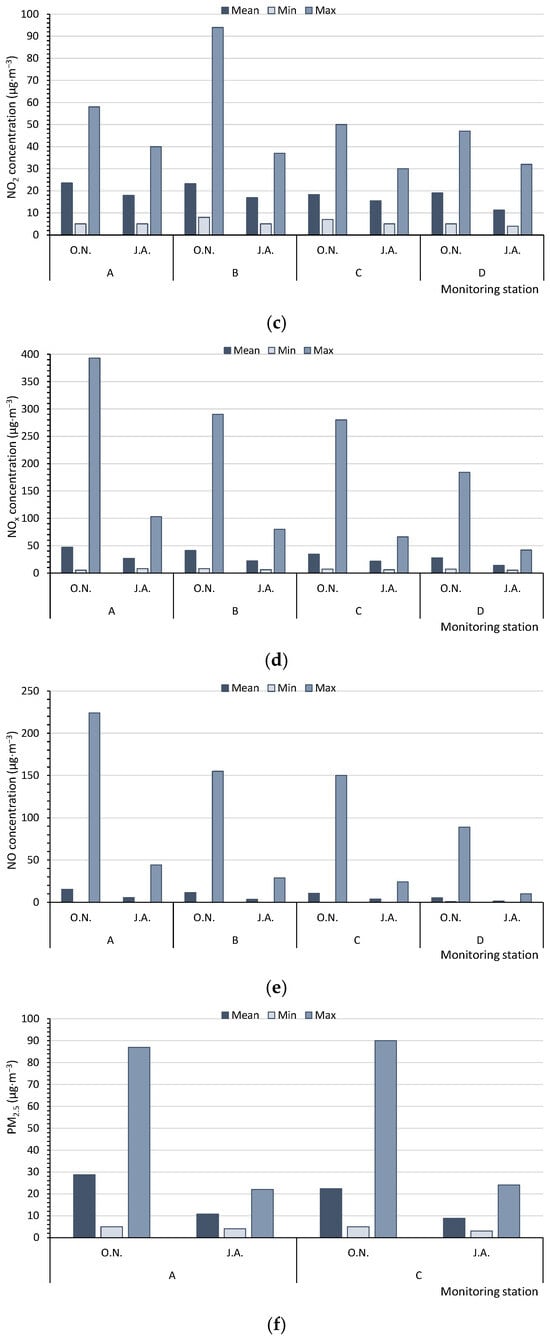

Figure 3.
Mean, minimum, and maximum values measured by the WIOS monitoring stations for (a) PM10, (b) SO2, (c) NO2, (d) NOx, (e) NO, (f) PM2.5, (g) CO, and (h) C6H6. The points A–F—the Regional Inspectorate of Environmental Protection (WIOS) station according to Figure 1. O.N.—Autumn period, October and November. J.A.—Summer period, July and August.
Air pollution was highest at the stations A, B, and E and lowest at D, C, and F. The following buildings were located in areas with the highest air quality: 4-SB, 5-SB, 8-SB, and 13-CRB (north-eastern part of the city), whereas in the centre of the city and in the vicinity of the buildings 2-RB, 3-CRB, 6-RB, 7-RB, 9-RB, 10-CRB, 11-CRB, and 12-CRB (southwestern part), the air quality was considerably lower (Figure 1). This was confirmed by the physical, chemical, and microbiological tests. The central and southwestern parts contain large clusters of older buildings equipped with coal-fired boilers. Additionally, those locations are characterised by dense street layouts and heavy traffic. The above factors might have a negative effect on the quality of air. The only tested building that was not compared with the values of WIOS was 1-RB, located 20 km from the city limits.
4. Discussion
Our publication presents an analysis of indoor and outdoor air quality at the microscale level. The results of our research provided valuable information regarding the assessment of selected air quality parameters in buildings depending on their usage. Additionally, potential causes of poor air quality in the analysed spaces were identified by complementing our own measurements with data analysis from local air monitoring stations in the city. Thirteen buildings were selected for analysis, where indoor air quality (IAQ) was assessed in selected rooms along with an evaluation of the outdoor environment.
Air quality can be assessed in various ways. The most frequent negative factors that impact the air quality are: the particulate matter size intervals ranging from 0.3 to 20 μm, formaldehydes, carbonyl compounds, volatile organic compounds, and other inorganic gases such as CO2, O3, SOx, NOx, and CO. Additionally, the variability of parameters affecting indoor environmental comfort is assessed, including air temperature (°C), relative humidity (%), presence of bioaerosols (CFU·m−3), and air exchange rate in the room [50,51]. In our work, we focused on bioaerosol and additionally assessed the physical and chemical quality of the external and internal air. We proposed novel indicators for assessing microbiological air pollution. Yang [52] evaluated the air quality in dormitories based on surveys and the monitoring of PM2.5 and ozone. Most of the surveyed students considered the quality of air in the apartments and outside as neutral, although we observed differences between outside and inside air in terms of ozone. During our tests, temperature and humidity in the apartments were within the required ranges, although the maximum values were frequently outside these ranges. Other authors [13,20,53] have found similar results.
Another important parameter is the carbon dioxide concentration, which is rarely close to the limits in health-based guidelines. In our study, in the investigated buildings, windows were sealed, and the rooms were only naturally ventilated; in many cases, the apartments had individual gas heating. Because of this, high CO2 levels were frequent, at times above 3100 ppm. The maximum values in all types of buildings remained between 1945 and 3233 ppm in the absence of other contributions such as combustion for food or heating, whereas outside, this range was 316 to 830 ppm (average 514 ppm).
Similar to CO2 concentrations, humans are the main source of microbial contamination. Due to the negative impact of bioaerosols on human health, it is necessary to control microorganisms present in the air. According to Polish standards, single measurements are sufficient to assess microbiological contamination. When analysing the microorganism concentration in indoor and outdoor air, the authors in publication [20] found I/O levels ranging from 1.66 to 4.19, depending on the type of ventilation in the office room, whereas in our tests, this ratio was generally higher. The number of people inhabiting the analysed apartments was similar, and therefore, this factor cannot explain the differences. In terms of size and taking under consideration the total area and total cubic volume of the given buildings, the largest buildings were the single-family buildings (with an area from 149.5 to 223.5 m2 and a volume from 404 to 556 m3) and the smallest ones were the dormitories (with an area from 19.8 to 30.6 m2 and a volume from 49 to 78 m3). In the dormitories, the windows were frequently unsealed, resulting in additional outdoor air ventilation (the students do not pay additionally for the heating of the apartments). Meanwhile, in the other apartments, most often because of heating fees, the windows were closed, resulting in less frequent ventilation. In this sense, the number of microorganisms present in bioaerosols is higher in apartments. Nevertheless, in both cases, it can be stated that the main source of bacterial aerosol was the indoor environment.
According to Grisoli [48], the global index of microbiological contamination of the air (GIMC·m−3) includes the numerous microorganisms existing in a vast range of temperatures. This index can therefore be used to assess the potential microbiological risk indoors and outdoors. Authors mainly considered ventilation, air conditioning, and heating systems in the different buildings and the number of people present in the apartments. They also analysed the degree of indoor and outdoor air pollution, showing that the indoor air is frequently higher polluted than outdoor air in terms of microbiological contamination. According to these authors, GIMC is a simple method to evaluate a potential biological risk in indoor and outdoor environments. Other studies [34,54] have shown the applicability of GIMC in other environments. In our study, we used the modified index of bacteria related to humans (IMSC) which, except for mesophilic bacteria, also contained Staphylococcus.
In previous studies [55,56,57,58], microbial air pollution depended on the presence of people in the room, their activities, as well as the cleanliness and the ventilation system. Kwan [57] related the inner emission sources of residential multi-family buildings with the ventilation systems and found that the dominating source of contamination is the resuspension of particulate matter (PM10), bacteria, and fungi. For this reason, indoor emission sources need to be controlled to avoid negative health impacts. The significant difference in the number of microorganisms between different floors might reflect the characteristics of the building, operation mode, and health and type of activity of the inhabitants. Downstairs, parts of the building were used all day, whereas upstairs, the bedrooms were located where a high concentration of Staphylococcus was found. Contamination was influenced by the functional arrangement of the building, with huge open spaces. In the other single-family buildings, the differences were not that pronounced. The authors of [59] stated that the microorganisms in the air can emit secondary metabolites such as the mycotoxins, endotoxins, enterotoxins, and enzymes, with negative impacts on human health. Among the fungi isolated from the air, the authors reported those causing diseases (Aspergillus spp., Rhizopus spp., Fusarium spp., and Candida spp.) and allergies (Alternaria spp., Acremonium spp., Cladosporium spp., and Penicillium spp.). The number of fungi was relatively low (up to 978 CFU·m−3 of air), and the microclimatic parameter was favourable (temperature from 22.3 to 24.5 °C and relative humidity from 35.5 to 49.2%). However, the health condition of the inhabitants might have an effect on the potential propagation of the microorganisms.
In article [60], the gradients of urban pollutants in space and time were linked to meteorological variables, local emission sources, pedestrian flows, and population distribution, demonstrating the need for a detailed description of specific variables relevant at the microscale level. This type of solution in the article by Borge was presented [61], focusing on an area with high traffic intensity and the presence of green areas. In our publication, an analysis of indoor and outdoor air quality at the microscale level was shown. Similar results are presented in publication [17]. Analysing the measurement results at the WIOS stations, one can notice increased outdoor air pollution during the autumn–winter period. This is also confirmed by research presented in the works of other authors. They indicated that suspended dust concentrations increase during the heating season [62,63], leading to an increase in particulate matter concentrations in enclosed spaces [64]. Improving indoor air quality is not only about purifying indoor air through the use of local air purifiers or mechanical ventilation systems but also about seeking solutions to improve outdoor air quality in highly polluted cities. Examples of this can be found in studies conducted in Taiwan [65] and in China [66].
5. Conclusions
Based on the analysis conducted, it can be concluded that interactions between the methodological parameters and the environment of the indoor and outdoor quality are not static, and their nature and strength change over time and space. In this context, activities focused on those analysis become important. The analyses and conclusions drawn from them will be of increasing importance in establishing general design regulations and guidelines on a global scale.
Based on the results of our research and conducted comparative analyses:
- In the city of Poznań, the degree of outdoor air contamination varies. In the north-eastern part, pollution is lower than in the central and south-western parts, with significant impacts on indoor air quality.
- Among the analysed parameters regarding IAQ, except for basic physical and chemical pollutants (temperature, relative humidity, carbon dioxide concentration), microbiological parameters are important (number of bacteria and microscopic fungi), which should be taken in the evaluation.
- IAQ described by physical and chemical parameters, and microbiological contamination are impacted by building size, building age, building material, ventilation system, interior fittings, and the number of inhabitants.
- Outdoor air pollution has a different effect on IAQ depending on the type of building.
- The degree of microbial air contamination in older buildings depends on the microscopic fungi.
- Depending on the location of the building in the Poznań city, the microbiological air quality varies.
- Microbial indoor air quality was better in single-family buildings due to their large cubic volume.
- Because the main source of microbial contamination and the increase in CO2 concentration in the room is humans, lack of continuous ventilation or insufficient periodical ventilation in apartments may result in increased physical and microbiological air contamination. Our tests were carried out in different rooms with different methods of their exploitation (windows with different tightness, open or closed).
- At high pollution levels of the outside air, balanced mechanical ventilation with filters should be used.
- Standard assessment indicators (physical air quality) should be supplemented with microbiological tests that indicate the degree and source of contamination.
- In rooms of good physical quality IAQ, the microbiological contamination requirements were not met.
- A similar physical, chemical, and microbiological contamination of the external and internal air may occur not only in Poznań, but also in every city in the world.
Limitations
- According to Polish standards, only single measurements are used to assess microbiological contamination.
- In subsequent studies, a specific statistical analysis (e.g., ANOVA, Kruskal–Wallis) should be carried out to test for differences between building types in terms of microbiological and physical parameters and correlation coefficients (e.g., Spearman’s, Pearson’s) between physical parameters (CO2 concentration, temperature, relative humidity) and microbiological contamination (e.g., total bacterial or fungal counts).
- To confirm the conclusions presented, long-term monitoring across seasons should be carried out.
- The results presented are for a limited sample size, and the evaluation method presented can be used in larger-scale studies.
Author Contributions
Conceptualisation, M.B. and M.M.; methodology, M.B. and M.M.; software, M.B.; validation, M.B.; formal analysis, M.B. and M.M.; investigation, M.B. and M.M.; resources, M.B.; data curation, M.B.; writing—original draft preparation, M.B. and M.M.; writing—review and editing, M.B.; visualization, M.B. All authors have read and agreed to the published version of the manuscript.
Funding
This research was funded by the Poznan University of Technology under grant number 0713/SBAD/0991.
Institutional Review Board Statement
Not applicable.
Informed Consent Statement
Not applicable.
Data Availability Statement
All data generated or analysed during this study are included in this published article.
Conflicts of Interest
The authors declare no conflicts of interest.
Appendix A
Appendix A.1
Table A1.
Building characteristics and localities of the measurement points.
Table A1.
Building characteristics and localities of the measurement points.
| Type | Year of Construction | No. of Floors | External Wall Structure | Heating System | No. of Measurement Point | Room Volume [m3] |
|---|---|---|---|---|---|---|
| 1-RB | 1904 | 4 | brick | TS and EH | 1 2 3 * | 58.5 10.8 |
| 2-RB | 1977 | 11 | slab | DH | 4 5 6 * | 46.7 19.0 |
| 3-CRB | 1976 | 11 | brick | DH | 7 8 9 * | 29.7 11.2 |
| 4-SB | 1996/extension 2011 | 2 | timber and brick | KGB | 10 11 12 13 * | 58.5 48.1 37.5 |
| 5-SB | 1960 | 2 | brick | KGB | 14 15 16 17 * | 61.6 24.6 119.0 |
| 6-RB | 1942–43 | 4 | brick | DH | 18 19 20 21 * | 57.1 30.1 41.6 |
| 7-RB | 1978 | 12 | slab | DH | 22 23 24 25 * | 45.0 20.5 26.7 |
| 8-SB | 1993 | 2 | brick | KGB | 26 27 28 * | 103.2 24.7 |
| 9-RB | 1970 | 5 | brick | DH | 29 30 31 * | 41.9 23.1 |
| 10-CRB | 1966 | 4 | brick | DH | 32 35 * | 60.0 |
| 11-CRB | 1964 | 4 | brick | DH | 33 35 * | 51.0 |
| 12-CRB | 1976 | 11 | brick | DH | 34 35 * | 30.0 |
| 13-CRB | 1975 | 11 | brick | DH | 36 37 38 * | 34.2 9.3 |
*—outdoor measurement points (background tests).
Appendix A.2
Table A2.
Numbers of bacteria and microscopic fungi, (CFU·m−3).
Table A2.
Numbers of bacteria and microscopic fungi, (CFU·m−3).
| No. of Measurement Point | Bacteria, (CFU·m−3) | Fungi, (CFU·m−3) | ||||||
|---|---|---|---|---|---|---|---|---|
| Mes. | SM+ | SM− | Psy. | P. flu. | Actin. | Cz-D | Waks. | |
| 1 | 1320 | 115 | 335 | 1280 | 0 | 140 | 2760 | 9940 |
| 2 | 3760 | 130 | 1360 | 3720 | 0 | 170 | 1750 | 2820 |
| 3 * | 1040 | 45 | 350 | 860 | 180 | 290 | 1240 | 2600 |
| 4 | 260 | 10 | 60 | 200 | 10 | 0 | 580 | 320 |
| 5 | 280 | 10 | 40 | 260 | 0 | 0 | 480 | 320 |
| 6 * | 180 | 100 | 10 | 2940 | 30 | 20 | 13,900 | 12,360 |
| 7 | 1000 | 60 | 270 | 2560 | 30 | 0 | 8440 | 4040 |
| 8 | 1080 | 80 | 540 | 2080 | 0 | 10 | 7960 | 7080 |
| 9 * | 560 | 90 | 90 | 2360 | 10 | 0 | 6960 | 7840 |
| 10 | 5380 | 135 | 2235 | 4740 | 0 | 0 | 780 | 1220 |
| 11 | 7520 | 155 | 4330 | 8040 | 0 | 0 | 580 | 800 |
| 12 | 7520 | 110 | 2830 | 5480 | 0 | 0 | 2200 | 600 |
| 13 * | 40 | 20 | 5 | 440 | 0 | 20 | 1240 | 1820 |
| 14 | 16,640 | 325 | 2540 | 8120 | 10 | 60 | 1280 | 1140 |
| 15 | 2060 | 90 | 655 | 2520 | 5 | 0 | 580 | 860 |
| 16 | 4520 | 135 | 1575 | 5000 | 0 | 60 | 3640 | 5760 |
| 17 * | 140 | 25 | 30 | 720 | 0 | 60 | 2160 | 3160 |
| 18 | 4940 | 105 | 1735 | 4880 | 0 | 0 | 460 | 420 |
| 19 | 7600 | 90 | 3230 | 5400 | 0 | 0 | 440 | 480 |
| 20 | 7480 | 55 | 2140 | 4440 | 0 | 0 | 280 | 460 |
| 21 * | 440 | 15 | 10 | 1000 | 0 | 20 | 580 | 720 |
| 22 | 7560 | 95 | 1025 | 4920 | 10 | 0 | 340 | 680 |
| 23 | 6360 | 155 | 1280 | 3000 | 15 | 0 | 240 | 420 |
| 24 | 5100 | 165 | 1760 | 3280 | 5 | 0 | 240 | 420 |
| 25 * | 360 | 20 | 100 | 320 | 5 | 20 | 420 | 780 |
| 26 | 80 | 10 | 10 | 160 | 0 | 0 | 1120 | 1800 |
| 27 | 120 | 20 | 20 | 160 | 0 | 0 | 1600 | 800 |
| 28 * | 80 | 20 | 10 | 400 | 0 | 0 | 3160 | 3280 |
| 29 | 400 | 20 | 70 | 400 | 0 | 0 | 120 | 140 |
| 30 | 340 | 50 | 60 | 80 | 0 | 0 | 100 | 140 |
| 31 * | 200 | 10 | 10 | 280 | 0 | 10 | 740 | 800 |
| 32 | 3360 | 120 | 820 | 2200 | 5 | 0 | 140 | 740 |
| 33 | 7760 | 525 | 1490 | 4780 | 10 | 0 | 3120 | 1040 |
| 34 | 5960 | 50 | 675 | 3800 | 5 | 80 | 3200 | 1220 |
| 35 * | 40 | 10 | 100 | 400 | 0 | 0 | 940 | 800 |
| 36 | 600 | 50 | 70 | 680 | 0 | 0 | 520 | 720 |
| 37 | 3880 | 60 | 4870 | 5080 | 0 | 0 | 1280 | 1880 |
| 38 * | 3160 | 40 | 470 | 7400 | 0 | 0 | 1800 | 1560 |
Mes.—mesophilic bacteria; SM+—Staphylococcus mannitol-positive; SM−–– Staphylococcus mannitol-negative; Psy.—psychrophilic bacteria; P. flu.—Pseudomonas fluorescens; Actin.—Actinobacteria; Cz-D—microscopic fungi in Czapek-Dox medium; Waks.—microscopic fungi in Waksman medium. *—outdoor measurement points (background tests).
Appendix A.3
Table A3.
Results of the physical air measurements.
Table A3.
Results of the physical air measurements.
| No. of Measurement Point | CO2 (ppm) | Relative Humidity (%) | Temperature (°C) | |||
|---|---|---|---|---|---|---|
| M SD | Max Min | M SD | Max Min | M SD | Max Min | |
| 1 | 371 91.3 | 689 273 | 72.7 2.06 | 77.9 61.4 | 19.8 0.26 | 22.3 19.3 |
| 2 | 414 68.0 | 674 304 | 73.7 2.04 | 78.2 66.8 | 19.5 0.18 | 20.2 19.2 |
| 3 * | 680 31.4 | 830 619 | 84.4 8.13 | 95.7 64.7 | 16.2 2.79 | 21.5 11.7 |
| 4 | 810 6.4 | 821 806 | 48.6 0.85 | 49.9 47.9 | 22.2 0.16 | 22.4 22.0 |
| 5 | 863 14.4 | 883 848 | 47.5 0.99 | 48.9 46.4 | 22.5 0.16 | 22.7 22.3 |
| 6 * | 343 3.3 | 348 340 | 83.2 0.62 | 84.1 82.6 | 16.4 0.19 | 16.6 16.2 |
| 7 | 536 5.3 | 542 530 | 43.5 1.03 | 44.8 42.3 | 22.5 0.10 | 22.6 22.4 |
| 8 | 534 4.5 | 540 528 | 43.3 0.75 | 44.6 42.8 | 24.3 0.20 | 24.5 24.1 |
| 9 * | 318 3.5 | 324 316 | 45.2 0.75 | 46.4 44.5 | 16.6 0.10 | 16.7 16.5 |
| 10 | 758 165.6 | 1091 414 | 58.3 1.98 | 69.8 53.8 | 22.7 0.83 | 24.8 20.8 |
| 11 | 795 166.0 | 1200 430 | 65.4 2.32 | 75.3 58.9 | 21.2 0.62 | 22.5 20.3 |
| 12 | 861 239.8 | 1507 429 | 62.4 3.95 | 86.9 53.6 | 23.0 0.43 | 24.1 22.4 |
| 13 * | 531 23.8 | 794 484 | 89.8 10.12 | 100.0 63.9 | 13.0 2.10 | 17.1 8.9 |
| 14 | 678 148.3 | 1323 509 | 51.4 4.34 | 60.6 39.7 | 22.7 1.02 | 25,0 21.3 |
| 15 | 1019 323.2 | 1945 642 | 67.6 4.12 | 74.7 59.1 | 19.9 0.77 | 21.4 18.7 |
| 16 | 504 44.50 | 790 433 | 78.1 3.02 | 81.8 67.9 | 16.6 0.16 | 17.0 16.3 |
| 17 * | 588 28.07 | 678 487 | 86.0 14.96 | 99.6 39.5 | 7.3 3.02 | 17.0 0.7 |
| 18 | 1495 403 | 3133 831 | 60.2 2.91 | 87.1 51.7 | 21.2 0.59 | 23.1 20.0 |
| 19 | 1302 335.2 | 2984 710 | 54.6 2.59 | 65.0 49.4 | 21.7 0.48 | 23.0 20.8 |
| 20 | 1385 303.2 | 2455 695 | 59.2 2.74 | 71.9 50.0 | 22.0 0.34 | 23.2 20.1 |
| 21 * | 589 39.7 | 687 497 | 81.1 12.14 | 95.4 45.7 | 7.4 3.48 | 16.5 1.7 |
| 22 | 902 344.4 | 2505 441 | 60.0 6.22 | 73.0 48.2 | 19.8 0.55 | 21.9 17.7 |
| 23 | 1151 726.1 | 2957 522 | 60.8 3.48 | 70.6 55.5 | 20.6 0.45 | 22.0 19.2 |
| 24 | 1352 677.7 | 3133 456 | 64.0 4.63 | 73.6 56.9 | 19.9 0.51 | 20.9 18.1 |
| 25 * | 600 36.7 | 714 467 | 86.4 15.27 | 100.0 24.5 | 8.7 3.28 | 21.7 1.9 |
| 26 | 478 10.3 | 493 469 | 49.4 0.04 | 49.5 49.4 | 21.5 0.04 | 21.6 21.5 |
| 27 | 564 2.4 | 568 562 | 52.7 0.29 | 53.2 52.5 | 20.9 0.07 | 21.0 20.8 |
| 28 * | 372 1.6 | 374 370 | 93.1 1.16 | 94.2 91.3 | 9.9 0.04 | 10.0 9.9 |
| 29 | 673 6.3 | 683 667 | 76.0 1.41 | 78.0 75.0 | 19.0 0.10 | 19.1 18.9 |
| 30 | 713 6.0 | 722 707 | 71.1 1.53 | 73.8 70.1 | 20.0 0.73 | 21.0 19.2 |
| 31 * | 448 2.9 | 451 444 | 71.7 1.07 | 72.9 70.4 | 9.3 0.14 | 9.5 9.2 |
| 32 | 1392 714.3 | 2983 485 | 51.7 5.84 | 62.3 36.9 | 23.9 0.77 | 25.7 21.5 |
| 33 | 2103 706.7 | 2960 531 | 61.2 4.99 | 70.3 43.5 | 24.1 0.71 | 25.5 18.1 |
| 34 | 1819 910.8 | 3133 490 | 46.2 6.09 | 59.2 34.6 | 25.0 0.79 | 26.4 21.5 |
| 35 * | 638 10.1 | 744 590 | 95.8 3.01 | 100.0 85.6 | 4.1 0.72 | 5.6 2.9 |
| 36 | 1217 501.5 | 2145 517 | 43.9 5.72 | 59.8 37.2 | 21.8 0.74 | 22.9 20.1 |
| 37 | 1027 505.9 | 1993 462 | 43.7 6.42 | 60.4 35.1 | 22.7 1.11 | 24.7 21.4 |
| 38 * | 551 5.8 | 560 536 | 81.6 1.96 | 84.5 75.5 | 4.1 0.95 | 6.5 2.6 |
*—external air; M—mean; SD—standard deviation; Min—minimum value; Max—maximum value.
References
- Brągoszewska, E.; Biedroń, I.; Kozielska, B.; Pastuszka, J.S. Microbiological indoor air quality in an office building in Gliwice, Poland: Analysis of the case study. Air Qual. Atmos. Health 2018, 11, 729–740. [Google Scholar] [CrossRef]
- Brągoszewska, E.; Palmowska, A.; Biedroń, I. Investigation of indoor air quality in the ventilated ice rink arena. Atmos. Pollut. Res. 2020, 11, 903–908. [Google Scholar] [CrossRef]
- Dimitroulopoulou, C. Ventilation in European dwellings: A review. Build. Environ. 2012, 47, 109–125. [Google Scholar] [CrossRef]
- Madsen, A.M.; Moslehi-Jenabian, S.; Islam, M.Z.; Frankel, M.; Spilak, M.; Frederiksen, M.W. Concentrations of Staphylococcus species in indoor air as associated with other bacteria, season, relative humidity, air change rate, and S. aureus-positive occupants. Environ. Res. 2018, 160, 282–291. [Google Scholar] [CrossRef]
- Al Horr, Y.; Arif, M.; Kaushik, A.; Mazroei, A.; Katafygiotou, M.; Elsarrag, E. Occupant productivity and office indoor environment quality: A review of the literature. Build. Environ. 2016, 105, 369–389. [Google Scholar] [CrossRef]
- Asadi, I.; Mahyuddin, N.; Shafigh, P. A review on Indoor Environmental Quality (IEQ) and energy consumption in Building based on occupant behaviour. Facilities 2017, 35, 684–695. [Google Scholar] [CrossRef]
- Geng, Y.; Ji, W.; Lin, B.; Zhu, Y. The impact of thermal environment on occupant IEQ perception and productivity. Build. Environ. 2017, 121, 158–167. [Google Scholar] [CrossRef]
- Niu, R.P.; Chen, X.; Liu, H. Analysis of the impact of a fresh air system on the indoor environment in office buildings. Sustain. Cities Soc. 2022, 83, 103934. [Google Scholar] [CrossRef]
- World Health Organization. The World Health Report 2002. Reducing Risks, Promoting Healthy Life; World Health Organization: Geneva, Switzerland, 2002. [Google Scholar]
- Basińska, M.; Michałkiewicz, M.; Ratajczak, K. Impact of physical and microbiological parameters on proper indoor air quality in nursery. Environ. Int. 2019, 132, 105098. [Google Scholar] [CrossRef]
- Aganovic, A.; Hamon, M.; Kolarik, J.; Cao, G. Indoor air quality in mechanically ventilated residential dwellings/low-rise buildings: A review of existing information. In Proceedings of the 38th AIVC Conference, Nottingham, UK, 13–14 September 2017. [Google Scholar]
- Azuma, K.; Uchiyama, I.; Uchiyama, S.; Kunugita, N. Assessment of inhalation exposure to indoor air pollutants: Screening for health risks of multiple pollutants in Japanese dwellings. Environ. Res. 2016, 145, 39–49. [Google Scholar] [CrossRef]
- Mfarrej, M.F.B.; Qafisheh, N.A.; Bahloul, M.M. Investigation of Indoor Air Quality inside Houses From UAE. Air Soil Water Res. 2020, 13. [Google Scholar] [CrossRef]
- Park, H.S.; Ji, C.; Hong, T. Methodology for assessing human health impacts due to pollutants emitted from building materials. Build. Environ. 2016, 95, 133–144. [Google Scholar] [CrossRef]
- Persily, A.; de Jonge, L. Carbon dioxide generation rates for building occupants. Indoor Air 2017, 27, 868–879. [Google Scholar] [CrossRef] [PubMed]
- Suzuki, N.; Nakaoka, H.; Hanazato, M.; Nakayama, Y.; Tsumura, K.; Takaya, K.; Todaka, E.; Mori, C. Indoor Air Quality Analysis of Newly Built Houses. Int. J. Environ. Res. Public Health 2019, 16, 4142. [Google Scholar] [CrossRef] [PubMed]
- Basińska, M.; Ratajczak, K.; Michałkiewicz, M.; Fuć, P.; Siedlecki, M. The Way of Usage and Location in a Big City Agglomeration as Impact Factors of the Nurseries Indoor Air Quality. Energies 2021, 14, 7534. [Google Scholar] [CrossRef]
- Polish Law: No 75, Item 690, Regulation of Minister of Infrastructure on the Technical Condition That Should Be Met by Buildings and Their Location. Warsaw: 2002. Available online: https://isap.sejm.gov.pl/isap.nsf/search.xsp?status=O&year=2002&volume=75&position=690 (accessed on 25 December 2019). (In Polish)
- ASHRAE 62-1-2019; Ventilation for Acceptable Indoor Air Quality. American Society of Heating, Refrigerating and Air-Conditioning Engineers (ASHRAE): Norcross, GA, USA, 2019.
- Brągoszewska, E.; Biedroń, I. Indoor Air Quality and Potential Health Risk Impacts of Exposure to Antibiotic Resistant Bacteria in Office Rooms in Southern Poland. Int. J. Environ. Res. Public Health 2018, 15, 2604. [Google Scholar] [CrossRef]
- Cetin, M.; Sevik, H. Measuring the Impact of Selected Plants on Indoor CO2 Concentrations. Pol. J. Environ. Stud. 2016, 25, 973–979. [Google Scholar] [CrossRef]
- Kozdrój, J.; Frączek, K.; Ropek, D. Assessment of bioaerosols in indoor air of glasshouses located in a botanical garden. Build. Environ. 2019, 166, 106436. [Google Scholar] [CrossRef]
- Cummings, L.E.; Stewart, J.D.; Kremer, P.; Shakya, K.M. Predicting citywide distribution of air pollution using mobile monitoring and three-dimensional urban structure. Sustain. Cities Soc. 2022, 76, 103510. [Google Scholar] [CrossRef]
- Nemitz, E.; Vieno, M.; Carnell, E.; Fitch, A.; Steadman, C.; Cryle, P.; Holland, M.; Morton, R.D.; Hall, J.; Mills, G.; et al. Potential and limitation of air pollution mitigation by vegetation and uncertainties of deposition-based evaluations. Philos. Trans. R. Soc. A Math. Phys. Eng. Sci. 2020, 378, 20190320. [Google Scholar] [CrossRef]
- Chen, L.; Liu, C.; Zou, R.; Yang, M.; Zhang, Z. Experimental examination of effectiveness of vegetation as bio-filter of particulate matters in the urban environment. Environ. Pollut. 2016, 208, 198–208. [Google Scholar] [CrossRef] [PubMed]
- Xing, Y.; Brimblecombe, P. Role of vegetation in deposition and dispersion of air pollution in urban parks. Atmos. Environ. 2019, 201, 73–83. [Google Scholar] [CrossRef]
- Green, B.J.; Tovey, E.R.; Sercombe, J.K.; Blachere, F.M.; Beezhold, D.H.; Schmechel, D. Airborne fungal fragments and allergenicity. Med. Mycol. 2006, 44, 245–255. [Google Scholar] [CrossRef]
- Kim, J.L.; Elfman, L.; Mi, Y.; Wieslander, G.; Smedje, G.; Norbäck, D. Indoor molds, bacteria, microbial volatile organic compounds and plasticizers in schools e associations with asthma and respiratory symptoms in pupils. Indoor Air 2007, 17, 153–163. [Google Scholar] [CrossRef] [PubMed]
- Spilak, M.P.; Madsen, A.M.; Knudsen, S.M.; Kolarik, B.; Hansen, E.W.; Frederiksen, M.; Gunnarsen, L. Impact of dwelling characteristics on concentrations of bacteria, fungi, endotoxin and total inflammatory potential in settled dust. Build. Environ. 2015, 93, 64–71. [Google Scholar] [CrossRef]
- Stewart, J.D.; Shakya, K.M.; Bilinski, T.; Wilson, J.W.; Ravi, S.; Choi, C.S. Variation of near surface atmosphere microbial communities at an urban and a suburban site in Philadelphia, PA, USA. Sci. Total. Environ. 2020, 724, 138353. [Google Scholar] [CrossRef]
- Tischer, C.; Chen, C.-M.; Heinrich, J. Association between domestic mould and mould components, and asthma and allergy in children: A systematic review. Eur. Respir. J. 2011, 38, 812–824. [Google Scholar] [CrossRef] [PubMed]
- Adams, R.I.; Bhangar, S.; Dannemiller, K.C.; Eisen, J.A.; Fierer, N.; Gilbert, J.A.; Green, J.L.; Marr, L.C.; Miller, S.L.; Siegel, J.A.; et al. Ten questions concerning the microbiomes of buildings. Build. Environ. 2016, 109, 224–234. [Google Scholar] [CrossRef]
- Eltzov, E.; De Cesarea, A.L.; Low, Y.K.A.; Marks, R.S. Indoor air pollution and the contribution of biosensors. EuroBiotech J. 2019, 3, 19–31. [Google Scholar] [CrossRef]
- Grisoli, P.; Rodolfi, M.; Chiara, T.; Zonta, L.A.; Dacarro, C. Evaluation of microbiological air quality and of microclimate in university classrooms. Environ. Monit. Assess. 2012, 184, 4171–4180. [Google Scholar] [CrossRef]
- Gao, R.; Zhang, H.; Li, A.; Wen, S.; Du, W.; Deng, B. A new evaluation indicator of air distribution in buildings. Sustain. Cities Soc. 2020, 53, 101836. [Google Scholar] [CrossRef]
- Hospodsky, D.; Qian, J.; Nazaroff, W.W.; Yamamoto, N.; Bibby, K.; Rismani-Yazdi, H.; Peccia, J. Human occupancy as a source of indoor airborne bacteria. PLoS ONE 2012, 7, e34867. [Google Scholar] [CrossRef] [PubMed]
- Peccia, J.; Kwan, S.E. Buildings, beneficial microbes, and health. Trends Microbiol. 2016, 24, 595–597. [Google Scholar] [CrossRef]
- Kim, K.-H.; Kabir, E.; Jahan, S.A. Airborne bioaerosols and their impact on human health. J. Environ. Sci. 2017, 67, 23–35. [Google Scholar] [CrossRef] [PubMed]
- Lv, Y.; Zhou, Y.; Chen, X.; Zhao, T.; Liu, T.; He, X.; Liu, J.; Xiao, Y. Study on indoor and outdoor permeability coefficients and bacterial components, sources of fine particles in severe cold region of China. Sustain. Cities Soc. 2020, 55, 102020. [Google Scholar] [CrossRef]
- Xie, Z.; Fan, C.; Lu, R.; Liu, P.; Wang, B.; Du, S.; Jin, C.; Deng, S.; Li, Y. Characteristics of ambient bioaerosols during haze episodes in China: A review. Environ. Pollut. 2018, 243, 1930–1942. [Google Scholar] [CrossRef]
- Crook, B.; Burton, N.C. Indoor moulds, Sick Building Syndrome and building related illness. Fungal Biol. Rev. 2010, 24, 106–113. [Google Scholar] [CrossRef]
- Ghaffarianhoseini, A.; AlWaer, H.; Omrany, H.; Ghaffarianhoseini, A.; Alalouch, C.; Clements-Croome, D.; Tookey, J. Sick building syndrome: Are we doing enough? Arch. Sci. Rev. 2018, 61, 99–121. [Google Scholar] [CrossRef]
- Nakayama, Y.; Nakaoka, H.; Suzuki, N.; Tsumura, K.; Hanazato, M.; Todaka, E.; Mori, C. Prevalence and risk factors of pre-sick building syndrome: Characteristics of indoor environmental and individual factors. Environ. Health Prev. 2019, 24, 77. [Google Scholar] [CrossRef]
- Pułyk, M. The State of the Environment in the Wielkopolska. Report 2020; Regional Department of Environmental Monitoring in Poznań: Poznań, Poland, 2020. (In Polish)
- Wiech, A.K.; Marciniewicz-Mykieta, M.; Toczko, B. The State of the Environment in Poland. 2018 Report; Main Inspectorate of Environmental Protection: Warszawa, Poland, 2018. (In Polish)
- PN-EN 16798.1-06; Energy Performance of Buildings—Ventilation for Buildings—Part 1: Indoor Environmental Input Parameters for Design and Assessment of Energy Performance of Buildings Addressing Indoor Air Quality, Thermal Environment, Lighting and Acoustics—Module M1-6. Polish Standards Institution: Warszawa, Poland, 2019. (In Polish)
- Polish Law: Item 1031, Regulation of Minister of Environment on the Levels of Certain Substances in Ambient Air. Warsaw: 2012. Available online: http://www.fao.org/faolex/results/details/en/c/LEX-FAOC129545/ (accessed on 25 December 2019). (In Polish).
- Grisoli, P.; Albertoni, M.; Rodolfi, M. Application of Airborne Microorganism Indexes in Offices, Gyms, and Libraries. Appl. Sci. 2019, 9, 1101. [Google Scholar] [CrossRef]
- Persily, A.; Polidoro, B. Development and Application of an Indoor Carbon Dioxide Metric. In Proceedings of the 16th Conference of the International Society of Indoor Air Quality & Climate, Seoul, Republic of Korea, 20–24 July 2020. ID ABS-0446. [Google Scholar]
- Jones, A.P. Indoor air quality and health. Atmos. Environ. 1999, 33, 4535–4564. [Google Scholar] [CrossRef]
- Madsen, A.M.; Moslehi-Jenabian, S.; Frankel, M.; White, J.K.; Frederiksen, M.W. Airborne bacterial species in indoor air and association with physical factors. UCL Open Environ. 2023, 31, e056. [Google Scholar] [CrossRef]
- Yang, Z.; Shen, J.; Gao, Z. Ventilation and Air Quality in Student Dormitories in China: A Case Study during Summer in Nanjing. Int. J. Environ. Res. Public Health 2018, 15, 1328. [Google Scholar] [CrossRef] [PubMed]
- Gładyszewska-Fiedoruk, K. Indoor Air Quality in the Bedroom of a Single-Family House—A Case Study. Proceedings 2019, 16, 38. [Google Scholar] [CrossRef]
- Grisoli, P.; Rodolfi, M.; Villani, S.; Grignani, E.; Cottica, D.; Berri, A.; Picco, A.M.; Dacarro, C. Assessment of airborne microorganism contamination in an industrial area characterized by an open composting facility and a wastewater treatment plant. Environ. Res. 2009, 109, 135–142. [Google Scholar] [CrossRef]
- Fujiyoshi, S.; Tanaka, D.; Maruyama, F. Transmission of airborne bacteria across built environments and its measurement standards: A review. Front. Microbiol. 2017, 8, 2336. [Google Scholar] [CrossRef]
- Heo, K.J.; Lim, C.E.; Kim, H.B.; Lee, B.U. Effects of human activities on concentrations of culturable bioaerosols in indoor air environments. J. Aerosol Sci. 2017, 104, 58–65. [Google Scholar] [CrossRef] [PubMed]
- Kwan, S.E.; Shaughnessy, R.; Haverinen-Shaughnessy, U.; Kwan, T.A.; Peccia, J. The impact of ventilation rate on the fungal and bacterial ecology of home indoor air. Build. Environ. 2020, 177, 106800. [Google Scholar] [CrossRef]
- Weikl, F.; Tischer, C.; Probst, A.J.; Heinrich, J.; Markevych, I.; Jochner, S.; Pritsch, K. Fungal and bacterial communities in indoor dust follow different environmental determinants. PLoS ONE 2016, 11, e0154131. [Google Scholar] [CrossRef]
- Ogórek, R.; Pląskowska, E.; Kalinowska, K.; Fornalczyk, P.; Misztal, A.; Budziak, J. The analysis of mycological air pollution in selected rooms of student hostels. Mikol. Lek. 2011, 18, 201–210. [Google Scholar]
- Ulpiani, G.; Hart, M.A.; Di Virgilio, G.; Maharaj, A.M. Urban meteorology and air quality in a rapidly growing city: Inter-parameter associations and intra-urban heterogeneity. Sustain. Cities Soc. 2022, 77, 103553. [Google Scholar] [CrossRef]
- Borge, R.; Narros, A.; Artíñano, B.; Yagüe, C.; Gómez-Moreno, F.J.; de la Paz, D.; Román-Cascón, C.; Díaz, E.; Maqueda, G.; Sastre, M.; et al. Assessment of microscale spatio-temporal variation of air pollution at an urban hotspot in Madrid (Spain) through an extensive field campaign. Atmos. Environ. 2016, 140, 432–445. [Google Scholar] [CrossRef]
- Ji, W.; Wang, Y.; Zhuang, D. Spatial distribution differences in PM2.5 concentration between heating and non-heating seasons in Beijing, China. Environ. Pollut. 2019, 248, 574–583. [Google Scholar] [CrossRef] [PubMed]
- Chang, J.; Shen, J.; Tao, J.; Li, N.; Xu, C.; Li, Y.; Liu, Z.; Wang, Q. The impact of heating season factors on eight PM2.5-bound polycyclic aromatic hydrocarbon (PAH) concentrations and cancer risk in Beijing. Sci. Total. Environ. 2019, 688, 1413–1421. [Google Scholar] [CrossRef] [PubMed]
- Ścibor, M.; Balcerzak, B.; Galbarczyk, A.; Targosz, N.; Jasienska, G. Are we safe inside? Indoor air quality in relation to outdoor concentration of PM10 and PM2.5 and to characteristics of homes. Sustain. Cities Soc. 2019, 48, 101537. [Google Scholar] [CrossRef]
- Tang, D.; Wang, C.; Nie, J.; Chen, R.; Niu, Q.; Kan, H.; Chen, B.; Perera, F. Health benefits of improving air quality in Taiyuan, China. Environ. Int. 2014, 73, 235–242. [Google Scholar] [CrossRef]
- Li, S.; Williams, G.; Guo, Y. Health benefits from improved outdoor air quality and intervention in China. Environ. Pollut. 2016, 214, 17–25. [Google Scholar] [CrossRef]

Disclaimer/Publisher’s Note: The statements, opinions and data contained in all publications are solely those of the individual author(s) and contributor(s) and not of MDPI and/or the editor(s). MDPI and/or the editor(s) disclaim responsibility for any injury to people or property resulting from any ideas, methods, instructions or products referred to in the content. |
© 2025 by the authors. Licensee MDPI, Basel, Switzerland. This article is an open access article distributed under the terms and conditions of the Creative Commons Attribution (CC BY) license (https://creativecommons.org/licenses/by/4.0/).