

Measuring Ammonia Concentration Distributions with Passive Samplers to Evaluate the Impact of Vehicle Exhaust on a Roadside Environment in Tokyo, Japan


Abstract
1. Introduction
2. Materials and Methods
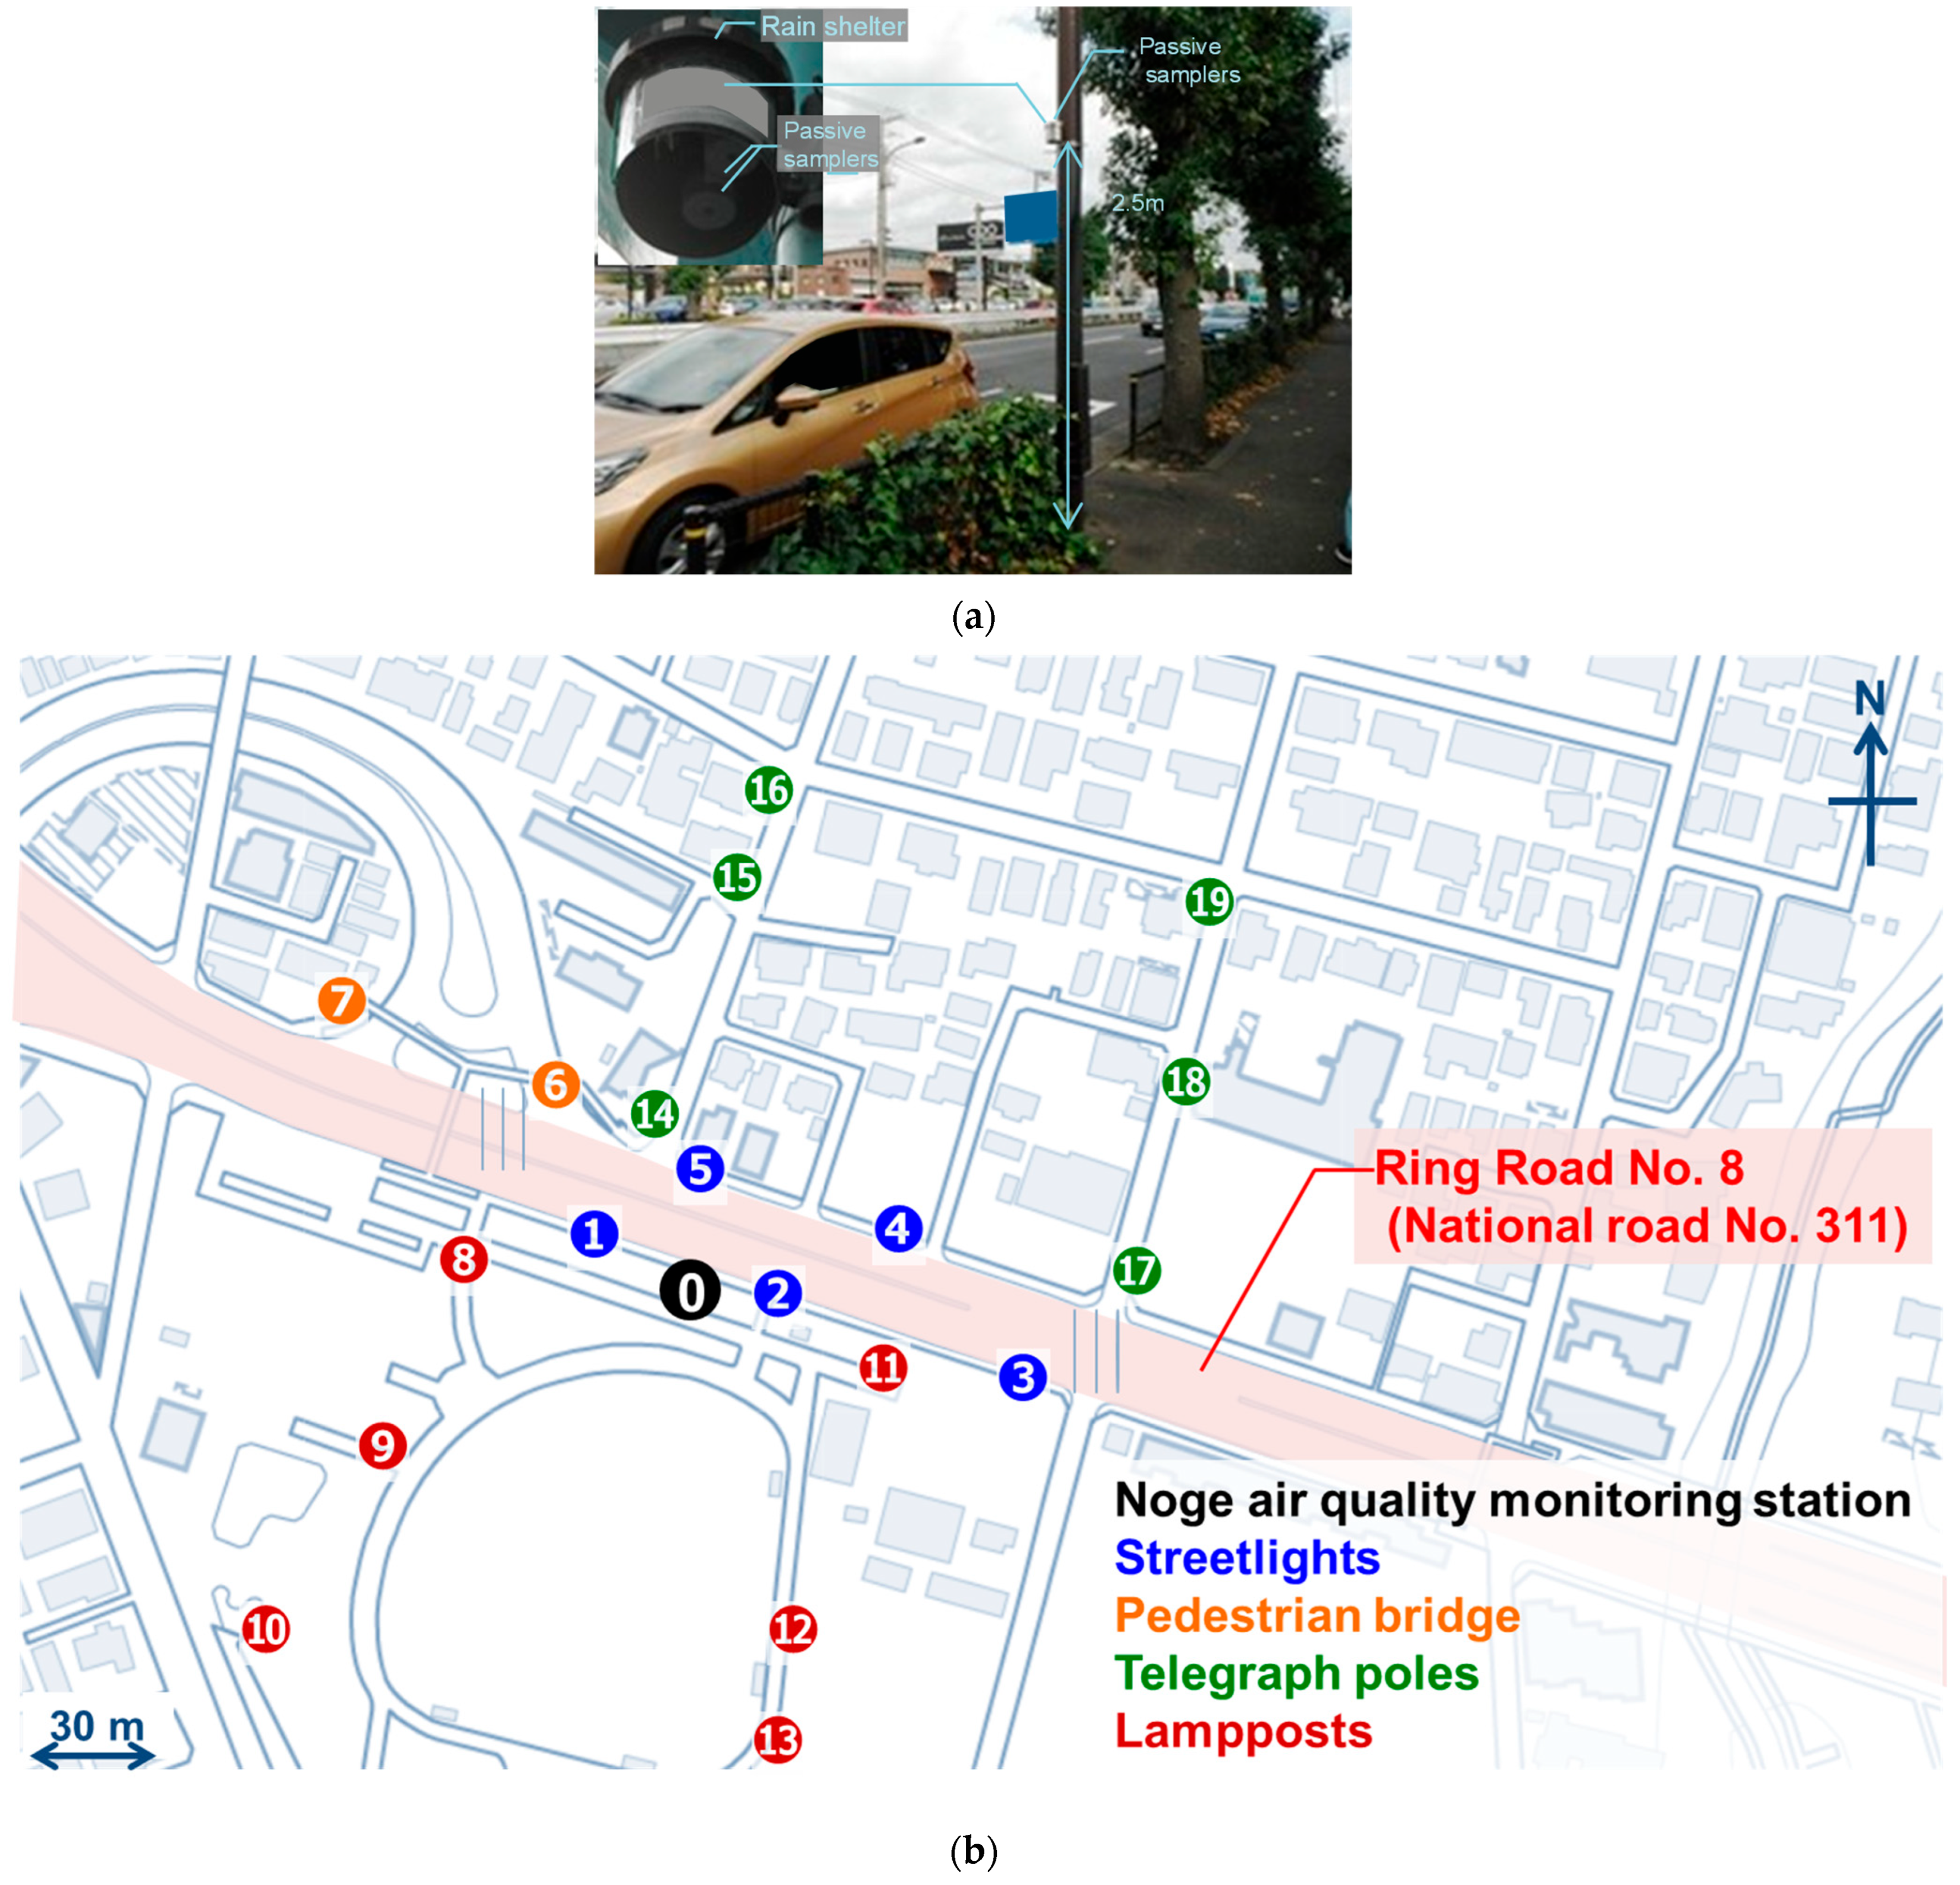
2.1. Locations
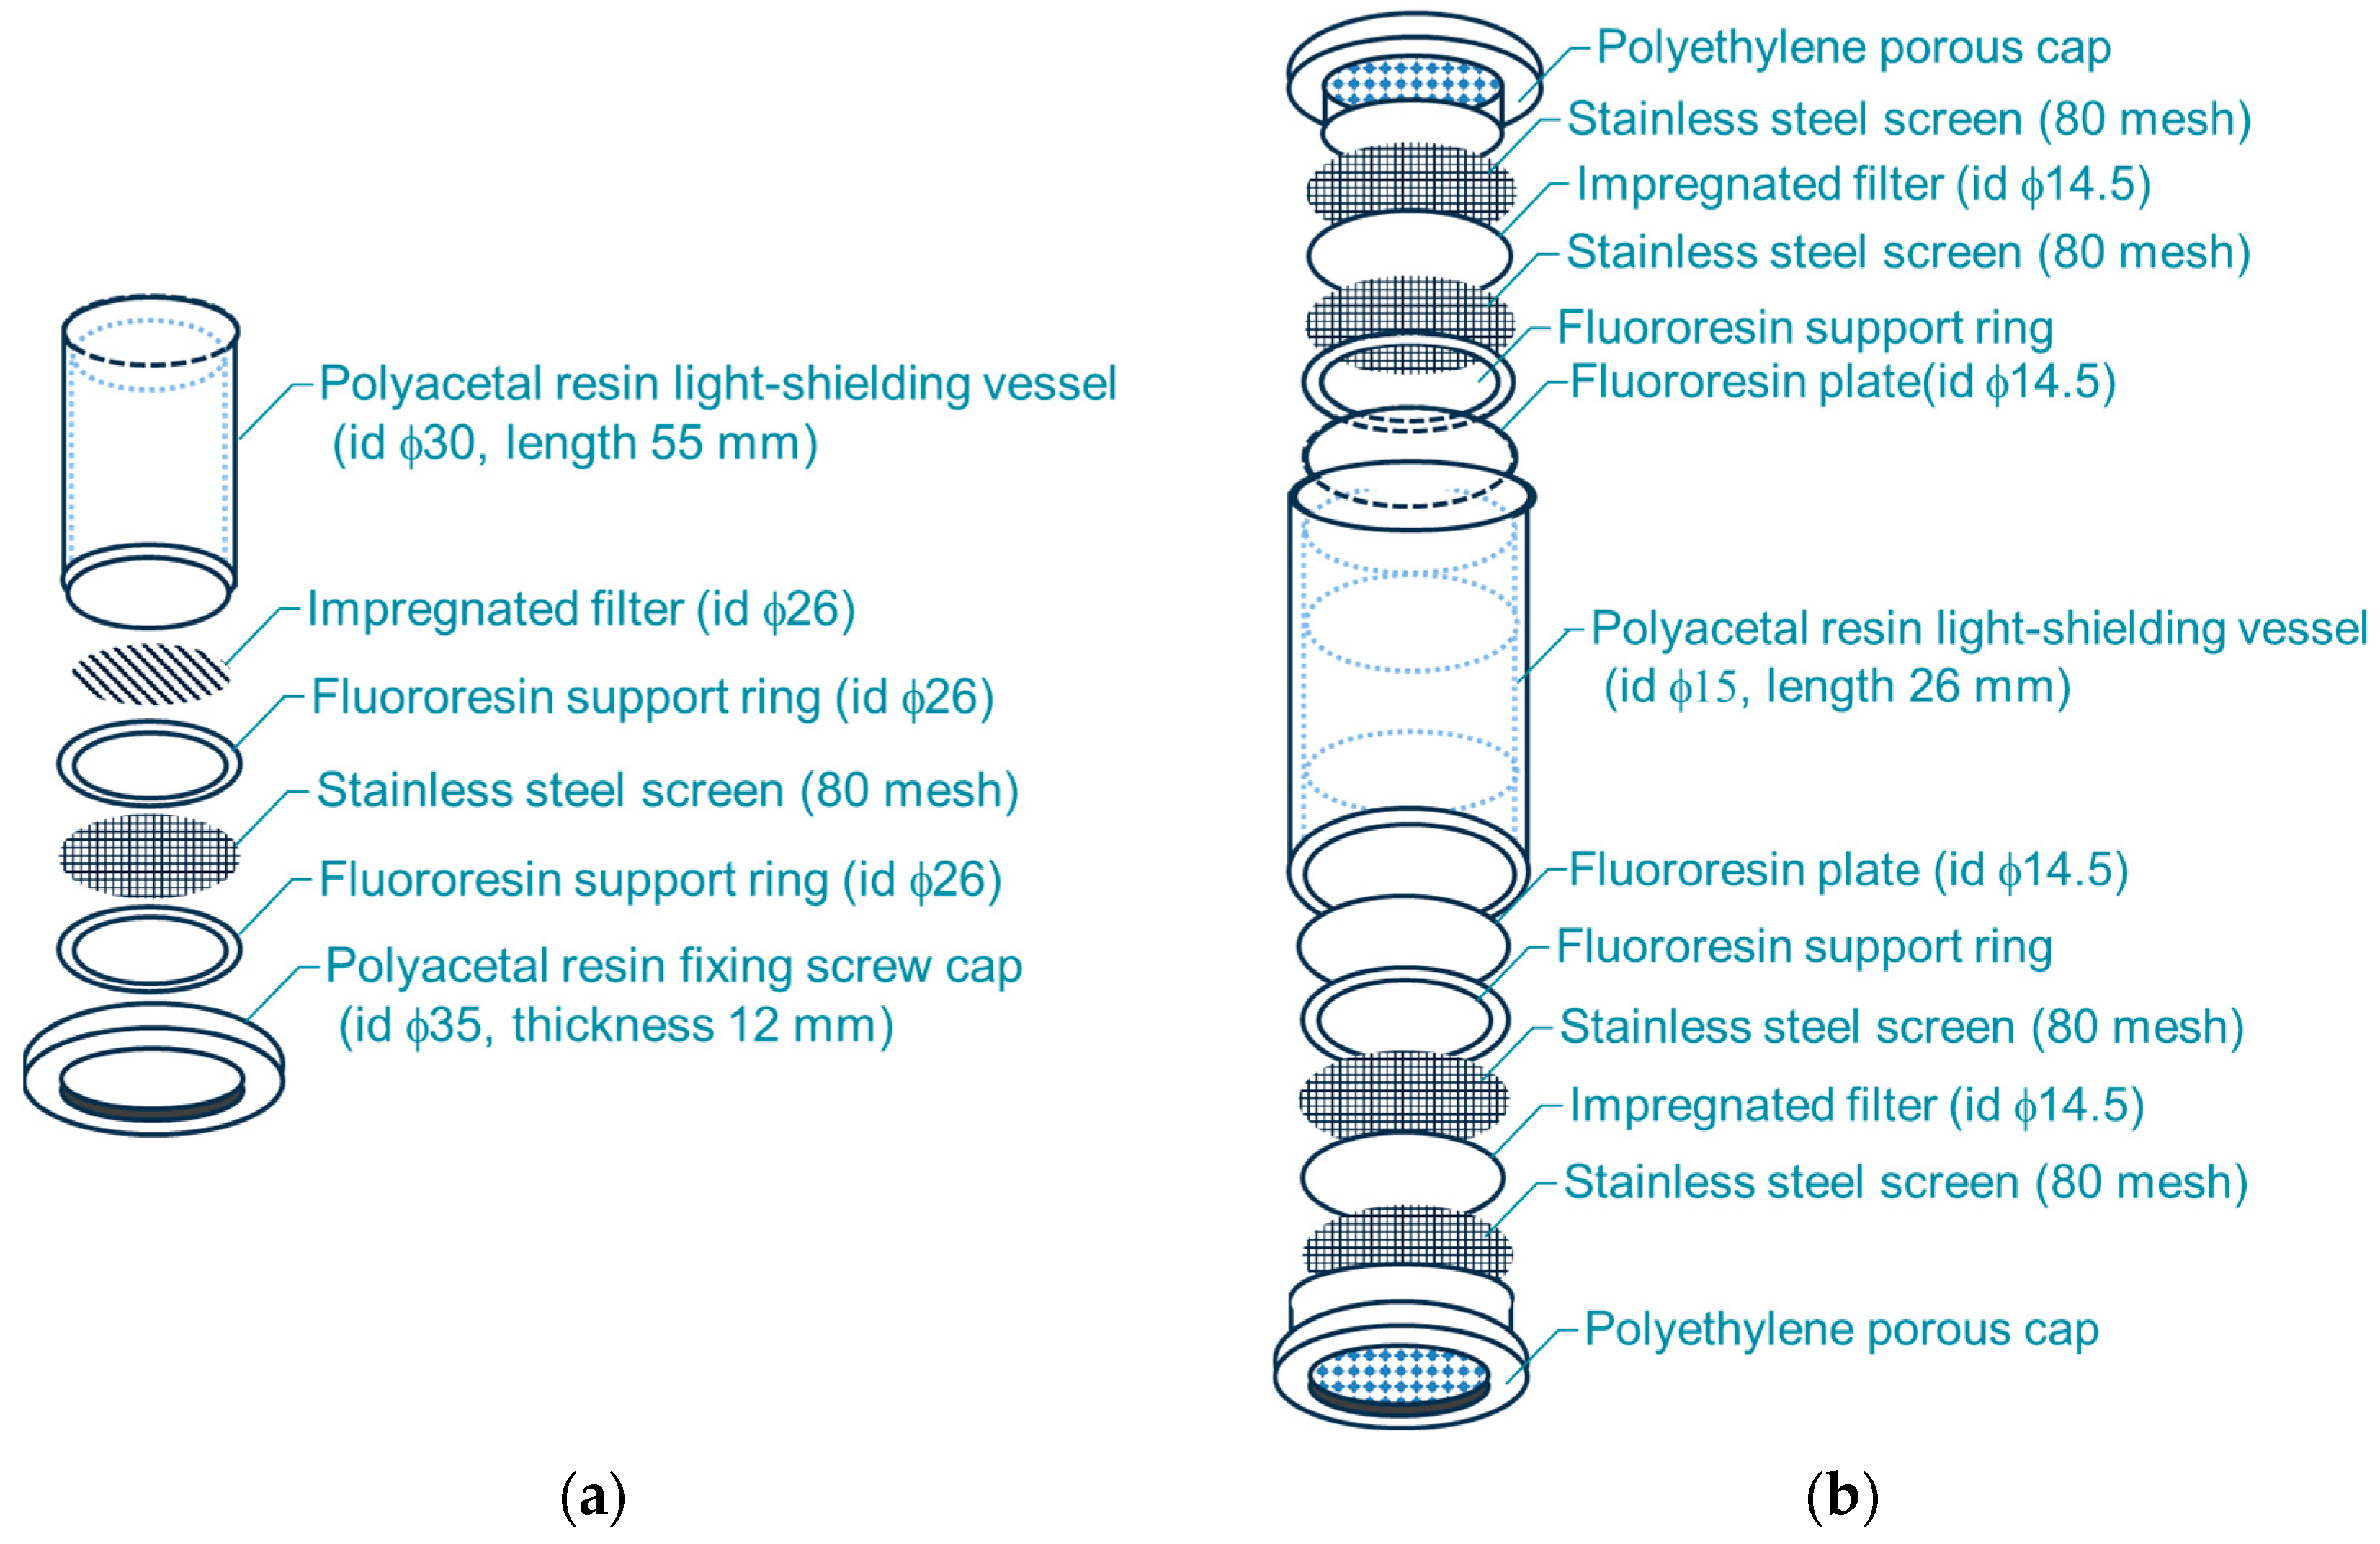
2.2. Sampling
3. Results and Discussion
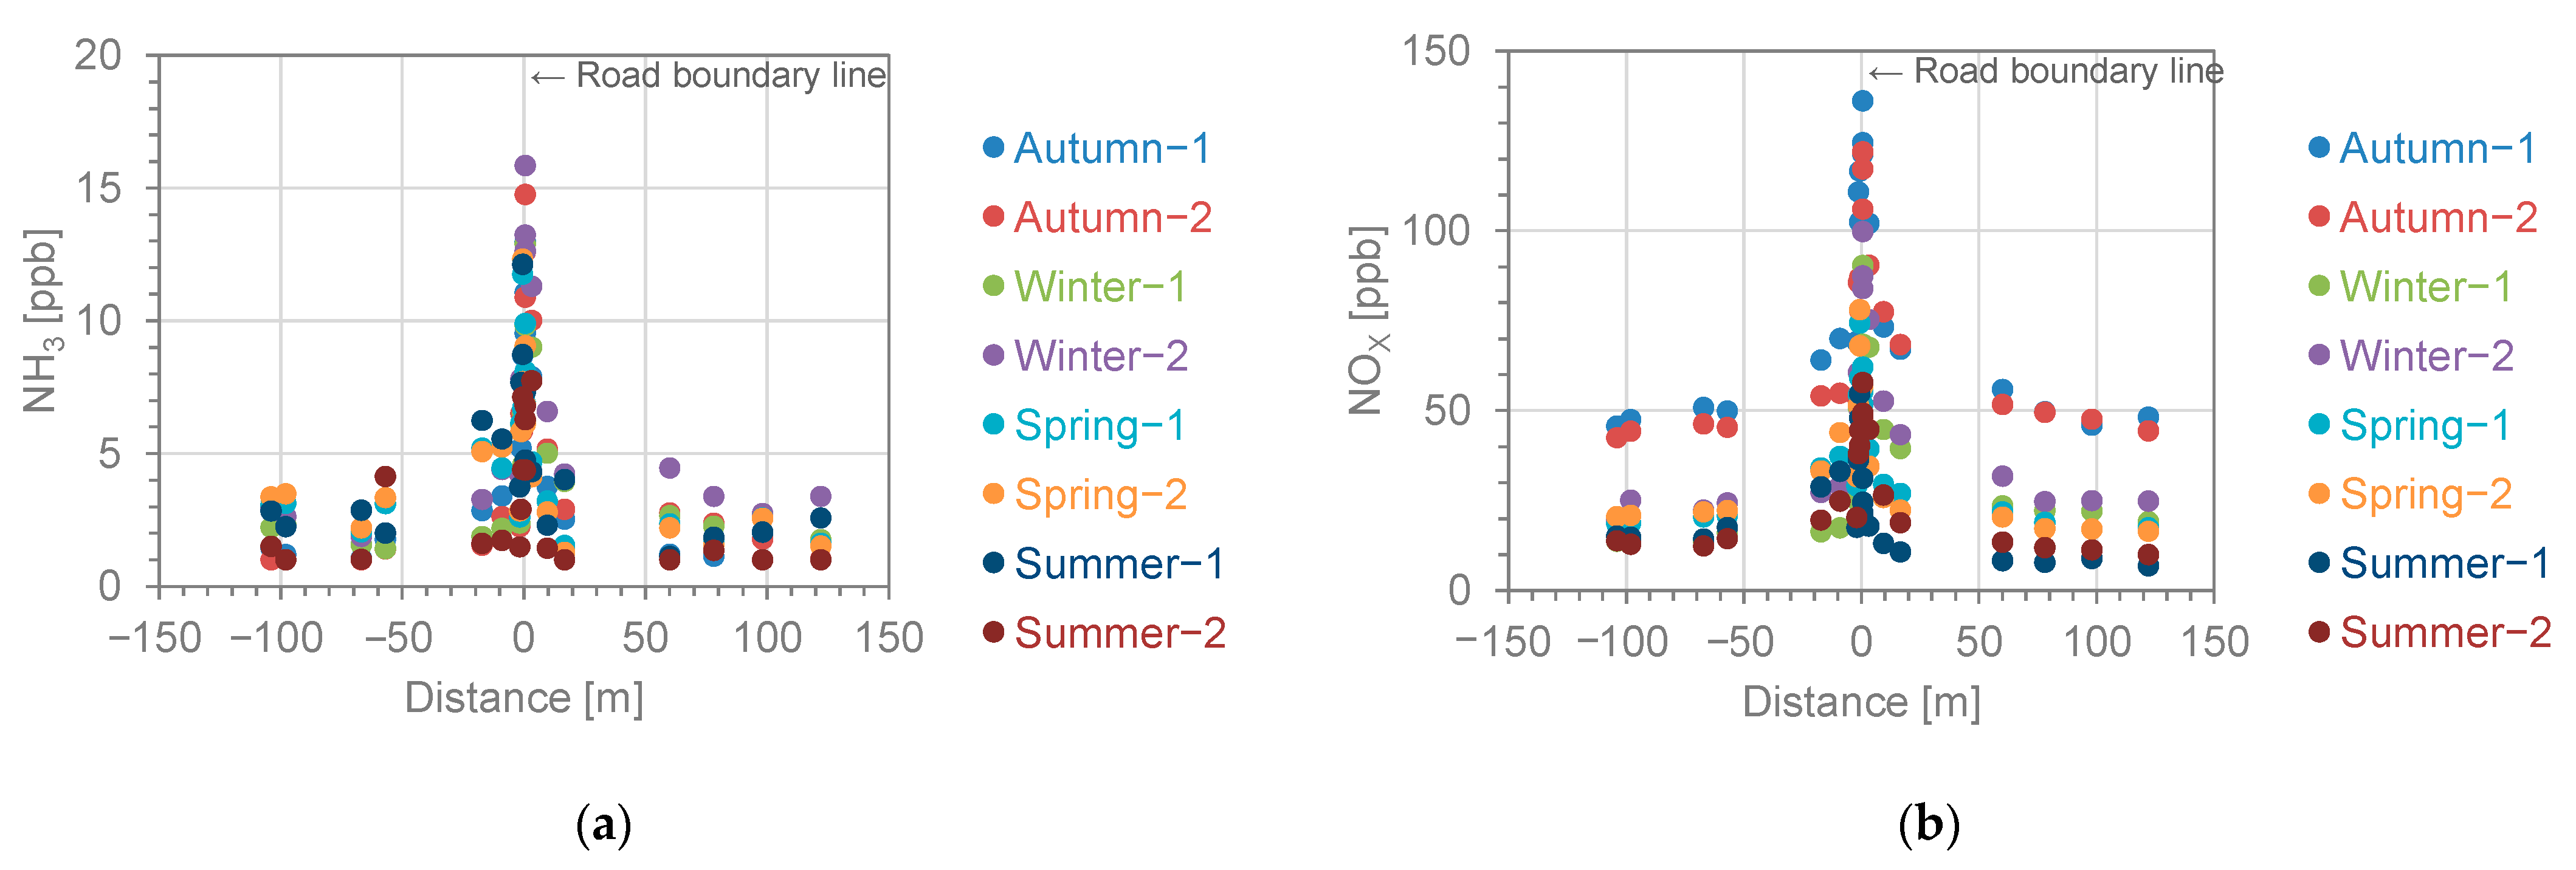
3.1. Spatial Patterns in Concentrations of NH3 and NOX
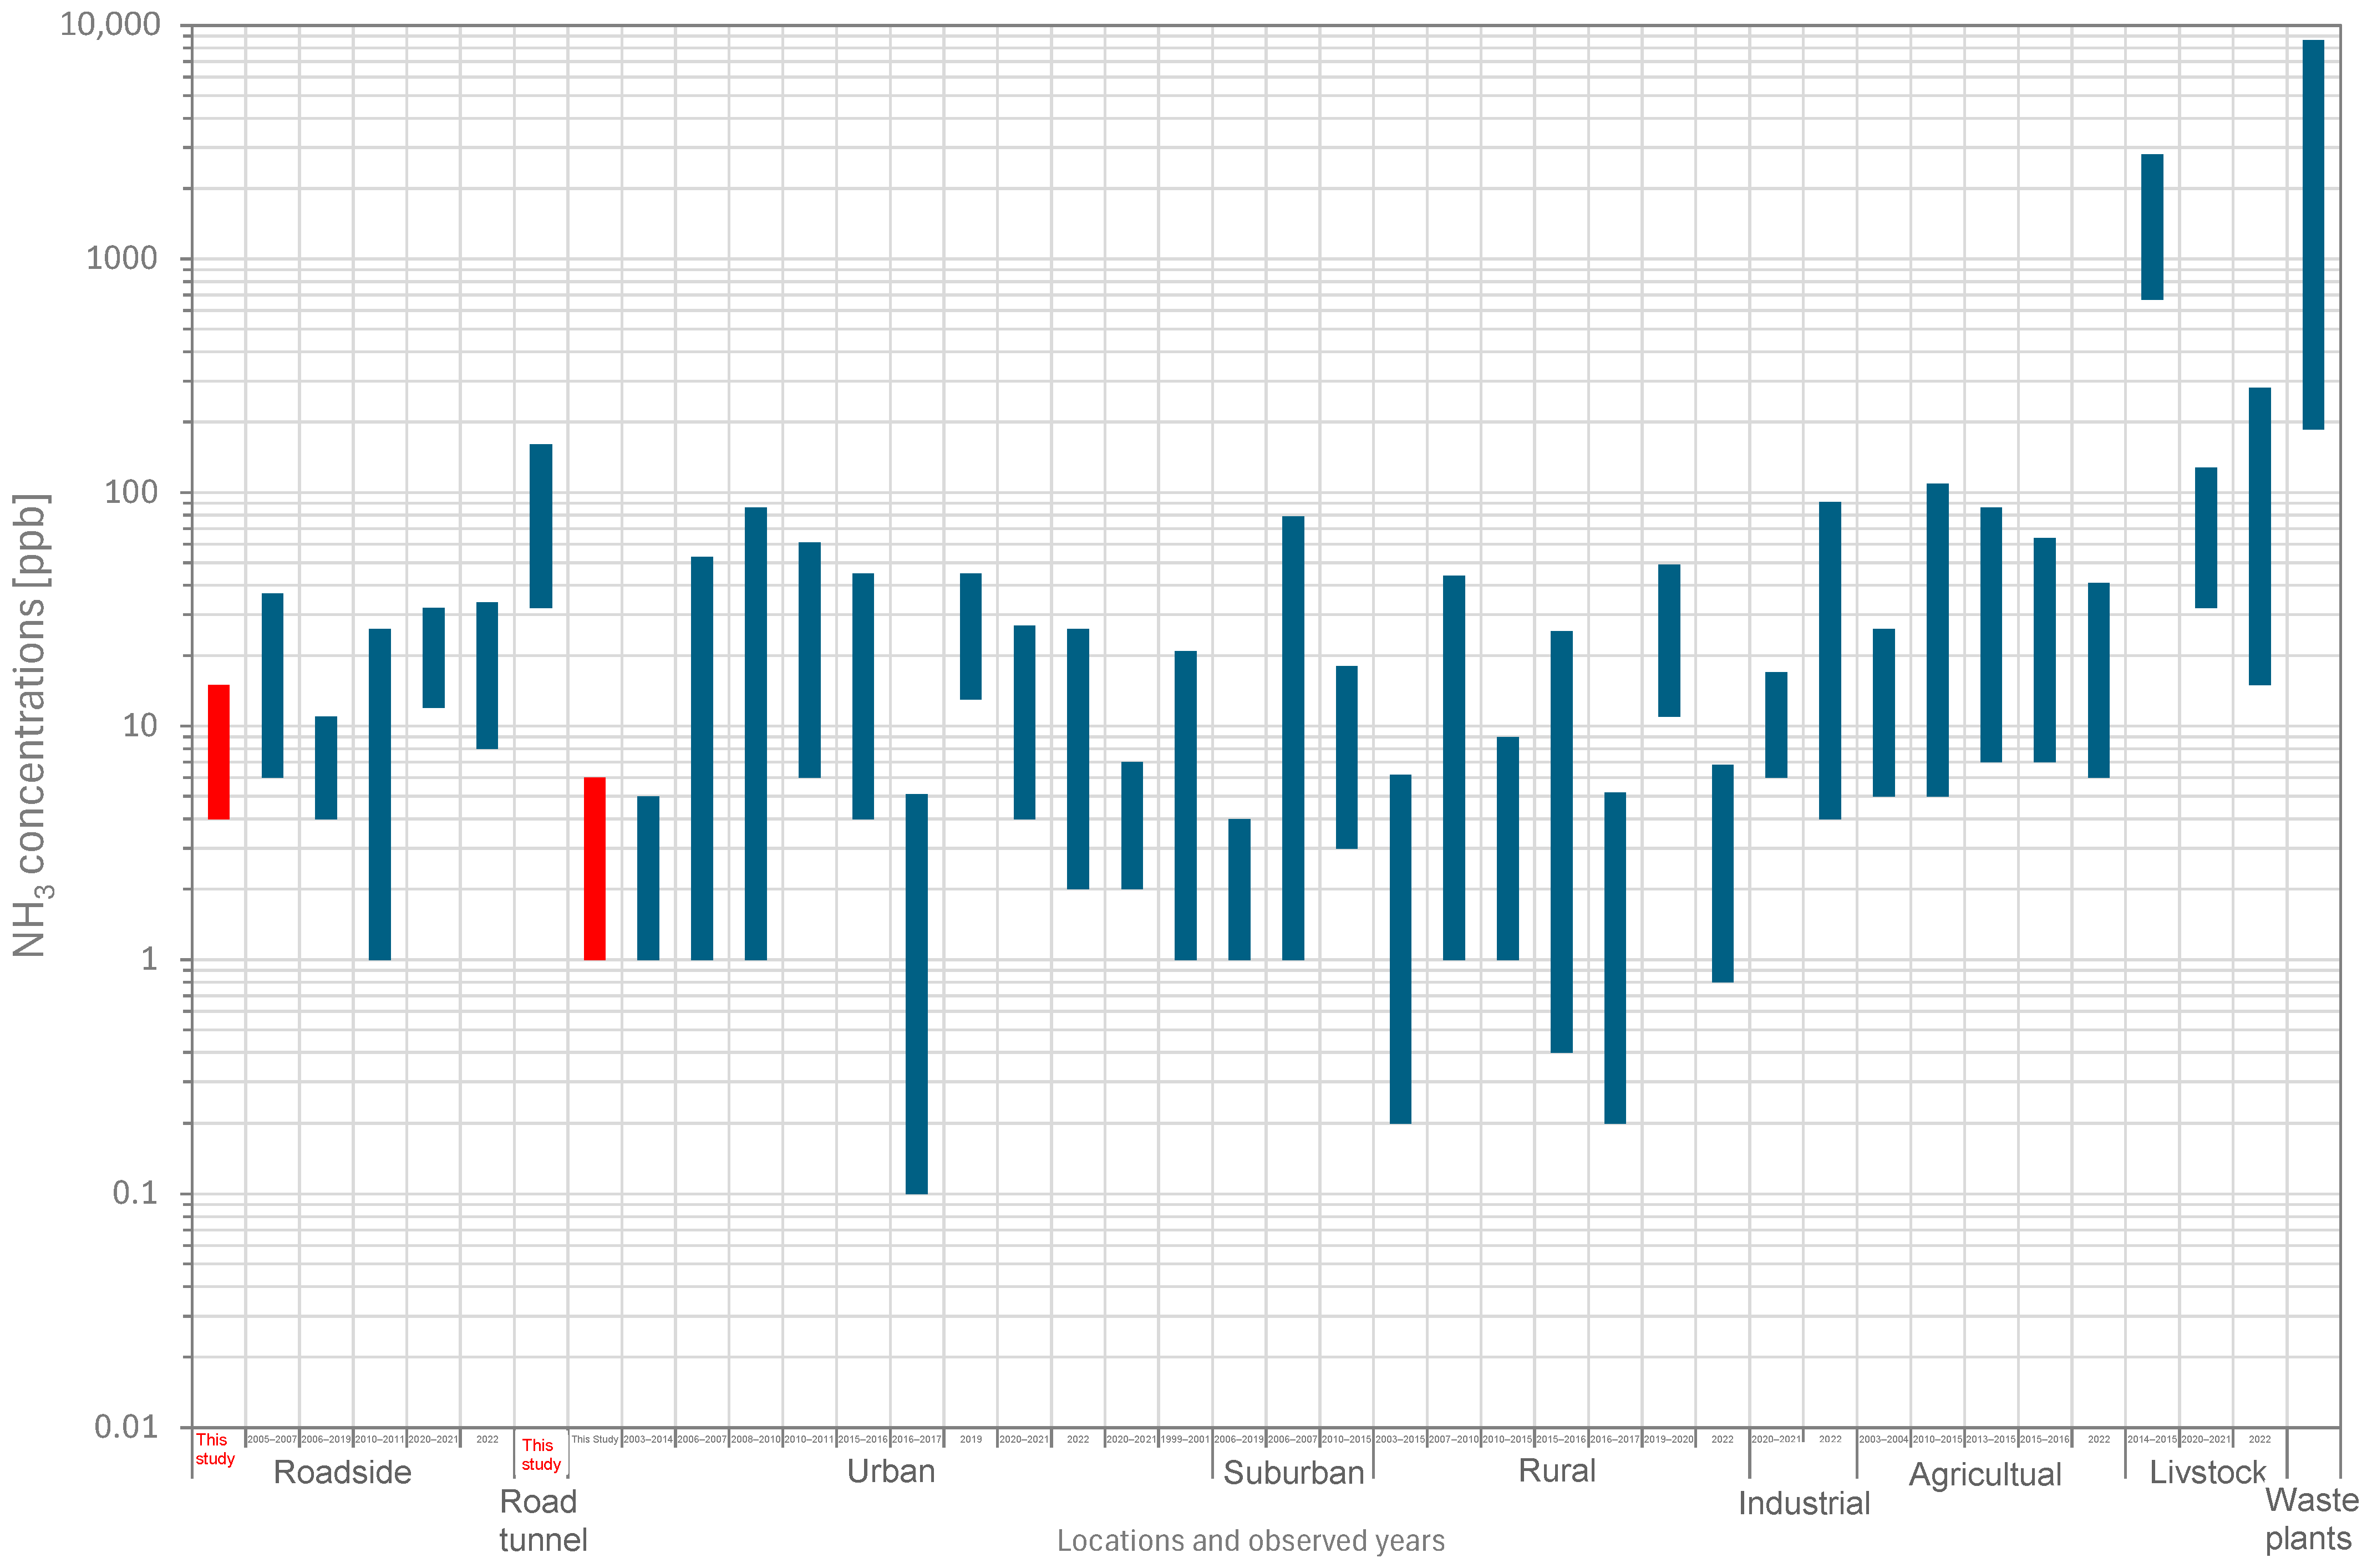
3.2. Comparison with NH3 Concentrations in Other Regions and Periods

| Location | Region | Period | NH3 [ppb] *1 | Reference |
|---|---|---|---|---|
| Roadside | Tokyo, Japan | 2017–2018 | 4–11 | This Study |
| Roadside | Saitama, Japan | 2005–2007 | 6–31 | [70] |
| Roadside | London, UK | 2006–2019 | 4–7 | [86] |
| Roadside | Barcelona, Spain | 2010–2011 | 1–25 | [81] |
| Roadside | Gyeonggi, Korea | 2020–2021 | 12–20 | [87] |
| Roadside | 2 sites, Korea | 2022 | 8–26 | [53] |
| Road tunnel | Beijing, China | 2014–2015 | 32–129 | [88] |
| Urban | Tokyo, Japan | 2017–2018 | 1–5 | This Study |
| Urban | 2 sites, North America | 2003–2014 | 1–4 | [89] |
| Urban | Xi’an, China | 2006–2007 | 1–52 | [90] |
| Urban | Beijing, China | 2008–2010 | 1–85 | [91] |
| Urban | Barcelona, Spain | 2010–2011 | 6–55 | [81] |
| Urban | 13 sites, China | 2015–2016 | 4–41 | [52] |
| Urban | New York, USA | 2016–2017 | 0.1–5 | [92] |
| Urban | Beijing, China | 2019 | 13–32 | [79] |
| Urban | Gyeonggi, Korea | 2020–2021 | 4–23 | [87] |
| Urban | 3 sites, Korea | 2022 | 2–24 | [53] |
| Urban background | Gyeonggi, Korea | 2020–2021 | 2–5 | [87] |
| Urban and rural | Asia, Africa, and South America | 1999–2001 | 1–20 | [51] |
| Suburban | Edinburgh, UK | 2006–2019 | 1–3 | [86] |
| Suburban | Xi’an, China | 2006–2007 | 1–78 | [90] |
| Suburban | Colorado, USA | 2010–2015 | 3–15 | [93] |
| Rural | 11 sites, North America | 2003–2015 | 0.2–6 | [52] |
| Rural | Beijing, China | 2007–2010 | 1–43 | [91] |
| Rural | Colorado, USA | 2010–2015 | 1–8 | [93] |
| Rural, remote | 40 sites, China | 2015–2016 | 0.4–25 | [52] |
| Rural | New York, USA | 2016–2017 | 0.2–5 | [92] |
| Rural | Jeongeup, Korea | 2019–2020 | 11–38 | [94] |
| Rural | 5 sites, Korea | 2022 | 0.8–6 | [53] |
| Industrial | Gyeonggi, Korea | 2020–2021 | 6–11 | [87] |
| Industrial | 10 sites, Korea | 2022 | 4–87 | [53] |
| Agricultural | North Carolina, USA | 2003–2004 | 5–21 | [95] |
| Agricultural | Colorado, USA | 2010–2015 | 5–104 | [93] |
| Agricultural | Navarre, Spain | 2013–2015 | 7–79 | [96] |
| Agricultural | Nanjing, China | 2015–2016 | 7–57 | [52] |
| Agricultural | 8 sites, Korea | 2022 | 6–35 | [53] |
| Livestock | Beijing, China | 2014–2015 | 670–2129 | [88] |
| Livestock | Gyeonggi, Korea | 2020–2021 | 32–96 | [87] |
| Livestock | 7 sites, Korea | 2022 | 15–266 | [53] |
| Waste plants | Beijing, China | 2014–2015 | 186–8455 | [88] |
3.3. NH3 Emission Factors
4. Conclusions
Funding
Institutional Review Board Statement
Informed Consent Statement
Data Availability Statement
Acknowledgments
Conflicts of Interest
Appendix A. Calculation of NH3 Atmospheric Concentration Using Passive Samplers
Appendix B. Calculation of NOX and NO2 Atmospheric Concentrations Using Passive Samplers
Appendix C. NH3 Concentration Ranges Measured in Studies Using Passive Samplers at Various Locations
References
- Van Damme, M.; Clarisse, L.; Franco, B.; Sutton, M.A.; Erisman, J.W.; Kruit, R.W.; van Zanten, M.; Whitburn, S.; Hadji-Lazaro, J.; Hurtmans, D.; et al. Global, regional and national trends of atmospheric ammonia derived from a decadal (2008–2018) satellite record OPEN ACCESS RECEIVED Global, regional and national trends of atmospheric ammonia derived from a decadal (2008–2018) satellite record. Environ. Res. Lett. 2021, 16, 055017. [Google Scholar] [CrossRef]
- Epps, A.; Dressel, I.M.; Guo, X.; Odanibe, M.; Fields, K.P.; Carlton, A.M.G.; Sun, K.; Pusede, S.E. Satellite Observations of Atmospheric Ammonia Inequalities Associated with Industrialized Swine Facilities in Eastern North Carolina. Environ. Sci. Technol. 2025, 59, 2651–2664. [Google Scholar] [CrossRef] [PubMed]
- Liu, S.; Xu, H.; Wang, J.; Ding, J.; Liu, P.; Yang, Y.; Liu, L. Evidence for global increases in urban ammonia pollution and their drivers. Sci. Total Environ. 2024, 955, 176846. [Google Scholar] [CrossRef] [PubMed]
- Wyer, K.E.; Kelleghan, D.B.; Blanes-Vidal, V.; Schauberger, G.; Curran, T.P. Ammonia emissions from agriculture and their contribution to fine particulate matter: A review of implications for human health. J. Environ. Manag. 2022, 323, 116285. [Google Scholar] [CrossRef]
- Zou, X.; Wang, S.; Liu, J.; Zhu, J.; Zhang, S.; Xue, R.; Gu, C.; Zhou, B. Role of gas-particle conversion of ammonia in haze pollution under ammonia-rich environment in Northern China and prospects of effective emission reduction. Sci. Total Environ. 2024, 15, 173277. [Google Scholar] [CrossRef]
- Xenofontos, C.; Kohl, M.; Ruhl, S.; Almeida, J.; Beckmann, H.M.; Caudillo-Plath, L.; Ehrhart, S.; Höhler, K.; Sebastian, M.K.; Kong, W.; et al. The impact of ammonia on particle formation in the Asian Tropopause Aerosol Layer. npj Clim. Atmos. Sci. 2024, 7, 215. [Google Scholar] [CrossRef]
- Behera, S.N.; Sharma, M.; Aneja, V.P.; Balasubramanian, R. Ammonia in the atmosphere: A review on emission sources, atmospheric chemistry and deposition on terrestrial bodies. Environ. Sci. Pollut. Res. 2013, 20, 8092–8131. [Google Scholar] [CrossRef]
- Hagino, H.; Uchida, R. Effects of ammonia mitigation on secondary organic aerosol and ammonium nitrate particle formation in photochemical reacted gasoline vehicle exhausts. Atmosphere 2024, 15, 1061. [Google Scholar] [CrossRef]
- Asman, W.A.; Sutton, M.A.; Schjørring, J.K. Ammonia: Emission, atmospheric transport and deposition. New Phytol. 1998, 139, 27–48. [Google Scholar] [CrossRef]
- Seinfeld, J.H.; Pandis, S.P. Atmospheric Chemistry and Physics: From Air Pollution to Climate Change, 2nd ed.; John Wiley & Sons, Inc.: Hoboken, NJ, USA, 2006. [Google Scholar]
- Stelson, A.W.; Seinfeld, J.H. Thermodynamic prediction of the water activity, NH4HO3 dissociation constant, density and refractive index for the NH4NO3–(NH4)2SO4H2O system at 25 °C. Atmos. Environ. 1982, 16, 2507–2514. [Google Scholar] [CrossRef]
- Stelson, A.W.; Seinfeld, J.H. Relative humidity and temperature dependence of the ammonium nitrate dissociation constant. Atmos. Environ. 1982, 16, 983–992. [Google Scholar] [CrossRef]
- Stelson, A.W.; Seinfeld, J.H. Relative humidity and pH dependence of the vapor pressure of ammonium nitrate–nitric acid solutions at 25 °C. Atmos. Environ. 1982, 16, 993–1000. [Google Scholar] [CrossRef]
- Theobald, M.R.; Løfstrøm, P.; Walker, J.; Andersen, H.V.; Pedersen, P.; Vallejo, A.; Sutton, M.A. An intercomparison of models used to simulate the short-range atmospheric dispersion of agricultural ammonia emissions. Environ. Model. Softw. 2012, 37, 90–102. [Google Scholar] [CrossRef]
- Cape, J.N.; van der Eerden, L.J.; Sheppard, L.J.; Leith, I.D.; Sutton, M.A. Evidence for changing the critical level for ammonia. Environ. Pollut. 2009, 157, 1033–1037. [Google Scholar] [CrossRef] [PubMed]
- Chen, Z.L.; Song, W.; Hu, C.C.; Chen, G.Y.; Walters, W.W.; Michalski, G.; Liu, C.Q.; Fowler, D.; Liu, X.Y. Significant contributions of combustion-related sources to ammonia emissions. Nat. Commun. 2022, 13, 7710. [Google Scholar] [CrossRef]
- Bradow, R.L.; Stump, F.D. Unregulated Emissions from Three-Way Catalyst Cars; SAE Technical Paper: Pittsburgh, PA, USA, 1977; p. 770369. [Google Scholar] [CrossRef]
- Cadle, S.H.; Nebel, G.J.; Williams, R.L. Measurements of Unregulated Emissions from General Motors’ Light-Duty Vehicles; SAE Technical Paper: Pittsburgh, PA, USA, 1979; p. 790694. [Google Scholar] [CrossRef]
- Urban, C.M.; Garbe, R.J. Regulated and Unregulated Exhaust Emissions from Malfunctioning Automobiles; SAE Technical Paper: Pittsburgh, PA, USA, 1979; p. 790696. [Google Scholar] [CrossRef]
- Cadle, S.H.; Mulawa, P.A. Low-molecular-weight aliphatic amines in exhaust from catalyst-equipped cars. Environ. Sci. Technol. 1980, 14, 718–723. [Google Scholar] [CrossRef]
- Smith, L.R.; Carey, P.M. Characterization of Exhaust Emissions from High Mileage Catalyst-Equipped Automobiles; SAE Technical Paper: Pittsburgh, PA, USA, 1982; p. 820783. [Google Scholar] [CrossRef]
- Chang, Y.; Zou, Z.; Deng, C.; Huang, K.; Collett, J.L.; Lin, J.; Zhuang, G. The importance of vehicle emissions as a source of atmospheric ammonia in the megacity of Shanghai. Atmos. Chem. Phys. 2016, 16, 3577–3594. [Google Scholar] [CrossRef]
- Heck, R.M.; Farrauto, R.J.; Gulati, S.T. Catalytic Air Pollution Control: Commercial Technology, 3rd ed.; John Wiley & Sons, Inc.: Hoboken, NJ, USA, 2009; ISBN 978-0-470-27503-0. [Google Scholar]
- de Nevers, N. Air Pollution Control Engineering, 2nd ed.; Waveland Press, Inc.: Long Grove, IL, USA, 2010. [Google Scholar]
- Johnson, T. Vehicular emissions in review. SAE Int. J. Engines 2016, 9, 1258–1275. [Google Scholar] [CrossRef]
- Johnson, T.; Joshi, A. Review of vehicle engine efficiency and emissions. SAE Int. J. Engines 2018, 11, 1307–1330. [Google Scholar] [CrossRef]
- Farrauto, R.J.; Deeba, M.; Alerasool, S. Gasoline automobile catalysis and its historical journey to cleaner air. Nat. Catal. 2019, 2, 603–613. [Google Scholar] [CrossRef]
- Wang, J.; Chen, H.; Hu, Z.; Yao, M.; Li, Y. A review on the Pd-based three-way catalyst. Catal. Rev. 2015, 57, 79–144. [Google Scholar] [CrossRef]
- Huai, T.; Durbin, T.D.; Miller, J.W.; Pisano, J.T.; Sauer, C.G.; Rhee, S.H.; Norbeck, J.M. Investigation of NH3 emissions from new technology vehicles as a function of vehicle operating conditions. Environ. Sci. Technol. 2003, 37, 4841–4847. [Google Scholar] [CrossRef] [PubMed]
- Heeb, N.V.; Forss, A.-M.; Brühlmann, S.; Lüscher, R.; Saxer, C.J.; Hug, P. Three-way catalyst-induced formation of ammonia—Velocity- and acceleration-dependent emission factors. Atmos. Environ. 2006, 40, 5986–5997. [Google Scholar] [CrossRef]
- Heeb, N.V.; Saxer, C.J.; Forss, A.-M.; Brühlman, S. Trends of NO-, NO2-, and NH3-emissions from gasoline-fueled euro-3- to euro-4-passenger cars. Atmos. Environ. 2008, 42, 2543–2554. [Google Scholar] [CrossRef]
- Fraser, M.P.; Cass, G.R. Detection of excess ammonia emissions from in-use vehicles and the implications for fine particle control. Environ. Sci. Technol. 1998, 32, 1053–1057. [Google Scholar] [CrossRef]
- Czerwinski, J.; Comte, P.; Güdel, M.; Lemaire, J.; Mayer, A.; Heeb, N.; Berger, H.; Reutimann, F. Investigations of emissions of reactive substances NO2 and NH3 from passenger cars. Combust. Engines 2016, 166, 24–33. [Google Scholar] [CrossRef]
- Wang, C.; Tan, J.; Harle, G.; Gong, H.; Xia, W.; Zheng, T.; Yang, D.; Ge, Y.; Zhao, Y. Ammonia formation over Pd/Rh three-way catalysts during lean-to-rich fluctuations: The effect of the catalyst aging, exhaust temperature, lambda, and duration in rich conditions. Environ. Sci. Technol. 2019, 53, 12621–12628. [Google Scholar] [CrossRef]
- Durbin, T.D.; Pisano, J.T.; Younglove, T.; Sauer, C.G.; Rhee, S.H.; Huai, T.; Miller, J.W.; MacKay, G.I.; Hochhauser, A.M.; Ingham, M.C.; et al. The effect of fuel sulfur on NH3 and other emissions from 2000–2001 model year vehicles. Atmos. Environ. 2004, 38, 2699–2708. [Google Scholar] [CrossRef]
- Huang, C.; Hu, Q.; Lou, S.; Tian, J.; Wang, R.; Xu, C.; An, J.; Ren, H.; Ma, D.; Quan, Y.; et al. Ammonia Emission Measurements for Light-Duty Gasoline Vehicles in China and Implications for Emission Modeling. Environ. Sci. Technol. 2018, 52, 11223–11231. [Google Scholar] [CrossRef]
- Sabatini, S.; Kil, I.; Hamilton, T.; Wuttke, J.; Rio, L.D.; Smith, M.; Filipi, z.; Hoffman, M.A.; Onori, S. Characterization of Aging Effect on Three-Way Catalyst Oxygen Storage Dynamics; SAE Technical Paper: Pittsburgh, PA, USA, 2016. [Google Scholar] [CrossRef]
- Jeong, J.W.; Baek, S.; Park, S.; Lee, S.; Lim, Y.; Lee, K. Trends in NOx and NH3 emissions caused by three-way catalysts. Fuel 2024, 366, 131282. [Google Scholar] [CrossRef]
- Gao, F.; Tang, X.; Yi, H.; Zhao, S.; Li, C.; Li, J.; Shi, Y.; Meng, X. A review on selective catalytic reduction of NOx by NH3 over Mn–based catalysts at low temperatures: Catalysts, mechanisms, kinetics and DFT calculations. Catalysts 2017, 7, 199. [Google Scholar] [CrossRef]
- Wardana, M.K.A.; Lim, O. Review of improving the NOX conversion efficiency in various diesel engines fitted with SCR system technology. Catalysts 2023, 13, 67. [Google Scholar] [CrossRef]
- Twigg, M.M.; Berkhout, A.J.C.; Cowan, N.; Crunaire, S.; Dammers, E.; Ebert, V.; Gaudion, V.; Haaima, M.; Häni, C.; John, L.; et al. Intercomparison of in situ measurements of ambient NH3: Instrument performance and application under field conditions. Atmos. Meas. Tech. 2022, 15, 6755–6787. [Google Scholar] [CrossRef]
- Martin, N.A.; Ferracci, V.; Cassidy, N.; Hook, J.; Battersby, R.M.; di Meane, E.A.; Tang, Y.S.; Stephens, A.C.M.; Leeson, S.R.; Jones, M.R.; et al. Validation of ammonia diffusive and pumped samplers in a controlled atmosphere test facility using traceable Primary Standard Gas Mixtures. Atmos. Environ. 2019, 199, 453–462. [Google Scholar] [CrossRef]
- Rabaud, N.E.; James, T.A.; Ashbaugh, L.L.; Flocchini, R.G. A passive sampler for the determination of airborne ammonia concentrations near large-scale animal facilities. Environ. Sci. Technol. 2001, 35, 1190–1196. [Google Scholar] [CrossRef]
- Tang, Y.S.; Cape, J.N.; Sutton, M.A. Development and types of passive samplers for monitoring atmospheric NO2 and NH3 concentrations. Sci. World J. 2001, 1, 513–529. [Google Scholar] [CrossRef] [PubMed]
- Tate, P. Ammonia Sampling Using Ogawa® Passive Samplers. Master’s Thesis, University of South Florida, Tampa, FL, USA, 2002. Available online: https://digitalcommons.usf.edu/cgi/viewcontent.cgi?article=2529&context=etd (accessed on 29 March 2025).
- Roadman, M.J.; Scudlark, J.R.; Meisinger, J.J.; Ullman, W.J. Validation of Ogawa passive samplers for the determination of gaseous ammonia concentrations in agricultural settings. Atmos. Environ. 2003, 37, 2317–2325. [Google Scholar] [CrossRef]
- Thöni, L.; Seitler, V.; Blatter, A.; Neftel, A. A passive sampling method to determine ammonia in ambient air. J. Environ. Monit. 2003, 5, 96–99. [Google Scholar] [CrossRef]
- Puchalski, M.A.; Sather, M.E.; Walker, J.T.; Lehmann, C.M.; Gay, D.A.; Mathew, J.; Robarge, W.P. Passive ammonia monitoring in the United States: Comparing three different sampling devices. J. Environ. Monit. 2011, 13, 3156–3167. [Google Scholar] [CrossRef]
- Sabrina, J.; Nurulhuda, K.; Amin, A.M.; Sulaiman, M.F.; Man, H.C. Exploring use of a commercial passive sampler in a closed static chamber to measure ammonia volatilization. Environ. Pollut. 2022, 315, 120282. [Google Scholar] [CrossRef]
- CEN: EN 17346; Ambient Air—Standard Method for the Determination of the Concentration of Ammonia Using Diffusive Samplers. European Committee for Standardization: Brussels, Belgium, 2020. Available online: https://www.en-standard.eu/din-en-17346-ambient-air-standard-method-for-the-determination-of-the-concentration-of-ammonia-using-diffusive-samplers/ (accessed on 25 March 2025).
- Carmichael, G.R.; Ferm, M.; Thongboonchoo, N.; Woo, J.; Chan, L.Y.; Murano, K.; Viet, P.H.; Mossberg, C.; Bala, R.; Boonjawat, J.; et al. Measurements of sulfur dioxide, ozone and ammonia concentrations in Asia, Africa, and South America using passive samplers. Atmos. Environ. 2003, 37, 1293–1308. [Google Scholar] [CrossRef]
- Pan, Y.; Tian, S.; Zhao, Y.; Zhang, L.; Zhu, X.; Gao, J.; Huang, W.; Zhou, Y.; Song, Y.; Zhang, Q.; et al. Identifying Ammonia Hotspots in China Using a National Observation Network. Environ. Sci. Technol. 2018, 52, 3926–3934. [Google Scholar] [CrossRef] [PubMed]
- Yu, G.H.; Shin, H.J.; Jung, H.J.; Song, M.; Oh, S.H.; Choe, S.; Kang, G.U.; Jeon, H.; Bae, M.S. Insights into national distribution of NH3 concentrations in Republic of Korea: Findings from passive sampler observations and implications for sources and management. Environ. Monit. Assess. 2024, 196, 121. [Google Scholar] [CrossRef]
- Matsumoto, J.; Fujibe, F.; Takahashi, H. Urban climate in the Tokyo metropolitan area in Japan. J. Environ. Sci. 2017, 59, 54–62. [Google Scholar] [CrossRef]
- The Ministry of Land, Infrastructure and Transport. Statistics of Japan. Survey on Motor Vehicle Fuel Consumption, Statistics code: 00600370. Available online: https://www.mlit.go.jp/k-toukei/nenryousyouhiryou.html (accessed on 25 March 2025). (In Japanese).
- Osada, K.; Saito, S.; Tsurumaru, H.; Itahashi, S. NH3 emissions from the human body in central Tokyo decreased during the COVID-19 pandemic lockdown. Atmos. Environ. 2024, 318, 120244. [Google Scholar] [CrossRef]
- The Ministry of Land, Infrastructure and Transport. Road Traffic Census Vehicle Origin and Destination Survey. Available online: https://www.mlit.go.jp/road/census/r3/index.html (accessed on 25 March 2025). (In Japanese).
- Kawasaki, S. The challenges of transportation/traffic statistics in Japan and directions for the future. IATSS Res. 2015, 39, 1–8. [Google Scholar] [CrossRef]
- Iwafune, Y.; Ogimoto, K.; Azuma, H. Integration of electric vehicles into the electric power system based on results of road traffic census. Energies 2019, 12, 1849. [Google Scholar] [CrossRef]
- Shibata, Y.; Morikawa, T. Review of the JCAP/JATOP air quality model study in Japan. Atmosphere 2021, 12, 943. [Google Scholar] [CrossRef]
- Minoura, H.; Takahashi, K.; Chow, J.D.; Watson, J.G. Multi-year trend in fine and coarse particle mass, carbon, and ions in downtown Tokyo, Japan. Atmos. Environ. 2006, 40, 2478–2487. [Google Scholar] [CrossRef]
- Takahashi, K.; Minoura, H.; Sakamoto, K. Chemical composition of atmospheric aerosols in the general environment and around a trunk road in the Tokyo metropolitan area. Atmos. Environ. 2008, 42, 113–125. [Google Scholar] [CrossRef]
- AEROS (Ministry of the Environment). Atmospheric Environmental Regional Observation System. Available online: https://soramame.env.go.jp/ (accessed on 25 March 2025). (In Japanese).
- Ito, A.; Wakamatsu, S.; Morikawa, T.; Kobayashi, S. 30 Years of Air Quality Trends in Japan. Atmosphere 2021, 12, 1072. [Google Scholar] [CrossRef]
- Ogawa® Passive Samplers. Available online: http://ogawajapan.com/measurment.html (accessed on 25 March 2025). (In Japanese).
- Japan Meteorological Agency. Japan Meteorological Agency Regional Climate Projection Data for Japan. Available online: https://search.diasjp.net/en/dataset/JMA_GWP9 (accessed on 25 March 2025). (In Japanese).
- Ministry of the Environment. Results of Mass Concentration and Component Analysis (Manual Analysis) of Fine Particulate Matter (PM2.5). Available online: https://www.env.go.jp/air/osen/pm/monitoring.html (accessed on 25 March 2025). (In Japanese).
- Lee, M.A.; Davies, L.; Power, S.A. Effects of roads on adjacent plant community composition and ecosystem function: An example from three calcareous ecosystems. Environ. Pol. 2012, 63, 273–280. [Google Scholar] [CrossRef]
- Gadsdon, S.R.; Power, S.A. Quantifying local traffic contributions to NO2 and NH3 concentrations in natural habitats. Environ. Pollut. 2009, 157, 2845–42852. [Google Scholar] [CrossRef] [PubMed]
- Matsumoto, R.; Yonemochi, S.; Umezawa, N.; Sakamoto, K. The influence of vehicles emission on air concentration of ammonia and nitrogen oxides at roadside. Chikyu Kankyo 2010, 15, 103–110. (In Japanese) [Google Scholar] [CrossRef]
- Harrison, R.M.; Yin, J.; Tilling, R.M.; Cai, X.; Seakins, P.W.; Hopkins, J.R.; Lansley, D.L.; Lewis, A.C.; Hunter, M.C.; Heard, D.E.; et al. Measurement and modelling of air pollution and atmospheric chemistry in the U.K. west midlands conurbation: Overview of the PUMA consortium project. Sci. Total Environ. 2006, 360, 5–25. [Google Scholar] [CrossRef]
- Perrino, C.; Catrambone, M.; Di Menno di Bucchianico, A.; Allegrini, I. Gaseous ammonia in the urban area of Rome, Italy and its relationship with traffic emissions. Atmos. Environ. 2002, 36, 5385–5394. [Google Scholar] [CrossRef]
- Wentworth, G.R.; Murphy, J.G.; Gregoire, P.K.; Cheyne, C.A.L.; Tevlin, A.G.; Hems, R. Soil–atmosphere exchange of ammonia in a non-fertilized grassland: Measured emission potentials and inferred fluxes. Biogeosciences 2014, 11, 5675–5686. [Google Scholar] [CrossRef]
- Osada, K. Measurement report: Short-term variation in ammonia concentrations in an urban area increased by mist evaporation and emissions from a forest canopy with bird droppings. Atmos. Chem. Phys. 2020, 20, 11941–11954. [Google Scholar] [CrossRef]
- Minoura, H.; Ito, A. Observation of the primary NO2 and NO oxidation near the trunk road in Tokyo. Atmos. Environ. 2010, 44, 23–29. [Google Scholar] [CrossRef]
- Takekawa, H.; Chatani, S.; Ito, A. A new approach for estimation of the effect of NOx emission reduction on roadside NO2 concentration in Tokyo. Atmos. Environ. 2013, 68, 92–102. [Google Scholar] [CrossRef]
- Battye, W.; Aneja, V.P.; Roelle, P.A. Evaluation and improvement of ammonia emissions inventories. Atmos. Environ. 2003, 37, 3873–3883. [Google Scholar] [CrossRef]
- Aguilar-Dodier, L.C.; Castillo, J.E.; Quintana, P.J.; Montoya, L.D.; Molina, L.T.; Zavala, M.; Almanza-Veloz, V.; Rodríguez-Ventura, J.G. Spatial and temporal evaluation of H2S, SO2 and NH3 concentrations near Cerro Prieto geothermal power plant in Mexico. Atmos. Pollut. Res. 2020, 11, 94–104. [Google Scholar] [CrossRef]
- Gu, M.; Pan, Y.; Walters, W.W.; Sun, Q.; Song, L.; Wang, Y.; Xue, Y.; Fang, Y. Vehicular emissions enhanced ammonia concentrations in winter mornings: Insights from diurnal nitrogen isotopic signatures. Environ. Sci. Technol. 2022, 56, 1578–1585. [Google Scholar] [CrossRef]
- Farren, N.J.; Davison, J.; Rose, R.A.; Wagner, R.L.; Carslaw, D.C. Underestimated ammonia emissions from road vehicles. Environ. Sci. Technol. 2020, 54, 15689–15697. [Google Scholar] [CrossRef] [PubMed]
- Reche, C.; Viana, M.; Pandolfi, M.; Alastuey, A.; Moreno, T.; Amato, F.; Ripoll, A.; Querol, X. Urban NH3 levels and sources in a Mediterranean environment. Atmos. Environ. 2012, 57, 153–164. [Google Scholar] [CrossRef]
- Yamamoto, T.; Sekine, Y.; Sohara, K.; Nakai, S.; Yanagisawa, Y. Effect of heating temperature on ammonia emission in the mainstream aerosols from heated tobacco products. Toxics 2022, 10, 592. [Google Scholar] [CrossRef] [PubMed]
- Zhou, Y.; Zheng, N.; Luo, L.; Zhao, J.; Qu, L.; Guan, H.; Xiao, H.; Zhang, Z.; Tian, J.; Xiao, H. Biomass burning related ammonia emissions promoted a self-amplifying loop in the urban environment in Kunming (SW China). Atmos. Environ. 2020, 253, 118138. [Google Scholar] [CrossRef]
- Alnajideen, M.; Shi, H.; Northrop, W.; Emberson, D.; Kane, S.; Czyzewski, P.; Alnaeli, M.; Mashruk, S.; Rouwenhorst, K.; Yu, C.; et al. Ammonia combustion and emissions in practical applications: A review. Carbon Neutrality 2024, 3, 13. [Google Scholar] [CrossRef]
- Nadimi, E.; Przybyła, G.; Lewandowski, M.T.; Adamczyk, W. Effects of ammonia on combustion, emissions, and performance of the ammonia/diesel dual-fuel compression ignition engine. J. Energy Inst. 2023, 107, 101158. [Google Scholar] [CrossRef]
- Air Quality Consultants. Ammonia Emissions from Roads for Assessing Impacts on Nitrogen-Sensitive Habitats. February 2020. Available online: https://infrastructure.planninginspectorate.gov.uk/wp-content/ipc/uploads/projects/TR010030/TR010030-000742-Royal%20Horticulture%20Society%20-%20Appendix%20D%20Ammonia-from-Roads-for-Habitats-Assessments.pdf (accessed on 25 March 2025).
- Singh, R.; Kim, K.; Park, G.; Kang, S.; Park, T.; Ban, J.; Choi, S.; Song, J.; Yu, D.-G.; Woo, J.-H.; et al. Seasonal and Spatial Variations of Atmospheric Ammonia in the Urban and Suburban Environments of Seoul, Korea. Atmosphere 2021, 12, 1607. [Google Scholar] [CrossRef]
- Chang, Y.; Liu, X.; Deng, C.; Dore, A.J.; Zhuang, G. Source apportionment of atmospheric ammonia before, during, and after the 2014 APEC summit in Beijing using stable nitrogen isotope signatures. Atmos. Chem. Phys. 2016, 16, 11635–11647. [Google Scholar] [CrossRef]
- Yao, X.; Zhang, L. Trends in atmospheric ammonia at urban, rural, and remote sites across North America, Atmos. Chem. Phys. 2016, 16, 11465–11475. [Google Scholar] [CrossRef]
- Cao, J.J.; Zhang, T.; Chow, J.C.; Watson, J.G.; Wu, F.; Li, H. Characterization of atmospheric ammonia over Xi’an, China. Aerosol Air Qual. Res. 2009, 9, 277–289. [Google Scholar] [CrossRef]
- Meng, Z.Y.; Lin, W.L.; Jiang, X.M.; Yan, P.; Wang, Y.; Zhang, Y.M.; Jia, X.F.; Yu, X.L. Characteristics of atmospheric ammonia over Beijing, China. Atmos. Chem. Phys. 2011, 11, 6139–6151. [Google Scholar] [CrossRef]
- Zhou, C.; Zhou, H.; Holsen, T.M.; Hopke, P.K.; Edgerton, E.S.; Schwab, J.J. Ambient ammonia concentrations across New York State. J. Geophys. Res. Atmos. 2019, 124, 8287–8302. [Google Scholar] [CrossRef]
- Li, Y.; Thompson, T.M.; Van Damme, M.; Chen, X.; Benedict, K.B.; Shao, Y.; Day, D.; Boris, A.; Sullivan, A.P.; Ham, J.; et al. Temporal and spatial variability of ammonia in urban and agricultural regions of northern Colorado, United States. Atmos. Chem. Phys. 2017, 17, 6197–6213. [Google Scholar] [CrossRef]
- Oh, S.; Kim, S.-G.; Lee, J.B.; Park, J.; Jee, J.-B.; Hong, S.-W.; Kwon, K.-S.; Song, M. Spatial distributions of atmospheric ammonia in a rural area in South Korea and the associated impact on a nearby urban area. Atmosphere 2021, 12, 1411. [Google Scholar] [CrossRef]
- Wilson, S.M.S.; Serre, M.L. Use of passive samplers to measure ammonia levels in a high-density industrial hog farm area of North Carolina. Atmos. Environ. 2007, 41, 607–6086. [Google Scholar] [CrossRef]
- López-Aizpún, M.; Arango-Mora, C.; Santamaría, C.; Lasheras, E.; Santamaría, J.; Ciganda, V.; Cárdenas, L.; Elustondo, D. Atmospheric ammonia concentration modulates soil enzyme and microbial activity in an oak forest affecting soil microbial biomass. Soil Biol. Biochem. 2018, 116, 378–387. [Google Scholar] [CrossRef]
- Osada, K.; Saito, S.; Tsurumaru, H.; Hoshi, J. Vehicular exhaust contributions to high NH3 and PM2.5 concentrations during winter in Tokyo, Japan. Atmos. Environ. 2019, 206, 218–224. [Google Scholar] [CrossRef]
- Kean, A.J.; Harley, R.A.; Littlejohn, D.; Kendall, G.R. On-road measurement of ammonia and other motor vehicle exhaust emissions. Environ. Sci. Technol. 2000, 34, 3535–3539. [Google Scholar] [CrossRef]
- Emmenegger, L.; Mohn, J.; Sigrist, M.; Marinov, D.; Steinemann, U.; Zumsteg, F.; Meier, M. Measurement of ammonia emissions using various techniques in a comparative tunnel study. Int. J. Environ. Pollut. 2004, 22, 326–341. [Google Scholar] [CrossRef]
- Vieira-Filho, M.S.; Ito, D.T.; Pedrotti, J.J.; Coelho, L.H.G.; Fornaro, A. Gas-phase ammonia and water-soluble ions in particulate matter analysis in an urban vehicular tunnel. Environ. Sci. Pollut. Res. 2016, 23, 19876–19886. [Google Scholar] [CrossRef] [PubMed]
- Liu, T.; Wang, X.; Wang, B.; Ding, X.; Deng, W.; Lü, S.; Zhang, Y. Emission factor of ammonia (NH3) from on-road vehicles in China: Tunnel tests in urban Guangzhou. Environ. Res. Lett. 2014, 9, 064027. [Google Scholar] [CrossRef]
- Baum, M.M.; Kiyomiya, E.S.; Kumar, S.; Lappas, A.M.; Kapinus, V.A.; Lord, H.C., III. Multicomponent remote sensing of vehicle exhaust by dispersive absorption spectroscopy. 2. Direct on road ammonia measurements. Environ. Sci. Technol. 2001, 35, 3735–3741. [Google Scholar] [CrossRef]
- Durbin, T.D.; Wilson, R.D.; Norbeck, J.M.; Miller, J.W.; Huai, T.; Rhee, S.H. Estimates of the emission rates of ammonia from light-duty vehicles using standard chassis dynamometer test cycles. Atmos. Environ. 2002, 36, 1475–1482. [Google Scholar] [CrossRef]
- Karlsson, H.L. Ammonia, nitrous oxide and hydrogen cyanide emissions from five passenger vehicles. Sci. Total Environ. 2004, 334–335, 125–132. [Google Scholar] [CrossRef]
- Livingston, C.; Rieger, P.; Winer, A. Ammonia emissions from a representative in-use fleet of light and medium-duty vehicles in the California South Coast Air Basin. Atmos. Environ. 2009, 43, 3326–3333. [Google Scholar] [CrossRef]
- Suarez-Bertoa, R.; Zardini, A.A.; Astorga, C. Ammonia exhaust emissions from spark ignition vehicles over the New European Driving Cycle. Atmos. Environ. 2014, 97, 43–53. [Google Scholar] [CrossRef]
- Suarez-Bertoa, R.; Mendoza-Villafuerte, P.; Riccobono, F.; Vojtisek, M.; Pechout, M.; Perujo, A.; Astorga, C. On-road measurement of NH3 emissions from gasoline and diesel passenger cars during real world driving conditions. Atmos. Environ. 2017, 166, 488–497. [Google Scholar] [CrossRef]
- Selleri, T.; Melas, A.; Bonnel, P.; Suarez-Bertoa, R. NH3 and CO emissions from fifteen Euro 6d and Euro 6d-TEMP gasoline-fuelled vehicles. Catalysts 2022, 12, 245. [Google Scholar] [CrossRef]
- Suarez-Bertoa, R.; Pechout, M.; Vojtíšek, M.; Astorga, C. Regulated and non-regulated emissions from Euro 6 diesel, gasoline and CNG vehicles under real-world driving conditions. Atmosphere 2020, 11, 204. [Google Scholar] [CrossRef]
- Chatani, S.; Kitayama, K.; Itahashi, S.; Irie, H.; Shimadera, H. Effectiveness of emission controls implemented since 2000 on ambient ozone concentrations in multiple timescales in Japan: An emission inventory development and simulation study. Sci. Total Environ. 2023, 894, 165058. [Google Scholar] [CrossRef] [PubMed]
- Davison, J.; Bernard, Y.; Borken-Kleefeld, J.; Farren, N.J.; Hausberger, S.; Sjödin, Å.; Tate, J.E.; Vaughan, A.R.; Carslaw, D.C. Distance-based emission factors from vehicle emission remote sensing measurements. Sci. Total Environ. 2020, 739, 139688. [Google Scholar] [CrossRef]
- Pant, P.; Harrison, R.M. Estimation of the contribution of road traffic emissions to particulate matter concentrations from field measurements: A review. Atmos. Environ. 2013, 77, 78–97. [Google Scholar] [CrossRef]
- Ministry of Environment, Japan. Guidelines for Calculating Total Greenhouse Gas Emissions. 2007. Available online: https://www.env.go.jp/policy/local_keikaku/data/guideline.pdf (accessed on 25 March 2025). (In Japanese).
- Ministry of Land, Infrastructure, Transport and Tourism. Automobile Fuel Consumption Survey. 2017. Available online: https://www.e-stat.go.jp/stat-search/files?page=1&layout=datalist&cycle=8&toukei=00600370&tstat=000001051698&tclass1val=0&year=20171&month=0&result_back=1 (accessed on 25 March 2025). (In Japanese).
- Ministry of Environment, Japan. Other-Urea Used as a Catalyst. Detailed Information on the Calculation Method for Greenhouse Gas Emissions and Sinks. 2024. Available online: https://www.env.go.jp/content/000273300.pdf (accessed on 25 March 2025). (In Japanese).
- Automobile Inspection and Registration Information Association. Automobile Ownership Trends in Japan. Available online: https://www.airia.or.jp/publish/statistics/trend.html (accessed on 25 March 2025). (In Japanese).
- Teng, X.; Hu, Q.; Zhang, L.; Qi, J.; Shi, J.; Xie, H.; Gao, H.; Yao, X. Identification of major sources of atmospheric NH3 in an urban environment in Northern China during wintertime. Environ. Sci. Technol. 2017, 51, 6839–6848. [Google Scholar] [CrossRef]
- Japan Automobile Manufacturers Association, Inc. The Motor Industry of Japan. 2024. Available online: https://www.jama.or.jp/english/reports/docs/MIoJ2024_e.pdf (accessed on 25 March 2025).
- European Union Law. Proposal for a Directive of the European Parliament and of the Council on Ambient Air Quality and Cleaner Air for Europe (Recast). Document 52022PC0542. Official Journal of the European Union. 2022. Available online: https://eur-lex.europa.eu/legal-content/EN/TXT/?uri=COM:2022:0542:FIN (accessed on 25 March 2025).


| Site | Location | Distance from Road | Latitude | Longitude |
|---|---|---|---|---|
| 0 | Noge Station | 3.23 m | N 35°36′22.60″ | E 139°38′33.71″ |
| 1 | Streetlight | 0.55 m | N 35°36′23.10″ | E 139°38′32.88″ |
| 2 | Streetlight | 0.55 m | N 35°36′22.40″ | E 139°38′34.80″ |
| 3 | Streetlight | 0.55 m | N 35°36′21.85″ | E 139°38′36.87″ |
| 4 | Streetlight | 0.65 m | N 35°36′22.69″ | E 139°38′35.95″ |
| 5 | Streetlight | 0.65 m | N 35°36′23.26″ | E 139°38′34.06″ |
| 6 | Pedestrian Bridge | 1.20 m | N 35°36′23.93″ | E 139°38′32.68″ |
| 7 | Pedestrian Bridge | 1.90 m | N 35°36′24.58″ | E 139°38′30.81″ |
| 8 | Lamppost | 16.58 m | N 35°36′22.69″ | E 139°38′31.80″ |
| 9 | Lamppost | 60 m | N 35°36′21.35″ | E 139°38′31.25″ |
| 10 | Lamppost | 122 m | N 35°36′19.63″ | E 139°38′29.77″ |
| 11 | Lamppost | 9.50 m | N 35°36′21.86″ | E 139°38′35.35″ |
| 12 | Lamppost | 78 m | N 35°36′19.72″ | E 139°38′34.73″ |
| 13 | Lamppost | 98 m | N 35°36′19.09″ | E 139°38′34.72″ |
| 14 | Telegraph Pole | 9.15 m | N 35°36′23.70″ | E 139°38′33.48″ |
| 15 | Telegraph Pole | 67 m | N 35°36′25.41″ | E 139°38′34.28″ |
| 16 | Telegraph Pole | 98 m | N 35°36′26.55″ | E 139°38′34.70″ |
| 17 | Telegraph Pole | 17.2 m | N 35°36′22.78″ | E 139°38′38.15″ |
| 18 | Telegraph Pole | 57 m | N 35°36′23.99″ | E 139°38′38.55″ |
| 19 | Telegraph Pole | 104 m | N 35°36′25.60″ | E 139°38′38.76″ |
| 20 | Setagaya Station | Building Rooftop | N 35°38′48.12″ | E 139°39′11.42″ |
| Location or Target | Measurement Device | Year | NH3 Emissions [mg/km/Vehicle] | Reference |
|---|---|---|---|---|
| Roadside, Tokyo, Japan | Passive sampler | 2017–2018 | 4–50 | This Study |
| Urban, Tokyo, Japan | Semi-continuous analyzer | 2017 | 3.7–32 | [97] |
| Van Nuys Tunnel, California, USA | Filter pack | 1993 | 61 | [32] |
| Caldecott Tunnel, California, USA | Denuder | 1999 | 46–52 | [98] |
| Gurbrist Tunnel, Switzerland | Continuous analyzer | 2002 | 26–35 | [99] |
| Jânio Quadros Tunnel, São Paulo, Brazil | Impinger | 2011 | 20–64 | [100] |
| Tunnel, Guangzhou, China | Semi-continuous analyzer | 2013 | 216–119 | [101] |
| Handan Tunnel, Shanghai, China | Passive | 2014 | 23–52 | [22] |
| On-road, California, USA | Remote sensing | 1996 | 86–102 | [102] |
| Gasoline vehicle | Chassis dynamometer | 2002 | 2–110 | [103] |
| Gasoline vehicle | Chassis dynamometer | 2004 | 1–31 | [104] |
| Gasoline vehicle | Chassis dynamometer | 2006 | 3–256 | [105] |
| Gasoline vehicle | Chassis dynamometer | 2008 | 3–28 | [31] |
| Gasoline vehicle | Chassis dynamometer | 2014 | 4–70 | [106] |
| Gasoline vehicle | Chassis dynamometer | 2017 | 2–132 | [107] |
| Gasoline vehicle | Chassis dynamometer | 2018 | 5–53 | [36] |
| Gasoline vehicle | Chassis dynamometer | 2022 | 1–53 | [108] |
| Gasoline vehicle | On road | 2020 | 1–53 | [109] |
| Diesel vehicle | On road | 2020 | 1–32 | [109] |
| Compressed natural gas vehicle | On road | 2020 | 38–90 | [109] |
| Gasoline vehicle | Emission inventory | 2018 | 29–104 | [80] |
| Diesel vehicle | Emission inventory | 2018 | 0.6–1.7 | [80] |
| Gasoline vehicle, Japan | Emission inventory | 2020 | 0.1–95 | [110] |
Disclaimer/Publisher’s Note: The statements, opinions and data contained in all publications are solely those of the individual author(s) and contributor(s) and not of MDPI and/or the editor(s). MDPI and/or the editor(s) disclaim responsibility for any injury to people or property resulting from any ideas, methods, instructions or products referred to in the content. |
© 2025 by the author. Licensee MDPI, Basel, Switzerland. This article is an open access article distributed under the terms and conditions of the Creative Commons Attribution (CC BY) license (https://creativecommons.org/licenses/by/4.0/).
Share and Cite
Hagino, H. Measuring Ammonia Concentration Distributions with Passive Samplers to Evaluate the Impact of Vehicle Exhaust on a Roadside Environment in Tokyo, Japan. Atmosphere 2025, 16, 519. https://doi.org/10.3390/atmos16050519
Hagino H. Measuring Ammonia Concentration Distributions with Passive Samplers to Evaluate the Impact of Vehicle Exhaust on a Roadside Environment in Tokyo, Japan. Atmosphere. 2025; 16(5):519. https://doi.org/10.3390/atmos16050519
Chicago/Turabian StyleHagino, Hiroyuki. 2025. "Measuring Ammonia Concentration Distributions with Passive Samplers to Evaluate the Impact of Vehicle Exhaust on a Roadside Environment in Tokyo, Japan" Atmosphere 16, no. 5: 519. https://doi.org/10.3390/atmos16050519
APA StyleHagino, H. (2025). Measuring Ammonia Concentration Distributions with Passive Samplers to Evaluate the Impact of Vehicle Exhaust on a Roadside Environment in Tokyo, Japan. Atmosphere, 16(5), 519. https://doi.org/10.3390/atmos16050519