
Analysis of Nitrogen Dioxide Concentration at Highway Toll Stations Based on fsQCA—Data Sourced from Sentinel-5P


Abstract
1. Introduction
2. Data and Methods
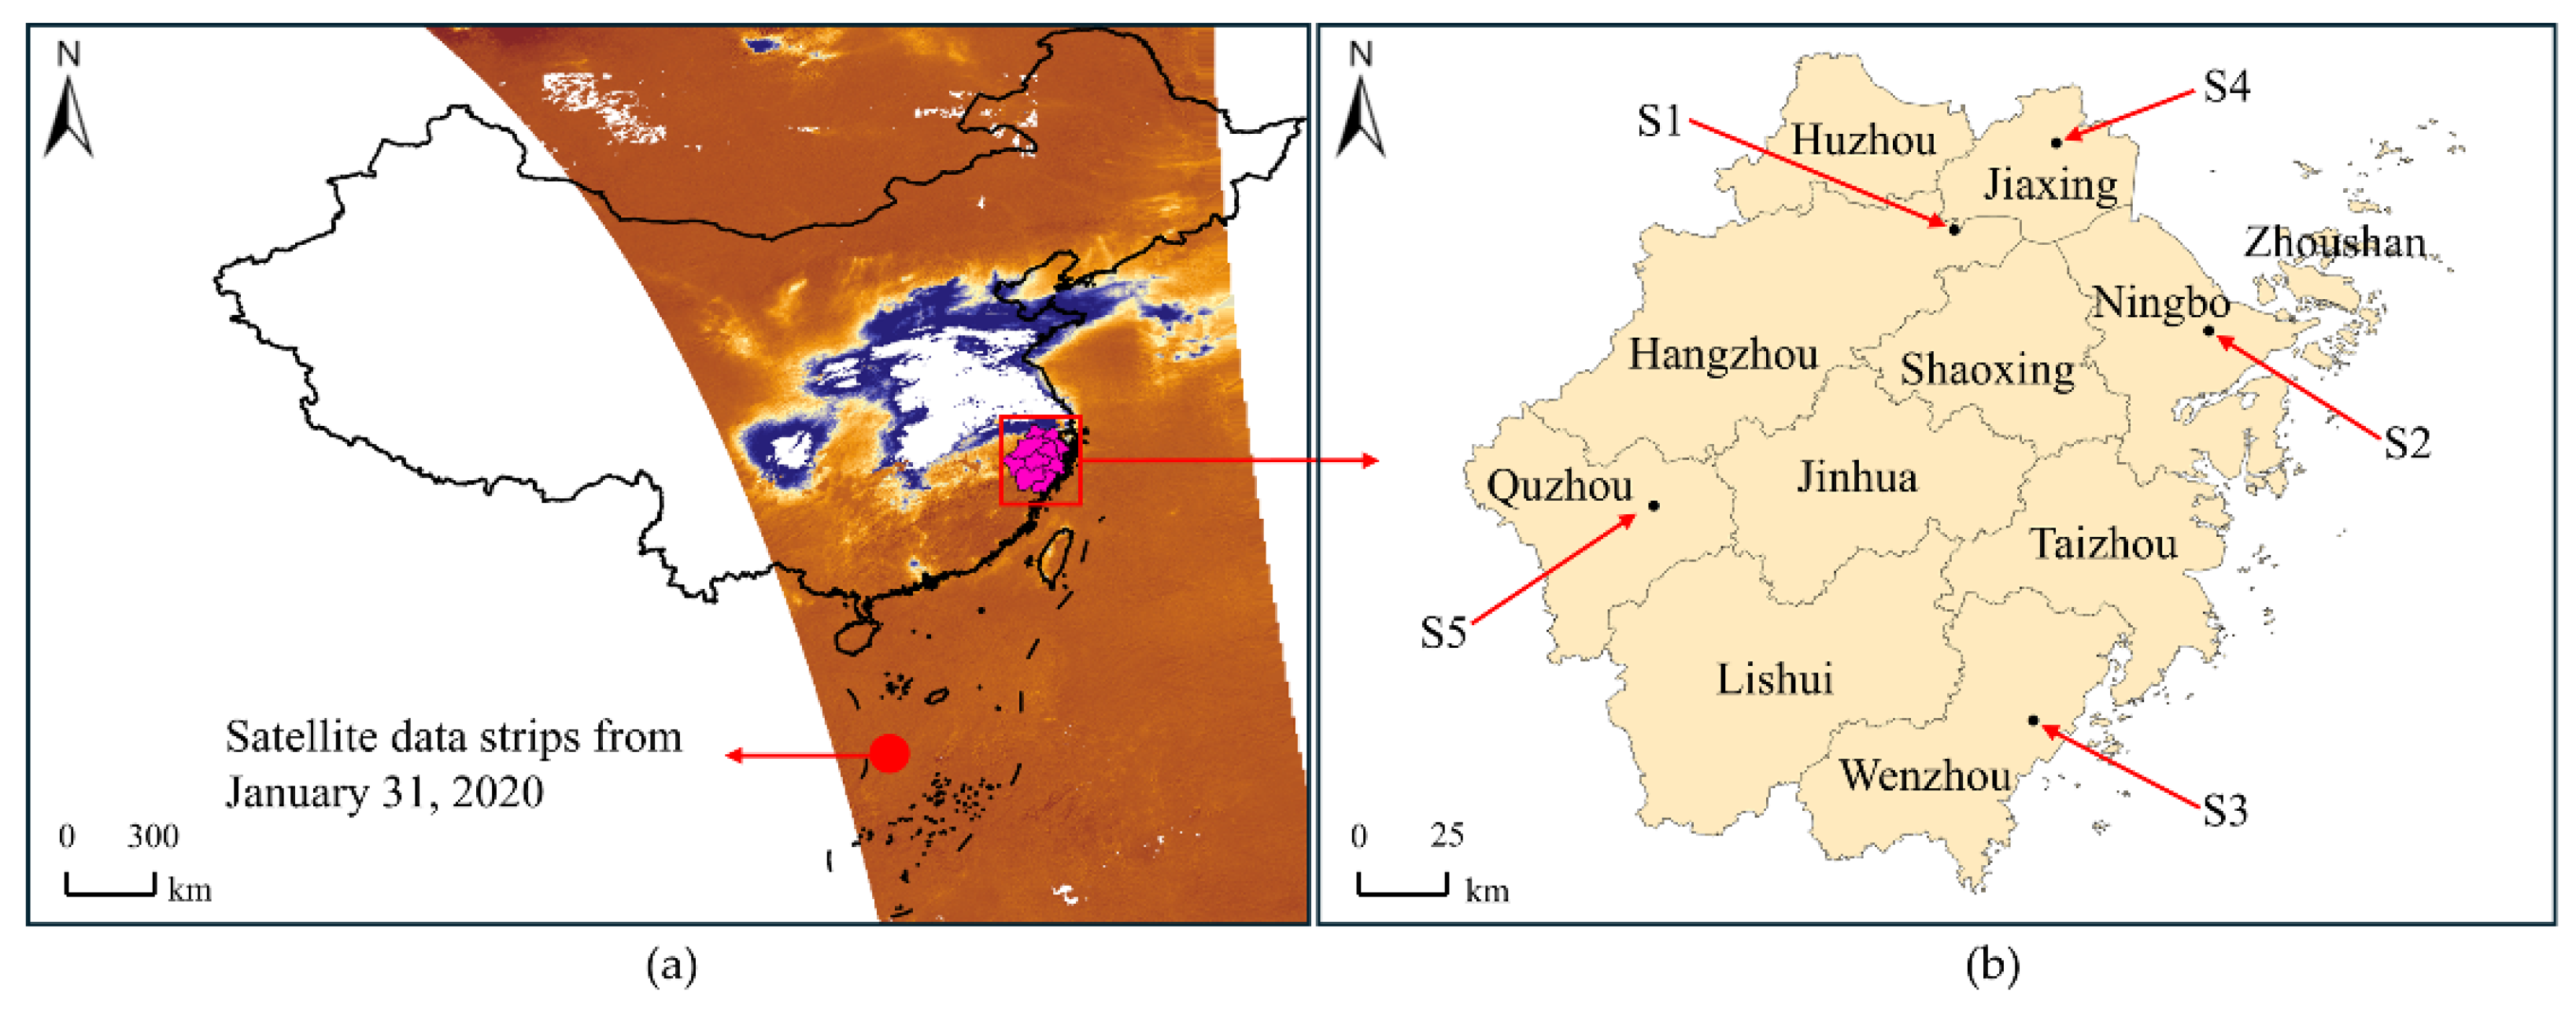
2.1. Study Area
2.2. Data Sources
2.3. Measurement of Variables in fsQCA
2.3.1. Outcome Variable
2.3.2. Conditional Variables
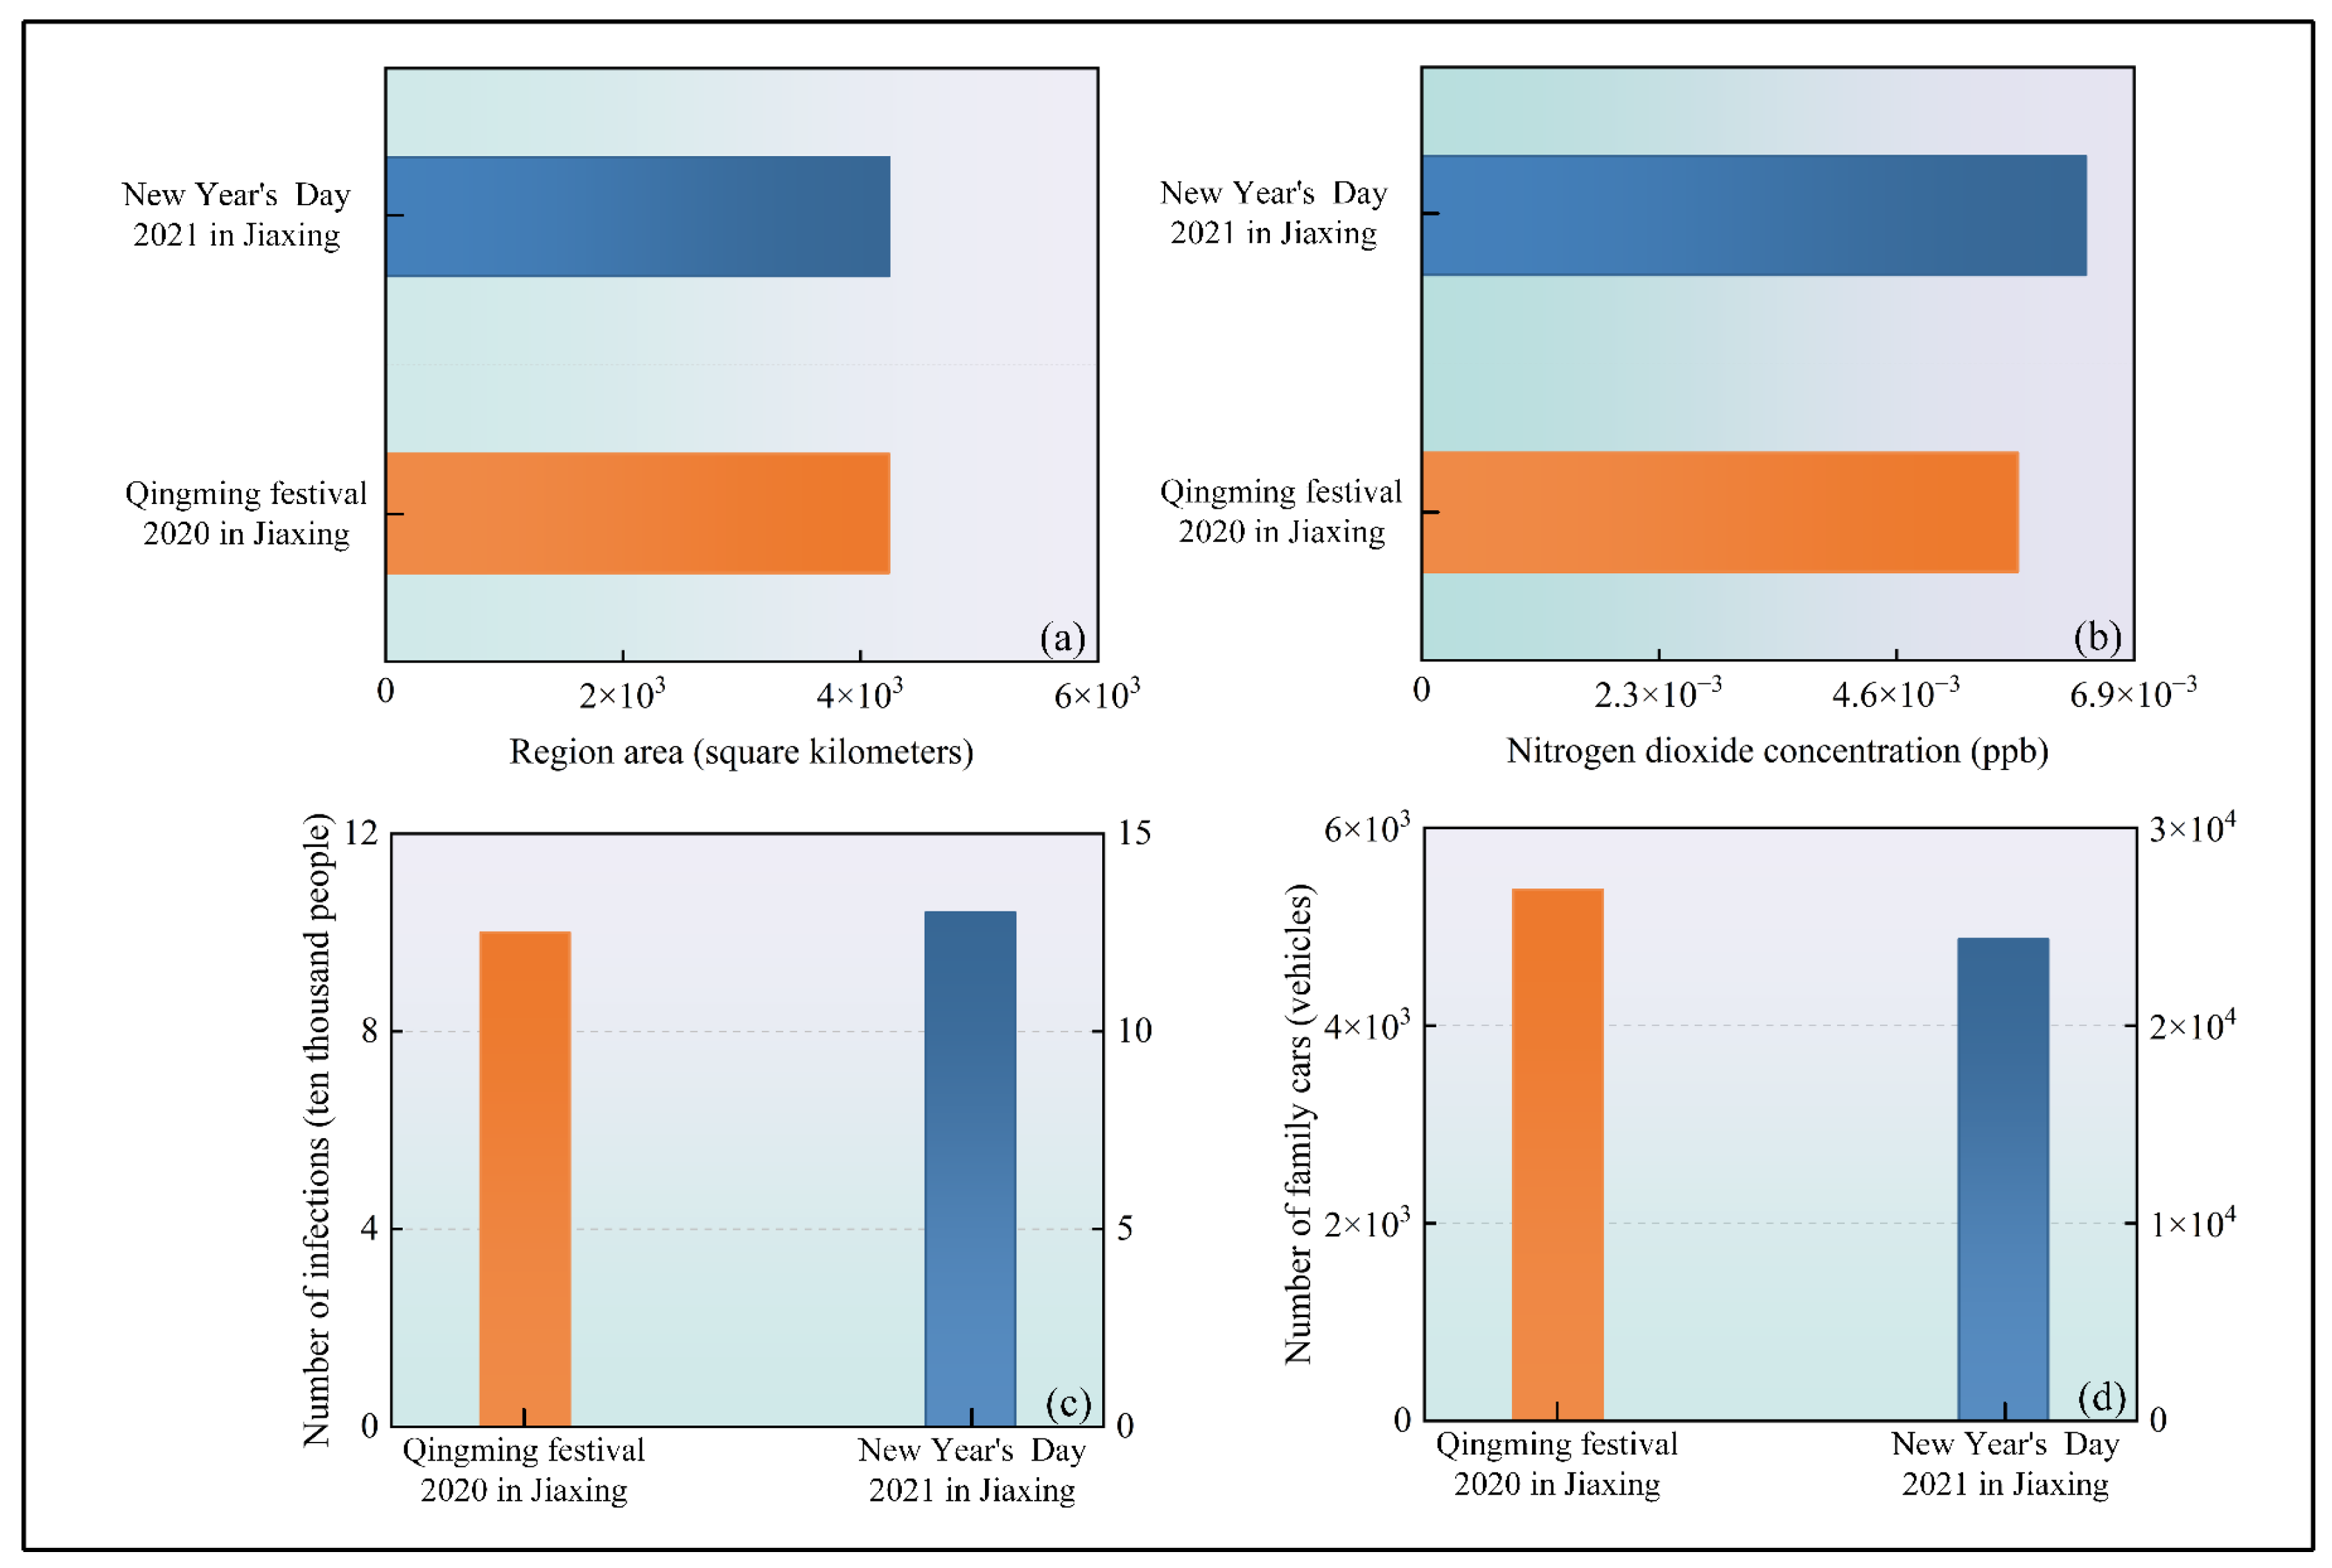
Region Area
Number of COVID-19 Infections
Average Temperature During Holidays
Number of Holiday Days
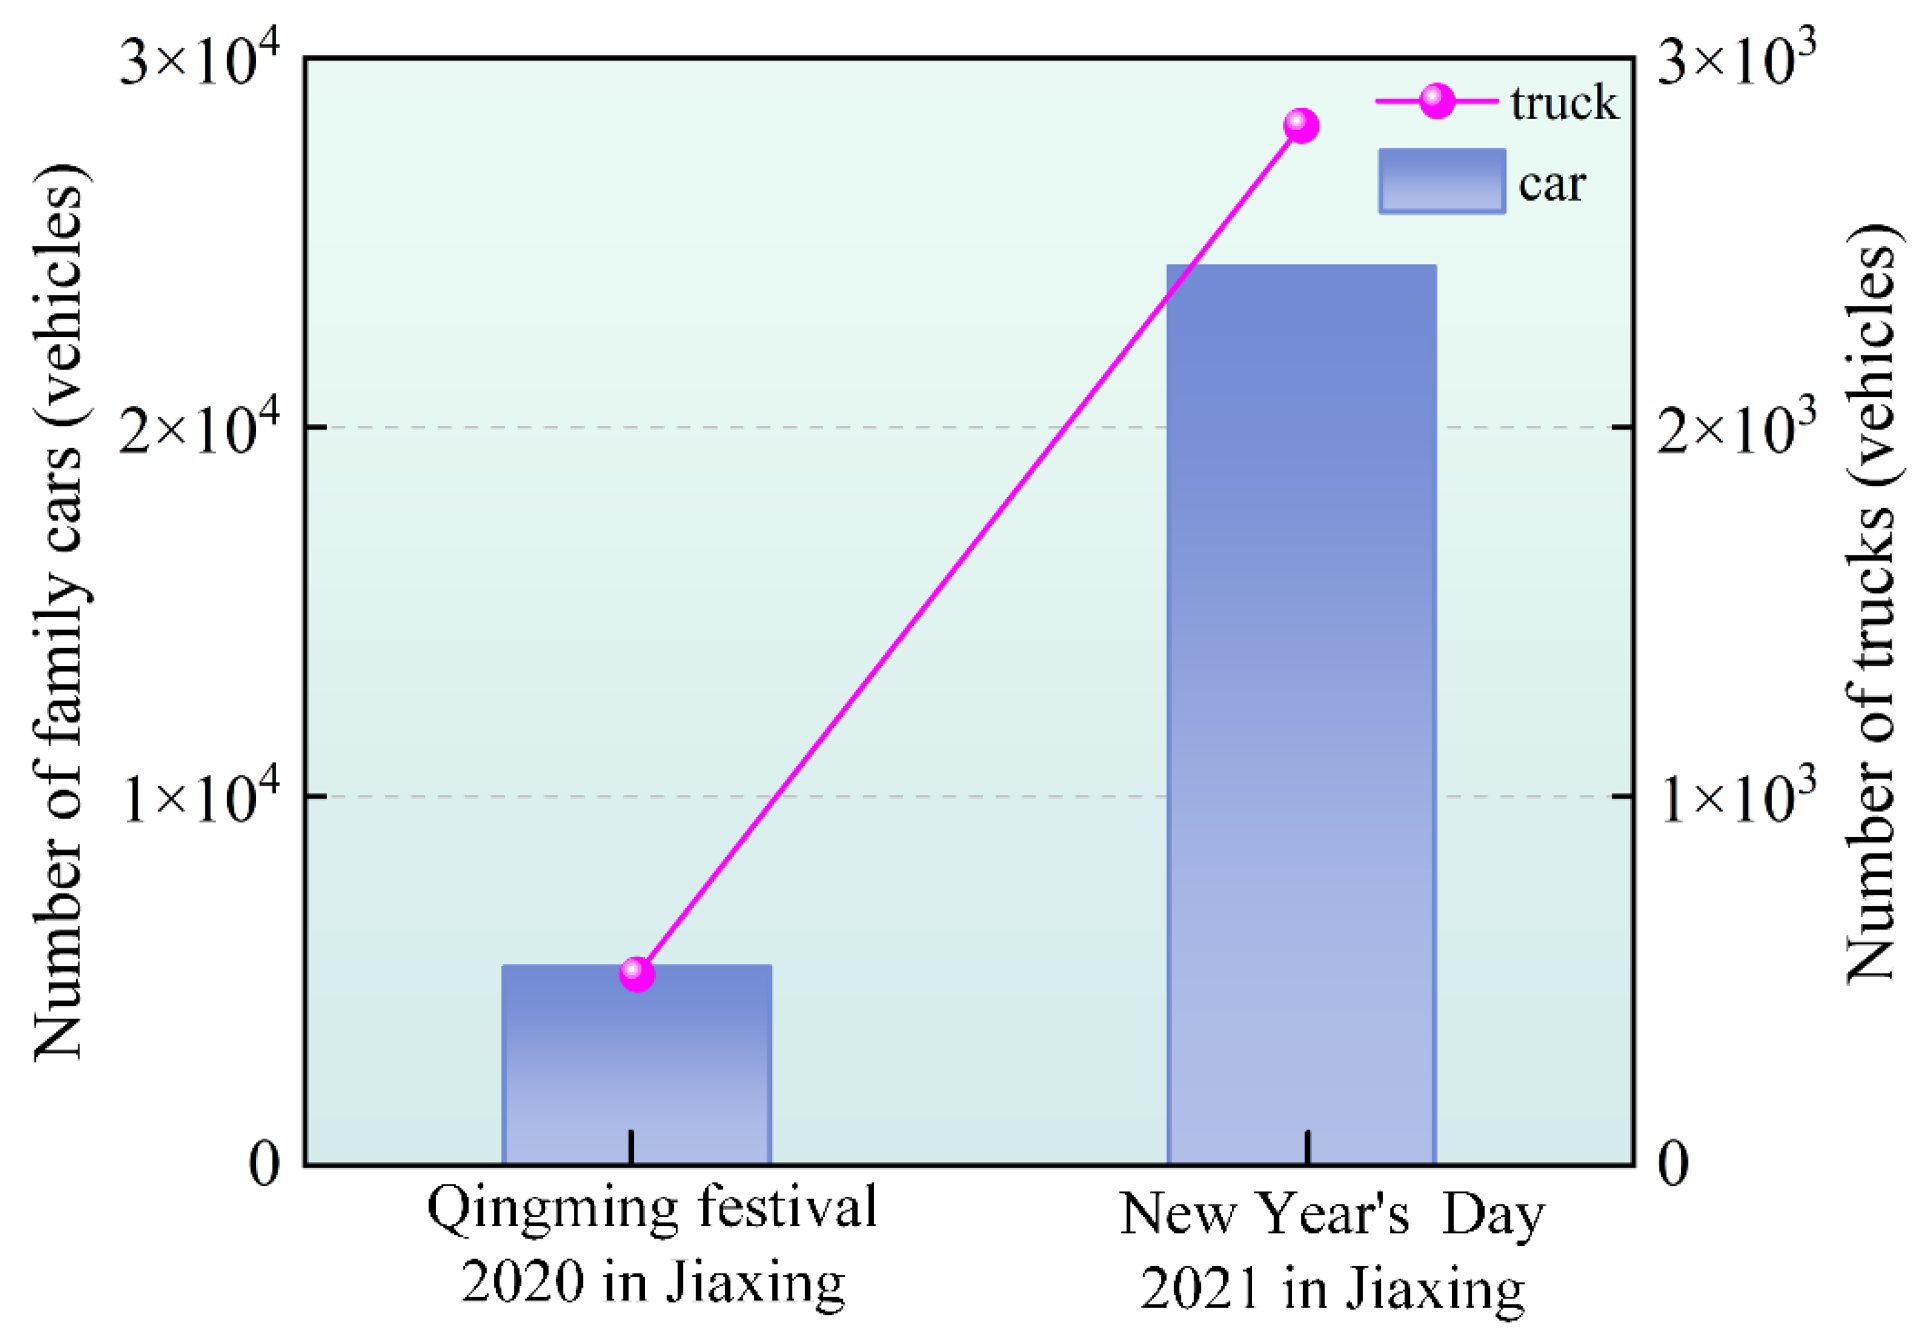
The Number of Family Cars
2.3.3. Conditional Variable Data Processing
2.4. Data Calibration
3. Results and Discussion
3.1. Necessity Analysis
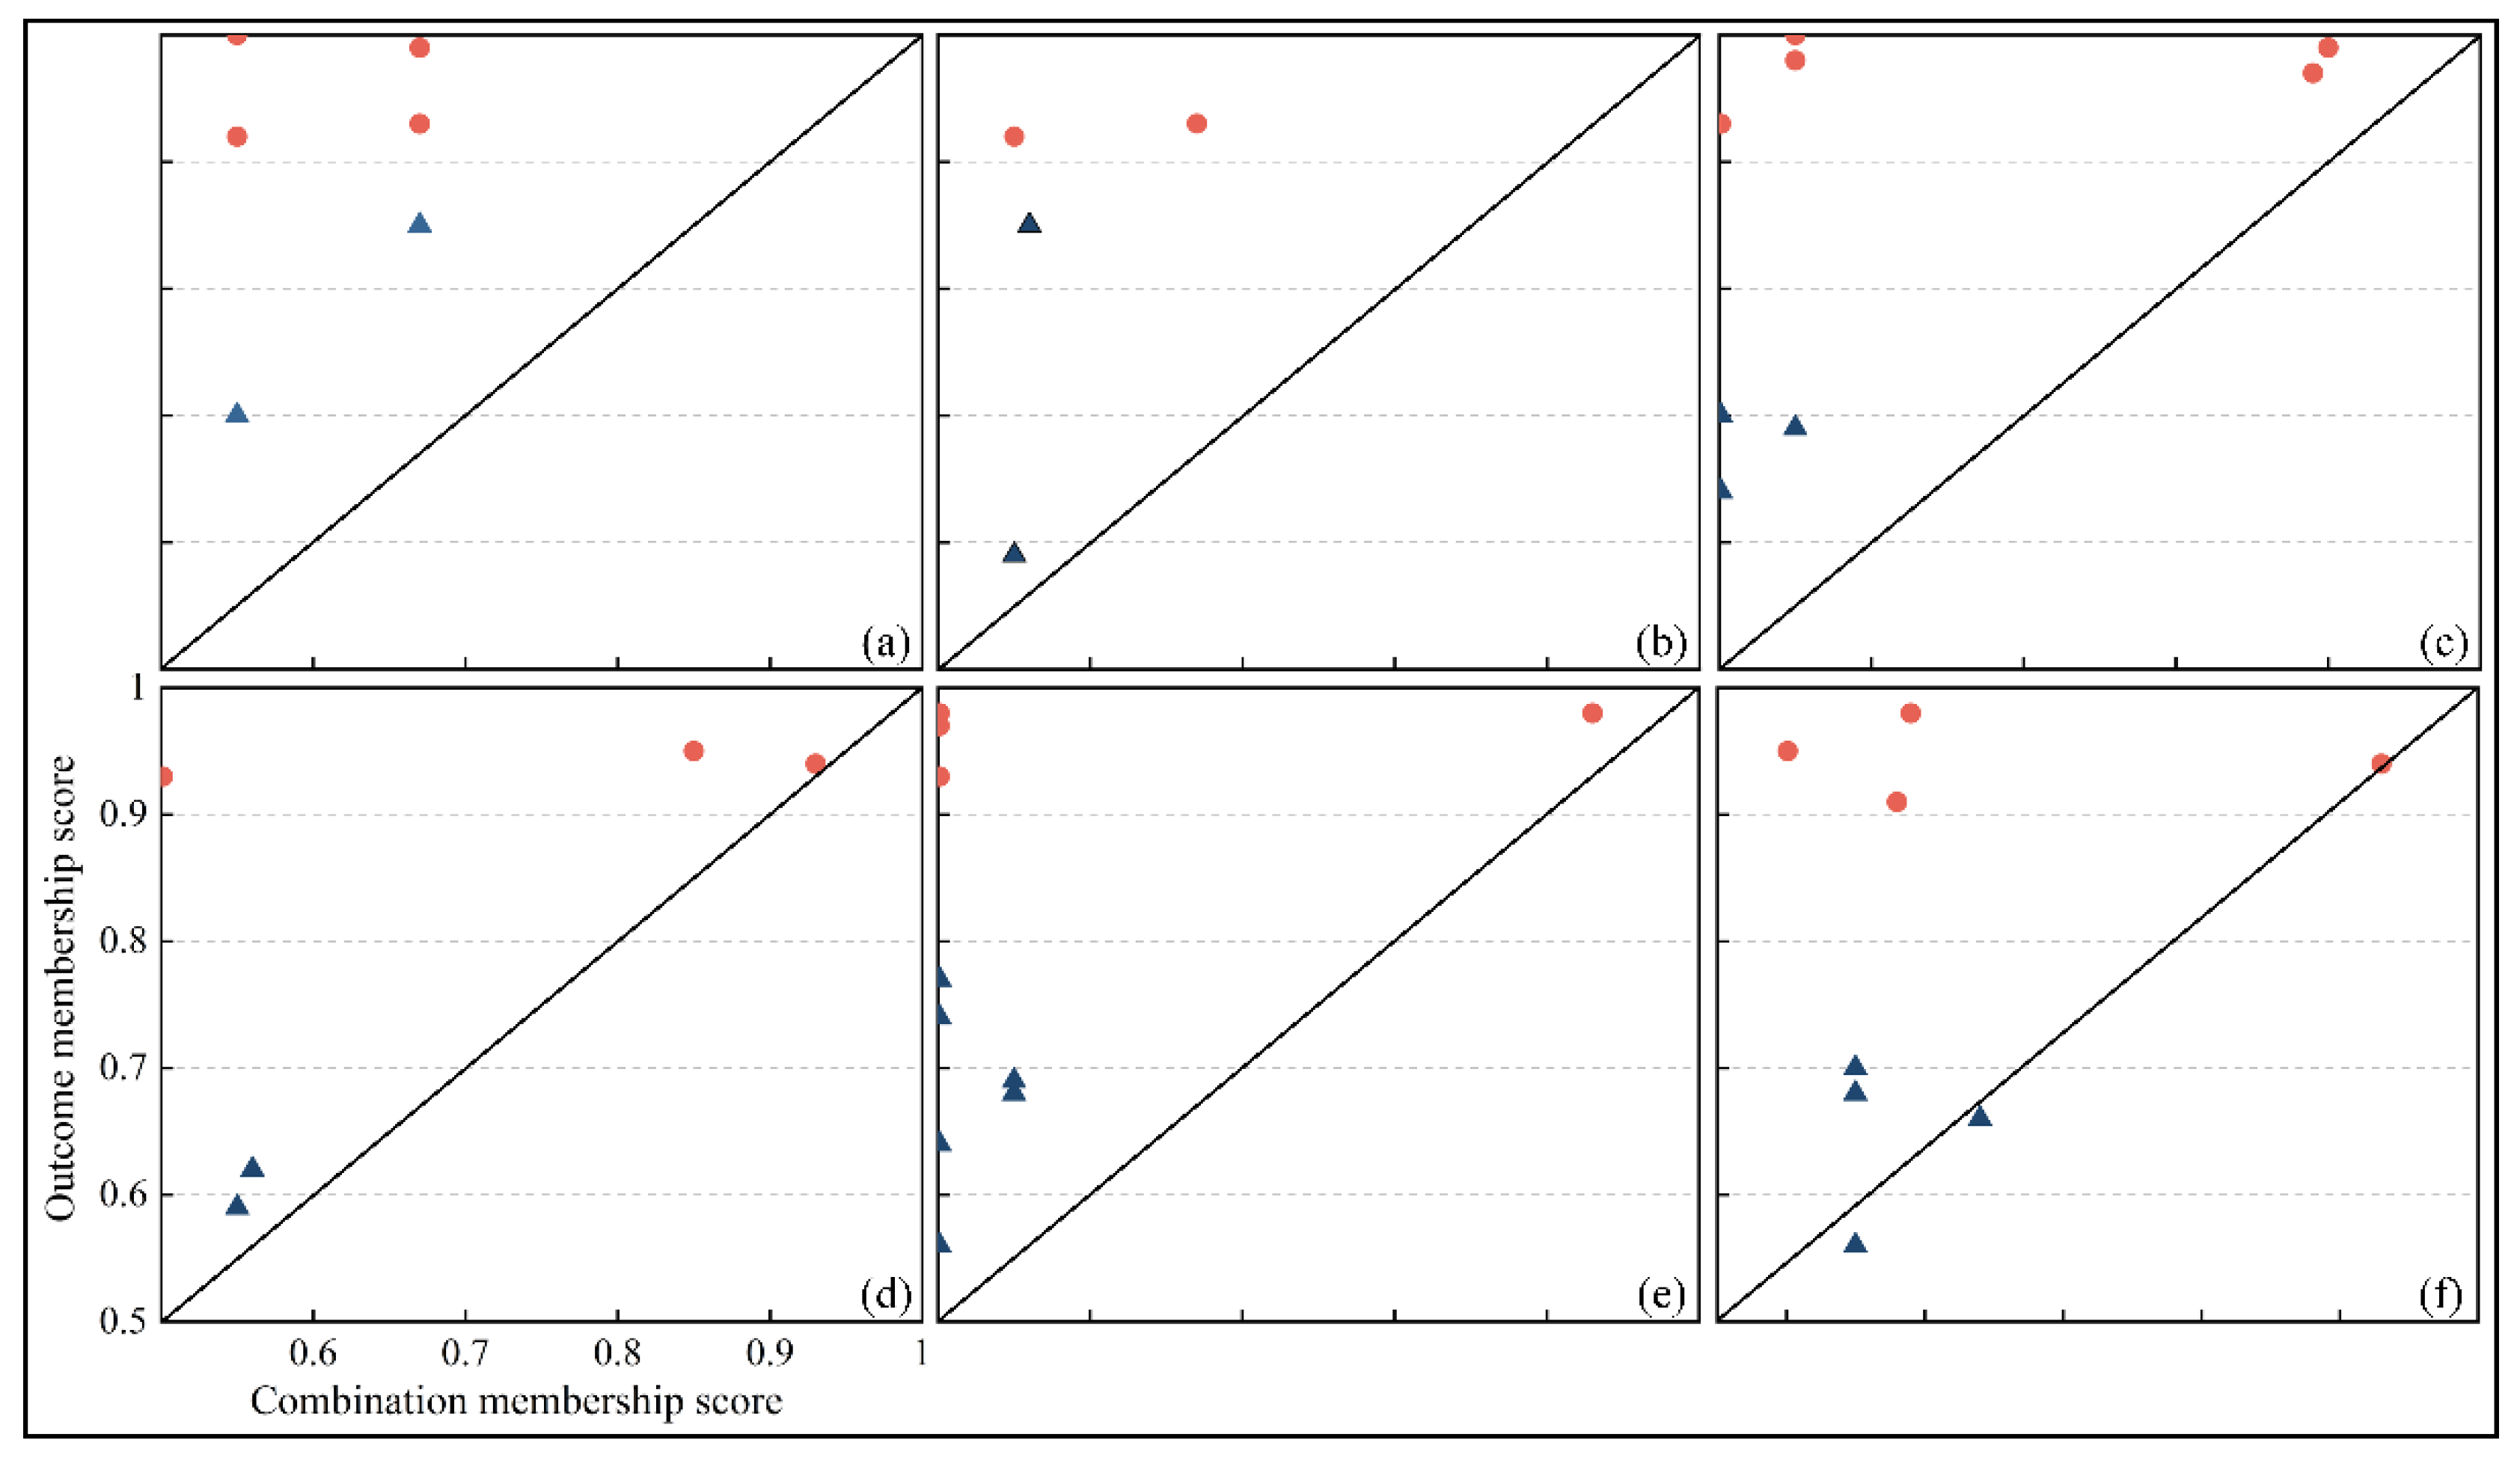
3.2. Results of the fsQCA
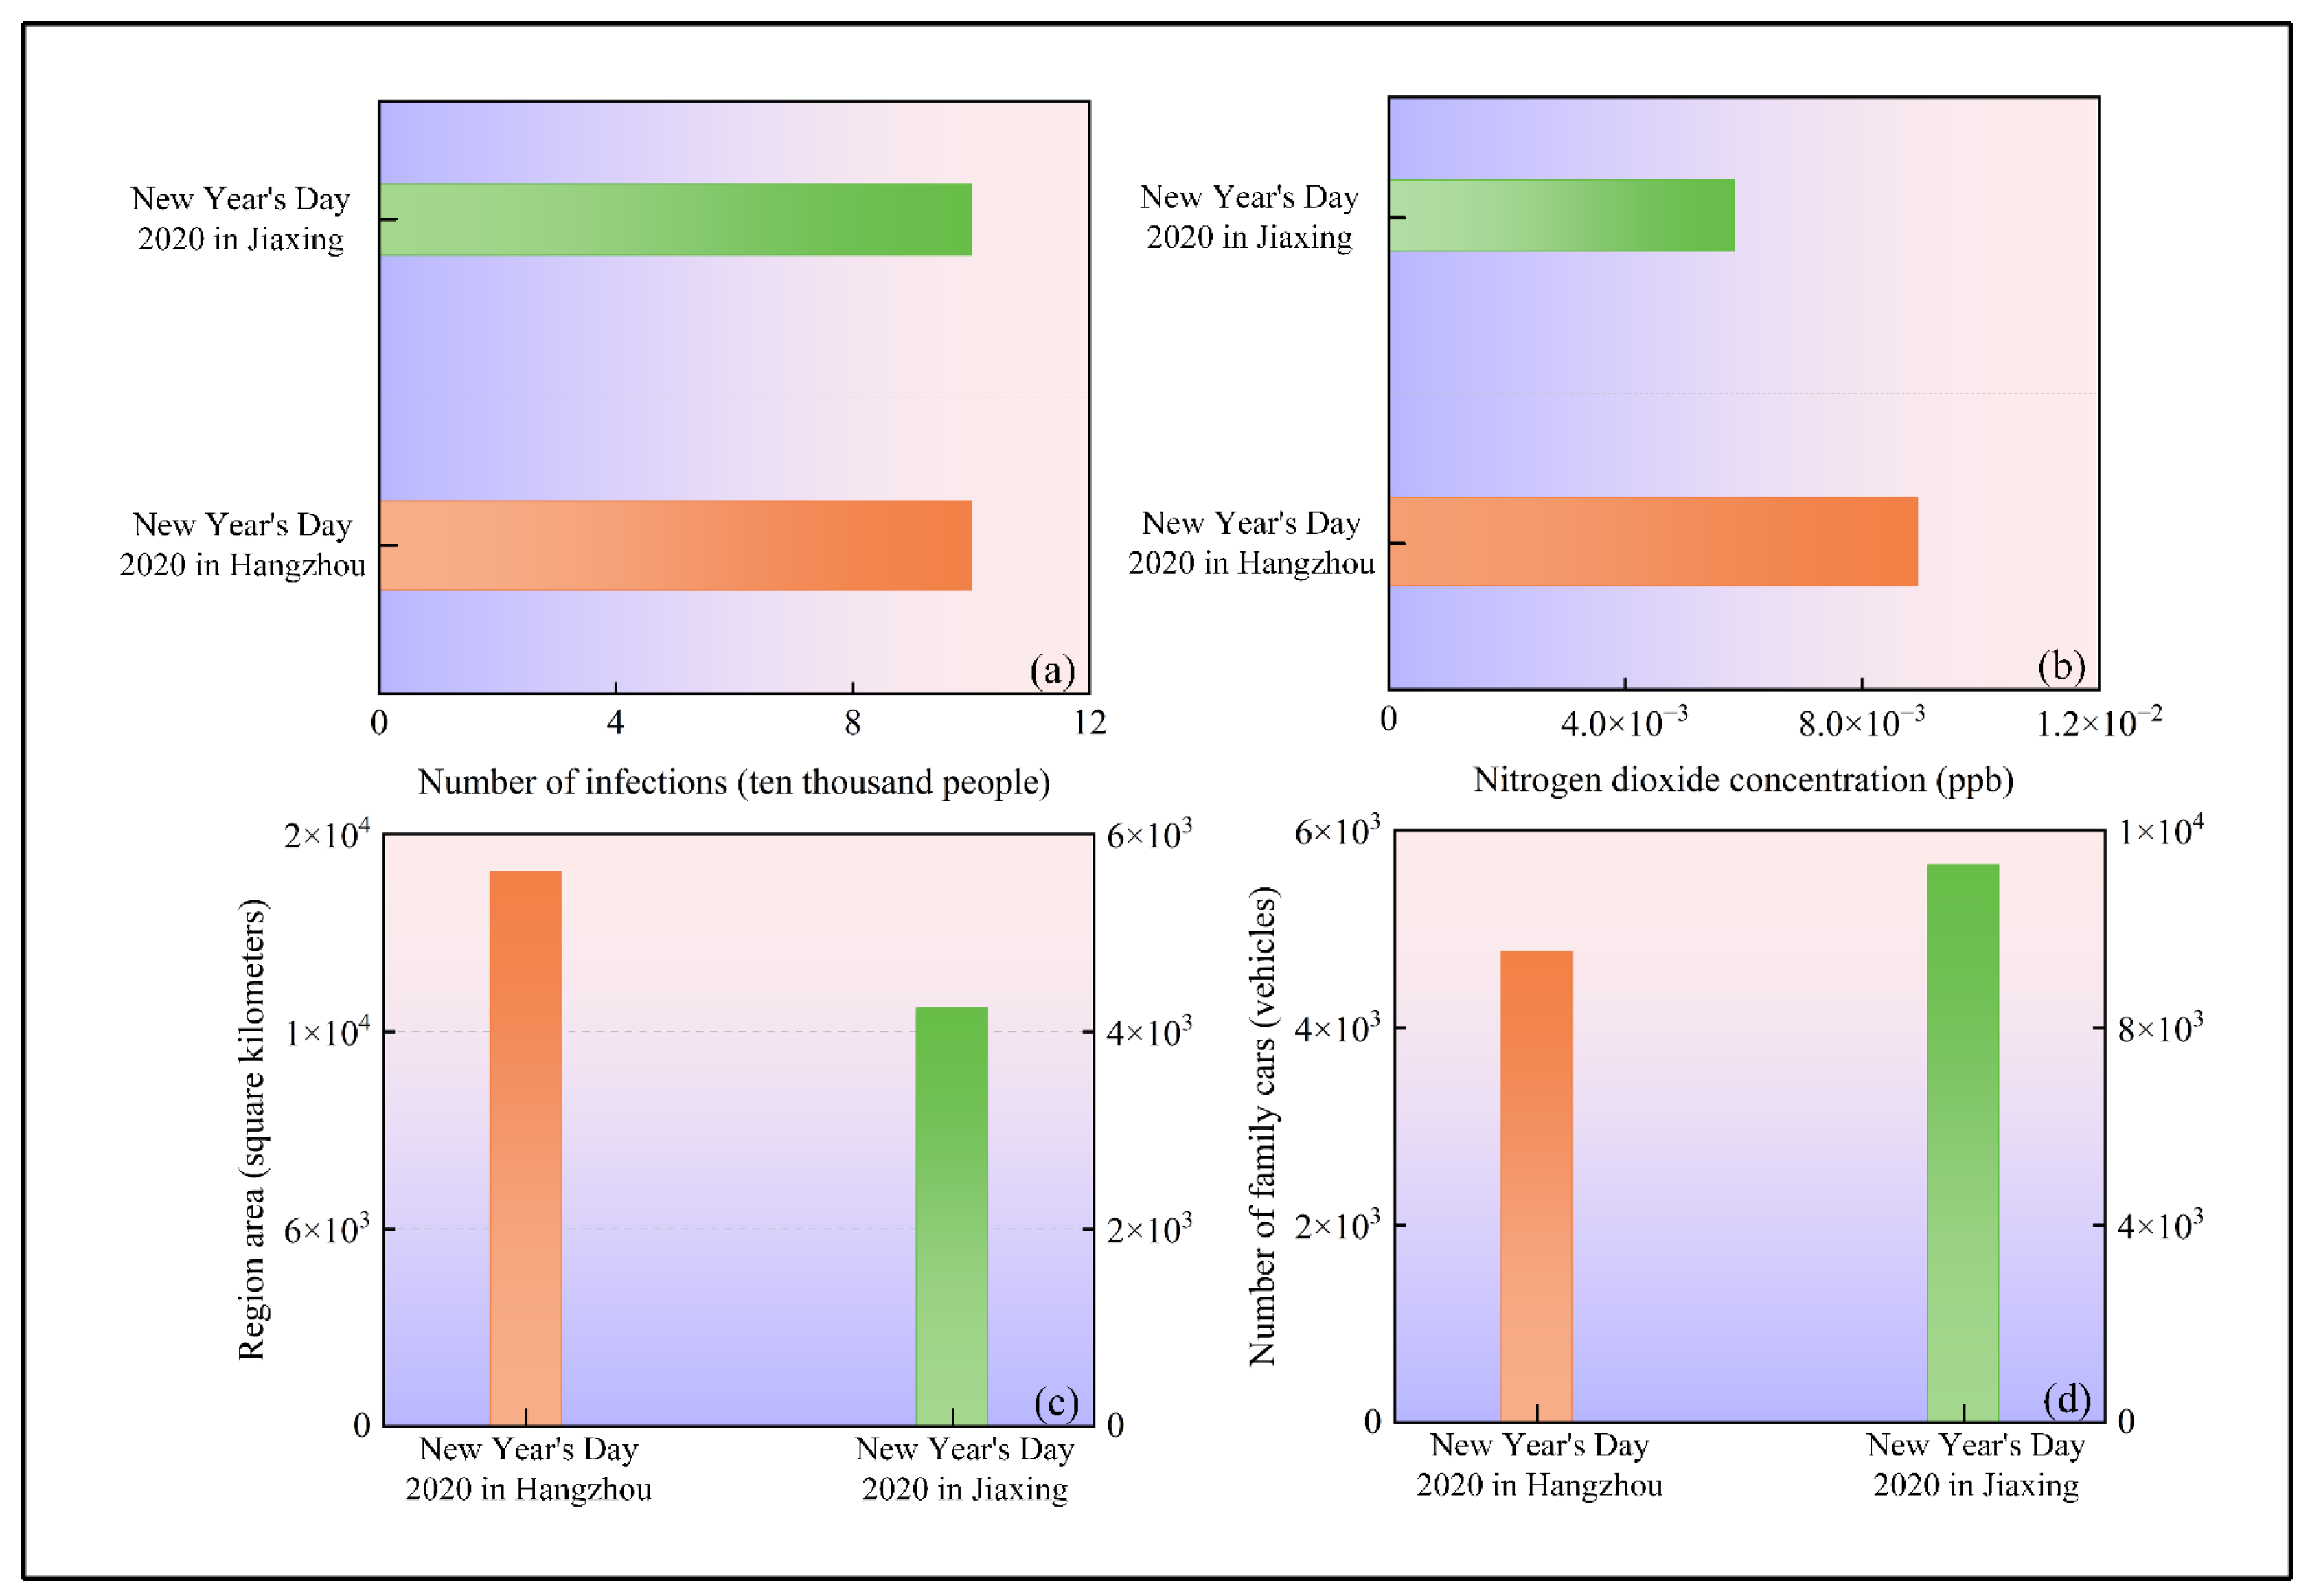
3.2.1. Combined Effects of COVID-19 Infections and Family Cars
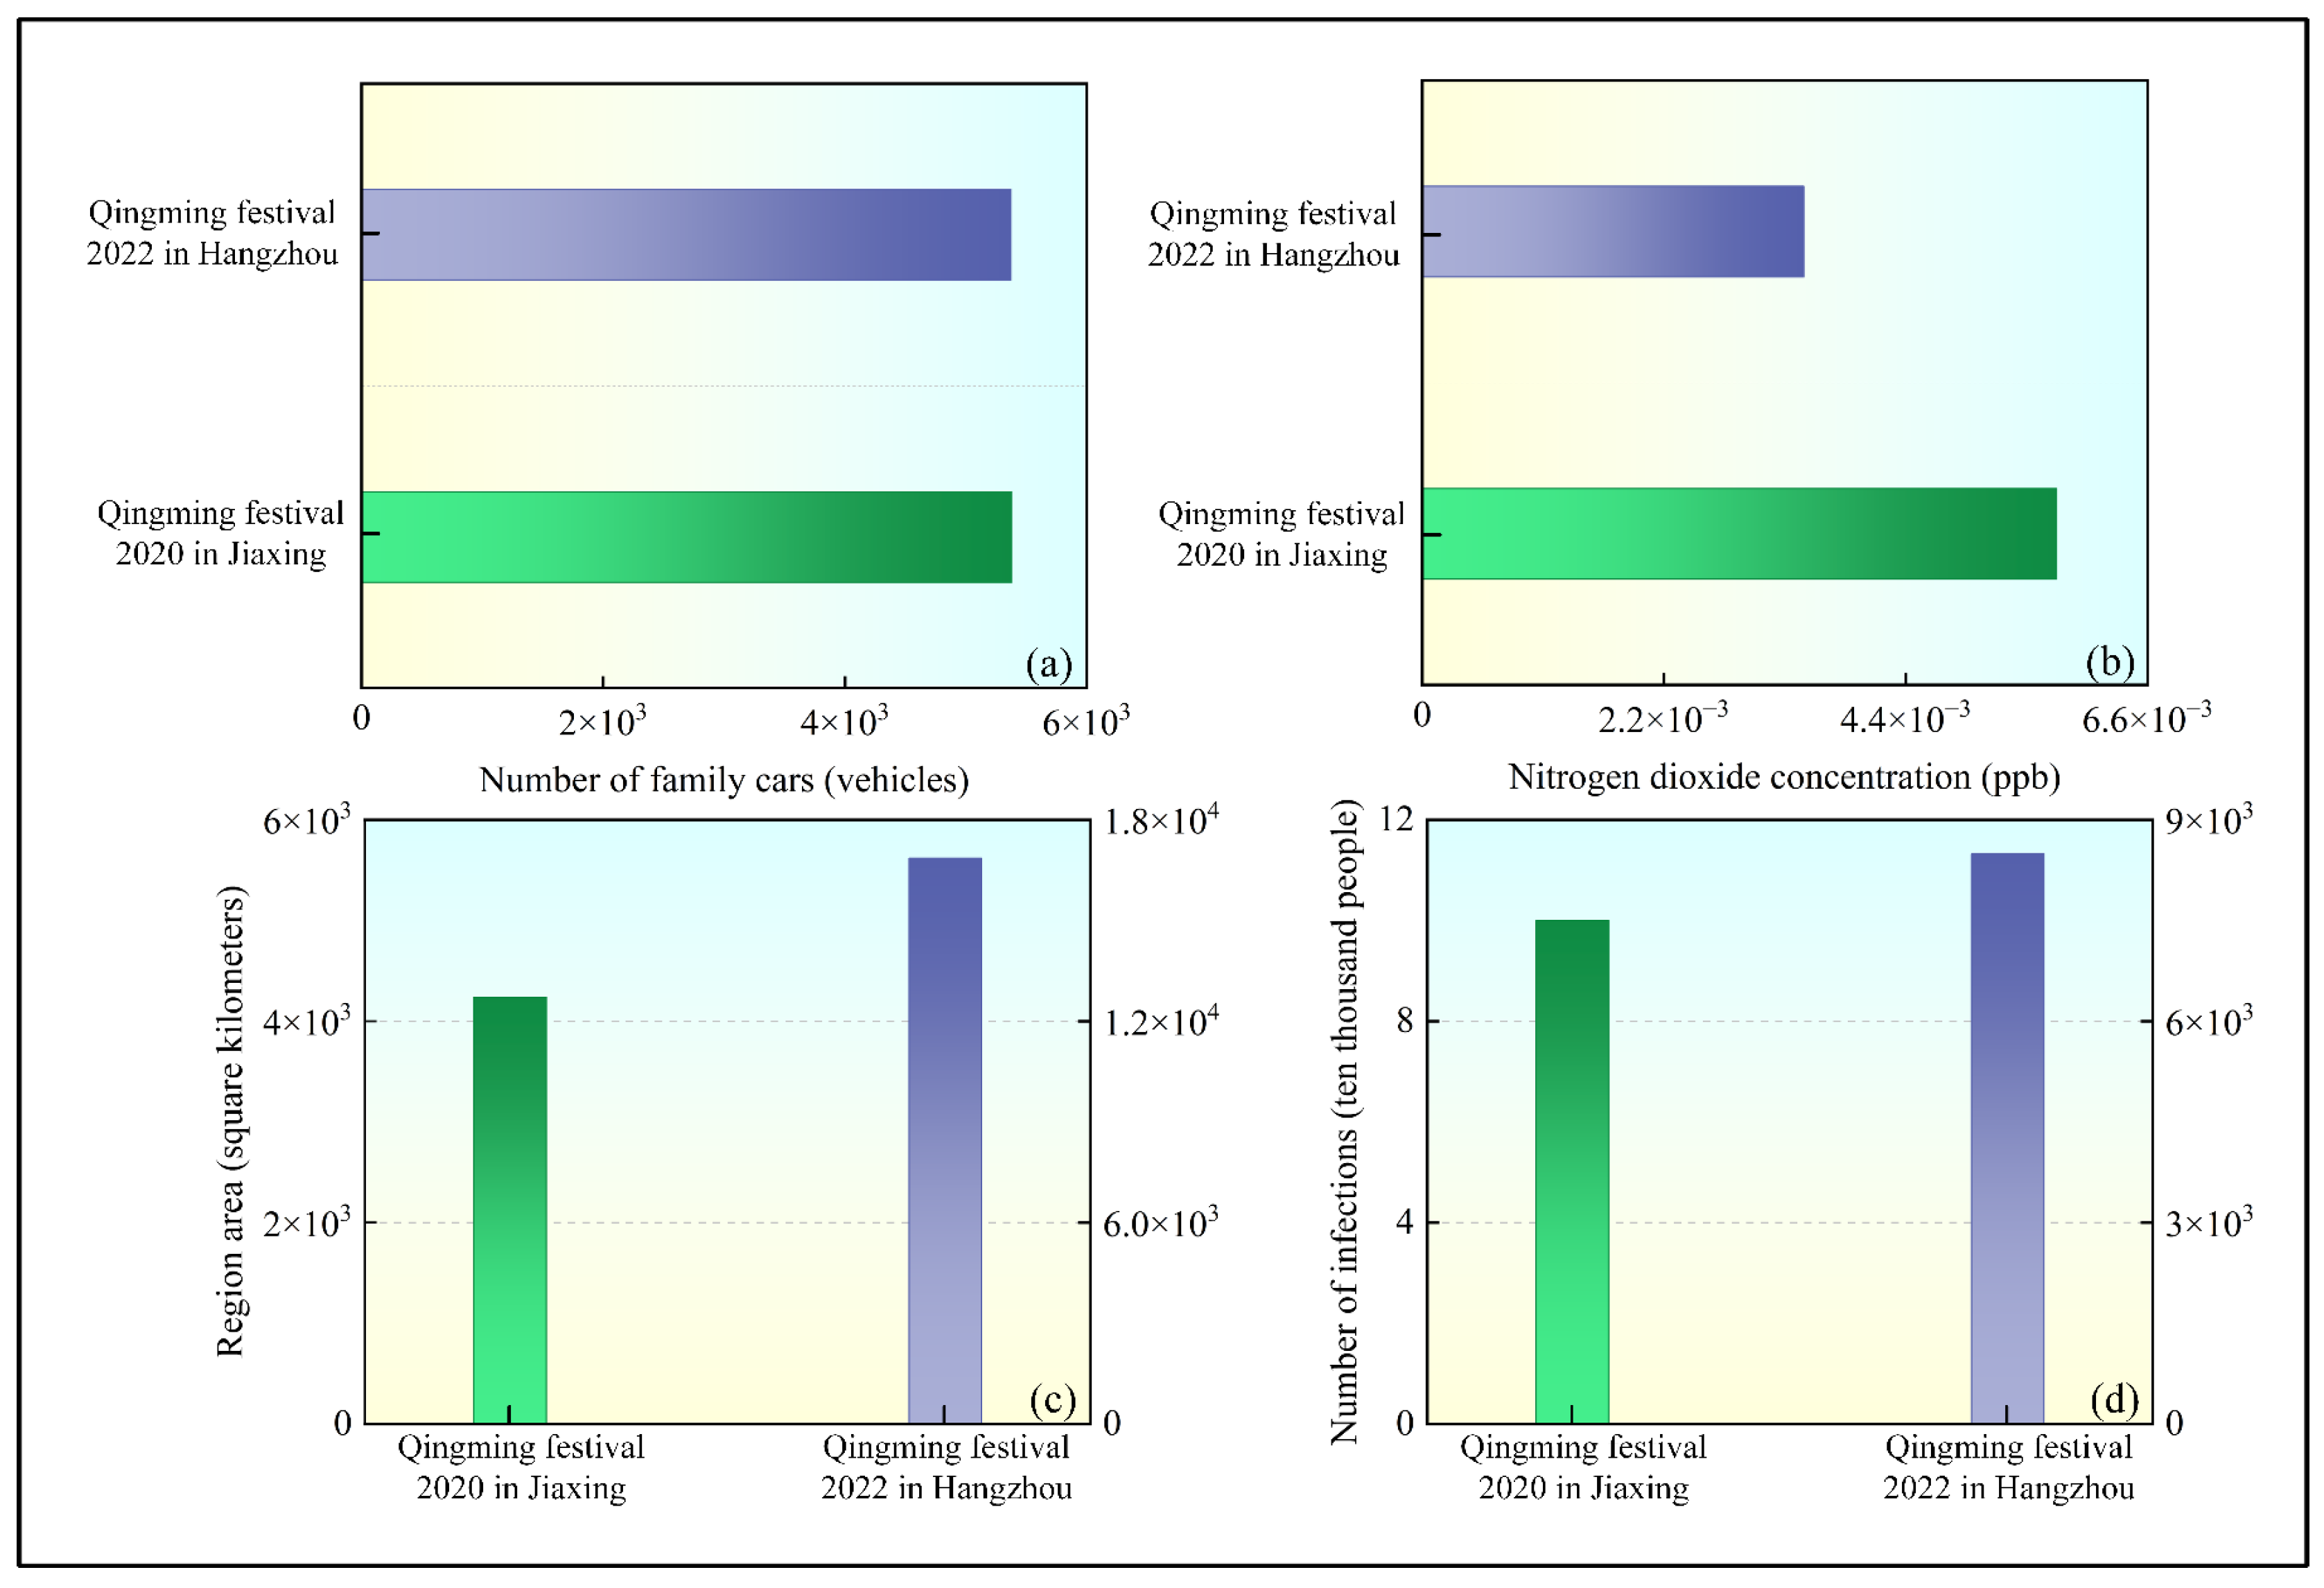
3.2.2. Combined Effects of Region Area and COVID-19 Infections
3.2.3. Combined Effects of Region Area and Family Cars
3.3. Robustness Analysis
4. Conclusions and Implications
4.1. Conclusions
- The combined impact of the number of COVID-19 infections and family cars is analyzed, revealing that the implementation of lockdown policies during the COVID-19 pandemic had a significant effect on highway toll stations. Strict inspection measures led to a substantial increase in vehicle waiting times at toll booths. Simultaneously, the pandemic induced changes in public travel preferences, with family cars becoming the primary mode of transportation. This shift resulted in a sharp increase in the number of family cars at highway toll stations. The combined effect of these two factors caused a significant rise in NO2 concentration at highway toll stations.
- Under the combined effects of region area and number of COVID-19 infections, it was found that lockdown policies during the COVID-19 pandemic significantly restricted public travel, leading to a reduction in the number of family cars. In cities with larger land areas, due to their vast geographic scope and better air circulation conditions, air pollutants were found to disperse more easily. The synergy of these factors led to an overall reduction in NO2 concentration at highway toll stations.
- Through an in-depth analysis of the interaction between the region area and the number of family cars, it was discovered that cities with larger land areas often possess more complex transportation networks. Diverse modes of transportation and a trend towards economical transport vehicles were identified in these cities. Notably, the proportion of semi-trailers, heavy trucks, and other large vehicles increases significantly in larger cities. While these vehicles improve transportation efficiency, their larger engine sizes allow for greater fuel storage, primarily powered by diesel. However, NO2 emissions released during diesel combustion are significantly higher compared to family cars. Despite the reduction in the number of family cars during the pandemic, emissions from large vehicles were relatively greater. The combined effect led to an increase in NO2 concentration at highway toll stations.
4.2. Implications
- The promotion of ETC system adoption is critically important. Increasing the penetration of ETC devices and raising the proportion of ETC lanes can effectively reduce vehicle retention times at manual toll lanes, thereby lowering exhaust emissions. In addition, it is necessary to optimize the layout of public transportation networks and improve their service quality to enhance their appeal. This can encourage the public to prioritize green travel options. These measures will help further alleviate traffic congestion and mitigate environmental pollution issues.
- To further improve air quality, cities should focus on establishing an efficient air quality monitoring system, promoting the concept of a simple, moderate, green, and low-carbon lifestyle, and popularizing clean energy vehicles, thereby reducing the impact of tailpipe emissions on air quality.
- It is significant that the transportation structure be optimized to reduce reliance on large vehicles, transportation routes be refined, logistics efficiency be improved, and empty or inefficient vehicle trips be minimized. Furthermore, it is essential to enhance environmental standards for large vehicles. More stringent diesel vehicle emissions standards should be formulated and implemented, along with regular inspections of large vehicles to ensure compliance with environmental requirements.
4.3. Limitations and Future Work
Author Contributions
Funding
Institutional Review Board Statement
Informed Consent Statement
Data Availability Statement
Conflicts of Interest
References
- WHO. Ambient Air Pollution: A Global Assessment of Exposure and Burden of Disease; WHO: Geneva, Switzerland, 2015; Volume 6. [Google Scholar]
- Jain, P.C. Greenhouse effect and climate change: Scientific basis and overview. Renew. Energy 1993, 3, 403–420. [Google Scholar] [CrossRef]
- Brauer, M.; Roth, G.A.; Aravkin, A.Y.; Zheng, P.; Abate, K.H.; Abate, Y.H.; Abbafati, C.; Abbasgholizadeh, R.; Abbasi, M.A.; Abbasian, M.; et al. Global Burden and Strength of Evidence for 88 Risk Factors in 204 Countries and 811 Subnational Locations, 1990–2021: A Systematic Analysis for the Global Burden of Disease Study 2021. Lancet 2024, 403, 2162–2203. [Google Scholar] [CrossRef] [PubMed]
- Guan, Y.; Xiao, Y.; Chu, C.; Zhang, N.; Yu, L. Trends and Characteristics of Ozone and Nitrogen Dioxide Related Health Impacts in Chinese Cities. Ecotoxicol. Environ. Saf. 2022, 241, 113808. [Google Scholar] [CrossRef]
- Collart, P.; Dubourg, D.; Levêque, A.; Sierra, N.B.; Coppieters, Y. Data on Short-Term Effect of Nitrogen Dioxide on Cardiovascular Health in Wallonia, Belgium. Data Br. 2018, 17, 172–179. [Google Scholar] [CrossRef]
- Lawson, A.R.; Ghosh, B.; Broderick, B. Prediction of Traffic-Related Nitrogen Oxides Concentrations Using Structural Time-Series Models. Atmos. Environ. 2011, 45, 4719–4727. [Google Scholar] [CrossRef]
- Paraschiv, S.; Paraschiv, L.S. Analysis of Traffic and Industrial Source Contributions to Ambient Air Pollution with Nitrogen Dioxide in Two Urban Areas in Romania. Energy Procedia 2019, 157, 1553–1560. [Google Scholar] [CrossRef]
- Obara, P.G.; Roberts, C.L.; Young, C.H.; Williams, C.D. Validating the Correlation of Traffic-Associated Hydrocarbon and Nitrogen Dioxide with Distance from a Trunk Road within a Rural Environment in UK. Microchem. J. 2011, 99, 138–144. [Google Scholar] [CrossRef]
- Stuart, A.L.; Zeager, M. An Inequality Study of Ambient Nitrogen Dioxide and Traffic Levels near Elementary Schools in the Tampa Area. J. Environ. Manag. 2011, 92, 1923–1930. [Google Scholar] [CrossRef] [PubMed]
- Huynh, T.B.; Vo-Ngoc, B.T.; Dang-Bao, T.; Tran, T.K.A. Calibration of a Passive Sampling Device for the Determination of Nitrogen Dioxide in Ambient Air. Talanta Open 2024, 9, 100306. [Google Scholar] [CrossRef]
- Li, P.H.; Yu, J.; Bi, C.L.; Yue, J.J.; Li, Q.Q.; Wang, L.; Liu, J.; Xiao, Z.; Guo, L.; Huang, B.J. Health Risk Assessment for Highway Toll Station Workers Exposed to PM2.5-Bound Heavy Metals. Atmos. Pollut. Res. 2019, 10, 1024–1030. [Google Scholar] [CrossRef]
- Zhao, Y.J.; Shou, Y.P.; Mao, T.Y.; Guo, L.Q.; Li, P.H.; Yi, X.; Li, Q.Q.; Shen, L.Z.; Zuo, H.R.; Wang, J.; et al. PAHs Exposure Assessment for Highway Toll Station Workers Through Personal Particulate Sampling and Urinary Biomonitoring in Tianjin, China. Polycycl. Aromat. Compd. 2018, 38, 379–388. [Google Scholar] [CrossRef]
- Gurung, A.; Levy, J.I.; Bell, M.L. Modeling the Intraurban Variation in Nitrogen Dioxide in Urban Areas in Kathmandu Valley, Nepal. Environ. Res. 2017, 155, 42–48. [Google Scholar] [CrossRef] [PubMed]
- Poplawski, K.; Gould, T.; Setton, E.; Allen, R.; Su, J. Intercity Transferability of Land Use Regression Models for Estimating Ambient Concentrations of Nitrogen Dioxide. J. Expo. Sci. Environ. Epidemiol. 2009, 19, 107–117. [Google Scholar] [CrossRef] [PubMed]
- Hua, J.; Zhang, Y.; Foy, B.D.; Mei, X.; Shang, J.; Feng, C. Science of the Total Environment Competing PM 2.5 and NO2 Holiday Effects in the Beijing Area Vary Locally Due to Differences in Residential Coal Burning and Traf Fi c Patterns. Sci. Total Environ. 2021, 750, 141575. [Google Scholar] [CrossRef]
- Tan, P.; Chou, C.; Chou, C.C. Impact of Urbanization on the Air Pollution “Holiday Effect” in Taiwan. Atmos. Environ. 2013, 70, 361–375. [Google Scholar] [CrossRef]
- Filonchyk, M.; Hurynovich, V.; Yan, H.; Gusev, A.; Shpilevskaya, N. Impact Assessment of COVID-19 on Variations of SO2, NO2, CO and AOD over East China. Aerosol Air Qual. Res. 2020, 20, 1530–1540. [Google Scholar] [CrossRef]
- Tobías, A.; Carnerero, C.; Reche, C.; Massagué, J.; Via, M.; Minguillón, M.C.; Alastuey, A.; Querol, X. Changes in Air Quality during the Lockdown in Barcelona (Spain) One Month into the SARS-CoV-2 Epidemic. Sci. Total Environ. 2020, 726, 138540. [Google Scholar] [CrossRef]
- Florea, A.; Bercu, F.; Radu, R.I.; Stanciu, S. A Fuzzy Set Qualitative Comparative Analysis (fsQCA) of the Agricultural Cooperatives from Southeast Region of Romania. Sustainability 2019, 11, 5927. [Google Scholar] [CrossRef]
- Diwanji, V.S. Fuzzy-Set Qualitative Comparative Analysis in Consumer Research: A Systematic Literature Review. Syst. Rev. Consum. Stud. 2022, 47, 2767–2789. [Google Scholar] [CrossRef]
- Pappas, I.O.; Woodside, A.G. International Journal of Information Management Fuzzy-Set Qualitative Comparative Analysis (fsQCA): Guidelines for Research Practice in Information Systems and Marketing. Int. J. Inf. Manag. 2021, 58, 102310. [Google Scholar] [CrossRef]
- The State Council. Zhejiang to Be Demonstration Zone for Common Prosperity. Available online: https://english.www.gov.cn/policies/policywatch/202106/11/content_WS60c2bc4bc6d0df57f98db143.html (accessed on 12 February 2025).
- Zhejiang Province Bureau of Statistics. Statistical Communique on the National Economic and Social Development of Zhejiang Province in 2023. Available online: https://tjj.zj.gov.cn/art/2024/3/4/art_1229129205_5271123.html (accessed on 12 February 2025).
- van Geffen, J.H.G.M.; Eskes, H.J.; Boersma, K.F.; Maasakkers, J.D.; Veefkind, J.P. TROPOMI ATBD of the Total and Tropospheric NO2 Data Products. S5p/TROPOMI 2019, 1–76. Available online: https://sentinel.esa.int/documents/247904/2476257/Sentinel-5P-TROPOMI-ATBD-NO2-data-products.pdf (accessed on 12 February 2025).
- Shetty, S.; Schneider, P.; Stebel, K.; David Hamer, P.; Kylling, A.; Koren Berntsen, T. Estimating Surface NO2 Concentrations over Europe Using Sentinel-5P TROPOMI Observations and Machine Learning. Remote Sens. Environ. 2024, 312, 114321. [Google Scholar] [CrossRef]
- Sha, M.K.; Das, S.; Frey, M.M.; Dubravica, D.; Alberti, C.; Baier, B.C.; Balis, D.; Bezanilla, A.; Blumenstock, T.; Boesch, H.; et al. Fiducial Reference Measurements for Greenhouse Gases (FRM4GHG): Validation of Satellite (Sentinel-5 Precursor, OCO-2, and GOSAT) Missions Using the COllaborative Carbon Column Observing Network (COCCON). Remote Sens. 2025, 17, 734. [Google Scholar] [CrossRef]
- Eskes, H.; Eichmann, K. S5P Mission Performance Centre Nitrogen Dioxide [L2__NO2___] Readme. Available online: https://sentiwiki.copernicus.eu/__attachments/1673595/S5P-MPC-KNMI-PRF-NO2 - Sentinel-5P Nitrogen Dioxide Level 2 Product Readme File 2023 - 2.5.pdf (accessed on 12 February 2025).
- The Copernicus Data Space Ecosystem. Copernicus Browser. Available online: https://browser.dataspace.copernicus.eu/?zoom=5&lat=50.16282&lng=20.78613&demSource3D=%22MAPZEN%22&cloudCoverage=30&dateMode=SINGLE (accessed on 12 February 2025).
- Nistor, C.; Vîrghileanu, M.; Mihai, B. Nitrogen Dioxide (NO2) Pollution Monitoring with Sentinel-5P Satellite Imagery over Europe during the Coronavirus Pandemic Outbreak. Remote Sens. 2020, 12, 3575. [Google Scholar] [CrossRef]
- Hangzhou Municipal Bureau of Surveying, Mapping and Geographic Information. Public Bulletin on the First Geographic National Conditions Census of Hangzhou City. Available online: https://wenku.baidu.com/view/45a733707a3e0912a21614791711cc7931b778f3.html?_wkts_=1740807647294 (accessed on 1 March 2025).
- Yong, Z. Let the Data Speak for What Ningbo “Looks Like”. Available online: http://daily.cnnb.com.cn/nbrb/images/2018-03/14/A7/nbrb20180314A7.pdf (accessed on 1 March 2025).
- Wenzhou Natural Resources and Planning Bureau. Public Bulletin on the First Geographic National Conditions Census of Wenzhou City. Available online: https://zrzyj.wenzhou.gov.cn/art/2020/7/7/art_1229277891_3202030.html (accessed on 1 March 2025).
- Jiaxing Municipal Government. Introduction to Jiaxing City. 2023; pp. 2–4. Available online: http://investzj.zcom.gov.cn:9898/u/cms/www/202409/3008442947lq.pdf (accessed on 1 March 2025).
- Department of Commerce of Zhejiang Province. Introduction to Quzhou City, Zhejiang Province. Available online: http://www.zcom.gov.cn/art/2020/9/4/art_1416082_13886734.html (accessed on 1 March 2025).
- W.H.O. COVID-19 Situation Report. Available online: https://www.who.int/emergencies/diseases/novel-coronavirus-2019/situation-reports (accessed on 1 March 2025).
- Weather.com. Temperature Information of Zhejiang. Available online: https://www.tianqi.com/qiwen/city_zhejiang/ (accessed on 1 March 2025).
- Li, D.; Wu, Q.; Wang, H.; Xiao, H.; Xu, Q.; Wang, L.; Feng, J.; Yang, X.; Cheng, H.; Wang, L.; et al. The Spring Festival Effect: The Change in NO2 Column Concentration in China Caused by the Migration of Human Activities. Atmos. Pollut. Res. 2021, 12, 101232. [Google Scholar] [CrossRef]
- Madhavi Latha, K.; Highwood, E.J. Studies on Particulate Matter (PM10) and Its Precursors over Urban Environment of Reading, UK. J. Quant. Spectrosc. Radiat. Transf. 2006, 101, 367–379. [Google Scholar] [CrossRef]
- The Central People’s Government of the People’s Republic of China. Measures on Holidays for National Annual Festivals and Commemorative Days. Available online: https://www.gov.cn/zhengce/zhengceku/202411/content_6986381.htm (accessed on 1 March 2025).
- Charles, C. Ragin Redesigning Social Inquiry Fuzzy Sets and Beyond; University of Chicago Press: Chicago, IL, USA, 2015; ISBN 9780226702735. [Google Scholar]
- Fiss, P.C. Building Better Causal Theories: A Fuzzy Set Approach to Typologies in Organization Research. Acad. Manag. J. 2011, 54, 393–420. [Google Scholar] [CrossRef]
- Greckhamer, T.; Furnari, S.; Fiss, P.C.; Aguilera, R.V. Studying Configurations with Qualitative Comparative Analysis: Best Practices in Strategy and Organization Research. Strateg. Organ. 2018, 16, 482–495. [Google Scholar] [CrossRef]
- Chinese Ministry of Communications. Guidelines for COVID-19 Prevention and Control at Highway Service Areas and Toll Stations (Fifth edition). Available online: https://view.officeapps.live.com/op/view.aspx?src=https%3A%2F%2Fwww.gov.cn%2Fzhengce%2Fzhengceku%2F2022-04%2F24%2F5686970%2Ffiles%2F0ad886a28de441178767fee7b1f7281a.doc&wdOrigin=BROWSELINK (accessed on 3 March 2025).
- Hangzhou Municipal Government. Zhejiang Provides Updates and Briefings on the Current COVID-19 Situation. Available online: https://www.hangzhou.gov.cn/art/2022/5/5/art_1228998464_59055098.html (accessed on 3 March 2025).
- Chinese Ministry of Communications (2021). Guidelines for COVID-19 Prevention and Control at Highway Service Areas and Toll Stations. Available online: https://www.gov.cn/zhengce/zhengceku/2021-07/03/content_5622176.htm (accessed on 3 March 2025).
- Paraschiv, S.; Constantin, D.E.; Paraschiv, S.L.; Voiculescu, M. OMI and Ground-Based in-Situ Tropospheric Nitrogen Dioxide Observations over Several Important European Cities during 2005–2014. Int. J. Environ. Res. Public Health 2017, 14, 1415. [Google Scholar] [CrossRef]
- Huangfu, P.; Atkinson, R. Long-Term Exposure to NO2 and O3 and All-Cause and Respiratory Mortality: A Systematic Review and Meta-Analysis. Environ. Int. 2020, 144, 105998. [Google Scholar] [CrossRef]
- Shekarrizfard, M.; Faghih-Imani, A.; Tétreault, L.F.; Yasmin, S.; Reynaud, F.; Morency, P.; Plante, C.; Drouin, L.; Smargiassi, A.; Eluru, N.; et al. Regional Assessment of Exposure to Traffic-Related Air Pollution: Impacts of Individual Mobility and Transit Investment Scenarios. Sustain. Cities Soc. 2017, 29, 68–76. [Google Scholar] [CrossRef]
- Lumet, E.; Rochoux, M.C.; Jaravel, T.; Lacroix, S. Uncertainty-Aware Surrogate Modeling for Urban Air Pollutant Dispersion Prediction. Build. Environ. 2025, 267, 112287. [Google Scholar] [CrossRef]
- Juan, Y.H.; Wen, C.Y.; Li, Z.; Yang, A.S. A Combined Framework of Integrating Optimized Half-Open Spaces into Buildings and an Application to a Realistic Case Study on Urban Ventilation and Air Pollutant Dispersion. J. Build. Eng. 2021, 44, 102975. [Google Scholar] [CrossRef]
- De Santis, D.; Amici, S.; Milesi, C.; Muroni, D.; Romanino, A.; Casari, C.; Cannas, V.; Del Frate, F. Tracking Air Quality Trends and Vehicle Traffic Dynamics at Urban Scale Using Satellite and Ground Data before and after the COVID-19 Outbreak. Sci. Total Environ. 2023, 899, 165464. [Google Scholar] [CrossRef] [PubMed]
- Li, Y.; Zhao, Q.; Wang, M. Understanding Urban Traffic Flows in Response to COVID-19 Pandemic with Emerging Urban Big Data in Glasgow. Cities 2024, 154, 105381. [Google Scholar] [CrossRef]
- Wang, K.; Zhang, J.; Wang, L. Optimal Allocation of Urban Transportation Land at a Regional Level: A Case of the Yangtze River Economic Belt, China. Sustain. Cities Soc. 2024, 113, 105678. [Google Scholar] [CrossRef]
- Li, Z.; Tang, J.; Feng, T.; Liu, B.; Cao, J.; Yu, T.; Ji, Y. Investigating Urban Mobility through Multi-Source Public Transportation Data: A Multiplex Network Perspective. Appl. Geogr. 2024, 169, 103337. [Google Scholar] [CrossRef]
- Feng, X.; Ge, Y.; Ma, C.; Tan, J.; Yu, L.; Li, J.; Wang, X. Experimental Study on the Nitrogen Dioxide and Particulate Matter Emissions from Diesel Engine Retrofitted with Particulate Oxidation Catalyst. Sci. Total Environ. 2014, 472, 56–62. [Google Scholar] [CrossRef]
- Huang, Q.; Yang, R.; Liu, J.; Xie, T.; Liu, J. Investigation of the Mechanism behind the Surge in Nitrogen Dioxide Emissions in Engines Transitioning from Pure Diesel Operation to Methanol/Diesel Dual-Fuel Operation. Fuel Process. Technol. 2024, 264, 108131. [Google Scholar] [CrossRef]
- Heywood, J.B. Solutions Manual to Accompany Internal Combustion Engine Fundamentals; McGraw-Hill: New York, NY, USA, 1988; p. 189. [Google Scholar]
- Chinese Ministry of Communications. Statistical Bulletin on National Toll Roads for the Year 2021. Available online: https://xxgk.mot.gov.cn/2020/jigou/glj/202211/t20221111_3707993.html (accessed on 6 March 2025).

| Area | Xiasha | Ningbo | Wenzhou | Jiaxing | Quzhou |
|---|---|---|---|---|---|
| Mean | 2.97 | 1.56 | 0.95 | 1.84 | 1.11 |
| Standard deviation | 6.04 | 1.49 | 0.83 | 2.25 | 1.26 |
| Minimum | 0.08 | 0.04 | 0.08 | 0.08 | 0 |
| Maximum | 95.02 | 15.61 | 8.52 | 28.23 | 11.81 |
| Holiday | Year | Date |
|---|---|---|
| New Year’s Day | 2019 | 1–3 January |
| 2020 | 1–3 January | |
| 2021 | 1–3 January | |
| 2022 | 1–3 January | |
| 2022–2023 | 30 December 2022–1 January 2023 | |
| Spring Festival | 2019 | 5–11 February |
| 2020 | 25–31 January | |
| 2021 | 12–17 February | |
| 2022 | 1–7 February | |
| 2023 | 22–28 January | |
| Qingming Festival | 2019 | 4–6 April |
| 2020 | 4–6 April | |
| 2021 | 4–6 April | |
| 2022 | 3–5 April | |
| 2023 | 4–6 April | |
| Labor Day | 2019 | 1–5 May |
| 2020 | 1–5 May | |
| 2021 | 1–5 May | |
| 2022 | 30 April–4 May | |
| 2023 | 1–5 May | |
| Dragon Boat Festival | 2019 | 6–8 June |
| 2020 | 12–14 June | |
| 2021 | 12–14 June | |
| 2022 | 3–5 June | |
| 2023 | 21–23 June | |
| National Day | 2019 | 1–7 October |
| 2020 | 1–7 October | |
| 2021 | 1–7 October | |
| 2022 | 1–7 October | |
| 2023 | 1–7 October |
| Variable Type | Variables | Data Volume | Unit |
|---|---|---|---|
| Condition variable | Region area | 5 | Square kilometers |
| COVID-19 infections | 5 | Ten thousand people | |
| Holiday days | 6 | Days | |
| Average temperature | 6 | Celsius | |
| Family cars | 9593 | Vehicles | |
| Result variable | NO2 | 2399 | ppb |
| Variable Abbreviation | Region Area | COVID-19 Infections | Holiday Days | Average Temperature | Family Cars |
|---|---|---|---|---|---|
| Mean | 10,182 | 3598 | 5 | 17 | 15,437 |
| Standard deviation | 4122 | 4501 | 2 | 8 | 12,196 |
| Minimum | 4237 | 0 | 3 | 6 | 1002 |
| Maximum | 16,853 | 9929 | 7 | 26 | 71,307 |
| Variables | Full Membership | Crossover Point | Full Non-Membership |
|---|---|---|---|
| Region area | 16,853 | 9365 | 4237 |
| COVID-19 infections | 9929 | 13 | 0 |
| Holiday days | 7 | 4 | 3 |
| Average temperature | 26 | 20 | 6 |
| Family cars | 33,618 | 11,305 | 2215 |
| Variables | Consistency | Coverage |
|---|---|---|
| Region area | 0.71 | 0.60 |
| ~Region area | 0.63 | 0.59 |
| COVID-19 infections | 0.70 | 0.56 |
| ~COVID-19 infections | 0.58 | 0.59 |
| Holiday days | 0.52 | 0.51 |
| ~Holiday days | 0.64 | 0.53 |
| Average temperature | 0.50 | 0.45 |
| ~Average temperature | 0.80 | 0.70 |
| Family cars ~Family cars | 0.60 0.68 | 0.54 0.60 |
| Conditions | C1 | C2 | C3 | C4 | C5 | C6 |
|---|---|---|---|---|---|---|
| Region area | ⊗ | ● | ⊗ | ● | ||
| COVID-19 infections | ⊗ | ⊗ | ● | ● | ||
| Holiday days | ⊗ | ⊗ | ⊗ | ⊗ | ⊗ | ⊗ |
| Average temperature | ⊗ | ⊗ | ⊗ | ⊗ | ⊗ | ⊗ |
| Family cars | ⊗ | ⊗ | ● | ● | ||
| Raw Coverage | 0.274 | 0.246 | 0.303 | 0.294 | 0.323 | 0.321 |
| Unique Coverage | 0.005 | 0.003 | 0.012 | 0.006 | 0.011 | 0.010 |
| Overall Consistency | 0.841 | |||||
| Overall Coverage | 0.485 | |||||
Disclaimer/Publisher’s Note: The statements, opinions and data contained in all publications are solely those of the individual author(s) and contributor(s) and not of MDPI and/or the editor(s). MDPI and/or the editor(s) disclaim responsibility for any injury to people or property resulting from any ideas, methods, instructions or products referred to in the content. |
© 2025 by the authors. Licensee MDPI, Basel, Switzerland. This article is an open access article distributed under the terms and conditions of the Creative Commons Attribution (CC BY) license (https://creativecommons.org/licenses/by/4.0/).
Share and Cite
Xu, S.; Yang, X. Analysis of Nitrogen Dioxide Concentration at Highway Toll Stations Based on fsQCA—Data Sourced from Sentinel-5P. Atmosphere 2025, 16, 517. https://doi.org/10.3390/atmos16050517
Xu S, Yang X. Analysis of Nitrogen Dioxide Concentration at Highway Toll Stations Based on fsQCA—Data Sourced from Sentinel-5P. Atmosphere. 2025; 16(5):517. https://doi.org/10.3390/atmos16050517
Chicago/Turabian StyleXu, Shenghao, and Xinxiang Yang. 2025. "Analysis of Nitrogen Dioxide Concentration at Highway Toll Stations Based on fsQCA—Data Sourced from Sentinel-5P" Atmosphere 16, no. 5: 517. https://doi.org/10.3390/atmos16050517
APA StyleXu, S., & Yang, X. (2025). Analysis of Nitrogen Dioxide Concentration at Highway Toll Stations Based on fsQCA—Data Sourced from Sentinel-5P. Atmosphere, 16(5), 517. https://doi.org/10.3390/atmos16050517