


Cluster Analysis and Atmospheric Circulation Features of Springtime Compound Dry-Hot Events in the Pearl River Basin


Abstract
1. Introduction
2. Methodology
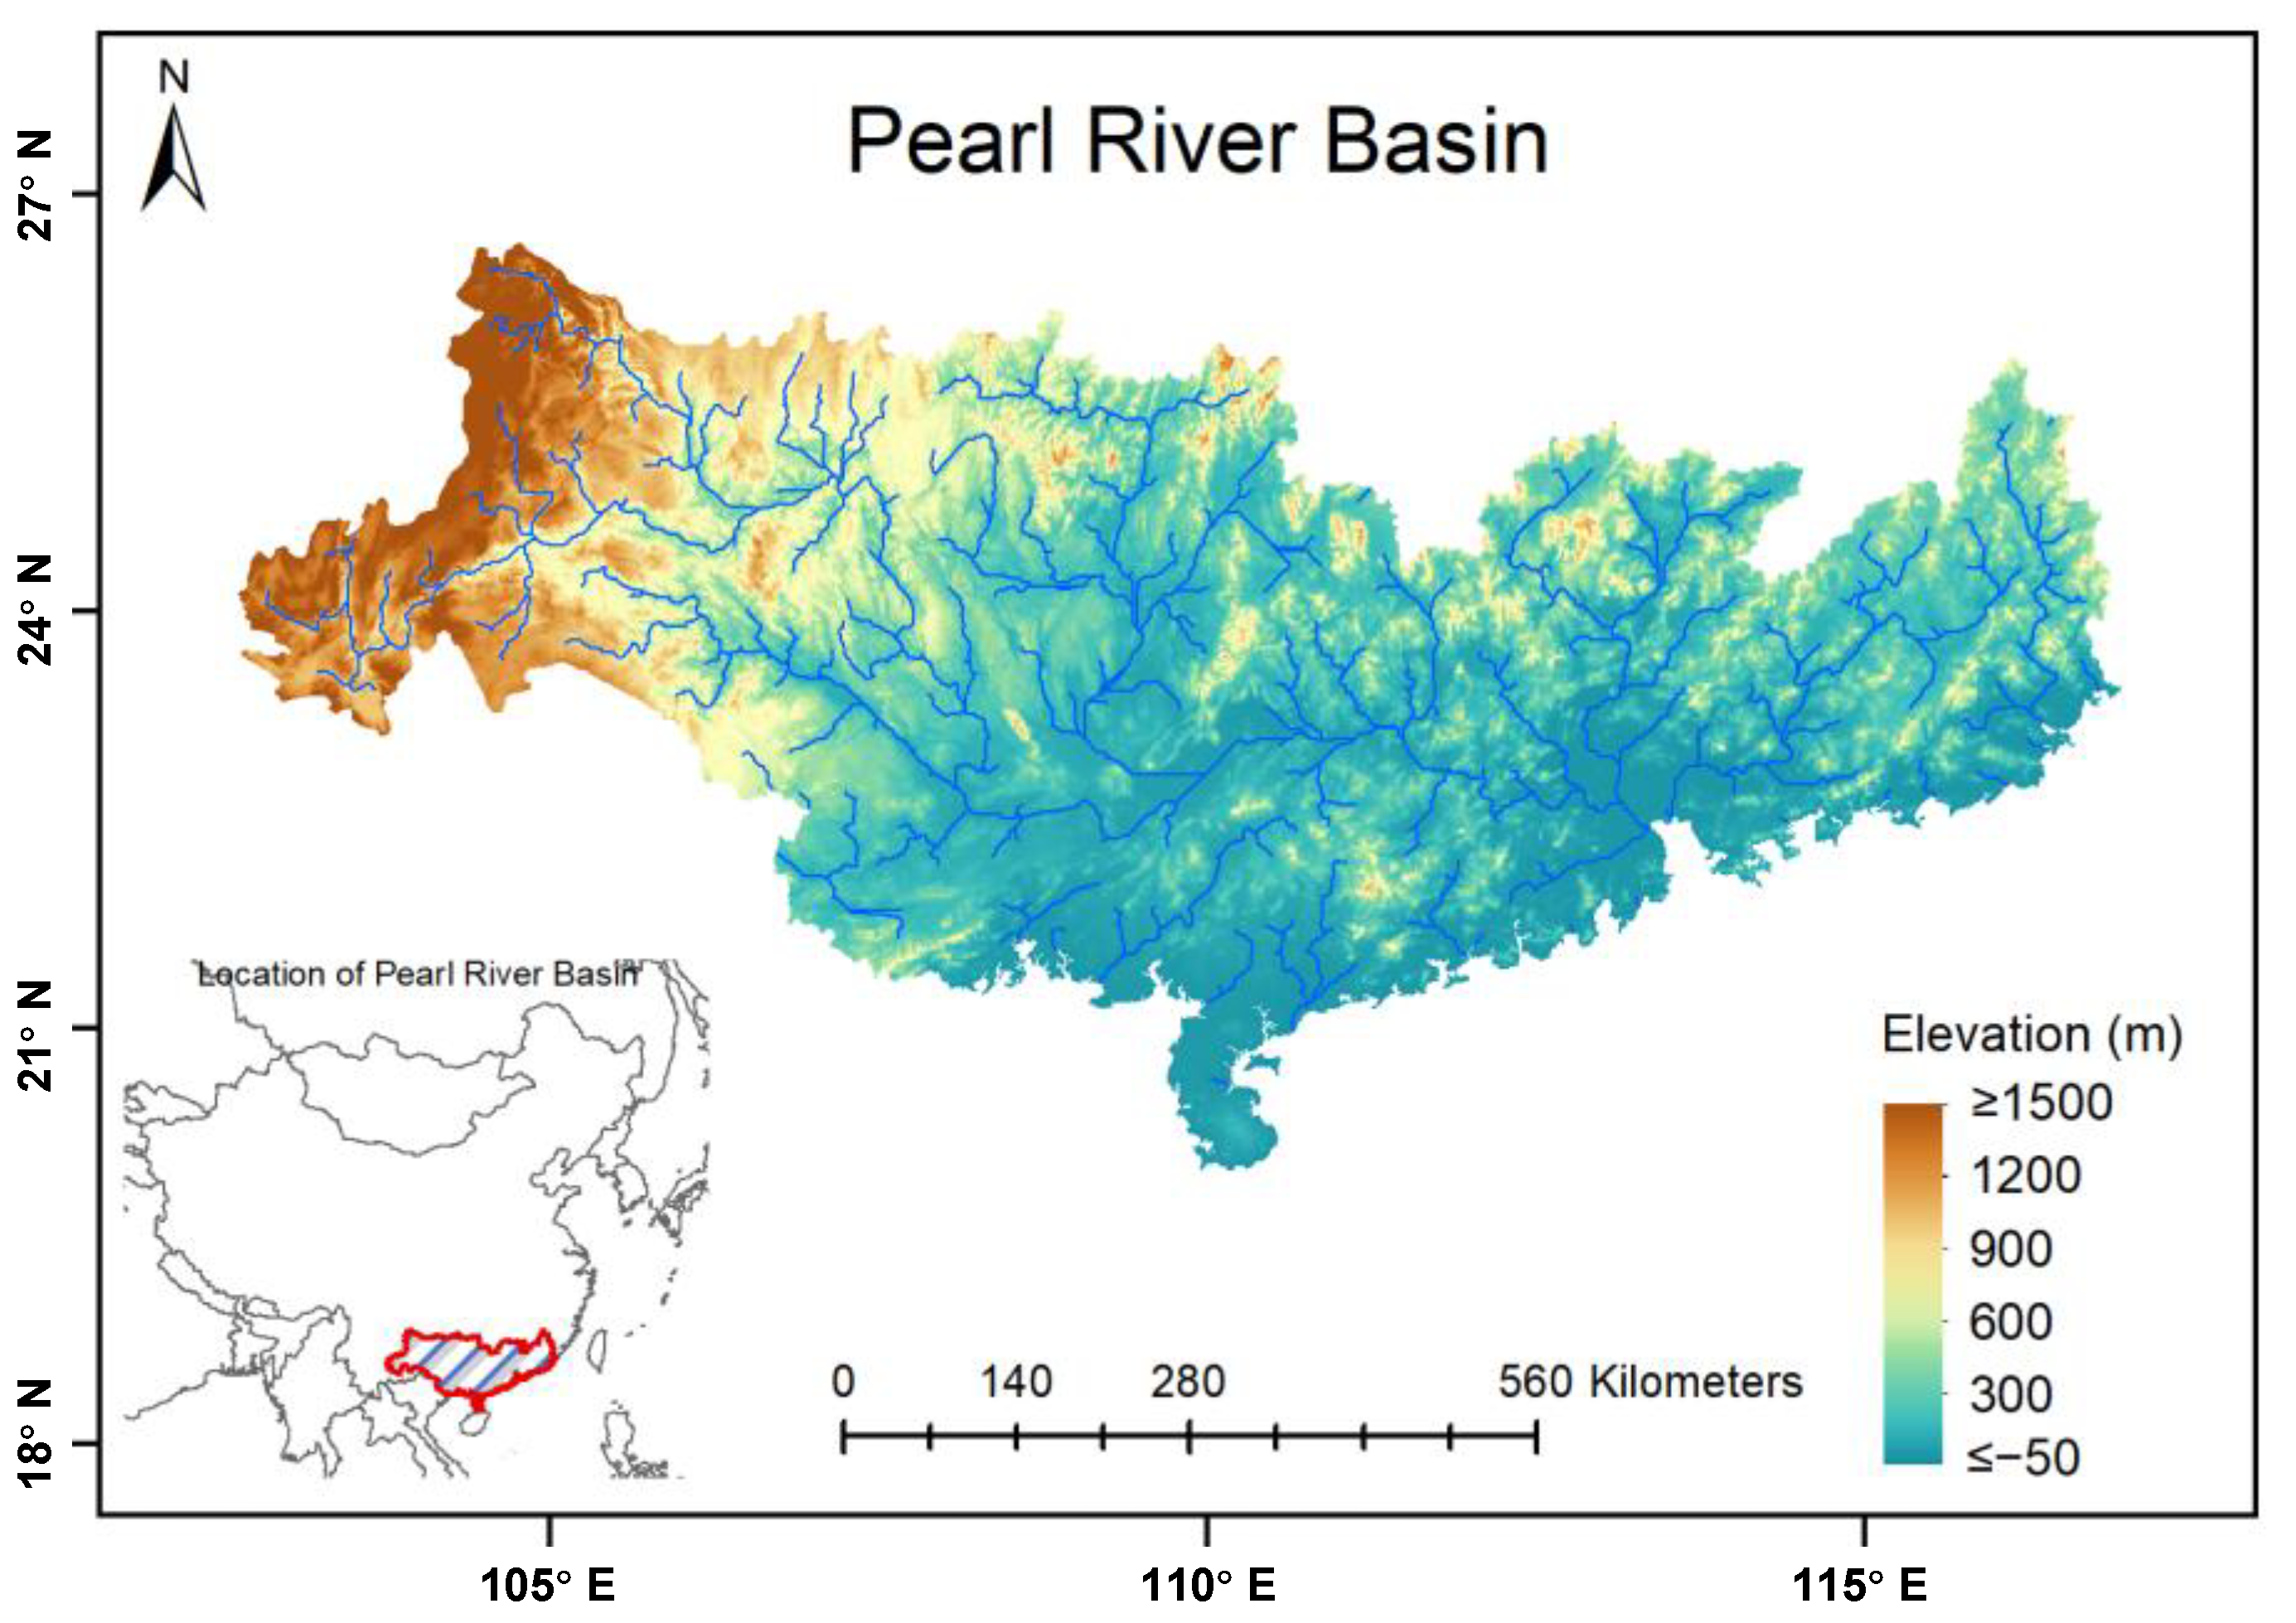
2.1. Study Area
2.2. Cluster Methods
2.3. Dataset and Standardized Index
2.4. Atmospheric Circulations
3. Results
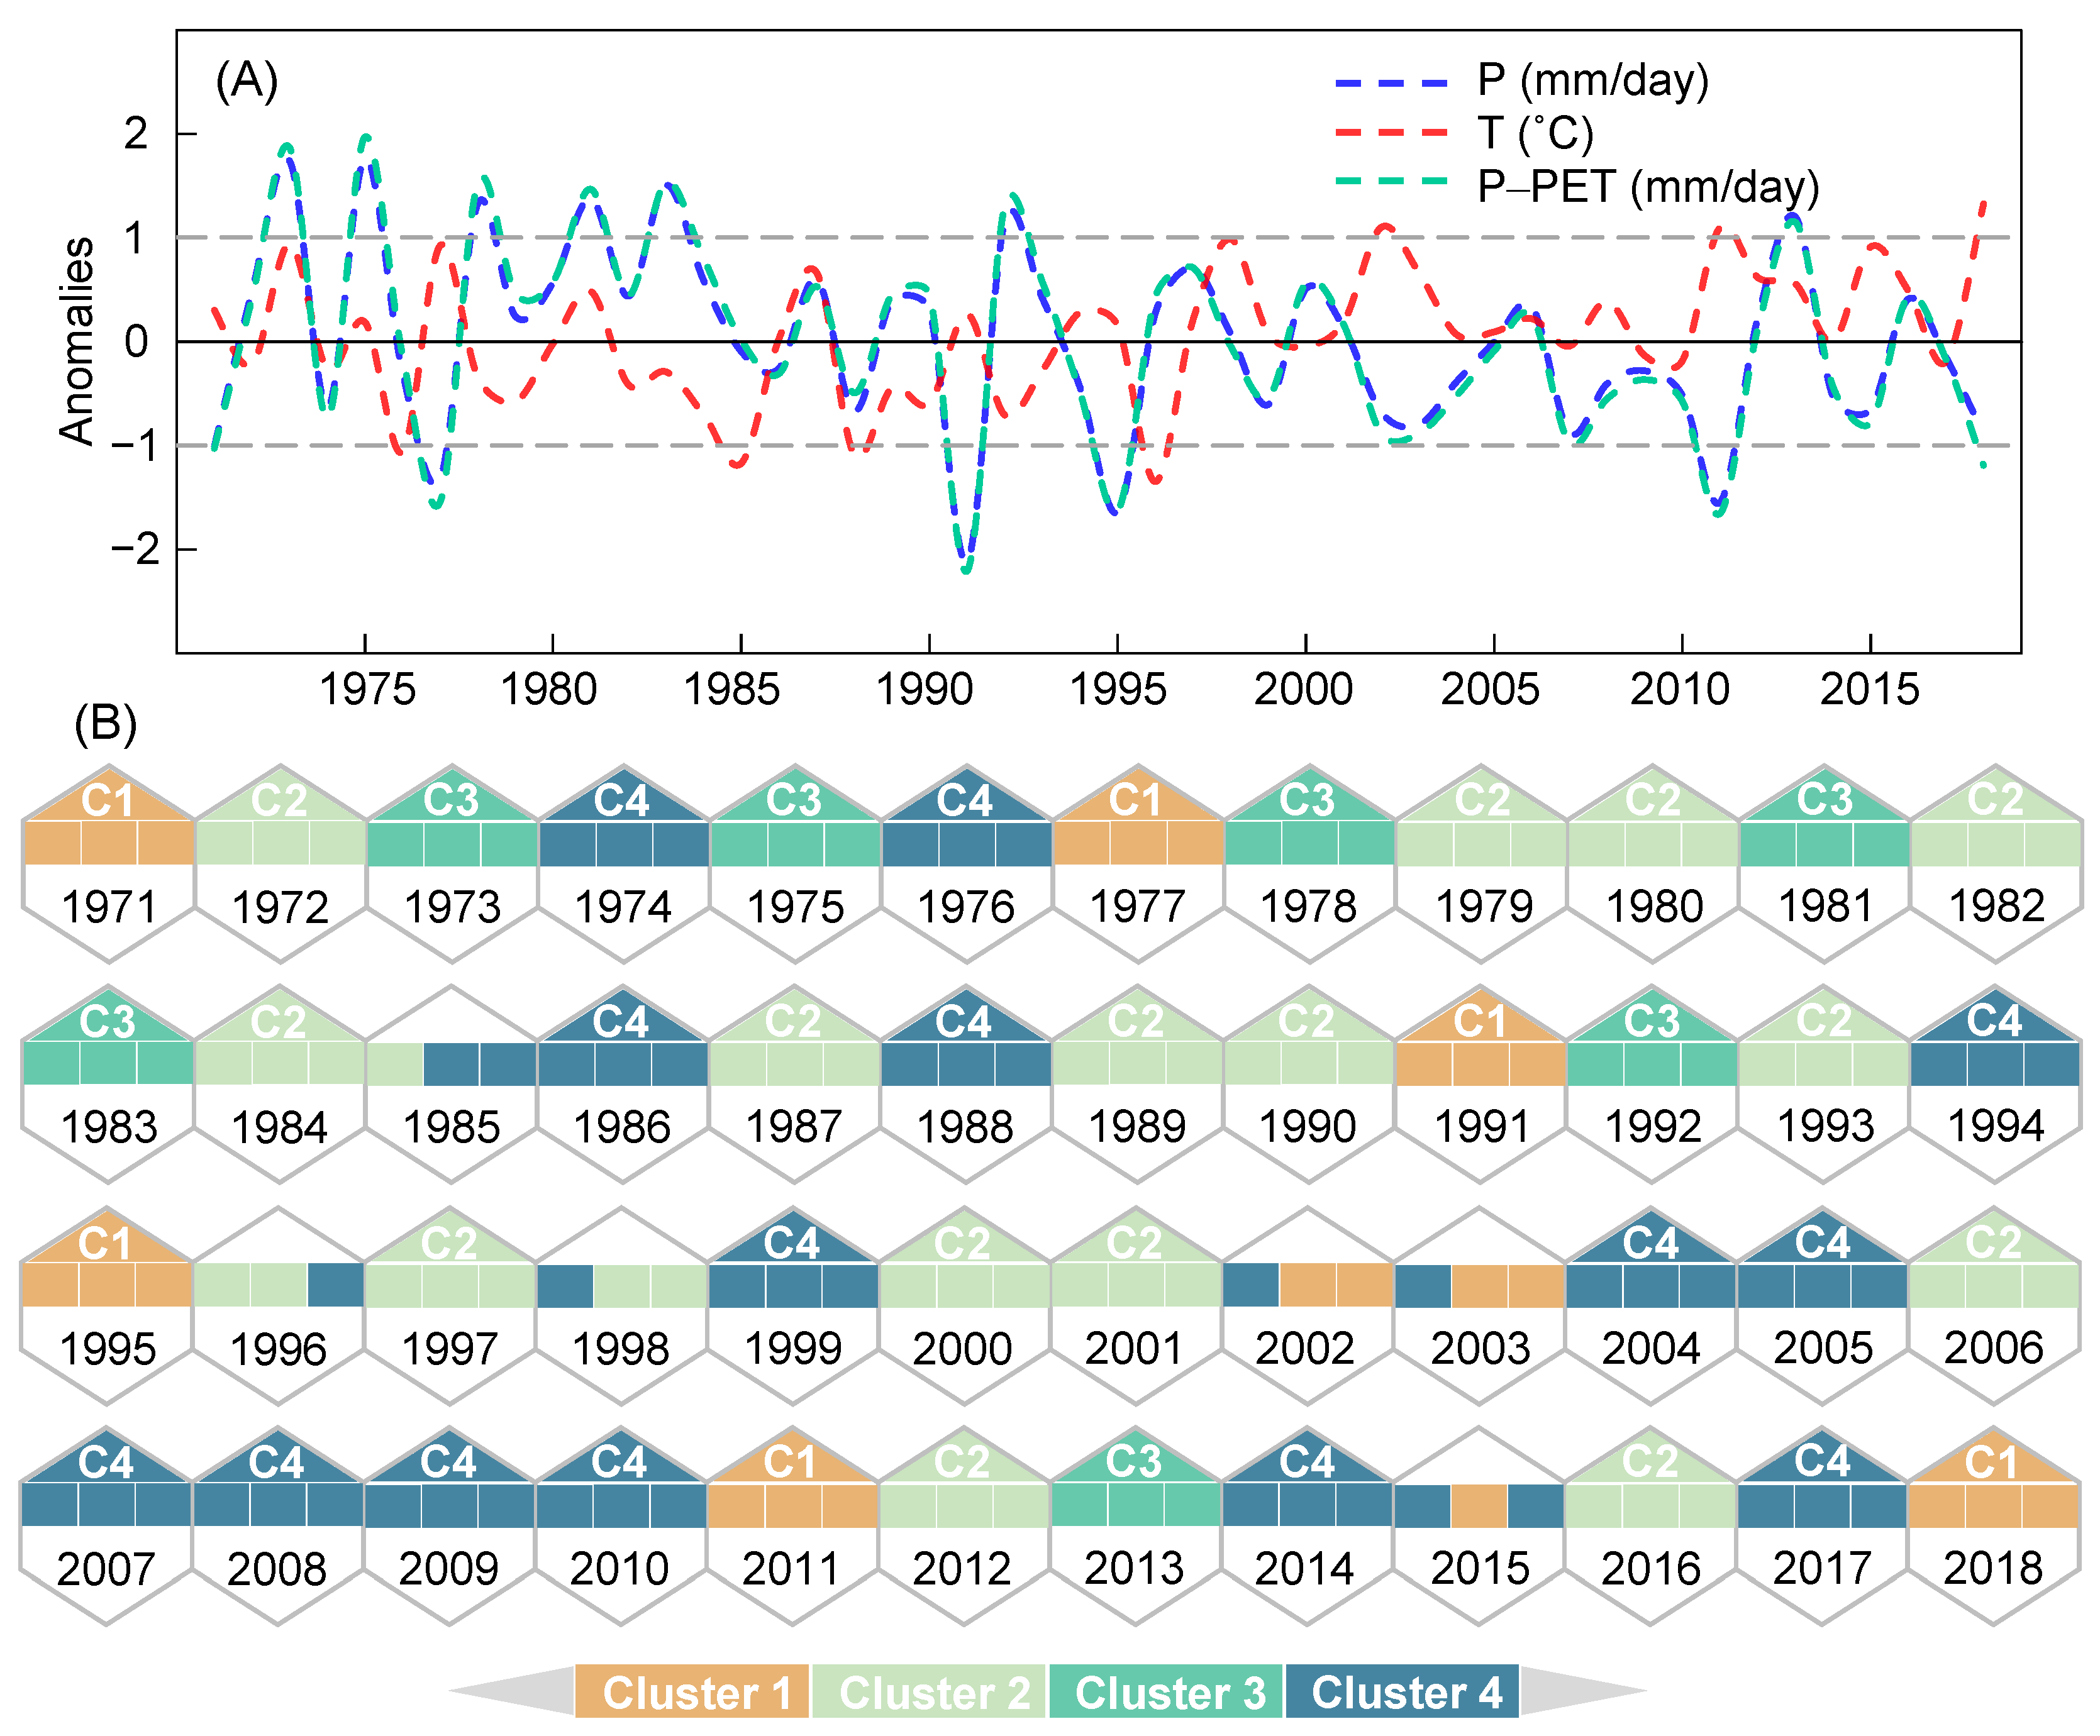
3.1. Temporal Variations of Climate Conditions
3.2. Clustering of Compound Dry–Hot Events
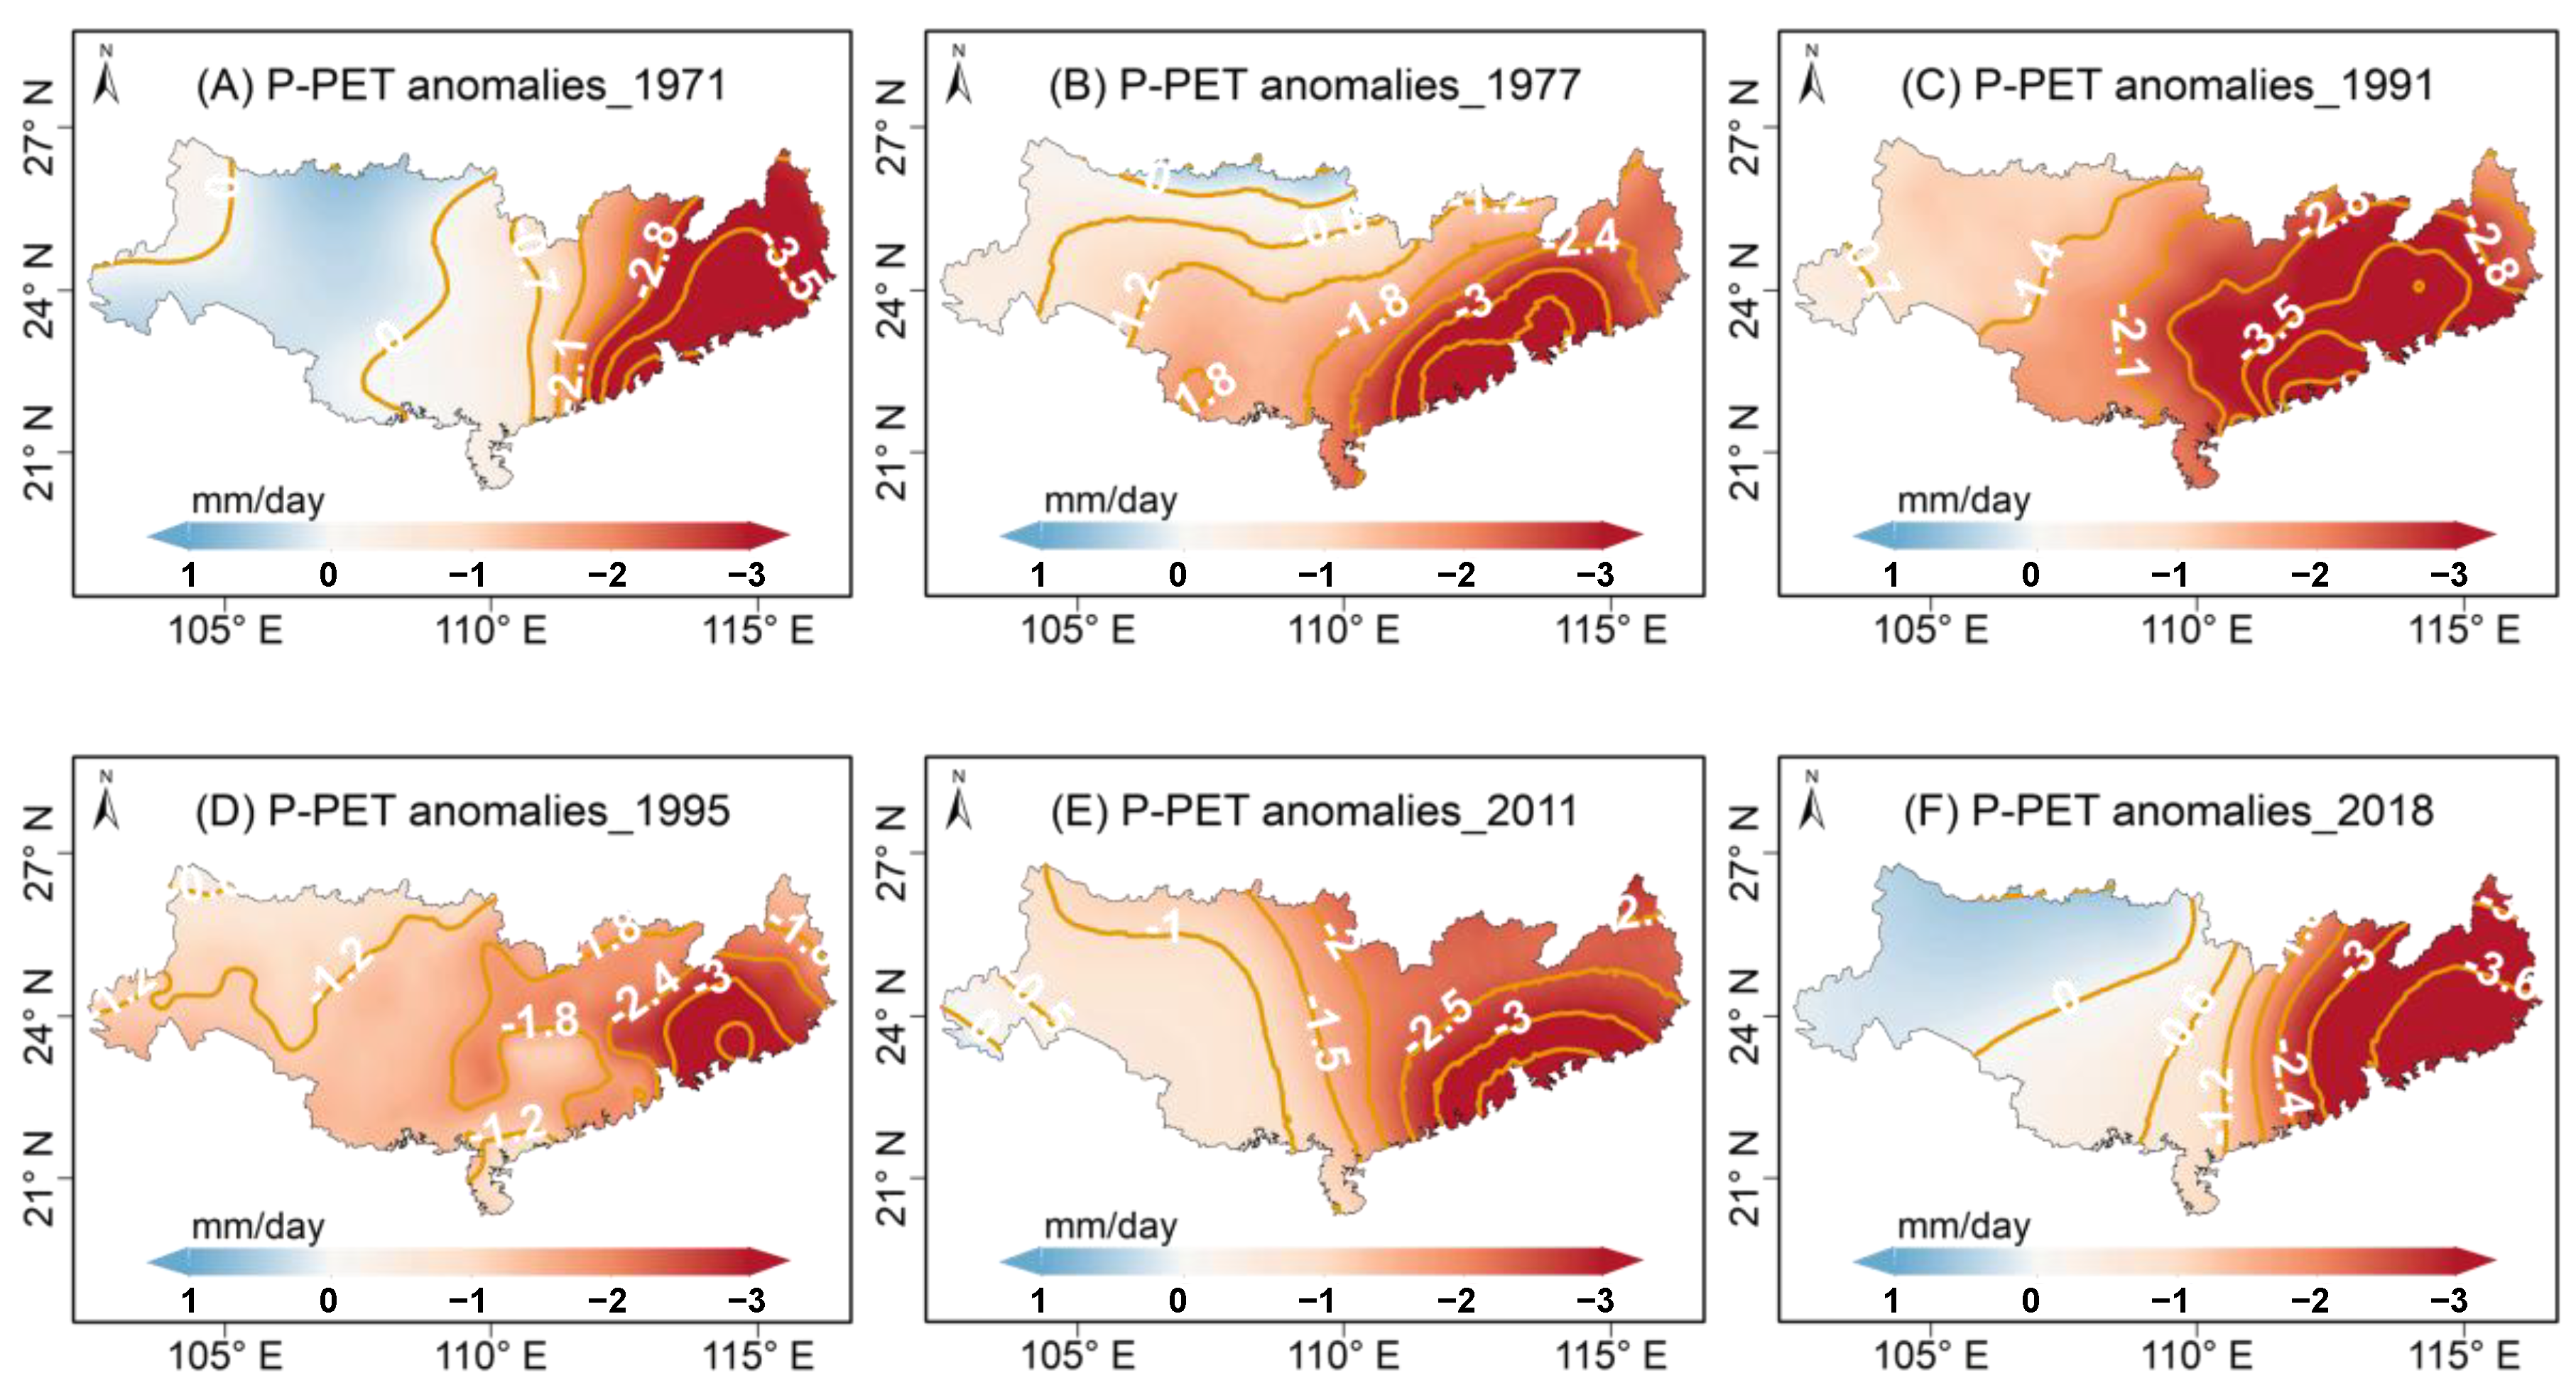
3.3. Characteristics of Compound Dry–Hot Events
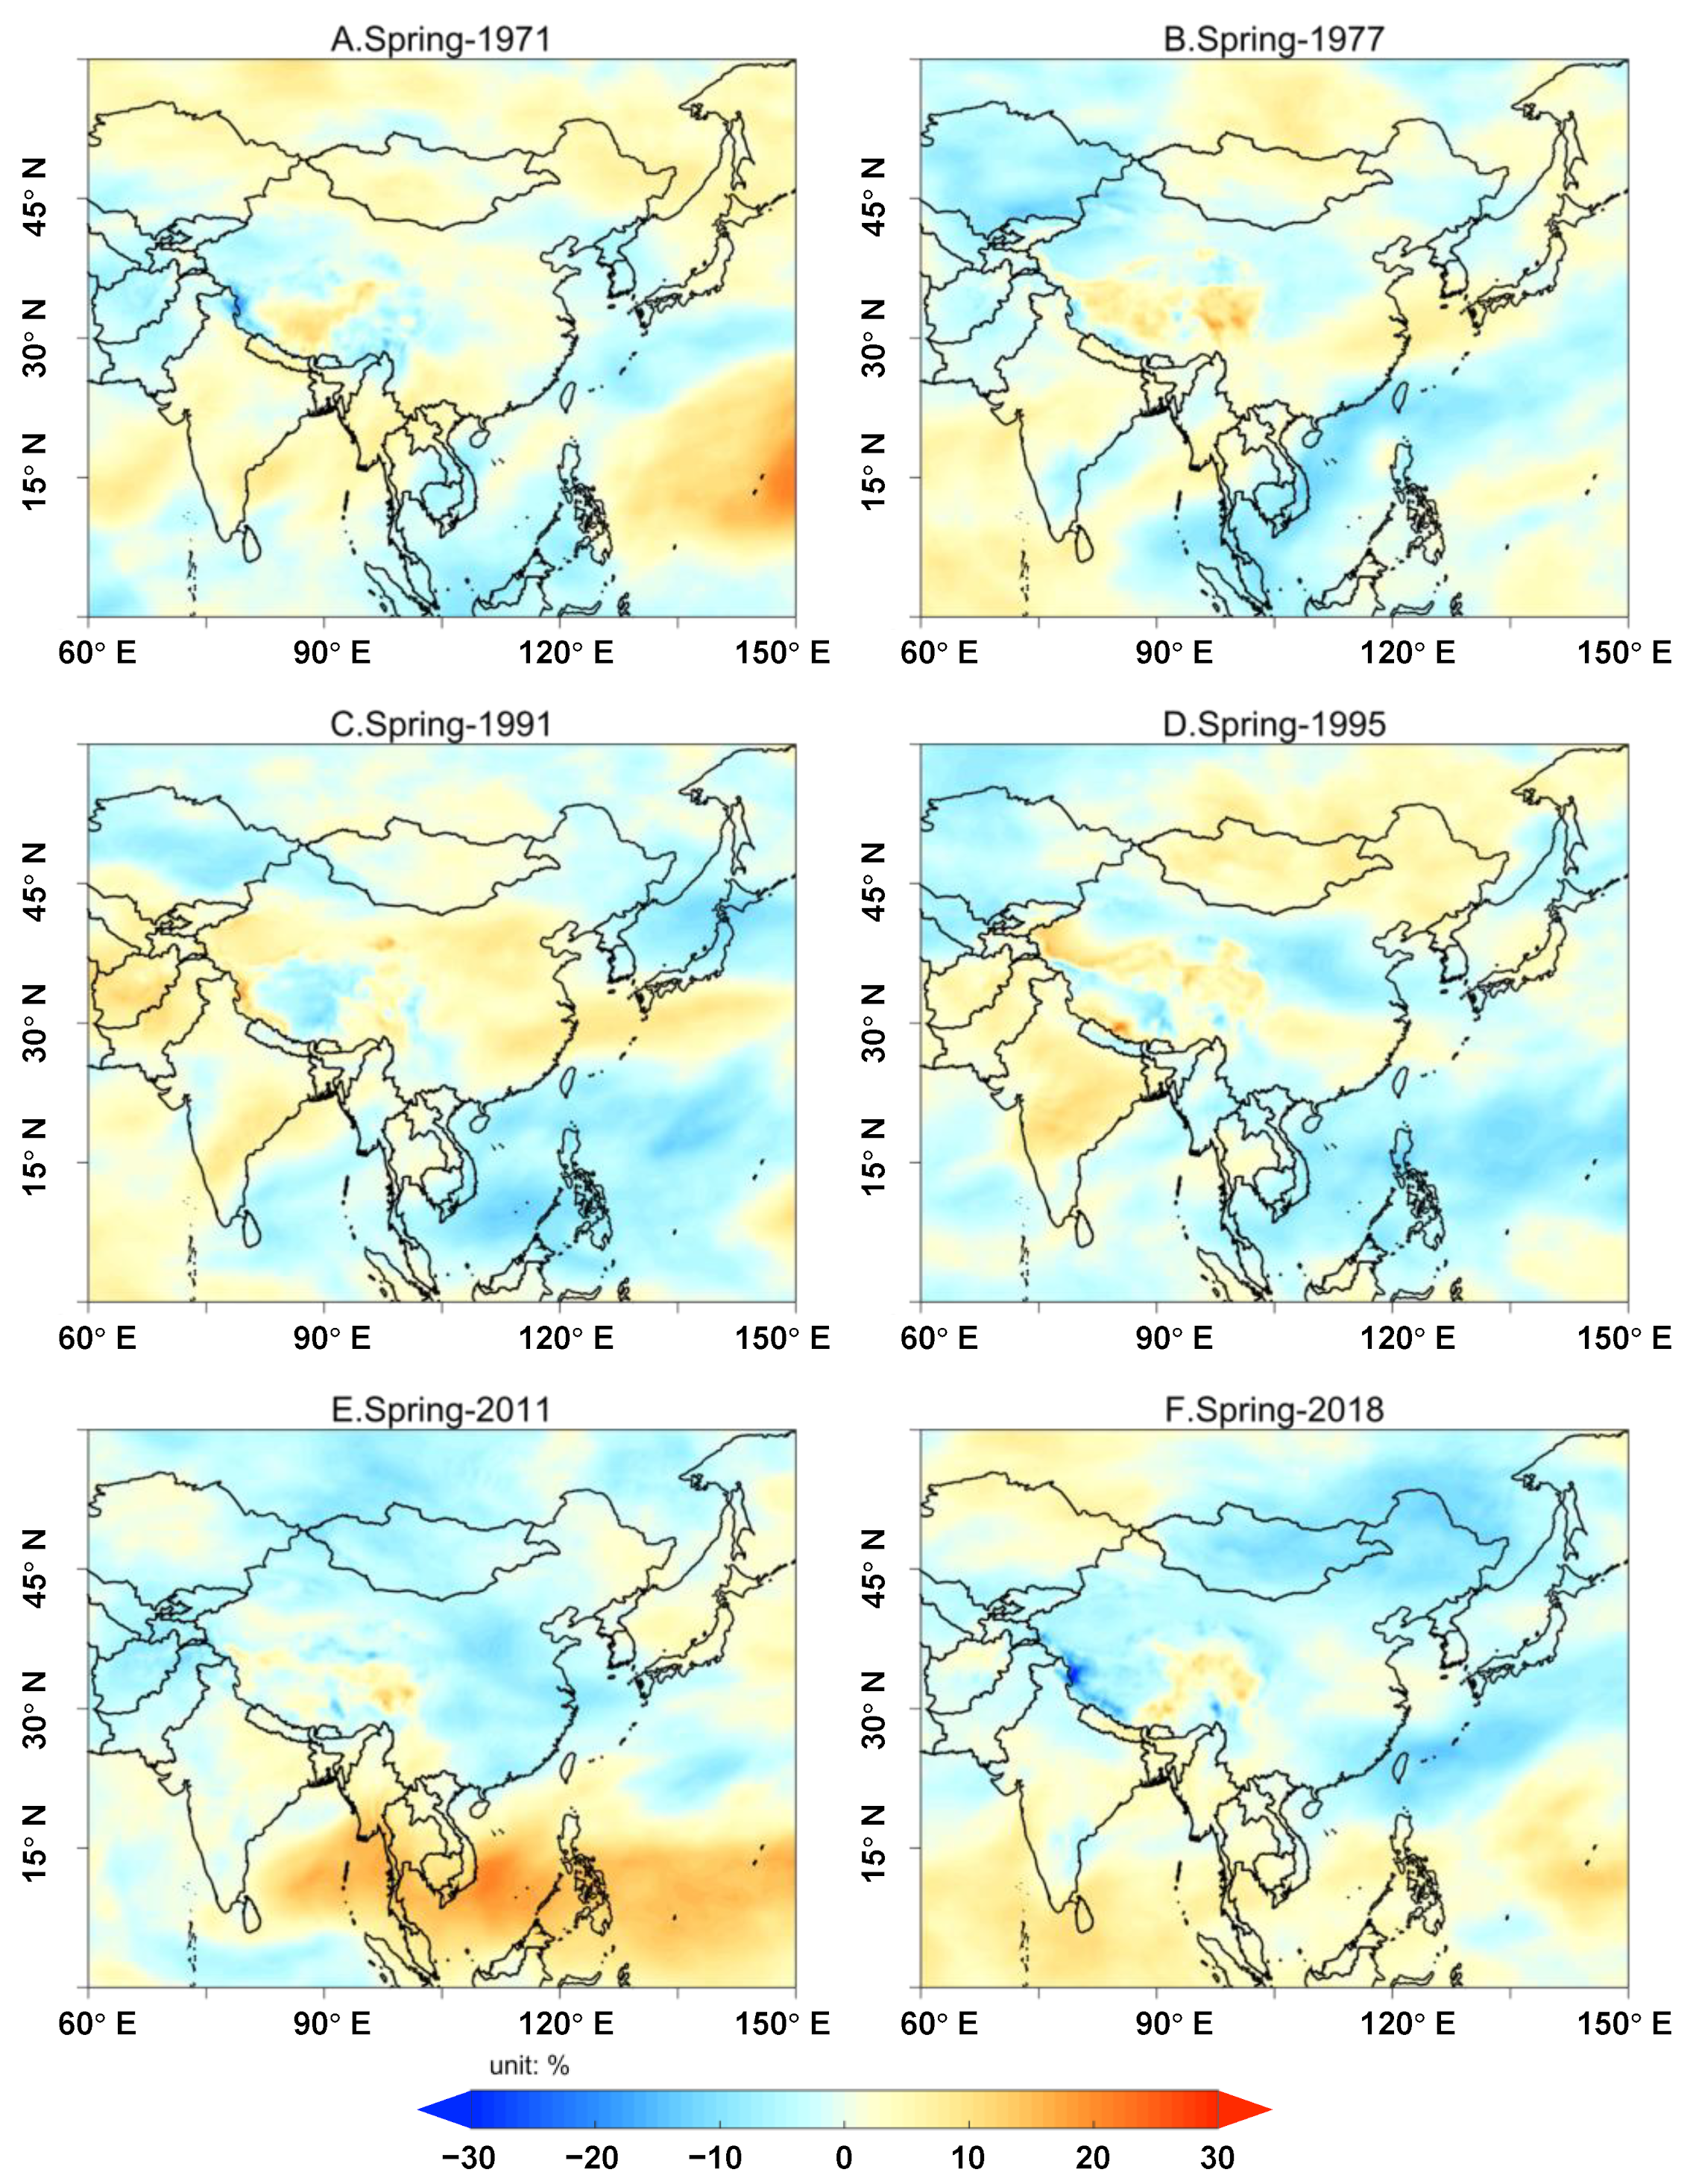
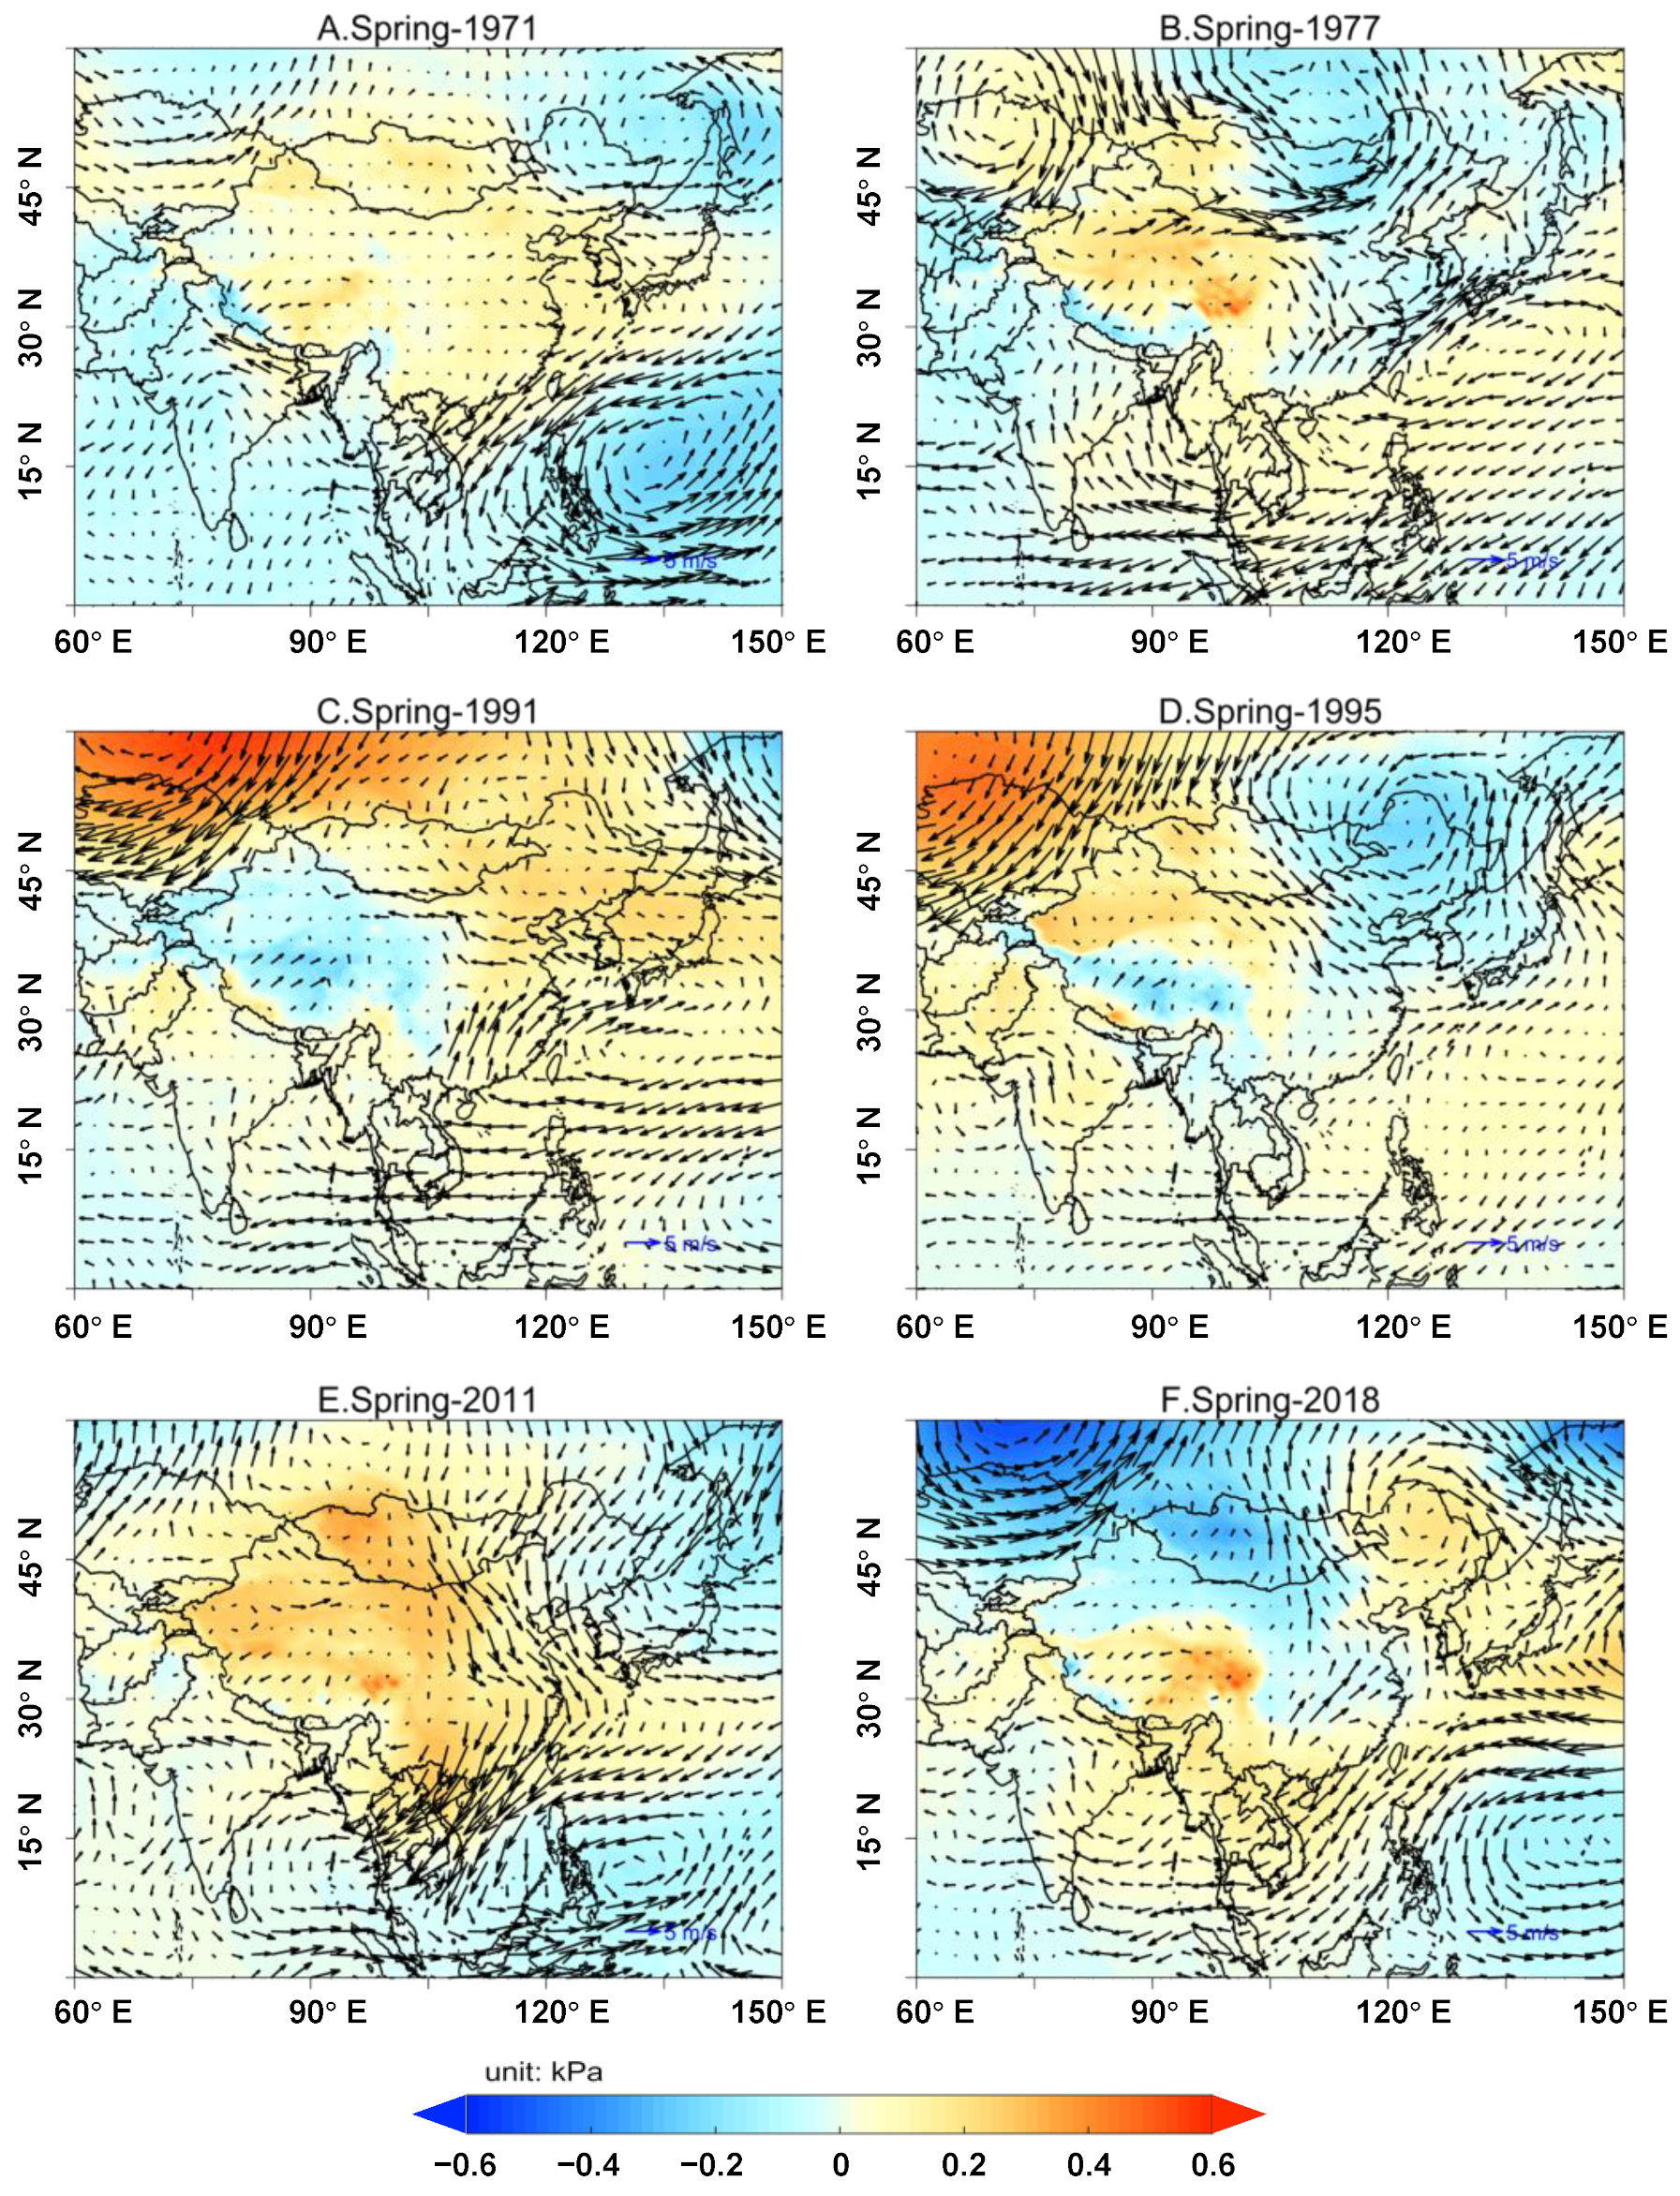
3.4. Variations of Atmospheric Circulation
4. Discussion
4.1. Importance of Studying Spring Compound Dry–Hot Events
4.2. Atmospheric Circulation Characteristics During Compound Events
5. Conclusions
Supplementary Materials
Author Contributions
Funding
Institutional Review Board Statement
Informed Consent Statement
Data Availability Statement
Acknowledgments
Conflicts of Interest
References
- Bevacqua, E.; Zappa, G.; Lehner, F.; Zscheischler, J. Precipitation trends determine future occurrences of compound hot–dry events. Nat. Clim. Change 2022, 12, 350–355. [Google Scholar] [CrossRef]
- Tian, R.; Li, J.; Zheng, J.; Liu, L.; Han, W.; Liu, Y. The impact of compound drought and heatwave events from 1982 to 2022 on the phenology of Central Asian grasslands. J. Environ. Manag. 2024, 365, 121624. [Google Scholar] [CrossRef] [PubMed]
- Zhang, G.; Wang, H.; Liu, W.; Wang, H. Projections and uncertainty analysis of socioeconomic exposure to compound dry and hot events under 1.5 °C and 2.0 °C warming levels across China. Theor. Appl. Climatol. 2024, 155, 7539–7556. [Google Scholar] [CrossRef]
- Chen, D.; Qiao, S.; Yang, J.; Tang, S.; Zuo, D.; Feng, G. Contribution of anthropogenic influence to the 2022-like Yangtze River valley compound heatwave and drought event. npj Clim. Atmos. Sci. 2024, 7, 172. [Google Scholar] [CrossRef]
- Tabari, H.; Willems, P. Global risk assessment of compound hot-dry events in the context of future climate change and socioeconomic factors. NPJ Clim. Atmos. Sci. 2023, 6, 74. [Google Scholar] [CrossRef]
- Zhang, Q.; Xu, C.Y.; Zhang, Z.; Chen, Y.D. Changes of atmospheric water vapor budget in the Pearl River basin and possible implications for hydrological cycle. Theor. Appl. Climatol. 2010, 102, 185–195. [Google Scholar] [CrossRef]
- Qiang, Y.; Zhang, L.; He, J.; Xiao, T.; Huang, H.; Wang, H. Urban flood analysis for Pearl River Delta cities using an equivalent drainage method upon combined rainfall-high tide-storm surge events. J. Hydrol. 2021, 597, 126293. [Google Scholar] [CrossRef]
- Yu, R.; Zhai, P. Changes in compound drought and hot extreme events in summer over populated eastern China. Weather Clim. Extrem. 2020, 30, 100295. [Google Scholar] [CrossRef]
- Ridder, N.N.; Pitman, A.J.; Westra, S.; Ukkola, A.; Do, H.X.; Bador, M.; Hirsch, A.L.; Evans, J.P.; Di Luca, A.; Zscheischler, J. Global hotspots for the occurrence of compound events. Nat. Commun. 2020, 11, 5956. [Google Scholar] [CrossRef]
- Ionita, M.; Caldarescu, D.E.; Nagavciuc, V. Compound hot and dry events in Europe: Variability and large-scale drivers. Front. Clim. 2021, 3, 688991. [Google Scholar] [CrossRef]
- Manning, C.; Widmann, M.; Bevacqua, E.; Van Loon, A.F.; Maraun, D.; Vrac, M. Increased probability of compound long-duration dry and hot events in Europe during summer (1950–2013). Environ. Res. Lett. 2019, 14, 094006. [Google Scholar] [CrossRef]
- Sutanto, S.J.; Vitolo, C.; Di Napoli, C.; D’Andrea, M.; Van Lanen, H.A. Heatwaves, droughts, and fires: Exploring compound and cascading dry hazards at the pan-European scale. Environ. Int. 2020, 134, 105276. [Google Scholar] [CrossRef] [PubMed]
- Alizadeh, M.R.; Adamowski, J.; Nikoo, M.R.; AghaKouchak, A.; Dennison, P.; Sadegh, M. A century of observations reveals increasing likelihood of continental-scale compound dry-hot extremes. Sci. Adv. 2020, 6, eaaz4571. [Google Scholar] [CrossRef]
- Abella, D.J.; Ahn, K.H. Investigating the spatial and temporal characteristics of compound dry hazard occurrences across the pan-Asian region. Weather Clim. Extrem. 2024, 44, 100669. [Google Scholar] [CrossRef]
- Wu, X.; Hao, Z.; Tang, Q.; Singh, V.P.; Zhang, X.; Hao, F. Projected increase in compound dry and hot events over global land areas. Int. J. Climatol. 2021, 41, 393–403. [Google Scholar] [CrossRef]
- Tripathy, K.P.; Mukherjee, S.; Mishra, A.K.; Mann, M.E.; Williams, A.P. Climate change will accelerate the high-end risk of compound drought and heatwave events. Proc. Natl. Acad. Sci. USA 2023, 120, e2219825120. [Google Scholar] [CrossRef]
- Barriopedro, D.; Fischer, E.M.; Luterbacher, J.; Trigo, R.M.; García-Herrera, R. The hot summer of 2010: Redrawing the temperature record map of Europe. Science 2011, 332, 220–224. [Google Scholar] [CrossRef]
- Lu, Y.; Hu, H.; Li, C.; Tian, F. Increasing compound events of extreme hot and dry days during growing seasons of wheat and maize in China. Sci. Rep. 2018, 8, 16700. [Google Scholar] [CrossRef]
- Hu, Y.; Wang, W.; Wang, P.; Teuling, A.J.; Zhu, Y. Spatial-temporal variations and drivers of the compound dry-hot event in China. Atmos. Res. 2024, 299, 107160. [Google Scholar] [CrossRef]
- He, Y.; Hu, X.; Xu, W.; Fang, J.; Shi, P. Increased probability and severity of compound dry and hot growing seasons over world’s major croplands. Sci. Total Environ. 2022, 824, 153885. [Google Scholar] [CrossRef]
- Li, J.; Bevacqua, E.; Chen, C.; Wang, Z.; Chen, X.; Myneni, R.B.; Wu, X.; Xu, C.-Y.; Zhang, Z.; Zscheischler, J. Regional asymmetry in the response of global vegetation growth to springtime compound climate events. Commun. Earth Environ. 2022, 3, 123. [Google Scholar] [CrossRef]
- Hao, Z.; Hao, F.; Xia, Y.; Feng, S.; Sun, C.; Zhang, X.; Fu, Y.; Hao, Y.; Zhang, Y.; Meng, Y. Compound droughts and hot extremes: Characteristics, drivers, changes, and impacts. Earth-Sci. Rev. 2022, 235, 104241. [Google Scholar] [CrossRef]
- Mo, K.C.; Lettenmaier, D.P. Prediction of flash droughts over the United States. J. Hydrometeorol. 2020, 21, 1793–1810. [Google Scholar] [CrossRef]
- Mukherjee, S.; Mishra, A.K. Increase in compound drought and heatwaves in a warming world. Geophys. Res. Lett. 2021, 48, e2020GL090617. [Google Scholar] [CrossRef]
- McKinnon, K.A.; Poppick, A.; Simpson, I.R. Hot extremes have become drier in the United States Southwest. Nat. Clim. Change 2021, 11, 598–604. [Google Scholar] [CrossRef]
- Vogel, J.; Paton, E.; Aich, V.; Bronstert, A. Increasing compound warm spells and droughts in the Mediterranean Basin. Weather Clim. Extrem. 2021, 32, 100312. [Google Scholar] [CrossRef]
- Mukherjee, S.; Ashfaq, M.; Mishra, A.K. Compound drought and heatwaves at a global scale: The role of natural climate variability-associated synoptic patterns and land-surface energy budget anomalies. J. Geophys. Res. Atmos. 2020, 125, e2019JD031943. [Google Scholar] [CrossRef]
- Zscheischler, J.; Fischer, E.M. The record-breaking compound hot and dry 2018 growing season in Germany. Weather Clim. Extrem. 2020, 29, 100270. [Google Scholar] [CrossRef]
- Zhao, R.; Zhou, X.; Liu, J.; Li, Y.P.; Huang, G.H.; Li, C.H. Projections of compound wet-warm and dry-warm extreme events in summer over China. J. Hydrol. 2024, 639, 131635. [Google Scholar] [CrossRef]
- Duan, R.; Huang, G.; Li, Y.; Zhou, X.; Ren, J.; Tian, C. Stepwise clustering future meteorological drought projection and multi-level factorial analysis under climate change: A case study of the Pearl River Basin, China. Environ. Res. 2021, 196, 110368. [Google Scholar] [CrossRef]
- Baccour, S.; Goelema, G.; Kahil, T.; Albiac, J.; van Vliet, M.T.; Zhu, X.; Strokal, M. Water quality management could halve future water scarcity cost-effectively in the Pearl River Basin. Nat. Commun. 2024, 15, 5669. [Google Scholar] [CrossRef] [PubMed]
- Yang, Y.; Zhang, Y.; Zhang, J.; Yu, C.; Xu, Z. Impacts of watershed nutrient loads on eutrophication risks under multiple socio-economic development scenarios in the Pearl River Estuary, China. J. Clean. Prod. 2025, 496, 145133. [Google Scholar] [CrossRef]
- Duan, R.; Huang, G.; Zhou, X.; Li, Y.; Tian, C. Ensemble drought exposure projection for multifactorial interactive effects of climate change and population dynamics: Application to the Pearl River Basin. Earth’s Future 2021, 9, e2021EF002215. [Google Scholar] [CrossRef]
- Yang, T.; Shao, Q.; Hao, Z.C.; Chen, X.; Zhang, Z.; Xu, C.Y.; Sun, L. Regional frequency analysis and spatio-temporal pattern characterization of rainfall extremes in the Pearl River Basin, China. J. Hydrol. 2010, 380, 386–405. [Google Scholar] [CrossRef]
- Zhang, Q.; Xiao, M.; Singh, V.P.; Li, J. Regionalization and spatial changing properties of droughts across the Pearl River basin, China. J. Hydrol. 2012, 472, 355–366. [Google Scholar] [CrossRef]
- Chen, Y.D.; Zhang, Q.; Xiao, M.; Singh, V.P. Transition probability behaviors of drought events in the Pearl River basin, China. Stoch. Environ. Res. Risk Assess. 2017, 31, 159–170. [Google Scholar] [CrossRef]
- Xu, F.; Zhou, Y.; Zhao, L. Spatial and temporal variability in extreme precipitation in the Pearl River Basin, China from 1960 to 2018. Int. J. Climatol. 2022, 42, 797–816. [Google Scholar] [CrossRef]
- Ahmed, M.; Seraj, R.; Islam, S.M.S. The k-means algorithm: A comprehensive survey and performance evaluation. Electronics 2020, 9, 1295. [Google Scholar] [CrossRef]
- Pike, M.; Lintner, B.R. Application of clustering algorithms to TRMM precipitation over the tropical and South Pacific Ocean. J. Clim. 2020, 33, 5767–5785. [Google Scholar] [CrossRef]
- Ikotun, A.M.; Ezugwu, A.E.; Abualigah, L.; Abuhaija, B.; Heming, J. K-means clustering algorithms: A comprehensive review, variants analysis, and advances in the era of big data. Inf. Sci. 2023, 622, 178–210. [Google Scholar] [CrossRef]
- Murtagh, F.; Contreras, P. Algorithms for hierarchical clustering: An overview. Wiley Interdiscip. Rev. Data Min. Knowl. Discov. 2012, 2, 86–97. [Google Scholar] [CrossRef]
- Murtagh, F.; Legendre, P. Ward’s hierarchical agglomerative clustering method: Which algorithms implement Ward’s criterion? J. Classif. 2014, 31, 274–295. [Google Scholar] [CrossRef]
- Wang, F.; Huang, G.H.; Cheng, G.H.; Li, Y.P. Impacts of climate variations on non-stationarity of streamflow over Canada. Environ. Res. 2021, 197, 111118. [Google Scholar] [CrossRef]
- Yan, J.; Chen, J.; Zhan, J.; Song, S.; Zhang, Y.; Zhao, M.; Liu, Y.; Xu, W. Automatic identification of rock discontinuity sets using modified agglomerative nesting algorithm. Bull. Eng. Geol. Environ. 2022, 81, 229. [Google Scholar] [CrossRef]
- Wijuniamurti, S.; Nugroho, S.; Rachmawati, R. Agglomerative Nesting (AGNES) Method and Divisive Analysis (DIANA) Method For Hierarchical Clustering On Some Distance Measurement Concepts. J. Stat. Data Sci. 2022, 1, 7–11. [Google Scholar] [CrossRef]
- Jiang, Q.; Li, W.; Fan, Z.; He, X.; Sun, W.; Chen, S.; Wen, J.; Gao, J.; Wang, J. Evaluation of the ERA5 reanalysis precipitation dataset over Chinese Mainland. J. Hydrol. 2021, 595, 125660. [Google Scholar] [CrossRef]
- Lavers, D.A.; Simmons, A.; Vamborg, F.; Rodwell, M.J. An evaluation of ERA5 precipitation for climate monitoring. Q. J. R. Meteorol. Soc. 2022, 148, 3152–3165. [Google Scholar] [CrossRef]
- Paredes, P.; Pereira, L.S.; Almorox, J.; Darouich, H. Reference grass evapotranspiration with reduced data sets: Parameterization of the FAO Penman-Monteith temperature approach and the Hargeaves-Samani equation using local climatic variables. Agric. Water Manag. 2020, 240, 106210. [Google Scholar] [CrossRef]
- Wang, T.; Zhang, Q.; Hannachi, A.; Hirooka, T.; Hegglin, M.I. Tropical water vapour in the lower stratosphere and its relationship to tropical/extratropical dynamical processes in ERA5. Q. J. R. Meteorol. Soc. 2020, 146, 2432–2449. [Google Scholar] [CrossRef]
- Simmons, A.J. Trends in the tropospheric general circulation from 1979 to 2022. Weather Clim. Dyn. 2022, 3, 777–809. [Google Scholar] [CrossRef]
- Revadekar, J.V.; Kothawale, D.R.; Rupa Kumar, K. Role of El Niño/La Niña in temperature extremes over India. Int. J. Climatol. 2009, 29, 2121. [Google Scholar] [CrossRef]
- Tangang, F.; Farzanmanesh, R.; Mirzaei, A.; Supari; Salimun, E.; Jamaluddin, A.F.; Juneng, L. Characteristics of precipitation extremes in Malaysia associated with El Niño and La Niña events. Int. J. Climatol. 2017, 37, 696–716. [Google Scholar] [CrossRef]
- Lu, E.; Cai, W.; Jiang, Z.; Zhang, Q.; Zhang, C.; Higgins, R.W.; Halpert, M.S. The day-to-day monitoring of the 2011 severe drought in China. Clim. Dyn. 2014, 43, 1–9. [Google Scholar] [CrossRef]
- Zhou, T.J.; Yu, R.C. Atmospheric water vapor transport associated with typical anomalous summer rainfall patterns in China. J. Geophys. Res. Atmos. 2005, 110. [Google Scholar] [CrossRef]
- Matsumura, S.; Horinouchi, T. Pacific Ocean decadal forcing of long-term changes in the western Pacific subtropical high. Sci. Rep. 2016, 6, 37765. [Google Scholar] [CrossRef]
- He, C.; Zhou, T.; Wu, B. The key oceanic regions responsible for the interannual variability of the western North Pacific subtropical high and associated mechanisms. J. Meteorol. Res. 2015, 29, 562–575. [Google Scholar] [CrossRef]
- Yun, K.S.; Ha, K.J.; Yeh, S.W.; Wang, B.; Xiang, B. Critical role of boreal summer North Pacific subtropical highs in ENSO transition. Clim. Dyn. 2015, 44, 1979–1992. [Google Scholar] [CrossRef]
- Ke, M.; Wang, Z.; Pan, W.; Luo, H.; Yang, S.; Guo, R. Extremely strong western Pacific subtropical high in May 2021 following a La Niña event: Role of the persistent convective forcing over the Indian Ocean. Asia-Pac. J. Atmos. Sci. 2023, 59, 47–58. [Google Scholar] [CrossRef]
- Zhang, L.; Zhou, T.; Chen, X.; Wu, P.; Christidis, N.; Lott, F.C. The Late Spring Drought of 2018 in South China. Bull. Am. Meteorol. Soc. 2020, 101, S59–S64. [Google Scholar] [CrossRef]
- Li, J.; Wang, Z.; Wu, X.; Zscheischler, J.; Guo, S.; Chen, X. A standardized index for assessing sub-monthly compound dry and hot conditions with application in China. Hydrol. Earth Syst. Sci. 2021, 25, 1587–1601. [Google Scholar] [CrossRef]
- Wu, X.; Hao, Z.; Hao, F.; Zhang, X. Variations of compound precipitation and temperature extremes in China during 1961–2014. Sci. Total Environ. 2019, 663, 731–737. [Google Scholar] [CrossRef] [PubMed]
- Otkin, J.A.; Anderson, M.C.; Hain, C.; Mladenova, I.E.; Basara, J.B.; Svoboda, M. Examining rapid onset drought development using the thermal infrared–based evaporative stress index. J. Hydrometeorol. 2013, 14, 1057–1074. [Google Scholar] [CrossRef]
- Li, E.; Zhao, J.; Pullens, J.W.; Yang, X. The compound effects of drought and high temperature stresses will be the main constraints on maize yield in Northeast China. Sci. Total Environ. 2022, 812, 152461. [Google Scholar] [CrossRef] [PubMed]
- Zhang, Y.; Hao, Z.; Feng, S.; Zhang, X.; Hao, F. Changed relationship between compound dry-hot events and ENSO at the global scale. J. Hydrol. 2023, 621, 129559. [Google Scholar] [CrossRef]
- Quesada, B.; Vautard, R.; Yiou, P.; Hirschi, M.; Seneviratne, S.I. Asymmetric European summer heat predictability from wet and dry southern winters and springs. Nat. Clim. Change 2012, 2, 736–741. [Google Scholar] [CrossRef]


| Year | P Anomalies (mm/day) | P–PET Anomalies (mm/day) | T Anomalies (°C) |
|---|---|---|---|
| 1971 | −1.008 | −1.027 | 0.301 |
| 1977 | −1.320 | −1.540 | 0.925 |
| 1991 | −2.120 | −2.206 | 0.263 |
| 1995 | −1.638 | −1.625 | 0.150 |
| 2011 | −1.547 | −1.653 | 1.099 |
| 2018 | −0.889 | −1.190 | 1.327 |
Disclaimer/Publisher’s Note: The statements, opinions and data contained in all publications are solely those of the individual author(s) and contributor(s) and not of MDPI and/or the editor(s). MDPI and/or the editor(s) disclaim responsibility for any injury to people or property resulting from any ideas, methods, instructions or products referred to in the content. |
© 2025 by the authors. Licensee MDPI, Basel, Switzerland. This article is an open access article distributed under the terms and conditions of the Creative Commons Attribution (CC BY) license (https://creativecommons.org/licenses/by/4.0/).
Share and Cite
Duan, R.; Wang, F.; Zhang, J.; Zhou, X. Cluster Analysis and Atmospheric Circulation Features of Springtime Compound Dry-Hot Events in the Pearl River Basin. Atmosphere 2025, 16, 516. https://doi.org/10.3390/atmos16050516
Duan R, Wang F, Zhang J, Zhou X. Cluster Analysis and Atmospheric Circulation Features of Springtime Compound Dry-Hot Events in the Pearl River Basin. Atmosphere. 2025; 16(5):516. https://doi.org/10.3390/atmos16050516
Chicago/Turabian StyleDuan, Ruixin, Feng Wang, Jiannan Zhang, and Xiong Zhou. 2025. "Cluster Analysis and Atmospheric Circulation Features of Springtime Compound Dry-Hot Events in the Pearl River Basin" Atmosphere 16, no. 5: 516. https://doi.org/10.3390/atmos16050516
APA StyleDuan, R., Wang, F., Zhang, J., & Zhou, X. (2025). Cluster Analysis and Atmospheric Circulation Features of Springtime Compound Dry-Hot Events in the Pearl River Basin. Atmosphere, 16(5), 516. https://doi.org/10.3390/atmos16050516