Abstract
Marine heatwaves (MHWs) pose a serious threat to the marine ecosystems and fishery resources in the East China Sea (ECS). Based on National Oceanic and Atmospheric Administration Optimum Interpolation Sea Surface Temperature High Resolution version 2 data, this study investigated the regional divergence in long-term trends of MHWs in the ECS from 1982 to 2023. The principal findings were as follows. Concerning MHWs, the coastal waters of China from northern Jiangsu coast to northeast of Taiwan Island experienced a relatively high annual average frequency, the longest duration, largest number of total days, strongest intensity, and the most pronounced seasonal signals. Additionally, the areas along the Kuroshio path showed significant levels of frequency, duration, and total days, but with comparatively weak intensity. In the empirical orthogonal function (EOF) analysis, EOF1 of the total days and cumulative intensity exhibited notable variation along the path of the Kuroshio and its offshoots, and in Chinese coastal areas. EOF2 showed significantly more conspicuous variation in areas extending from the Yangtze River Estuary to the northern Jiangsu coast. Furthermore, the MHW indices generally showed a positive trend in the ECS from 1982 to 2023. Importantly, the regions with high annual average MHW indices were also characterized by a significantly positive increasing trend. Moderate (79.10%) and strong (19.94%) events were most prevalent, whereas severe (0.82%) and extreme (0.14%) events occurred infrequently. The enhanced solar radiation and the reduced latent heat loss were the main contributing factors of MHWs in the ECS. These findings provide valuable insights into the ecological environment and resources of the ECS as a marine pastoral area.
1. Introduction
Marine heatwaves (MHWs) are defined as anomalous warming ocean events with temperatures exceeding specific thresholds for critical durations [1]. These phenomena usually prevail for several days to weeks and can broadly extend up to thousands of kilometers [2,3,4,5].
It has been confirmed that MHWs have increasingly negative effects on key species that are critical to the health and stability of ecosystems, as well as on biodiversity [6,7,8,9,10,11,12,13]. Furthermore, MHWs in the East China Sea (ECS) disrupt fishery resources, induce widespread coral bleaching, and cause large-scale algal blooms, adversely affecting industries like mariculture [14,15,16,17,18]. Moreover, MHWs can add to the impact of changes in mean ocean conditions. Specifically, typhoons interacting with MHWs in the northern ECS can either weaken or re-intensify because of increased latent heat loss, while intensified background stratification during MHWs leads to more pronounced temperature oscillations driven by semidiurnal internal tides [19]. Additionally, in most areas of the ECS, positive sea surface temperature (SST) anomalies during MHWs reduce the solubility of CO2 in seawater, thereby decreasing the capacity of the ocean to absorb CO2 [20].
It is indisputable that MHWs are increasingly occurring in the ECS. The ECS is a large marginal sea in the western North Pacific Ocean adjacent to the high-population coastal regions of East Asia (Figure 1). The Kuroshio Current, a strong western boundary current in the North Pacific subtropical gyre, flows northeastward along the continental slope of the ECS and plays an important role in controlling oceanic and atmospheric conditions around the ECS.
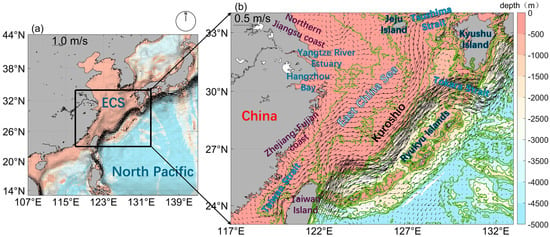
Figure 1.
(a) Bottom topography (shading, m) and mean surface geostrophic velocity (m/s, vectors) in the western North Pacific derived from “Global Ocean Gridded L 4 Sea Surface Heights And Derived Variables Reprocessed 1993 Ongoing” from 1993 to 2023. (b) Close-up of the East China Sea inside the square box in (a).
Studies have suggested that the annual average frequency of MHWs in the ECS exceeds three counts per year, far exceeding the global average and the spatial distribution of the annual average MHW duration closely resembles that of the annual average total days [21,22]. Additionally, the mean and maximum intensities generally decrease from the inner sea to the open sea, with higher values predominantly observed in the western ECS [23]. Nevertheless, the characterization of MHWs along the Kuroshio path is insufficiently comprehensive. Furthermore, although the spatiotemporal characteristics of summer heatwaves in the ECS have been depicted, the distribution in other seasons and different months still deserves further research. To date, there has been a paucity of studies on the detailed spatial-temporal variations in the multiple MHW indices in the ECS.
Over the past several decades, anthropogenic climate change has become more pronounced, and global warming has become an important issue [24,25]. With climate change, more MHWs have been observed [9,26]. Globally, the average frequency and duration of MHWs rose by 34% and 17%, respectively, with a 54% increase in annual MHW days between 1925 and 2016 [27]. The intensity (both mean and maximum) of MHWs has also increased significantly over the last few decades, showing a consistent upward trend across most ocean regions [28,29]. MHWs in China’s marginal seas have shown significantly increasing trends in terms of frequency, duration, and intensity, especially along the eastern marginal seas of China [21,23,30,31,32]. Additionally, trends in terms of hot days, as well as their frequency and intensity, have exhibited significant spatial heterogeneity, with more pronounced increases observed along the coastline in China’s marginal seas [33]. However, there is still a lack of in-depth research focusing solely on the relatively small-scale ECS. It is also a critical issue for fisheries that the analysis of MHW trends across various ECS regions lacks sufficient details. Although global awareness of MHW trends has increased, and overall trends in China’s offshore waters have been studied, meticulously determining the spatial distribution of long-term trends in terms of the multiple MHW indices in the ECS remains a key challenge that warrants further investigation.
As for the determinants influencing MHWs, studies have identified increased solar radiation owing to reduced cloud cover and less heat loss caused by weaker wind speeds as the primary factors contributing to summer MHWs, with El Niño also exerting a significant influence on summer MHWs in China’s marginal seas [21]. The northwestward expansion of the subtropical high is closely linked to the occurrence of MHWs during the summer months [34]. Furthermore, the increasing trend in summer MHWs is mainly attributed to the rise in summer mean sea surface temperature, while extreme summer MHWs are primarily driven by anomalous atmospheric forcing and oceanic vertical mixing [23]. However, the dominant factors driving heatwave events in the ECS across all seasons remain poorly understood. This study used high-resolution SST products to examine the detailed spatial characteristics of the long-term trend of MHWs in the ECS. To further describe the morphology of MHWs in the ECS, intensity classification and empirical orthogonal function (EOF) analyses of MHWs in the ECS were carried out. Furthermore, atmospheric reanalysis data were utilized to study the main contributing factors of MHWs. The specific questions of interest were as follows: (1) What are the spatial and temporal distribution patterns of MHWs in the ECS? and (2) What have been the long-term trends in these MHWs over the past few decades? (3) What are the main influencing factors for the spatio-temporal distribution of MHWs in the ECS? The remainder of this paper is organized as follows. Section 2 details the data and methods used in the analysis. Section 3 presents the results, and Section 4 presents the conclusions and discussion.
2. Materials and Methods
2.1. SST Dataset
In this study, the daily Optimum Interpolation Sea Surface Temperature dataset version 2 (OISST v2) [35] from 1982 to 2023, obtained from the National Oceanic and Atmospheric Administration (NOAA), was used (https://psl.noaa.gov/data/gridded/data.noaa.oisst.v2.highres.html (accessed on 15 April 2024)). The OISST dataset integrates satellite observations with in situ measurements at a spatial resolution of 0.25° × 0.25° [36]. This dataset has been widely used in studies on MHWs at different scales, ranging from regional to global [21,37].
2.2. Sea Surface Geostrophic Velocity Dataset
To enhance understanding of the distribution of MHWs within the background flow field, this study utilized geostrophic current products generated and provided by the Copernicus Marine Environment Monitoring Service, https://data.marine.copernicus.eu/product/SEALEVEL_GLO_PHY_L4_MY_008_047/download (accessed on 25 August 2024)). This dataset merges multiple satellites, including TOPEX/Poseidon, Jason-1, Jason-2, Jason-3, ERS-1, ERS-2, Envisat, CryoSat-2, SARAL/AltiKa, Sentinel-3A, Sentinel-3B, HY-2A, and HY-2B, at a spatial resolution of 0.25° [38]. In this study, the geostrophic current data were collected from 1993 to 2023.
2.3. Atmospheric Reanalysis Data
To examine the main factors influencing MHWs in the ECS, the fifth-generation global atmospheric reanalysis data (known as ERA5), provided by the European Centre for Medium-Range Weather Forecasts (ECMWF), was utilized. This dataset has a spatial resolution of 0.25° and an hourly temporal resolution and has been widely applied in studies investigating the driving mechanisms of MHWs [21,23,34]. Surface net solar radiation and latent heat flux were analyzed to assess the sea surface heat budget.
2.4. Definition of MHWs
In this study, we defined MHWs as prolonged and discrete anomalously warm water events, following Hobday et al. [4]. Specifically, an MHW event was considered to have occurred when the temperature was greater than the 90th percentile of the baseline climatology for 5 or more consecutive days. Here, temperatures for 30 years from 1982 to 2011 were used to define the baseline temperature climatology, as recommended by Hobday et al. [4]. Furthermore, if the time interval between two MHW events was less than two days, it was considered a single continuous MHW event.
We investigated six key metrics of MHWs: “frequency,” “maximum intensity,” “mean intensity,” “cumulative intensity,” “duration,” and “total days” (Table 1). Frequency refers to the number of MHWs occurring annually. Maximum and mean intensities refer to the highest and mean SST anomalies during the MHW, respectively. Cumulative intensity represents the sum of the SST anomalies during the MHW. Duration refers to the number of days between the start and end of an MHW event, and total days represent the sum of MHW days in each year. We extracted all MHW events in the ECS from 1982 to 2023 using relevant toolbox in MATLAB R2023a [39]. To better understand the definition of MHW, we depicted MHW events that occurred northeast of Taiwan Island (26.125° N, 123.125° E) between 1982 and 2023 (Figure 2).

Table 1.
Definitions of marine heatwave indices.
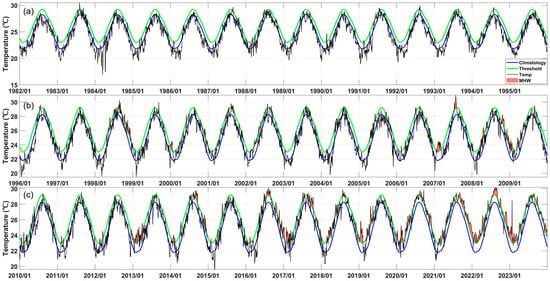
Figure 2.
Time series of sea surface temperatures at a location (26.125° N, 123.125° E) in the East China Sea from (a) 1982 to 1995, (b) 1996 to 2009, and (c) 2010 to 2023, respectively. Red shaded areas denote the marine heatwave events, black lines indicate the daily time series, blue lines indicate the climatology, and green lines, the thresholds, which are the 90th percentile values based on the baseline periods from 1982 to 2011.
2.5. Intensity Classification
Following the intensity-based MHW categorization scheme proposed by Hobday et al. [40], the MHWs were categorized into four types in this study, namely moderate, strong, severe, and extreme MHW events. As set out in Section 2.3, MHWs were defined in terms of exceeding the 90th percentile of the baseline climatology for 5 or more consecutive days. The severity index (M) is defined as:
where ts and te represent the start and end times of the MHW, respectively. refers to the intensity of the MHW occurring at location i in time period t0 (from ts to te), is the long-term climatology at location i and time t, and refers to the 90th percentile climatology at location i and time t. Therefore, MHW can be categorized as moderate (1 < M ≤ 2), strong (2 < M ≤ 3), severe (3 < M ≤ 4), or extreme (M > 4).
3. Results
3.1. Annual Average Distribution of MHWs in the ECS
To explore the key MHW indices in the ECS between 1982 and 2023, we plotted the spatial distribution of the annual average frequency, mean intensity, maximum intensity, cumulative intensity, duration, and total days of MHWs, as shown in Figure 3. Mean intensity (°C) and total days(days) can inform crop selection strategies for dominant populations; cumulative intensity (°C days) reflects event frequency and elevated intensities, while maximum intensity (°C) correlates with vulnerability to extreme risks in marine pastoral areas [14,41]. Additionally, to relate the MHWs in the ECS to the Kuroshio path, we superimposed black vectors showing the surface current velocity, as shown in Figure 3.
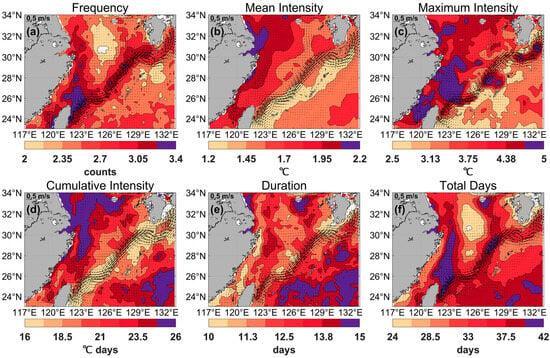
Figure 3.
Annual average distribution of (a) frequency (counts), (b) mean intensity (°C), (c) maximum intensity (°C), (d) cumulative intensity (°C days), (e) duration (days), and (f) total days (days) of marine heatwaves in the East China Sea from 1982 to 2023. Black current vectors indicate the mean surface velocity (m/s) from 1993 to 2023.
The annual average frequency of MHWs in the ECS ranged from 1.67 to 4.02 counts annually, with a relatively high frequency of more than 3.05 counts along the southeastern coastal region of China from the Yangtze River Estuary to the Taiwan Strait, as well as along the Kuroshio path (Figure 3a). Notably, the high-frequency distribution along the Kuroshio path branched out and extended to the eastern part of Jeju Island. Closer observation of the frequency of MHWs west of Kyushu Island indicated that a high frequency (more than 2.7 counts) was concentrated along an offshoot of the Kuroshio path, which flowed toward the Tsushima Strait (Figure 3a). Furthermore, the region northeast of Taiwan Island recorded the highest mean frequency, reaching 4.02 counts annually (Figure 3a). In contrast, a distinct area southwest of Jeju Island experienced a notably lower mean frequency of MHWs (Figure 3a).
Compared with the frequencies, the mean intensity showed a different spatial pattern. Generally, mean intensity gradually decreased from northwest to southeast across the ECS (Figure 3b). The coastal area from northern Jiangsu to Hangzhou Bay experienced the strongest mean intensity, with a peak of 2.92 °C, while the Ryukyu Islands, extending from eastern Taiwan Island to Kyushu Island, displayed a weaker mean intensity (Figure 3b). The strongest maximum intensity, reaching 14.28 °C, was observed in Hangzhou Bay, while a comparatively strong maximum intensity (more than 4.38 °C) was noted in the southeastern coastal waters of Zhejiang and Fujian, as well as in certain regions of the Taiwan Strait (Figure 3c). In summary, frequency and maximum intensity exhibited analogous distribution patterns, with the high-value regions predominantly located along the southeastern coast of China and the Kuroshio path (Figure 3a,c).
In terms of cumulative intensity, the highest value, up to 60.93 °C days, was recorded from the northern Jiangsu coast to Hangzhou Bay, with high values of more than 23.5 °C days occurring in surrounding meridional waters (Figure 3d). Cumulative intensity was shown to decrease, moving outward toward the Ryukyu Islands (Figure 3d), which is similar to the pattern in Figure 3c. However, parts of the Pacific southeast of the Ryukyu Islands also showed relatively strong cumulative intensity (more than 18.5 °C days) (Figure 3d). Furthermore, it is noteworthy that the cumulative intensity in the southwestern sea area of Jeju Island was relatively strong, which was primarily influenced by comparatively strong intensities (both mean and maximum intensities) (Figure 3b–d). Conversely, the cumulative intensity along the main path of the Kuroshio Current remained significantly weak, which was predominantly governed by a relatively weak mean intensity even with a high occurrence frequency and total number of days (Figure 3a,b,d,f).
The longest MHW duration, peaking at 20.89 days, occurred in the waters between the northern Jiangsu coast and Hangzhou Bay. Additionally, the southern waters of Jeju Island and the waters of the Pacific located southeast of the Ryukyu Islands experienced relatively long durations (more than 13.8 days) (Figure 3e). The distribution of the total number of MHW days in the ECS was similar to the frequency (Figure 3f). The southeastern coastal region of China, from the northern Jiangsu coast to eastern Taiwan Island, displayed a relatively large number of MHW total days annually (more than 28.5 days) (Figure 3f). The area with the greatest total days was extensive, with the annual average total days reaching a maximum of 53.21 days in Hangzhou Bay. The Kuroshio path and its offshoots also showed a large number of days (more than 26.25 days) (Figure 3f). In contrast, southwestern Jeju Island was located in the region with the lowest value (Figure 3f).
3.2. Seasonal Variation in Mhws in the ECS
The seasonal variations in total days (days), mean intensity (°C), maximum intensity (°C), and cumulative intensity (°C days) of MHWs in the ECS from 1982 to 2023 were examined in this subsection.
The MHWs in the ECS show distinct seasonal variations. In spring and winter, the Kuroshio Current and its offshoot to the Tsushima Strait experienced a high number of MHW total days (more than 6 days) (Figure 4a,d). In contrast, the coastal waters from the Yangtze River Estuary to the northeast of Taiwan Island also showed a relatively large number of total days (more than 4.86 days). The maximum of the total days recorded was 16.57 days in spring and 15.52 days in winter, which occurred in Hangzhou Bay and northeastern waters off Taiwan Island, respectively (Figure 4a,d). Furthermore, coastal waters exhibited markedly significant levels of mean, maximum, and cumulative intensities (Figure 4e,h and Figure 5a,d,e,h). In spring, mean intensity was strongest along the coastal waters of the ECS, extending into the Taiwan Strait, with a peak of 3.63 °C on the Zhejiang-Fujian coast (Figure 4e), where the strongest maximum intensity (3.65 °C) was recorded (Figure 5a), while the peak cumulative intensity (65.27 °C days) occurred in southeastern Hangzhou Bay (Figure 5e). It was also noteworthy that the Kuroshio offshoot flowing into the Tsushima Strait demonstrated a relatively high cumulative intensity (more than 22.5 °C days) (Figure 5e). Nevertheless, the mean, maximum, and cumulative intensities of the MHW in the waters surrounding the Ryukyu Islands were comparatively weak (Figure 4e and Figure 5a,e).
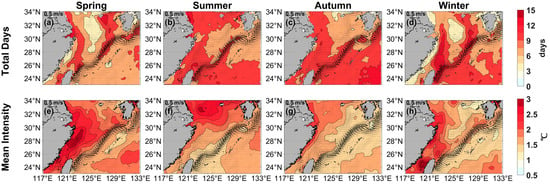
Figure 4.
Seasonal mean total days (top, days) and mean intensity (bottom, °C) for the marine heatwaves in (a,e) Spring, (b,f) Summer, (c,g) Autumn, and (d,h) Winter from 1982 to 2023, respectively. Black current vectors indicate the mean surface velocity (m/s) from 1993 to 2023.
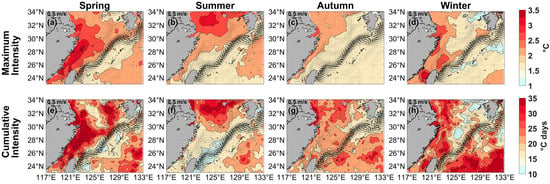
Figure 5.
Seasonal mean maximum intensity (top, °C) and cumulative intensity (bottom, °C days) for the marine heatwaves in (a,e) Spring, (b,f) Summer, (c,g) Autumn, and (d,h) Winter from 1982 to 2023, respectively. Black current vectors indicate the mean surface velocity (m/s) from 1993 to 2023.
In summer, there was a larger number of total days (more than 6 days) in the areas extending from the coastal waters of northern Jiangsu to Hangzhou Bay, the eastern and northeastern waters of Taiwan Island, and in Taiwan Strait (Figure 4b). The largest number of total days recorded in Hangzhou Bay was 19.76 days. Additionally, the summer mean intensity was strongest in the northern ECS, reaching a maximum of 3.05 °C, while decreasing outward toward the Ryukyu Islands (Figure 4f). Similarly, both maximum and cumulative intensity signaled a shift northward, with high-value areas concentrated on the northern Jiangsu coast and its adjacent marine zone; here, the strongest maximum intensity reached 3.45 °C, and the peak cumulative intensity was 78.06 °C days (Figure 5b,f).
In autumn, a large number of total days (more than 6 days) was observed along the meridional coastal waters from the northern Jiangsu coast to Taiwan Island, the Kuroshio path, and parts of the Pacific southeast of the Ryukyu Islands (Figure 4c). The maximum number of total days in autumn was 14.02 days, occurring in the southeastern waters off the Ryukyu Islands (Figure 4c). Mean intensity during this season peaked at 2.34 °C in the coastal waters of northern Jiangsu and Hangzhou Bay, decreasing toward the southeast; this pattern was similar to the distribution of mean intensity in summer (Figure 4g). Moreover, elevated values for both maximum (3.10 °C) and cumulative intensities (102.35 °C days) were observed near Hangzhou Bay as well (Figure 5c,g).
In winter, relatively large numbers of total days (more than 6 days) in relation to MHWs were also observed to the southeast of the Ryukyu Islands (Figure 4d). The strongest mean intensity areas were located from the Yangtze River Estuary to the Taiwan Strait, with a peak value of 3.16 °C (Figure 4h). A weaker mean intensity occurred in the southern waters of Jeju Island and parts of the Ryukyu Islands (Figure 4h). Additionally, the highest recorded maximum intensity occurred in the Taiwan Strait at 3.51 °C, while Hangzhou Bay registered a peak cumulative intensity of 51.33 °C days (Figure 5d,h).
Three additional figures in Appendix A illustrate the monthly variation in total days and mean intensity of MHWs in the ECS. It presented results for the periods of January to April (Figure A1), May to August (Figure A2), and September to December (Figure A3), respectively. The heatwaves in the ECS exhibited significant lunar variability. In different months, high-value areas for total days were concentrated in coastal waters and the Kuroshio path, with relatively high mean intensities observed near the coast. Notably, the maximum mean intensity along the Zhejiang and Fujian coast occurred each month during spring, which may have direct or indirect impacts on local marine crops.
3.3. EOF Analysis of Total Days and Intensity
To investigate the temporal and spatial variability of MHWs in the ECS from 1982 to 2023, an EOF analysis was applied. The first two leading EOF modes of the total days of MHWs accounted for 54.20% and 18.26% of the total variance, respectively (Figure 6). The spatial pattern of the first mode (EOF1) was generally a mono-sign over the entire ECS, with the highest positive values (up to 35.05 days) observed along the Ryukyu Islands (Figure 6a). Overall, the southeastern coastal region of China from Hangzhou Bay to Taiwan Island and the areas along the path of the Kuroshio and its offshoots experienced notable variations (positive values for more than 10 days), whereas the southwestern waters of Jeju Island showed minimal change (Figure 6a). This mode explained 54.20% of the total variance, with peak value of total days reaching 118.08 days in 1998 (Figure 6a,b).
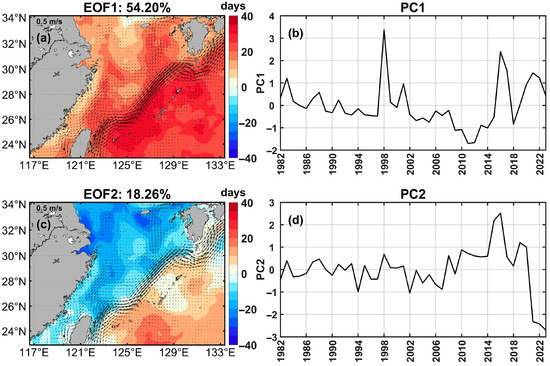
Figure 6.
Spatial patterns of the first two empirical orthogonal function (EOF) modes of the marine heatwave total days (days): (a) EOF1 and (c) EOF2. Black current vectors indicate the mean surface velocity (m/s) from 1993 to 2023. (b,d) Associated principal components (PCs) for EOF1 and EOF2.
In the second mode (EOF2), the change in total days in areas extending from the Yangtze River Estuary to the northern Jiangsu coast and Hangzhou Bay was greater than that in other sea areas in the ECS (Figure 6c). Additionally, a dipole pattern emerged. The total number of MHW days diminished in the ECS continental shelf area while increasing southeast of the Ryukyu Islands, with the Kuroshio serving as the boundary (Figure 6c). EOF2 mode explained 18.26% of the variance, with a peak of 88.27 days in 2023 (Figure 6c,d). Furthermore, the time series peaks for PC1 and PC2 occurred in 1998 (3.37) and 2016 (2.52), respectively, while troughs reached −1.71 in 2011 and −2.70 in 2023 (Figure 6b,d).
The first two EOF modes of cumulative intensity accounted for 48.21% and 22.59% of the total variance, respectively (Figure 7). The spatial pattern of EOF1 showed that the cumulative intensity of MHWs changed in unison across most of the ECS, with the highest positive values (up to 79.05 °C days) observed in Hangzhou Bay (Figure 7a). Additionally, the cumulative intensity in the southeast coastal area of China and the Kuroshio path had comparatively large variations (positive values of more than 22.5 °C days) (Figure 7a). This mode accounted for 48.21% of the variance, peaking at 253.22 °C days in 1998 (Figure 7a,b). In the second mode (EOF2), a dramatic change in cumulative intensity in the sea area was exhibited, extending from the northern Jiangsu coast to the Yangtze River Estuary. Additionally, the cumulative intensity in the area southwest of Jeju Island showed a relatively significant variation (Figure 7c). It also displayed a dipole pattern, where the cumulative intensity in the ECS continental shelf waters decreased, whereas it increased in areas of the Pacific southeast of the Ryukyu Islands, again divided by the Kuroshio (Figure 7c). This mode explained 22.59% of the variance, peaking at 318.36 °C days in 2022 (Figure 7c,d). Furthermore, peak values for PC1 and PC2 occurred in 1998 (3.20) and 2016 (2.72), respectively, while troughs reached −1.80 in 2011 and −2.52 in 2022 (Figure 7b,d).
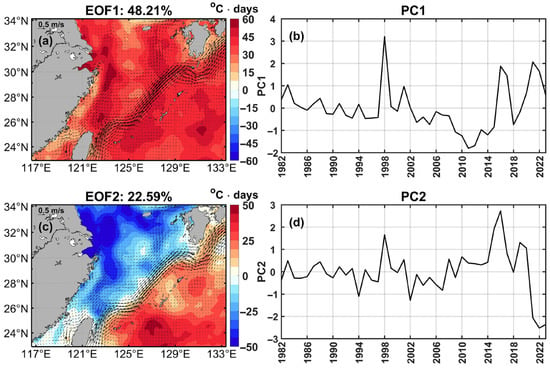
Figure 7.
Spatial patterns of the first two EOF modes of the marine heatwave cumulative intensity (°C days): (a) EOF1 and (c) EOF2. Black current vectors indicate the mean surface velocity (m/s) from 1993 to 2023. (b,d) Associated principal components (PCs) for EOF1 and EOF2.
EOF analysis showed that the first two modes in relation to total days and cumulative intensity exhibited similar characteristics. In the first mode, both indices changed in the same phase, with notable variations along the path of the Kuroshio and its offshoots and in Chinese coastal areas from the Yangtze River Estuary to Taiwan Island (Figure 6a and Figure 7a). The temporal oscillations in the first principal components for both indices exhibited notable similarities, with peaks in 1998 and 2016, and the lowest values in 2011 (Figure 6b and Figure 7b). In the second mode, the variations in both indices in the areas extending from the Yangtze River Estuary to the northern Jiangsu coast were significantly more pronounced than those observed in other regions within the ECS (Figure 6c and Figure 7c). Furthermore, there was a dipole pattern between the ECS continental shelf area and areas of the Pacific southeast of the Ryukyu Islands, with directly contrasting opposite variations (Figure 6c and Figure 7c). Moreover, both indices peaked in 2016 and showed negative values in more recent years (Figure 6d and Figure 7d). Notably, the corresponding second principal components showed an evident increasing trend in amplitude in recent years, implying that the dipole patterns of the MHWs were more evident (Figure 6d and Figure 7d).
Considering that the interannual variability of MHWs can be caused by changes in mean SST [23,42], in the Supplementary Materials, we conducted an EOF analysis on the annual average SST. The first mode also showed the characteristics of consistent changes in the ECS, particularly significant in the coastal areas of northern Jiangsu, Hangzhou Bay, and its outer waters. In the second mode, with the Kuroshio as the dividing line, the changes in SST in the ECS and the waters southeast of the Kuroshio were in opposite directions. This also appeared in the second mode of the EOF analysis of the total days and cumulative intensity. In addition, it is worth noting that the PC1 of the EOF analysis of SST had a high correlation with that of the total days and cumulative intensity, which were 0.80 and 0.82, respectively. The PC2 also had relatively high correlation coefficients, which were 0.66 and 0.68, respectively. These findings indicated that changes in mean sea surface temperature are the main contributing factors to the long-term changes and inter-annual variability of the total days of MHWs and cumulative intensity.
3.4. Long-Term Trend of MHWs in the ECS
Figure 8 shows the trend of MHWs in the ECS in terms of frequency (counts/decade), mean intensity (°C/decade), maximum intensity (°C/decade), cumulative intensity (°C days/decade), duration (days/decade), and total days (days/decade) between 1982 and 2023.
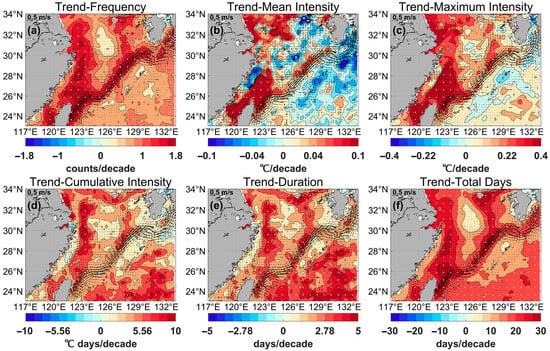
Figure 8.
(a) Trend in frequency (counts/decade), (b) mean intensity (°C/decade), (c) maximum intensity (°C/decade), (d) cumulative intensity (°C days/decade), (e) duration (days/decade), and (f) total days (days/decade) of marine heatwaves in the East China Sea from 1982 to 2023. White dots indicate statistical significance at the 95% confidence level. Black current vectors indicate the mean surface velocity (m/s) from 1993 to 2023.
The frequency, maximum intensity, and total days of MHWs initially appeared to show similar trends in the ECS between 1982 and 2023 (Figure 8a,c,f). Specifically, the Chinese coast from the Yangtze River Estuary to Taiwan Island and the areas along the Kuroshio path showed a noticeable increasing trend in terms of the frequency and total days of MHWs. The maximum trends of frequency and total days occurred northeast of Taiwan Island (2.55 counts/decade and 41.13 days/decade, respectively), while the trend of maximum intensity peaked at 0.88 °C/decade on the northern Jiangsu coast. The Kuroshio bifurcates west of the Tokara Strait and separates into two branches, where the northwestward current mainly contributes to the Tsushima Warm Current. It also exhibits a significant positive multidecadal trend along the Tsushima Warm Current. In contrast, the southwest waters of Jeju Island and the Pacific region located southeast of the Ryukyu Islands showed relatively limited trends in the frequency and total days of MHWs between 1982 and 2023.
Compared with the frequency, maximum intensity, and total days, the multidecadal trend in terms of mean intensity was relatively complex between 1982 and 2023 (Figure 8b). The spatial distribution of the mean intensity trend exhibited a “sandwich” pattern, which consisted of a distinctive positive trend along the Kuroshio path, a negative trend extending northeastward from the Zhejiang-Fujian coast to Kyushu Island, and a positive trend north of the Yangtze River Estuary. The trend of mean intensity was up to 0.27 °C/decade in the waters off the northern Jiangsu coast and the regions north of Taiwan Island between 1982 and 2023, while the negative trend east of the Zhejiang-Fujian coast was approximately −0.25 °C/decade.
The cumulative intensity and duration of the MHWs also exhibited a notably increasing trend along the Chinese coast and the Kuroshio path. However, there was a weak correlation between these positive trends and the Chinese coast south of the Yangtze River Estuary. The trends for cumulative intensity and duration were 36.13 °C days/decade and 9.38 days/decade, respectively (Figure 8d,e). Additionally, the apparent upward trend in frequency, mean intensity, maximum intensity, and total days in the sea area northeast of Taiwan Island may be related to sea surface warming caused by the weakening of upwelling [43].
3.5. Intensity Classification of MHWs
In this subsection, based on intensity, we divided the MHWs in the ECS between 1982 and 2023 into the following 4 types: moderate, strong, severe, and extreme. The analysis identified 267,090 MHW events, classified as 211,270 (79.10%) moderate; 53,247 (19.94%) strong; 2203 (0.82%) severe; and 367 (0.14%) extreme. Moderate and strong MHWs were more prevalent, characterized by higher frequency and a larger number of total days of occurrence (Figure 9a,b,e,f), whereas severe and extreme MHWs remained relatively infrequent (Figure 9c,d,g,h).
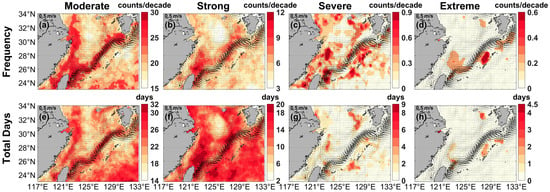
Figure 9.
Frequency (counts/decade, top panels) and total days (days, bottom panels) of marine heatwaves with four different intensities in the East China Sea: (a,e) moderate heatwaves, (b,f) strong heatwaves, (c,g) severe heatwaves, and (d,h) extreme heatwaves. Black current vectors indicate the mean surface velocity (m/s) from 1993 to 2023.
Moderate MHWs were particularly frequent in the coastal areas extending from the northern Yangtze River Estuary to the Taiwan Strait and along the Kuroshio path, with the highest frequency reaching 30.00 counts/decade (Figure 9a). The high-value region of moderate MHW total days was similar to that in relation to frequency, and the number of moderate MHW total days was also relatively large in the subtropical gyre in the North Pacific, with a maximum of 32.05 days annually (Figure 9e). Similarly, strong MHWs were concentrated on the Zhejiang-Fujian coast and along the Kuroshio and its offshoot paths. The highest frequency of strong MHWs was 12.14 counts/decade occurring in the northeastern waters of Taiwan Island, with a maximum of 23.90 days annually (Figure 9b,f).
Severe MHWs had relatively low frequencies in the southwestern waters of Jeju Island and southeast of the Ryukyu Islands, whereas higher frequencies and more MHW total days were recorded in southeastern Hangzhou Bay, northeastern Taiwan Island, and southeastern Jeju Island. The maximum frequency of severe MHWs was 2.14 counts/decade, with a peak of 15.83 days annually (Figure 9c,g).
Extreme MHWs occurred most frequently in the northeastern waters off Taiwan Island, southeastern areas of Jeju Island, and eastern areas of the Ryukyu Islands, with a maximum frequency of 1.19 counts/decade and peak total days of up to 10.55 days annually (Figure 9d,h).
3.6. Main Contributing Factors of MHWs
To further explore the main influencing factors of the heatwave in the ECS, net solar radiation and latent heat flux (Figure 10a,b) were studied to examine the heat budget of sea surface.
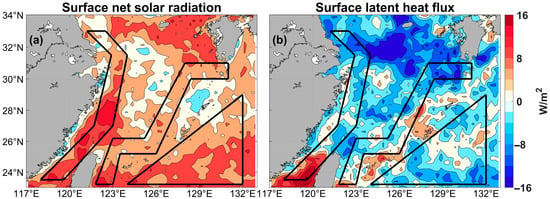
Figure 10.
Composites of anomalies (1982–2023). (a) surface net solar radiation (w/m2), (b) surface latent heat flux (w/m2). The primary research focus, indicated by the black line, encompasses the coastal waters, the Kuroshio path, and the Western Pacific.
The net solar radiation exhibited positive anomalies across most areas of the ECS, while latent heat flux showed negative anomalies in the majority of these regions. In the coastal waters extending from the Yangtze River estuary to the Taiwan Strait, net solar radiation displayed relatively high positive anomaly values, and latent heat flux was cumulatively positive. These conditions correspond well with the frequent occurrence, prolonged duration, and high intensity of heatwave events observed in these coastal waters (Figure 3 and Figure 10). Along the Kuroshio path, positive anomalies in net solar radiation were also present, and latent heat flux exhibited a relatively low level of negative anomaly, contributing to the frequent and long-lasting heatwaves in this region (Figure 3a,f and Figure 10). However, the relatively lower net solar radiation in this area resulted in a reduced intensity of heatwaves (Figure 3b,d and Figure 10b). Additionally, heatwave events observed in part of the Western Pacific were primarily due to the presence of strong positive anomalies in net solar radiation and less latent heat loss. Therefore, it is the combination of enhanced solar radiation and reduced latent heat loss (diminished evaporative cooling) that has triggered MHWs in the ECS. The characteristics of heatwaves and the associated influencing factors in the main study areas are summarized in Table 2.

Table 2.
The characteristics and influencing factors of heatwaves in main study areas. + indicates a relatively high level, + + indicates an even higher level, and blank indicates a relatively low level. The values represent the mean values within the respective research area.
4. Discussion and Conclusions
For the identification and analysis of heatwaves, some studies conduct detrending on the data to eliminate the signal of long-term climate warming [1,5], while others do not remove the trend [4,21], especially studies related to ecosystems and those in the context of the climate system [6,7,9]. Part of the reason is that marine organisms are directly affected by high-temperature anomalies in seawater, regardless of whether they are caused by climate warming or other factors. The data used in this study are non-detrended. Meanwhile, the detrended data have also been analyzed. The results were added to the Supplementary Materials.
This study examined the regional divergence in long-term trends of MHWs in the ECS from 1982 to 2023, which can directly or indirectly influence fishery resources in the ECS [14,41]. This study delved deeper into the interannual and seasonal characteristics and the main influencing factors of MHWs, specifically in the ECS. The following conclusions were drawn.
The spatial distribution of MHWs in the ECS showed distinct spatial heterogeneity. Chinese coastal waters, particularly from the Yangtze River Estuary to the Taiwan Strait, experienced a relatively high annual average frequency (more than 3.05 counts), the longest duration (20.89 days), the largest number of total days (53.21 days), and the strongest intensity of MHWs. Notably, after detrending, the intensity of MHWs in this sea area still remained at a relatively high level. Moreover, a high frequency (more than 2.7 counts), relatively long duration (more than 11.3 days), and a high number of total days (more than 26.25 days), but comparatively weak intensity, were also observed in the continental slope area through which the Kuroshio and its offshoots flowed. However, in the study of detrending, only parts of this area showed relatively high frequencies and maximum intensities of heatwaves. Notably, the sea areas northeast of Taiwan Island demonstrated the highest frequency (4.02 counts), significant maximum intensity levels (more than 4.38 °C), and a large number of total days (more than 37.5 days). This might be associated with the sea surface warming induced by the diminished upwelling [43]. Additionally, the sea areas southeast of the Ryukyu Islands in the Pacific exhibited significant levels of cumulative intensity (more than 18.5 °C days), prolonged duration (more than 11.3 days), and total days of MHWs (more than 28.5 days), which also appeared in the detrended analysis. Furthermore, the seasonal signals of the MHWs were predominantly concentrated in coastal waters, with a marked northward shift in intensity observed during the summer months; the same is true of detrended research.
MHWs in the ECS showed a distinct upward trend in frequency, maximum intensity, cumulative intensity, duration, and total number of days, in accordance with the findings of Li et al. [33]. The regions with the most significant increases in these indices were closely aligned with the areas with high annual average values for each metric. In contrast, after detrending, there is a trend of decreasing frequency, intensity, and total days of heatwaves along the Kuroshio path. Seasonal variations also played a critical role in the distribution of MHWs. Coastal waters experienced the highest number of total days and the strongest intensity across all seasons. Similarly, the path of the Kuroshio Current and its offshoots consistently exhibited extended total days. However, this feature is not significant after detrending. In the waters southeast of the Ryukyu Islands, the number of total days was notably greater during all seasons, except spring. Additionally, the spatial pattern of MHW intensity varied by season. In spring, intensity progressively weakened from the coast across the continental shelf toward the southeast. In summer, this weakening occurred from the northwest offshore waters toward the southeastern seas. These distribution characteristics also occurred in the detrended research. In the EOF analysis, EOF1 in terms of total days and cumulative intensity showed a general mono-sign pattern over the entire ECS and western North Pacific, with notable variations along the path of the Kuroshio and its offshoots, and in Chinese coastal waters from the Yangtze River Estuary to Taiwan Island. Additionally, areas extending from the Yangtze River Estuary to the northern Jiangsu coast exhibited significantly more pronounced variations than those observed in other regions within the ECS in EOF2. EOF2 also showed a dipole pattern between the continental shelf area and the western North Pacific bounded by Kuroshio. The Kuroshio Current can induce anomalous sea surface temperature in the Northwest Pacific Ocean, and its varying states can modulate the amount of heat transported into the ECS, thereby facilitating energy redistribution between the ECS and the Pacific Ocean [44,45,46,47]. The mechanisms driving MHWs on either side of the Kuroshio Current have certain differences, so the dipole structure identified in this study precisely reflects the role of the Kuroshio Current as a thermal barrier separating the two regions. Moreover, the peaks in the time series of the PCs might be associated with extreme ENSO events [21].
The EOF analysis of the annual mean sea surface temperature yielded results consistent with those for total days and cumulative intensity, and the PC time series exhibited high correlation coefficients. Furthermore, after detrending, the correlation between the PC1 of the EOF of the total days and cumulative intensity and that of SST remained at a relatively high level, with values of 0.60 and 0.78, respectively. The correlation coefficients for PC2 were also relatively high, at 0.51 and 0.78, respectively. Although these correlation coefficients decreased compared to those before detrending, they still exceeded the threshold for statistical significance at the 99% confidence level. Indicating that the increasing trend in heatwave events in the ECS was primarily driven by mean SST changes. This is in line with the main influencing factor of the upward trend of summer heatwaves in the eastern marginal seas of China [23].
In terms of intensity classification across the ECS, moderate (79.10%) and strong (19.94%) events were the most prevalent, mainly concentrated in the coastal waters of China and along the Kuroshio, while severe (0.82%) and extreme (0.14%) events occurred less frequently.
The temporal and spatial distribution characteristics of heatwaves in the ECS identified in this study are generally consistent with the findings of previous studies [21,23,33]. However, this study offered a more detailed characterization of the intra-regional variations in MHW distribution and included additional analyses based on detrended data.
In the analysis of composites of anomalies, it can be found that there is a significant positive anomaly in the surface net solar radiation in the coastal areas of ECS. This region absorbs a large amount of heat with less latent heat loss, which has a significant impact of intuition on the frequent, high-intensity and long-lasting heatwave events near the coast [21,23].
In summary, the coastal regions of China, particularly the northeastern waters off Taiwan Island and the continental slope area where the Kuroshio and its offshoots flowed, have exhibited distinct MHW characteristics during the past decades, which will offer crucial insights for the selection of marine crops and the development of strategies to respond to extreme events. Although this study has delivered an exhaustive examination of the spatiotemporal distribution patterns of MHWs in the ECS, it still falls short in elucidating the dynamic mechanisms that govern the diverse MHW events. In future studies, we intend to focus on quantitatively assessing the impact of the Kuroshio and investigating the three-dimensional structures of MHWs and the dynamic factors contributing to these events in the region, with the anticipation of extending our conclusions to similar western boundary systems. At the same time, further evaluations of the ecological effects of MHWs are necessary to better mitigate their negative impacts on marine ecosystems, particularly in areas of marine aquaculture.
Supplementary Materials
The following supporting information can be downloaded at: https://www.mdpi.com/article/10.3390/atmos16101150/s1, Figure S1: Spatial pattern of the mean MHW days (days). Black current vectors indicate the mean surface velocity (m/s) from 1993 to 2023. Figure S2: Spatial pattern of the mean MHW cumulative intensity (°C days). Black current vectors indicate the mean surface velocity (m/s) from 1993 to 2023. Figure S3: Spatial patterns of the first two EOF modes of annual mean sea surface temperature (°C): (a) EOF1 and (c) EOF2. Black current vectors indicate the mean surface velocity (m/s) from 1993 to 2023. (b,d) Associated principal components (PCs) for EOF1 and EOF2. Figure S4: Time series of sea surface temperatures at a location (26.125° N, 123.125° E) in the East China Sea using detrended data from (a) 1982 to 1995, (b) 1996 to 2009, and (c) 2010 to 2023, respectively. Red shaded areas denote the marine heatwave events, black lines indicate the daily time series, blue lines indicate the clima-tology, and green lines, the thresholds which are the 90th percentile values based on the baseline periods from 1982 to 2011. Figure S5: Annual average distribution of (a) frequency (counts), (b) mean intensity (°C), (c) maximum in-tensity (°C), (d) cumulative intensity (°C days), (e) duration (days), and (f) total days (days) of marine heatwaves in the East China Sea using detrended data from 1982 to 2023. Black current vectors indicate the mean surface velocity (m/s) from 1993 to 2023. Figure S6: Seasonal mean total days (top, days) and mean intensity (bottom, °C) for the marine heatwaves in (a,e) Spring, (b,f) Summer, (c,g) Autumn, and (d,h) Winter using detrended data from 1982 to 2023, respectively. Black current vectors indicate the mean surface velocity (m/s) from 1993 to 2023. Figure S7: Seasonal mean maximum intensity (top, °C) and cumulative intensity (bottom, °C days) for the marine heatwaves in (a,e) Spring, (b,f) Summer, (c,g) Autumn, and (d,h) Winter using detrended data from 1982 to 2023, respectively. Black current vectors indicate the mean surface velocity (m/s) from 1993 to 2023. Figure S8: Spatial patterns of the first two empirical orthogonal function (EOF) modes of the marine heatwave total days (days) using detrended data: (a) EOF1 and (c) EOF2. Black current vectors indicate the mean surface velocity (m/s) from 1993 to 2023. (b, d) Associated principal components (PCs) for EOF1 and EOF2. Figure S9: Spatial pattern of the mean MHW days (days) using detrended data. Black current vectors indicate the mean surface velocity (m/s) from 1993 to 2023. Figure S10: Spatial patterns of the first two EOF modes of the marine heatwave cumulative intensity (°C days) using detrended data: (a) EOF1 and (c) EOF2. Black current vectors indicate the mean surface velocity (m/s) from 1993 to 2023. (b,d) Associated principal components (PCs) for EOF1 and EOF2. Figure S11: Spatial pattern of the mean MHW cumulative intensity (°C days) using detrended data. Black current vectors indicate the mean surface velocity (m/s) from 1993 to 2023. Figure S12: Trend in frequency (counts/decade), (b) mean intensity (°C/decade), (c) maximum intensity (°C/decade), (d) cumulative intensity (°C days/decade), (e) duration (days/decade), and (f) total days (days/decade) of marine heatwaves in the East China Sea from 1982 to 2023 using detrended data. White dots in-dicate statistical significance at the 95% confidence level. Black current vectors indicate the mean surface velocity (m/s) from 1993 to 2023. Figure S13: Frequency (counts/decade, top panels) and total days (days, bottom panels) of marine heatwaves with four different intensities in the East China Sea using detrended data: (a,e) moderate heatwaves, (b,f) strong heatwaves, (c,g) severe heatwaves, and (d,h) extreme heatwaves. Black current vectors indicate the mean surface velocity (m/s) from 1993 to 2023.
Author Contributions
Conceptualization, Q.M. and Z.-J.L.; Methodology, W.Y.; Validation, Q.M.; Writing—Original Draft Preparation, Q.M., Z.-J.L. and W.Y.; Writing—Review & Editing, Z.-J.L., W.Y., M.-X.L. and J.-B.M.; Visualization, Q.M. and Z.-J.L.; Supervision, W.Y.; Project Administration, Z.-J.L. and W.Y.; Funding Acquisition, Z.-J.L. and W.Y. All authors have read and agreed to the published version of the manuscript.
Funding
This research was funded by the Scientific Research Fund of the Second Institute of Oceanography, MNR (Grant No. QNYC2402), the Zhejiang Provincial Natural Science Foundation of China (Grant No. LY24D060002), and the Science and Technology Project of Zhoushan (Grant No. 2023C41020).
Institutional Review Board Statement
Not applicable.
Informed Consent Statement
Not applicable.
Data Availability Statement
Data is contained within the article or Supplementary Material. The original contributions presented in this study are included in the article/Supplementary Material. Further inquiries can be directed to the corresponding author.
Acknowledgments
The authors would like to show gratitude to the NOAA for providing the OISST v2 dataset (https://psl.noaa.gov/data/gridded/data.noaa.oisst.v2.highres.html (accessed on 15 April 2024)). The authors would like to acknowledge the Copernicus Marine Environment Monitoring Service for providing the geostrophic current products (https://data.marine.copernicus.eu/product/SEALEVEL_GLO_PHY_L4_MY_008_047/download (accessed on 25 August 2024)).
Conflicts of Interest
The authors declare no conflicts of interest.
Abbreviations
The following abbreviations are used in this manuscript:
| MHWs | Marine heatwaves |
| ECS | East China Sea |
| SST | Sea surface temperature |
Appendix A

Figure A1.
Monthly mean total days (top, days) and mean intensity (bottom, °C) for the marine heatwaves in (a,e) January, (b,f) February, (c,g) March, and (d,h) April from 1982 to 2023, respectively. Black current vectors indicate the mean surface velocity (m/s) from 1993 to 2023.

Figure A2.
Monthly mean total days (top, days) and mean intensity (bottom, °C) for the marine heatwaves in (a,e) May, (b,f) June, (c,g) July, and (d,h) August from 1982 to 2023, respectively. Black current vectors indicate the mean surface velocity (m/s) from 1993 to 2023.
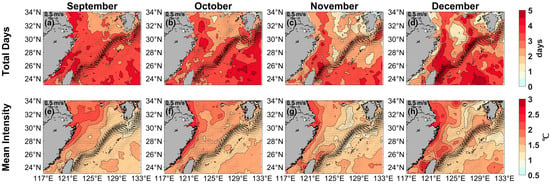
Figure A3.
Monthly mean total days (top, days) and mean intensity (bottom, °C) for the marine heatwaves in (a,e) September, (b,f) October, (c,g) November, and (d,h) December from 1982 to 2023, respectively. Black current vectors indicate the mean surface velocity (m/s) from 1993 to 2023.
References
- Chiswell, S.M. Global trends in marine heatwaves and cold spells: The impacts of fixed versus changing baselines. J. Geophys. Res. Ocean. 2022, 127, e2022JC018757. [Google Scholar] [CrossRef]
- Waliser, D.E. Formation and Limiting Mechanisms for Very High Sea Surface Temperature: Linking the Dynamics and the Thermodynamics. J. Clim. 1996, 9, 161–188. [Google Scholar] [CrossRef][Green Version]
- Qin, H.; Kawamura, H.; Kawai, Y. Detection of hot event in the equatorial Indo-Pacific warm pool using advanced satellite sea surface temperature, solar radiation, and wind speed. J. Geophys. Res. Ocean. 2007, 112, C07015. [Google Scholar] [CrossRef]
- Hobday, A.J.; Alexander, L.V.; Perkins, S.E.; Smale, D.A.; Straub, S.C.; Oliver, E.C.J.; Benthuysen, J.A.; Burrows, M.T.; Donat, M.G.; Feng, M.; et al. A hierarchical approach to defining marine heatwaves. Prog. Oceanogr. 2016, 141, 227–238. [Google Scholar] [CrossRef]
- Scannell, H.A.; Pershing, A.J.; Alexander, M.A.; Thomas, A.C.; Mills, K.E. Frequency of marine heatwaves in the North Atlantic and North Pacific since 1950. Geophys. Res. Lett. 2016, 5, 2069–2076. [Google Scholar] [CrossRef]
- Smale, D.A.; Wernberg, T.; Oliver, E.C.J.; Thomsen, M.; Harvey, B.P.; Straub, S.C.; Burrows, M.T.; Alexander, L.V.; Benthuysen, J.A.; Donat, M.G.; et al. Marine heatwaves threaten global biodiversity and the provision of ecosystem services. Nat. Clim. Change 2019, 9, 306–312. [Google Scholar] [CrossRef]
- Zhan, W.; Zhang, Y.; He, Q.; Zhan, H. Shifting responses of phytoplankton to atmospheric and oceanic forcing in a prolonged marine heatwave. Limnol. Oceanogr. 2023, 8, 1821–1834. [Google Scholar] [CrossRef]
- Howarth, N.; Scanes, E.; Byrne, M.; Ross, P.M. Ocean warming and Marine Heatwaves unequally impact juvenile introduced and native oysters with implications for their coexistence and future distribution. Sci. Rep. 2024, 1, 20688. [Google Scholar] [CrossRef]
- Frölicher, T.L.; Fischer, E.M.; Gruber, N. Marine heatwaves under global warming. Nature 2018, 560, 360–364. [Google Scholar] [CrossRef]
- Pearce, A.F.; Feng, M. The rise and fall of the “marine heat wave” off Western Australia during the summer of 2010/2011. J. Mar. Syst. 2013, 111–112, 139–156. [Google Scholar] [CrossRef]
- Olita, A.; Sorgente, R.; Natale, S.; Gaberšek, S.; Ribotti, A.; Bonanno, A.; Patti, B. Effects of the 2003 European heatwave on the Central Mediterranean Sea: Surface fluxes and the dynamical response. Ocean Sci. 2007, 8, 273–289. [Google Scholar] [CrossRef]
- Garrabou, J.; Coma, R.; Bensoussan, N.; Bally, M.; Chevaldonné, P.; Cigliano, M.; Diaz, D.; Harmelin, J.G.; Gambi, M.C.; Kersting, D.K.; et al. Mass mortality in Northwestern Mediterranean rocky benthic communities: Effects of the 2003 heat wave. Glob. Change Biol. 2009, 5, 1090–1103. [Google Scholar] [CrossRef]
- Galli, G.; Solidoro, C.; Lovato, T. Marine Heat Waves Hazard 3D Maps and the Risk for Low Motility Organisms in a Warming Mediterranean Sea. Front. Mar. Sci. 2017, 4, 136. [Google Scholar] [CrossRef]
- Ding, W.; Zhang, C.; Hu, J.; Shang, S. Unusual Fish Assemblages Associated with Environmental Changes in the East China Sea in February and March 2017. Remote Sens. 2021, 9, 1768. [Google Scholar] [CrossRef]
- Brown, K.T.; Lenz, E.A.; Glass, B.H.; Kruse, E.; McClintock, R.; Drury, C.; Nelson, C.E.; Putnam, H.M.; Barott, K.L. Divergent bleaching and recovery trajectories in reef-building corals following a decade of successive marine heatwaves. Proc. Natl. Acad. Sci. USA 2023, 52, e2312104120. [Google Scholar] [CrossRef]
- Cetina-Heredia, P.; Allende-Arandía, M.E. Caribbean Marine Heatwaves, Marine Cold Spells, and Co-Occurrence of Bleaching Events. J. Geophys. Res. Ocean. 2023, 128, e2023JC020147. [Google Scholar] [CrossRef]
- Roberts, S.D.; Van Ruth, P.D.; Wilkinson, C.; Bastianello, S.S.; Bansemer, M.S. Marine Heatwave, Harmful Algae Blooms and an Extensive Fish Kill Event During 2013 in South Australia. Front. Mar. Sci. 2019, 6, 610. [Google Scholar] [CrossRef]
- Frölicher, T.L.; Laufkötter, C. Emerging risks from marine heat waves. Nat. Commun. 2018, 1, 650. [Google Scholar] [CrossRef]
- Saranya, J.S.; Dasgupta, P.; Nam, S. Interaction Between Typhoon, Marine Heatwaves, and Internal Tides: Observational Insights from Ieodo Ocean Research Station in the Northern East China Sea. Geophys. Res. Lett. 2024, 51, e2024GL109497. [Google Scholar] [CrossRef]
- Yu, S.; Wang, Z.; Jiang, Z.; Li, T.; Ding, X.; Wei, X.; Liu, D. Marine Heatwave and Terrestrial Drought Reduced CO2 Uptake in the East China Sea in 2022. Remote Sens. 2024, 16, 849. [Google Scholar] [CrossRef]
- Yao, Y.; Wang, J.; Yin, J.; Zou, X. Marine heatwaves in China’s marginal seas and adjacent offshore waters: Past, present, and future. J. Geophys. Res. Ocean. 2020, 125, e2019JC015801. [Google Scholar] [CrossRef]
- Lee, S.; Park, M.S.; Kwon, M.; Park, Y.G.; Kim, Y.H.; Choi, N. Rapidly changing East Asian marine heatwaves under a warming Climate. J. Geophys. Res. Ocean. 2023, 128, e2023JC019761. [Google Scholar] [CrossRef]
- Xu, J.; Yan, Y.; Zhang, L.; Xing, W.; Meng, L.; Yu, Y.; Chen, C. Long-term trends and extreme events of marine heatwaves in the Eastern China Marginal Seas during summer. Front. Mar. Sci. 2024, 11, 1380963. [Google Scholar] [CrossRef]
- IPCC. Climate Change 2013: The Physical Science Basis. In Contribution of Working Group I to the Fifth Assessment Report of the Intergovernmental Panel on Climate Change; Stocker, T.F., Qin, D., Plattner, G.K., Tignor, M., Allen, S.K., Boschung, J., Nauels, A., Xia, Y., Bex, V., Midgley, P.M., et al., Eds.; Cambridge University Press: Cambridge, UK; New York, NY, USA, 2013. [Google Scholar] [CrossRef]
- IPCC. Climate Change 2021: The Physical Science Basis. In Contribution of Working Group I to the Sixth Assessment Report of the Intergovernmental Panel on Climate Change; Masson-Delmotte, V., Zhai, P., Pirani, A., Connors, S.L., Péan, C., Berger, S., Caud, N., Chen, Y., Goldfarb, L., Gomis, M.I., et al., Eds.; Cambridge University Press: Cambridge, UK; New York, NY, USA, 2021. [Google Scholar] [CrossRef]
- Holbrook, N.J.; Sen Gupta, A.; Oliver, E.C.J.; Hobday, A.J. Keeping pace with marine heatwaves. Nat. Rev. Earth Environ. 2020, 1, 482–493. [Google Scholar] [CrossRef]
- Oliver, E.C.J.; Donat, M.G.; Burrows, M.T.; Moore, P.J.; Smale, D.A.; Alexander, L.V.; Benthuysen, J.A.; Feng, M.; Gupta, A.S.; Hobday, A.J.; et al. Longer and more frequent marine heatwaves over the past century. Nat. Commun. 2018, 9, 1324. [Google Scholar] [CrossRef] [PubMed]
- Marin, M.; Feng, M.; Phillips, H.E.; Bindoff, N.L. A Global, Multiproduct Analysis of Coastal Marine Heatwaves: Distribution, Characteristics, and Long-Term Trends. J. Geophys. Res. Ocean. 2021, 26, e2020JC016708. [Google Scholar] [CrossRef]
- Yao, Y.; Wang, C.; Fu, Y. Global Marine Heatwaves and Cold-Spells in Present Climate to Future Projections. Earth’s Future 2022, 10, e2022EF002787. [Google Scholar] [CrossRef]
- Yao, Y.; Wang, C. Variations in Summer Marine Heatwaves in the South China Sea. J. Geophys. Res. Ocean. 2021, 126, e2021JC017792. [Google Scholar] [CrossRef]
- Gao, Z.; Jia, W.; Zhang, W.; Wang, P. Study on Seasonal Characteristics and Causes of Marine Heatwaves in the South China Sea over Nearly 30 Years. Atmosphere 2023, 12, 1822. [Google Scholar] [CrossRef]
- Tan, H.; Cai, R.; Wu, R. Summer marine heatwaves in the South China Sea: Trend, variability and possible causes. Adv. Clim. Change Res. 2022, 3, 323–332. [Google Scholar] [CrossRef]
- Li, Y.; Ren, G.; Wang, Q.; Mu, L. Changes in marine hot and cold extremes in the China Seas during 1982–2020. Weather. Clim. Extrem. 2023, 39, 100553. [Google Scholar] [CrossRef]
- Choi, W.; Bang, M.; Joh, Y.; Ham, Y.-G.; Kang, N.; Jang, C.J. Characteristics and mechanisms of marine heatwaves in the East Asian marginal seas: Regional and seasonal differences. Remote Sens. 2022, 14, 3522. [Google Scholar] [CrossRef]
- Reynolds, R.W.; Rayner, N.A.; Smith, T.M.; Stokes, D.C.; Wang, W.Q. An improved in situ and satellite SST analysis for climate. J. Clim. 2002, 15, 1609–1625. [Google Scholar] [CrossRef]
- Huang, B.; Liu, C.; Banzon, V.; Freeman, E.; Graham, G.; Hankins, B.; Smith, T.; Zhang, H.-M. Improvements of the Daily Optimum Interpolation Sea Surface Temperature (DOISST) Version 2.1. J. Clim. 2021, 8, 2923–2939. [Google Scholar] [CrossRef]
- Lyu, Y.; Xiao, F.; Lu, M.; Wang, D.; Wu, Q.; Wang, P.; Zeng, Y. Increased Frequency but Decreased Intensity of Marine Heatwaves Around Coral Reef Regions in the Southern South China Sea. J. Geophys. Res. Ocean. 2024, 9, e2024JC021235. [Google Scholar] [CrossRef]
- Ducet, N.; Traon, P.Y.L.; Reverdin, G. Global high-resolution mapping of ocean circulation from TOPEX/Poseidon and ERS-1 and -2. J. Geophys. Res. 2000, 105, 19477–19498. [Google Scholar] [CrossRef]
- Zhao, Z.; Marin, M. A MATLAB toolbox to detect and analyze marine heatwaves. J. Open Source Softw. 2019, 4, 1124. [Google Scholar] [CrossRef]
- Hobday, A.J.; Oliver, E.C.J.; Gupta, A.S.; Benthuysen, J.A.; Burrows, M.T.; Donat, M.G.; Holbrook, N.J.; Moore, P.J.; Thomsen, M.S.; Wernberg, T.; et al. Categorizing and naming marine heatwaves. Oceanography 2018, 31, 162–173. [Google Scholar] [CrossRef]
- Liu, Z.; Yang, L.; Yan, L.; Zhang, H.; Zhang, Y.; Xu, M.; Jin, Y.; Cheng, J. Alteration of alpha and beta diversity in nekton community by extreme marine heatwave events: An example from the East China Sea. Front. Mar. Sci. 2022, 9, 1036047. [Google Scholar] [CrossRef]
- Oliver, E.C. Mean warming not variability drives marine heatwave trends. Clim. Dyn. 2019, 53, 1653–1659. [Google Scholar] [CrossRef]
- Wei, Y.; Ding, R.; Huang, D.; Xuan, J.; Li, H.; Zhang, J.; Ma, X.; Zhou, F.; Chen, J. The Weakened Upwelling at the Upstream Kuroshio in the East China Sea Induced Extensive Sea Surface Warming. Geophys. Res. Lett. 2022, 50, e2022GL101835. [Google Scholar] [CrossRef]
- Hu, D.; Wu, L.; Cai, W.; Gupta, A.S.; Ganachaud, A.; Qiu, B.; Gordon, A.L.; Lin, X.; Chen, Z.; Hu, S.; et al. Pacific western boundary currents and their roles in climate. Nature 2015, 522, 299–308. [Google Scholar] [CrossRef]
- Kelly, K.A.; Small, R.J.; Samelson, R.M.; Qiu, B.; Joyce, T.M.; Kwon, Y.-O.; Cronin, M.F. Western boundary currents and frontal air-sea interaction: Gulf Stream and Kuroshio Extension. J. Clim. 2010, 23, 5644–5667. [Google Scholar] [CrossRef]
- Kwon, Y.-O.; Alexander, M.A.; Bond, N.A.; Frankignoul, C.; Nakamura, H.; Qiu, B.; Thompson, L.A. Role of the Gulf Stream and Kuroshio-Oyashio systems in large-scale atmosphere-Ocean interaction: A review. J. Clim. 2010, 23, 5206–5221. [Google Scholar] [CrossRef]
- Wang, Y.L.; Wu, C.R.; Chao, S.Y. Warming and weakening trends of the Kuroshio during 1993–2013. Geophys. Res. Lett. 2016, 43, 9200–9207. [Google Scholar] [CrossRef]
Disclaimer/Publisher’s Note: The statements, opinions and data contained in all publications are solely those of the individual author(s) and contributor(s) and not of MDPI and/or the editor(s). MDPI and/or the editor(s) disclaim responsibility for any injury to people or property resulting from any ideas, methods, instructions or products referred to in the content. |
© 2025 by the authors. Licensee MDPI, Basel, Switzerland. This article is an open access article distributed under the terms and conditions of the Creative Commons Attribution (CC BY) license (https://creativecommons.org/licenses/by/4.0/).