Article

The Evaluation of ERA5’s Applicability in Nearshore Western Atlantic Regions During Hurricanes—“ISAIAS” 2020

1
Marine Science and Technology College, Zhejiang Ocean University, Zhoushan 316022, China
2
Key Laboratory of Water Ecology Remediation and Protection at Headwater Regions of Big Rivers, Ministry of Water Resources, Xining 810016, China
3
School of Civil Engineering and Water Resources, Qinghai University, Xining 810016, China
4
Marine Science College, Sun Yat-sen University, Zhuhai 519000, China
5
School of Marine Science and Technology, Hainan Tropical Ocean University, Sanya 572022, China
*
Authors to whom correspondence should be addressed.
Atmosphere 2025, 16(8), 967; https://doi.org/10.3390/atmos16080967
Submission received: 5 July 2025 / Revised: 7 August 2025 / Accepted: 12 August 2025 / Published: 15 August 2025

Abstract

Hurricanes cause significant destruction, disrupting transportation, and resulting in loss of life and property. High-precision marine meteorological data are essential for understanding hurricanes. ERA5 provides high temporal resolution and global coverage of analytical data; however, the accuracy of the data during hurricanes is uncertain. To investigate the applicability of ERA5 during hurricanes, this study used buoy data as reference values and assessed the applicability of ERA5 sea-surface wind speed (WS), sea-surface temperature (SST), and sea-surface pressure (SSP) during the 2020 Atlantic hurricane “ISAIAS” through spatial distribution and error analysis. The results indicate that there is a positive correlation and consistency between the trends of ERA5 and reference values. The average correlation coefficients for SSP, WS, and SST are 0.953, 0.822, and 0.607, respectively. Nearshore topography has a significant impact on data accuracy, resulting in greater errors compared to open-water areas. This study provides a theoretical basis for the application of ERA5 data during hurricanes.

1. Introduction

Hurricanes primarily form over the surfaces of tropical or subtropical oceans and are highly destructive natural disasters. The strong winds, storm surges, and heavy rainfall they generate pose a severe threat to coastal regions, particularly nearshore areas [1,2,3]. The western Atlantic Ocean is a high-risk area for hurricane activity [4]. Its nearshore regions are densely populated and economically active, making precise monitoring and forecasting of hurricane paths, intensity, and associated marine meteorological elements (such as wind fields, waves, and sea-surface temperature) critically important [5]. With global warming, the intensity of hurricanes at landfall has increased, leading to disasters such as heavy rainfall, flooding, and landslides, threatening the safety of people and property [6,7]. High-precision and wide-range oceanic meteorological data are crucial for reflecting hurricane intensity, paths, and impact reports in hurricanes [8,9]. Buoys provide high-precision single-point real-time data; however, their limited spatial coverage makes it challenging to capture the spatial and temporal characteristics of hurricane advancement, such as the wind-speed gradient. Reanalysis data offer wide coverage and continuity, focusing on the limitations of buoy data. Consequently, they have become the primary source for analyzing hurricanes and other extreme weather events [10,11]. Atmospheric reanalysis data assimilate a large amount of satellite data and conventional observations from the ground and upper atmosphere, offering advantages such as long time series and high resolution. They are used for weather and climate analysis and can serve as driving fields for climate models [4,12,13]. Since the 1990s, the United States, Europe, and Japan have successively launched reanalysis products; U.S. reanalysis products include NCEP/NCAR as well as the recently developed CFSR and CFSV2. The Japan Meteorological Agency (JMA) and the Central Research Institute of Electric Power Industry (CRIEPI) jointly completed JRA25 and its next-generation product JRA55. The European Centre for Medium-Range Weather Forecasts (ECMWF) was one of the earliest institutions to conduct data reanalysis research, with its reanalysis data having undergone four generations: FGGE, ERA-15, ERA-40, and ERA-Interim [14]. The fifth-generation reanalysis product (ERA5) from the European Centre for Medium-Range Weather Forecasts features a spatial resolution of 0.25° × 0.25°, encompassing a 9-fold enhancement compared to its predecessor, ERA-Interim, which had a resolution of 0.75° × 0.75°. The temporal resolution has been improved by a factor of six. This improvement allows for a more detailed grid of hurricane-affected regions [15,16]. ERA5 relies on numerical prediction models and the assimilation of observations from various sources, which may result in errors in its values, particularly due to inversion bias of satellite microwave remote sensing in regions with heavy precipitation. This is particularly important in extreme weather conditions like hurricane eyewalls and nearshore land–ocean transition zones, which require verification of ERA5’s applicability and reliability [17,18]. In recent years, numerous scholars have conducted extensive research on the applicability of reanalysis data at global and regional scales. Monney [19] compared ERA-40, ERA-Interim, and NCEP/NCAR reanalysis data with observational data and found that ERA-Interim provided a better description of winter temperatures than ERA-40 and NCEP/NCAR. Decker [20] evaluated reanalysis data from GSFC, NCEP, and ECMWF, among others, and the results showed that ERA-Interim’s near-surface temperature, wind-speed, and precipitation data had higher correlations with observational data than NCEP/DOE and CFSR. Wang [21] compared ERA5 and ERA-Interim precipitation data using buoy precipitation observations of Arctic sea ice from 2010 to 2016, finding that ERA5 performs better in the Arctic. Tarek [22] used ERA5 precipitation as input for a hydrological model and found that it had the same accuracy as observed values. Compared to ERA-Interim, ERA5 precipitation data effectively reduced bias and enabled more accurate hydrological simulations in most of North America. Lv [23] used ECMWF wind field data to study the characteristics of wind and wave conditions in the Bohai Sea. This study indicated that ECMWF wind field data underestimated wind speeds over the Bohai Sea, but the overall trends and wind directions were consistent with observational data.
This study evaluates the accuracy of sea-surface wind speed, sea-surface pressure, and sea-surface temperature for ERA5 by analyzing spatial distribution characteristics and conducting error analysis. Nine buoy station observations during the transit of hurricane “ISAIAS” No. 9 in the Atlantic Ocean in 2020 provide reference values. This study aims to verify the applicability and reliability of ERA5 during hurricanes. It provides data support for hurricane forecasting and post-storm reporting. In addition, it provides a scientific basis for strengthening regional meteorological models and ensuring the safety of lives, property, and the ecological environment in coastal areas.

2. Materials and Methods

2.1. Study Area

This study examines the western Atlantic Ocean, specifically the area between 85° W–55° W and 10° N–40° N, as illustrated in Figure 1. Figure 1 displays the study area, with the dashed box outlining its boundaries. The yellow color denotes land, while blue signifies the ocean, which includes the majority of the Caribbean Sea, a portion of the Gulf of Mexico, and approaches the east coast of the United States near the Bahamas. It is a region where hurricanes are frequently generated and active and located in the tropical–subtropical transition zone and significantly influenced by the Gulf Stream, with surface-water temperatures in the summer ranging from 28 to 30 °C [24,25]. These temperatures produce the necessary thermal conditions for tropical cyclone formation, and a crucial threshold for hurricane development is an SST of more than 26.5 °C [26]. Differences in topography between the western shelf zone (water depth < 200 m) and the eastern deep-water zone (water depth > 3000 m) result in notable variations in the propagation characteristics of hurricane-induced storm surges [27,28]. The semi-enclosed topography of the Caribbean Sea and the Gulf of Mexico leads to slower hurricane movement, extending the impact of strong winds and heavy rainfall [29]. The National Hurricane Center (NHC) reports that the Atlantic Ocean averaged 19.4 named storms annually from 2015 to 2024. In 2020, there were 31 named storms, 12 of which affected the area. This statistic highlights the significance of analyzing the applicability of ERA5 data, which effectively represent the accurate monitoring of hurricanes.

2.2. Data

2.2.1. Buoy Data

Buoy stations monitor WS, SST, and SSP elements in real time and serve as a reference for evaluating the accuracy of ERA5 due to their high precision and performance. The buoy data were sourced from the National Data Buoy Center (NDBC). Nine buoys in the nearshore region of the western Atlantic Ocean were selected during the “ISAIAS” event: 41004, 41008, 41010, 41029, 42059, 42060, MISP4, SPGF1, and VAKF1. Their spatial distribution is illustrated in Figure 2. Figure 2 displays the station locations marked by green dots, while the adjacent figure highlights the SPGF1 station’s location. Table 1 provides the specific coordinate information for each station. This study examines the impact of nearshore topography on ERA5 accuracy, focusing on the nearest land station, SPGF1, situated on the west side of Grand Bahama Island, 13.1 km from Freeport. This study focuses on the transit period of “ISAIAS” from 29 July 2020 to 5 August 2020. The data encompass wind speed, sea-surface pressure, and sea-surface temperature, with details provided in Table 2.

2.2.2. ERA5 Data

The ERA5 reanalysis data were sourced from the European Centre for Medium-Range Weather Forecasts (ECMWF), with a spatial resolution of 0.25° × 0.25° and a temporal resolution of 1 hour. This dataset is developed by integrating data from various sources, including satellite remote sensing, airborne observations, ground-based meteorological stations, and ocean buoys [30]. The study period covers the time before, during, and after the transit of “ISAIAS” (15 July 2020 to 15 August 2020). The ERA5 data include WS, SSP, and SST, with detailed information provided in Table 2.
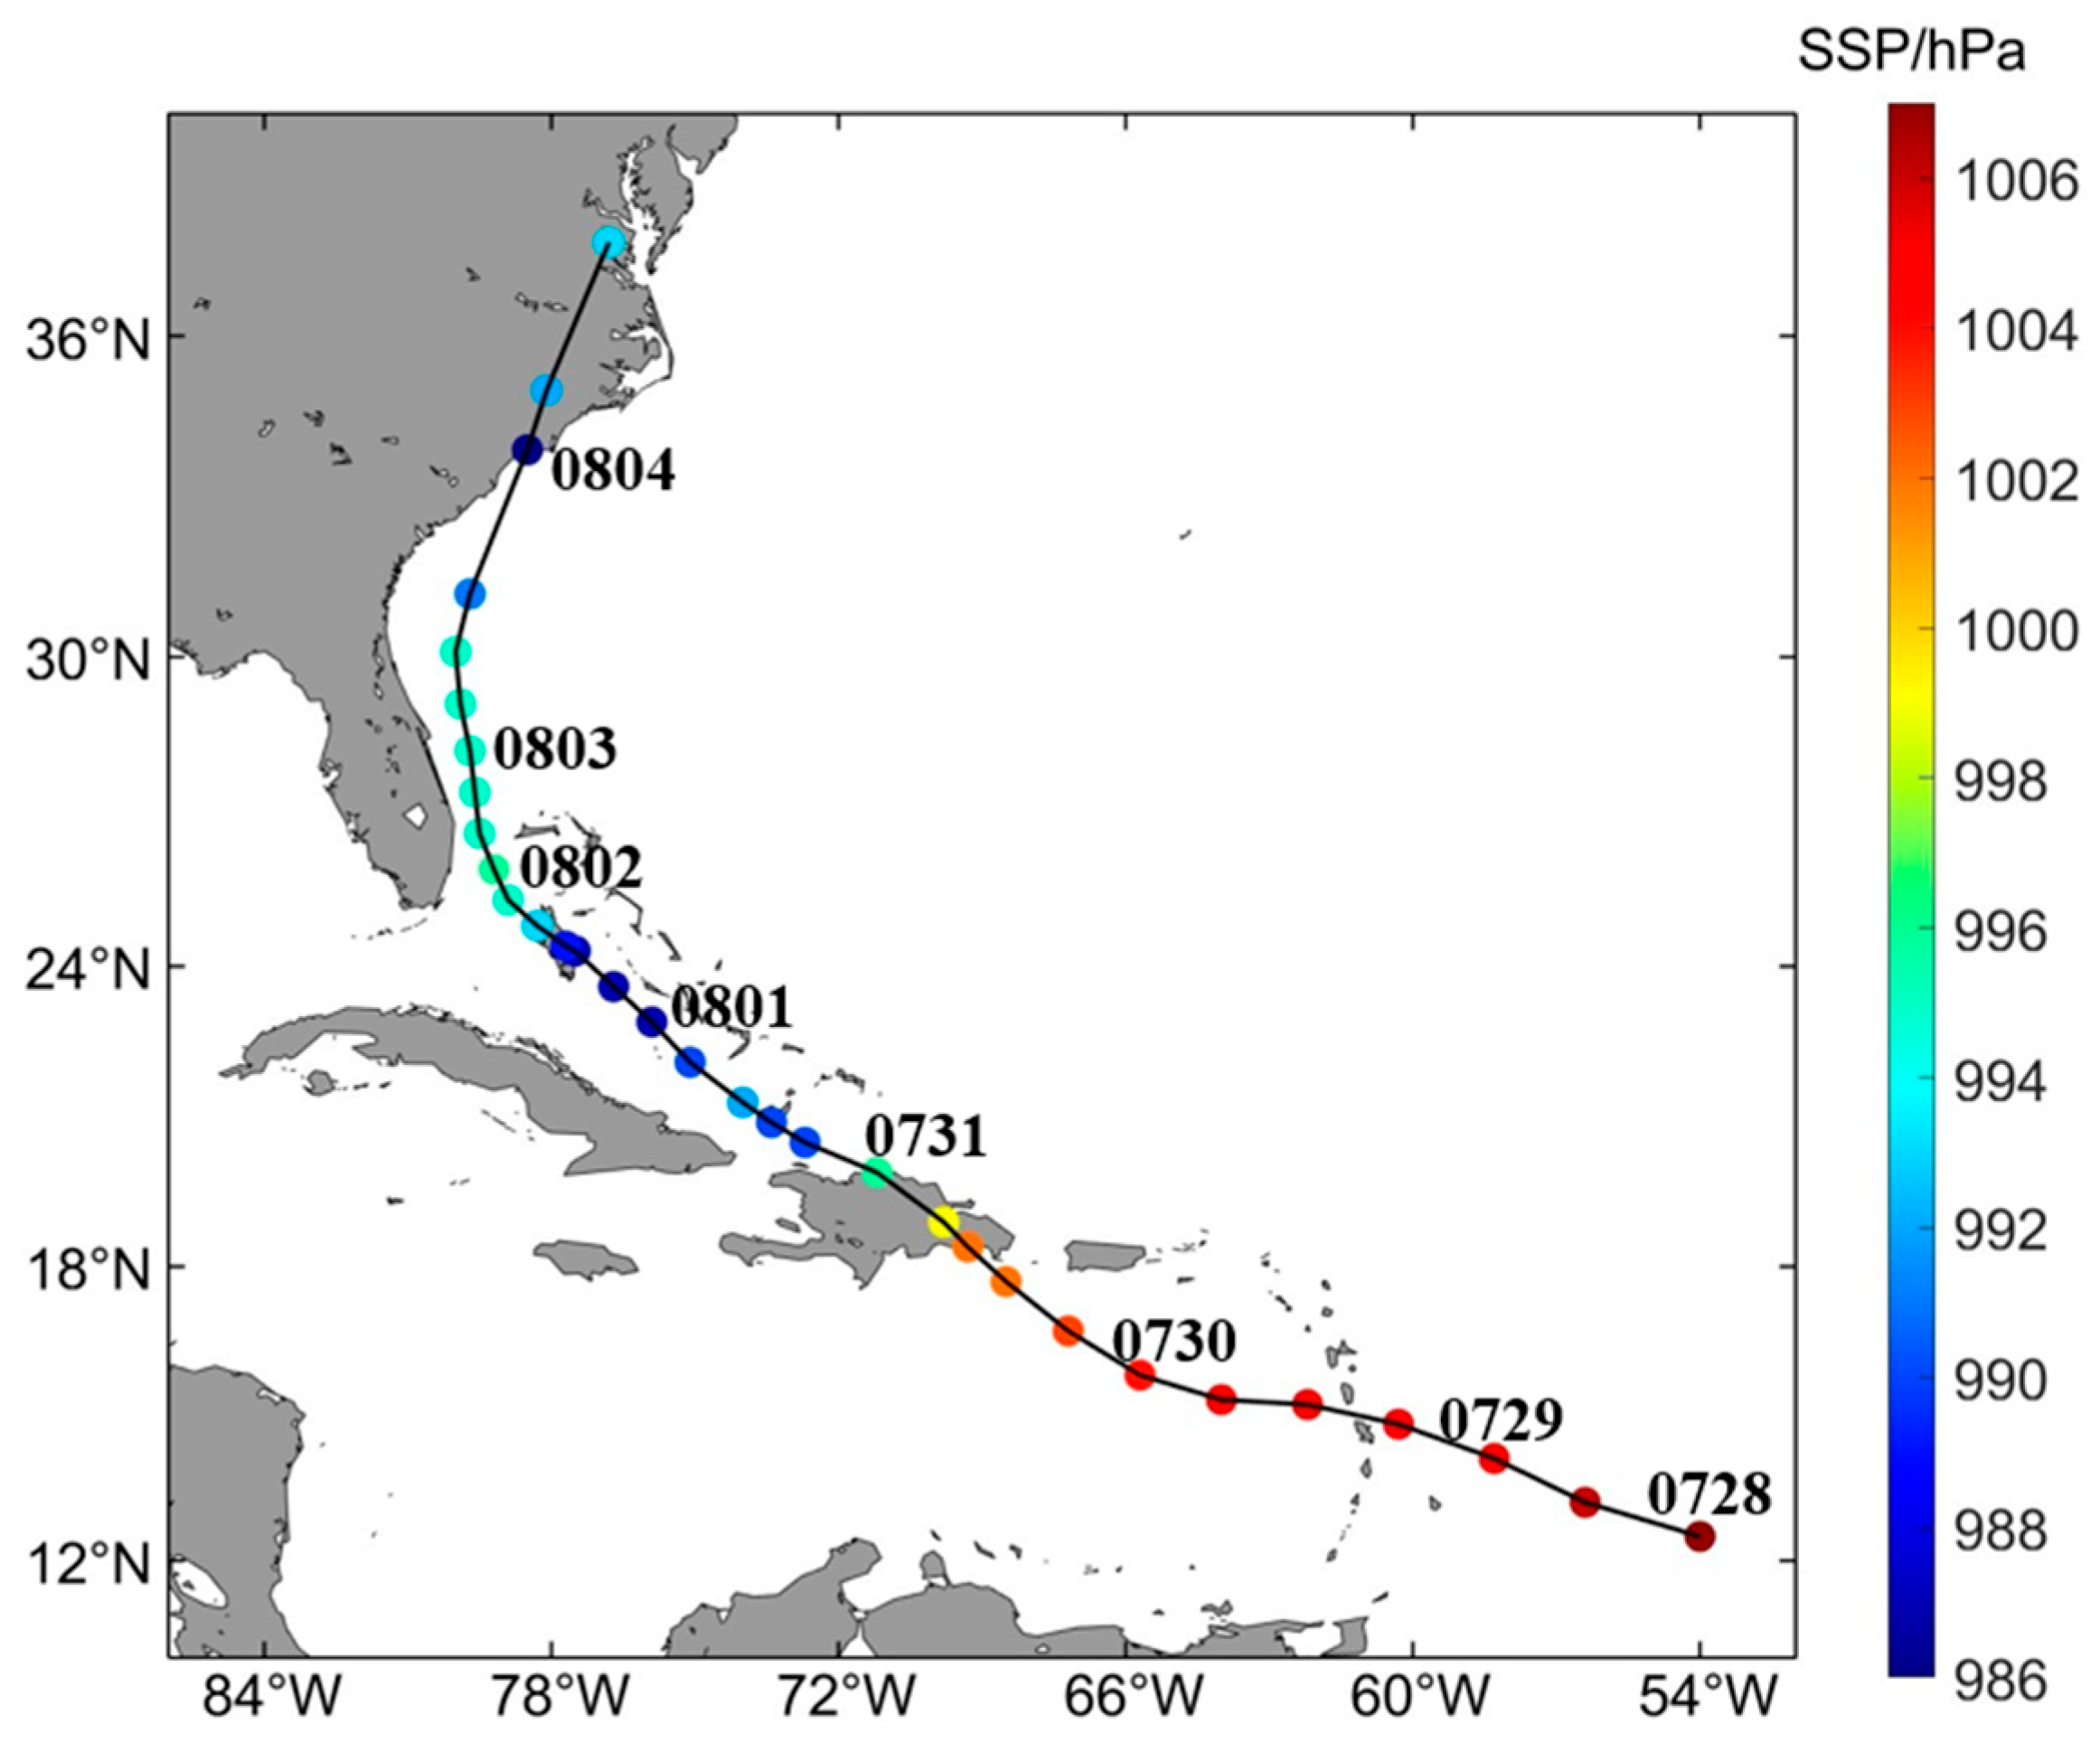
Hurricane “ISAIAS” was the ninth hurricane of 2020, originating as a strong tropical wave near the coast of Africa on 24 July. It advanced westward, influenced by a subtropical high-pressure ridge, and developed into a tropical storm in the Lesser Antilles on 29 July. The tropical storm progressed west–northwest, first making landfall in San Pedro de Macris, located in the southeastern Dominican Republic, on 31 July. It subsequently made a second landfall in the Bahamas before weakening to a tropical storm on 1 August. The tropical storm made its third landfall in Andros Island, subsequently moving north–northwest across the warm waters of the Gulf Stream and making a fourth landfall in North Carolina on 4 August, with maximum sustained winds of 80 knots (41.16 m/s). It then moved rapidly north–northeast through Virginia, Maryland, Delaware, Pennsylvania, New Jersey, New York, and Vermont before transitioning into a temperate depression in southeastern Canada on 5 August, ultimately dissipating over Quebec. It’s movement path is shown in Figure 3.The trajectory of “ISAIAS” passed through the western Atlantic nearshore, featuring four landfalls and notable variations in intensity (ranging from a tropical storm to a Category 2 hurricane), leading to considerable economic damage in the affected region, several fatalities, and over 3 million homes experiencing power outages [31,32].

2.3. Methodology

In this study, the accuracy of the WS, SSP, and SST of ERA5 during “ISAIAS” was evaluated by using the correlation coefficient (CC), root mean square error (RMSE), and mean deviation (MD) as the reference buoy data. CC is the degree of linear correlation between the study variables, which is used to characterize the consistency between ERA5 and the reference values in terms of trends. The judgment criteria include very strong correlation (CC ≥ 0.9), strong correlation (0.7 ≤ CC < 0.9), moderate correlation (0.5 ≤ CC < 0.7), and weak correlation (CC < 0.5) [33]. Its calculation formula is shown in Equation (1):
Correlation   Coefficient ( CC ) = i = 1 n η E R A 5 η ¯ E R A 5 η obs η ¯ obs i = 1 n ( η E R A 5 η ¯ E R A 5 ) 2 i = 1 n ( η obs η ¯ obs ) 2 .
In Equation (1), η E R A 5 and η obs are ERA5 and buoy values, η ¯ E R A 5 and η ¯ obs is the average of ERA5 and buoy values, and “n” is the total.
The RMSE quantifies the deviation between predicted and true values, specifically measuring the difference between ERA5 and observed values. A larger RMSE indicates lower accuracy and greater error in the ERA5 data. The acceptable range thresholds for the RMSE for the WS, SST, and SSP were 1.5–2.0 m/s, 0.5–1.0 °C, and 0.5–1.0 hPa [34]. Equation (2) presents the formula.
Root   Mean   Square   Error ( R M S E ) = 1 n i = 1 n ( η E R A 5 η obs ) 2 .
In Equation (2), η E R A 5 and η obs are ERA5 and buoy values, and “n” is the total.
MD represents the mean error, calculated as the difference between the original data value and the true value. It indicates the overall error of ERA5, highlighting whether there is an overestimation or underestimation. When the MD is greater than 0, ERA5 exceeds the reference value; when it is less than 0, ERA5 falls below the reference value. An MD of 0 signifies that ERA5 is accurate. The acceptable range threshold for MD is −1.0–1.0 [35]. The positive and negative values of MD, along with the size of ERA5 accuracy, can be utilized to validate the accuracy of ERA5 [35,36,37]. The calculation formula is presented in Equation (3):
Mean   Deviation M D = 1 n i = 1 n η E R A 5 η obs .
In Equation (3), η E R A 5 and η obs are ERA5 and buoy values, and “n” is the total.
A comprehensive assessment of the applicability of ERA5 in hurricane monitoring is made through the above indicators, combined with a visual analysis of the spatial distribution.

3. Results

3.1. Accuracy Assessment of WS During “ISAIAS”

3.1.1. Spatial Distribution of WS

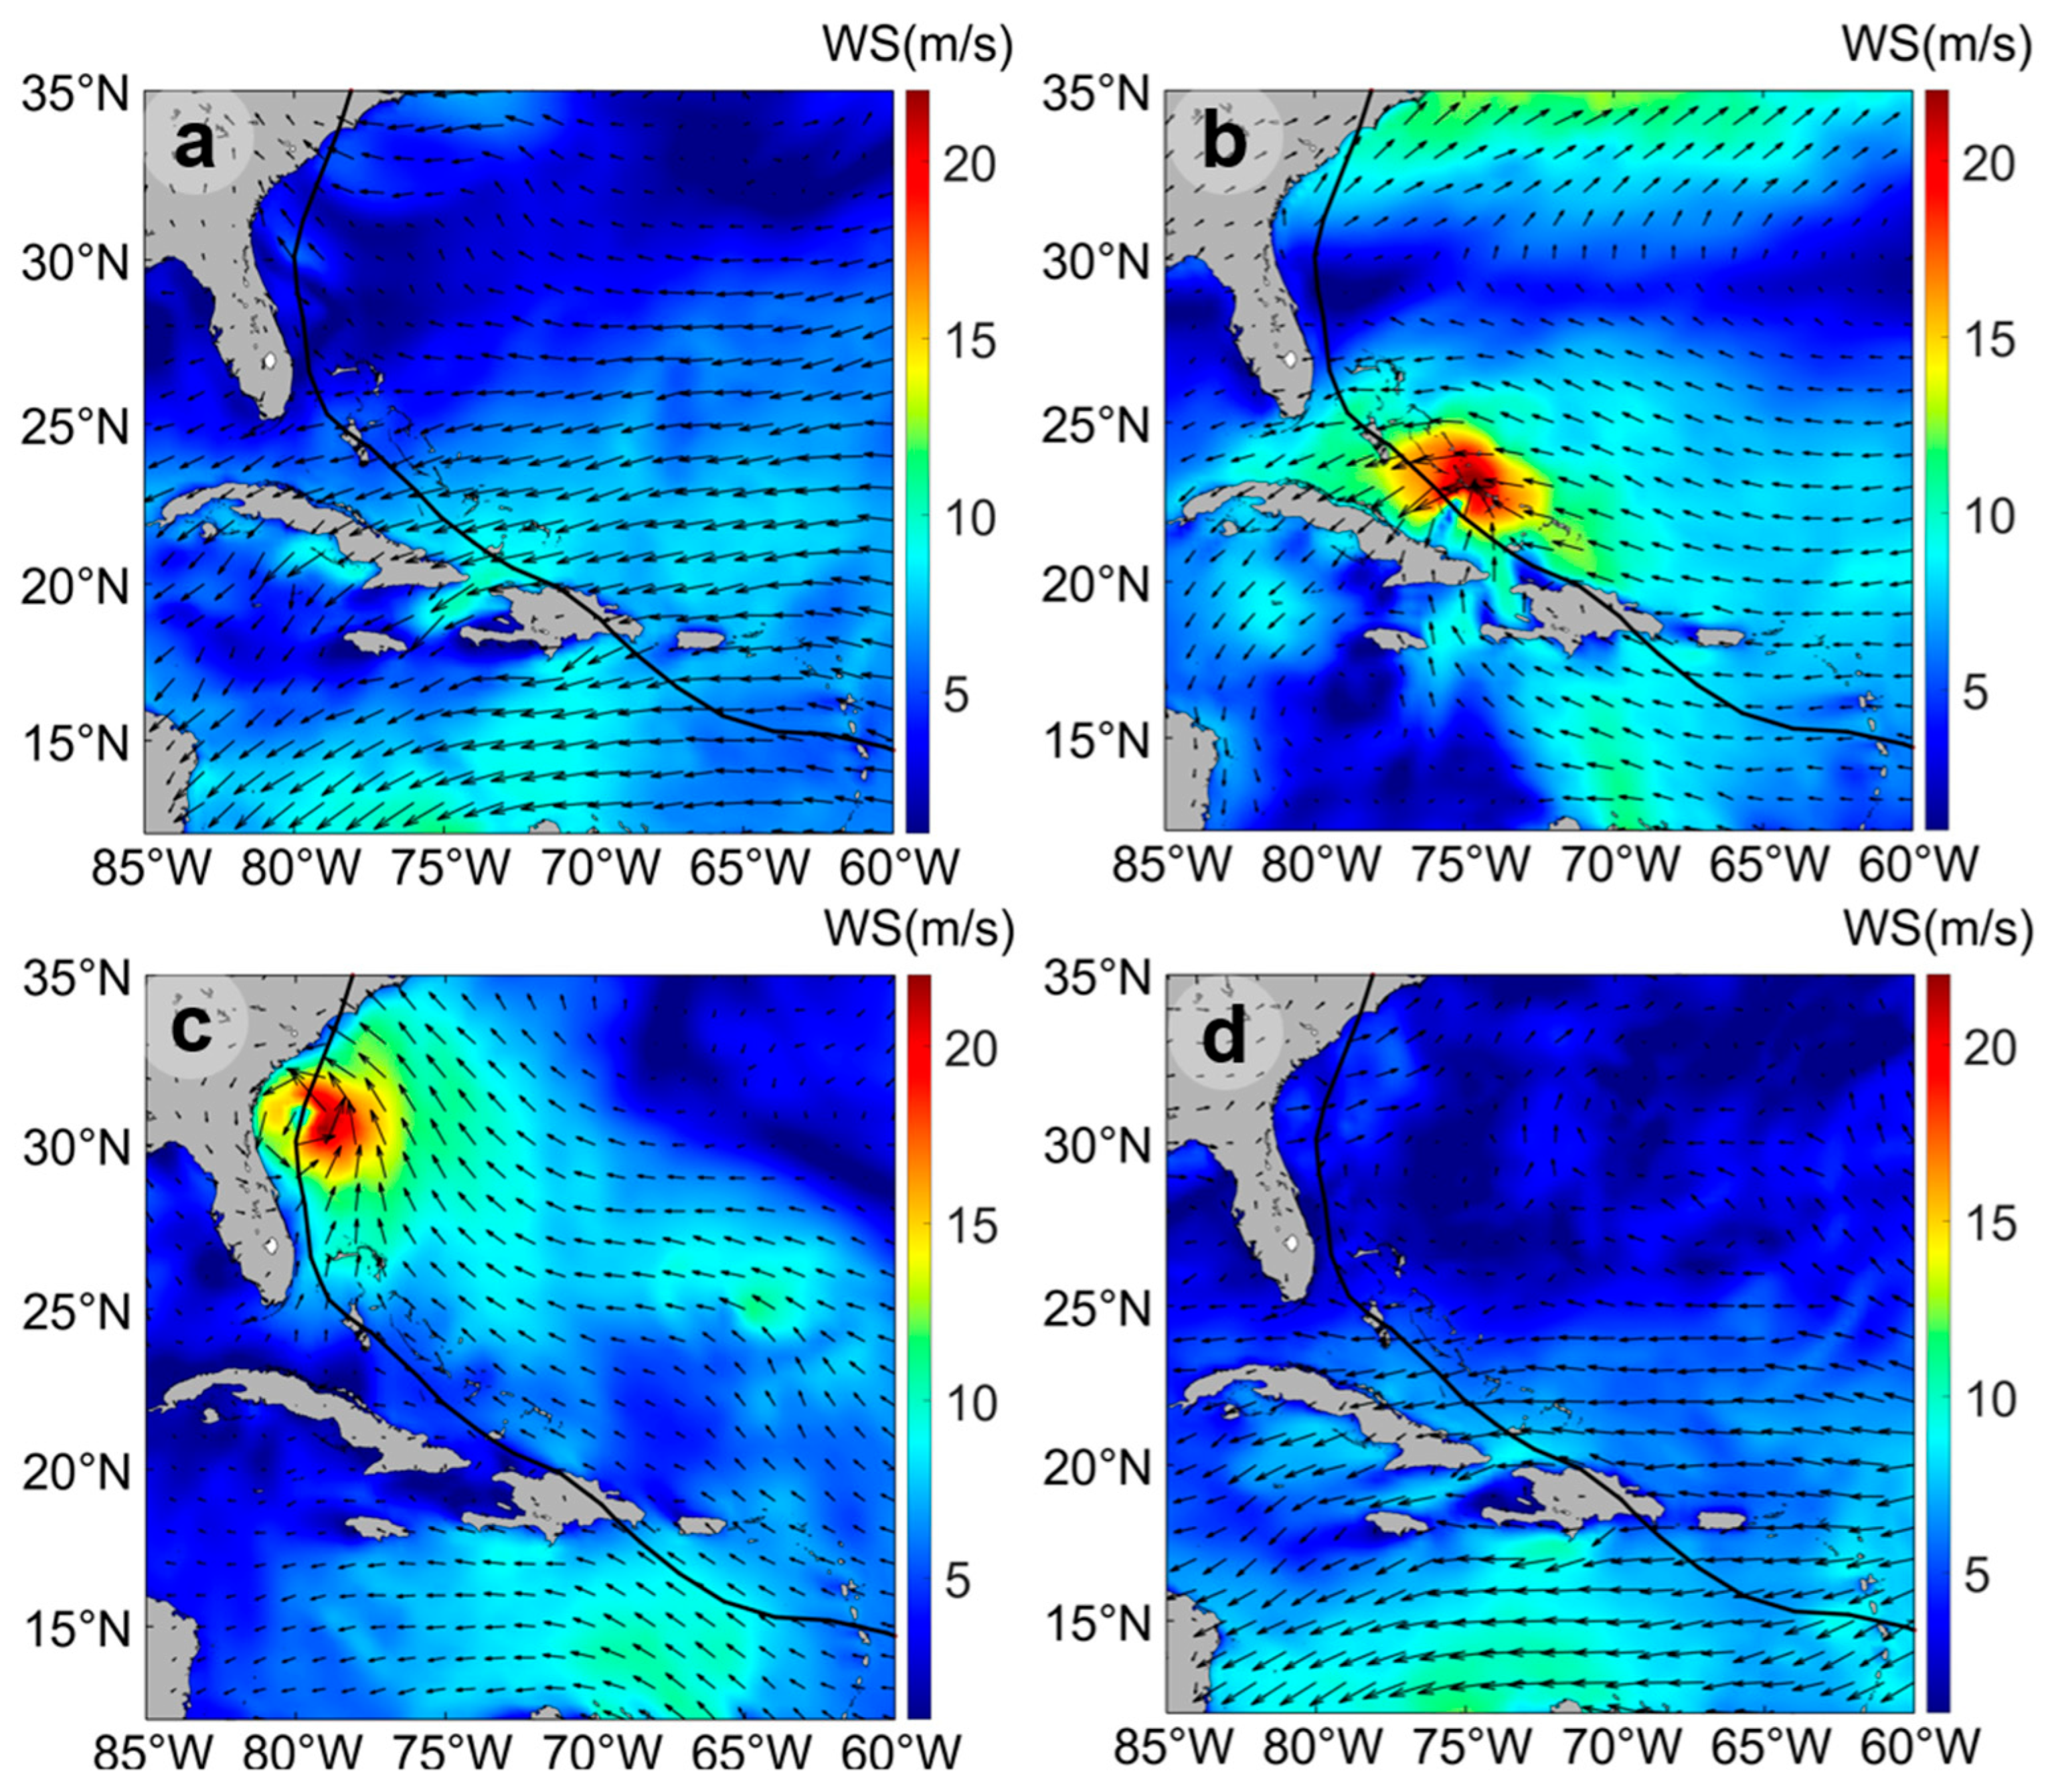
The analysis of the spatial distribution of WS is conducted before (15 July), during (31 July and 3 August), and after (15 August) “ISAIAS” using ERA5 data, as illustrated in Figure 4. Figure 4a–d illustrate the wind-speed direction with vectors, while the solid line denotes the actual path of “ISAIAS”. The color gradient from blue to red indicates the increase in wind speed, ranging from 0 to 22 m/s.
Prior to the hurricane’s arrival on 15 July (Figure 4a), the stable subtropical high pressure resulted in a lower-wind-speed area (0–6 m/s), with dispersed wind directions and no notable gradient changes. The atmospheric environment exhibits stability, consistent with the characteristics of typical summer trade winds. On 31 July (Figure 4b), a hurricane developed in the southeastern Bahamas (75° W, 22.5° N), creating a significant area of high wind speeds. This area exhibits a circulation structure centered around the hurricane’s eye, which aligns with the actual path of “ISAIAS”. The maximum wind speed exceeded 22 m/s, with vector arrows indicating a counterclockwise direction. The atmospheric environment remained stable, reflecting typical summer wind characteristics. The vector arrows indicate a counterclockwise convergence, forming a spiral shape around the center, where wind speed increases from the inside to the outside. The center features low wind speed, while the surrounding wall of clouds represents the high-wind-speed area encircling the eye of the hurricane, illustrating a typical hurricane structure. On August 3 (Figure 4c), as the hurricane progressed northward, the center of the high-wind-speed zone shifted offshore east of Florida (78.5° W, 27.5° N). The wind speed in this zone increased to 14–21 m/s, while the wind speed within the eye area was measured at 6 m/s, closely encircled by a ring-like high-wind-speed zone. This observation aligns well with the actual path of hurricanes reported by the NHC. Following the hurricane’s dissipation on 15 August (Figure 4d), the area of high wind speeds vanished. Offshore waters of North Carolina experienced slightly elevated wind speeds of 8–11 m/s, while other regions reverted to a consistent low-wind-speed state of less than 8 m/s, resulting in a calmer wind field. The WS of ERA5 effectively captures the significant changes in the wind field induced by hurricanes and the core structural features on a spatial scale.

3.1.2. WS Error Analysis

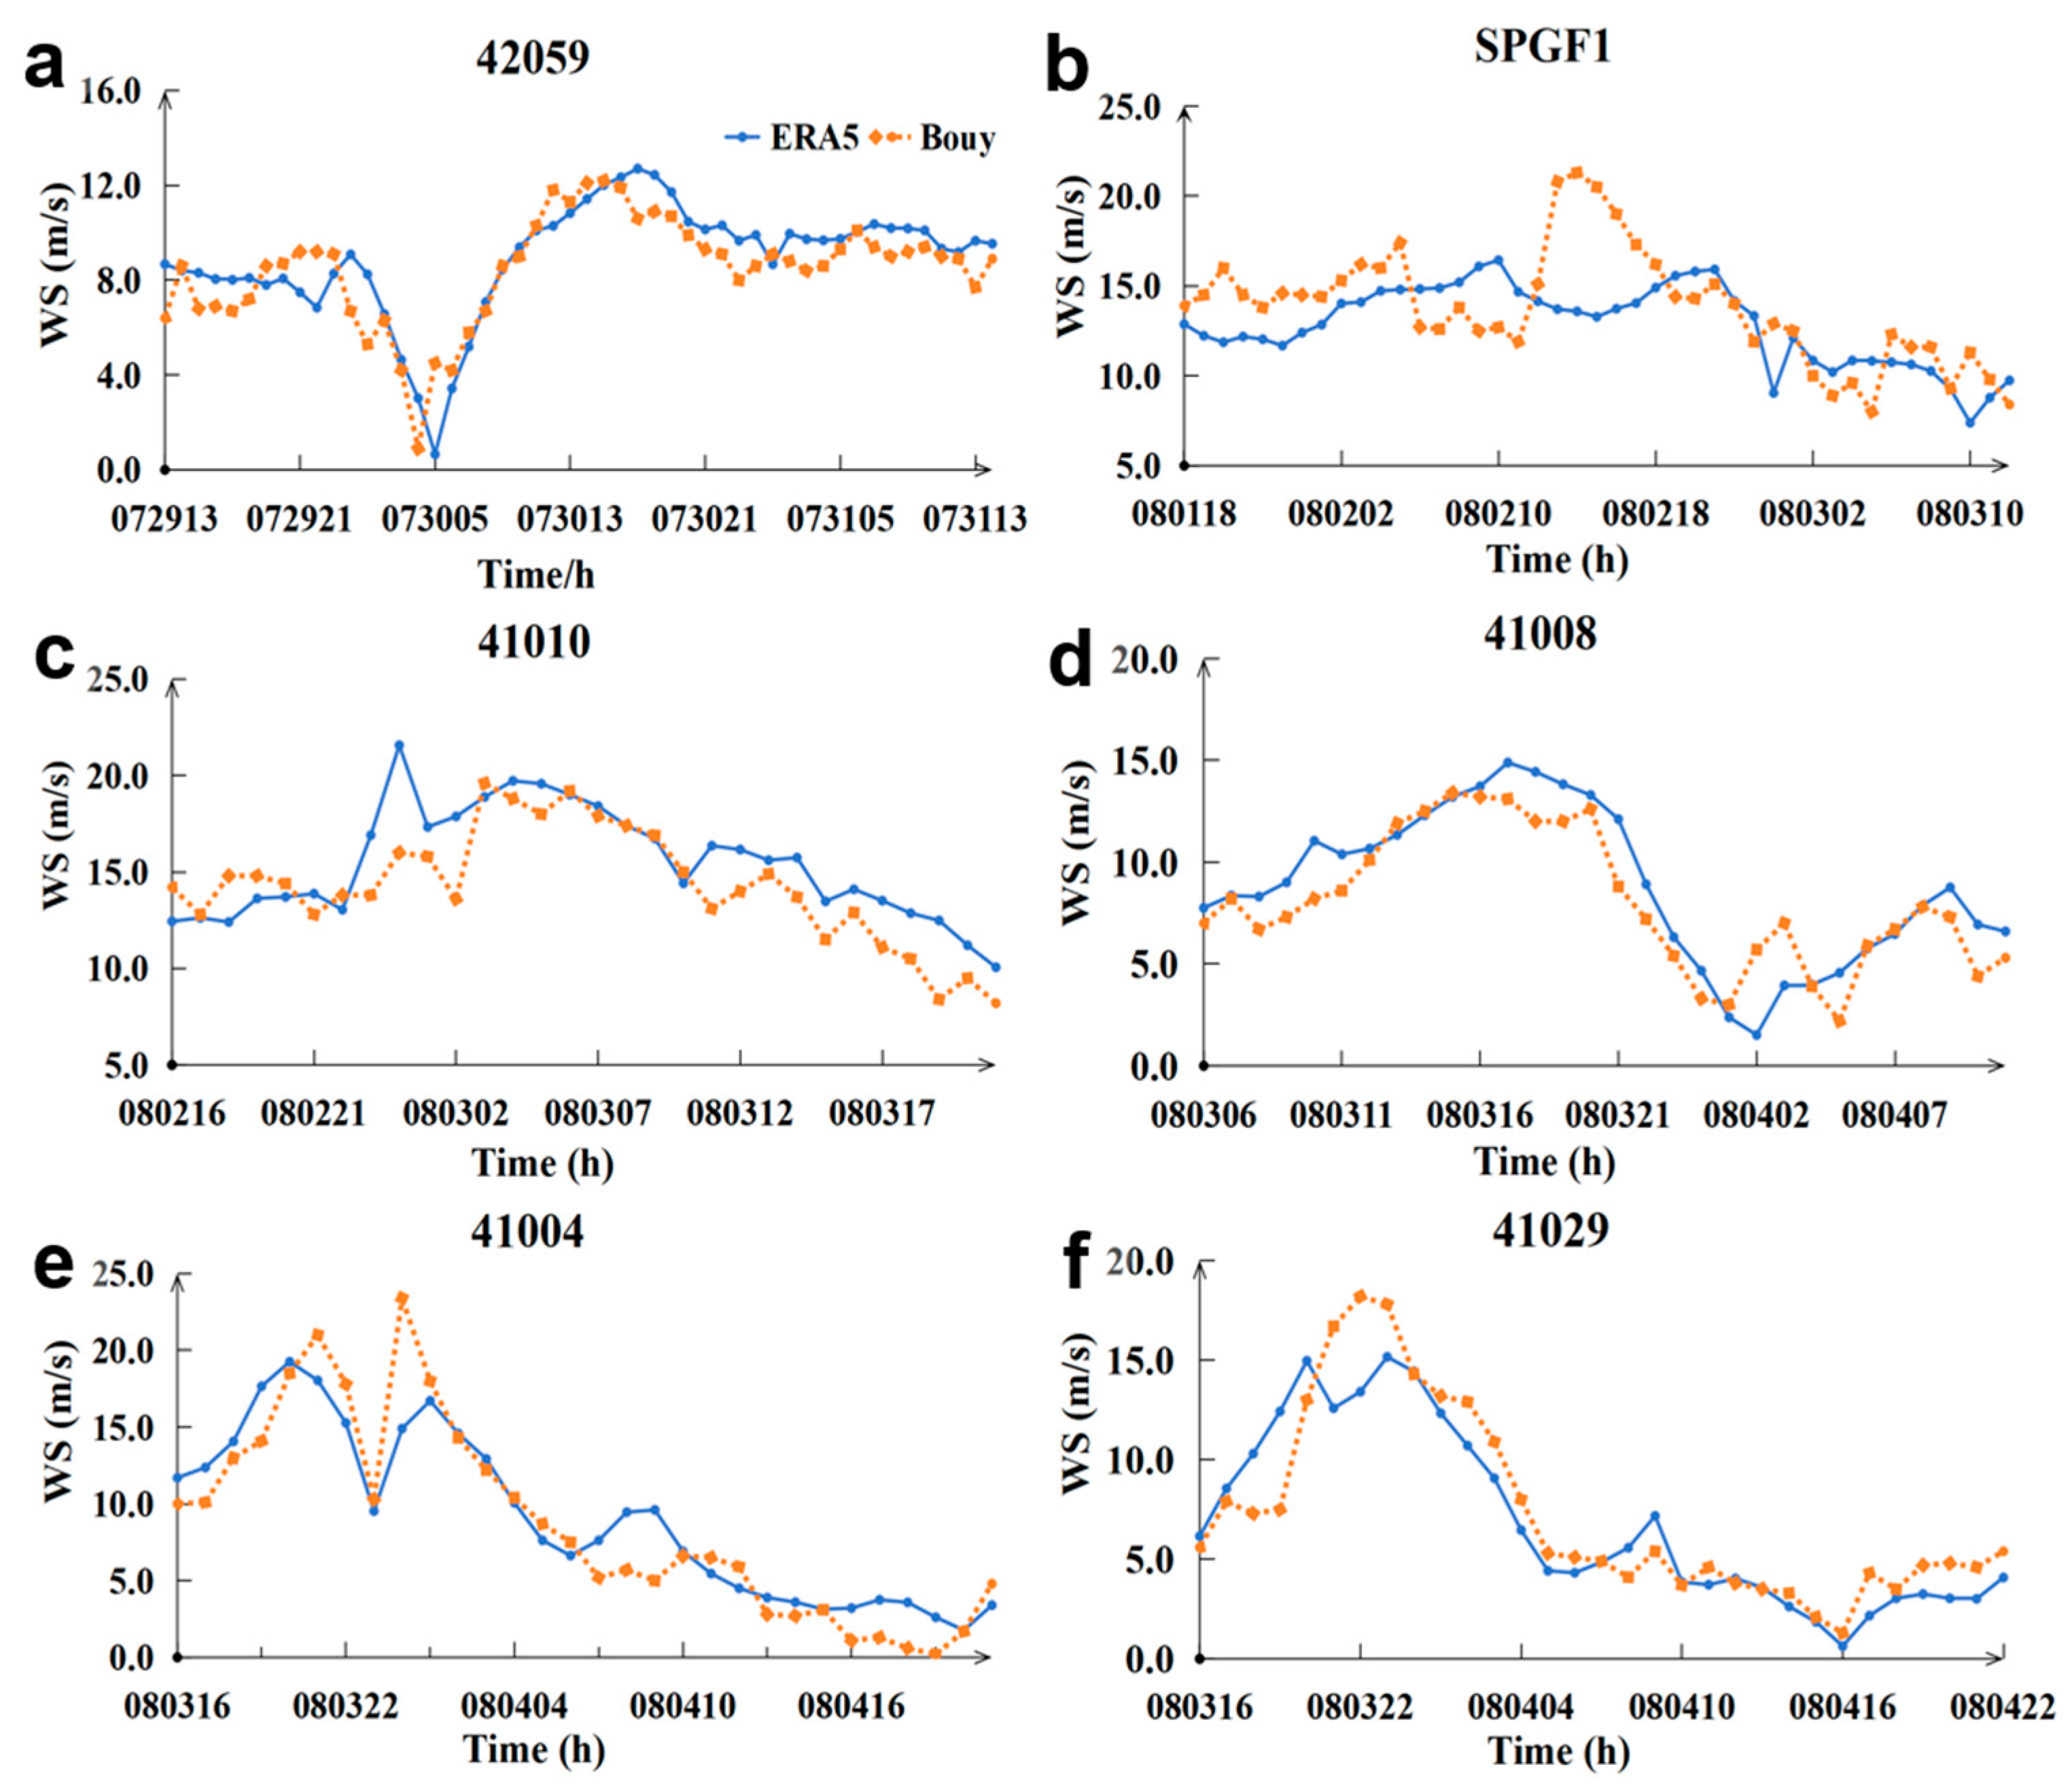
The analysis of the WS of buoys and ERA5 during “ISAIAS” is presented in Figure 5. The solid line represents the ERA5 data, while the dotted line indicates the buoy data. The horizontal axis denotes time in hours (072913 is 29 July at 13:00), and the vertical axis shows wind speed in m/s. The time series in Figure 5 demonstrates that the changes in ERA5 and observed values align closely, illustrating the wind speed’s sudden increase–peak–decrease during the hurricane’s passage (stations 42059 and 41004). The fluctuation trends of both data types are largely synchronous with the observed values from station 41004, indicating a significant positive correlation between them.
This study examines that nearshore topography influences the accuracy of ERA5 by comparing the data from stations SPGF1 (nearshore) and 41004 (open ocean), as illustrated in Figure 5a,b. Figure 5a indicates that the ERA5 wind-speed profiles align closely with the observations during the hurricane, particularly throughout the hurricane transit, showing a peak deviation of less than 1.5 m/s. Additionally, there is a notable consistency in the trend and fluctuations of ERA5 changes. Figure 5b illustrates that as “ISAIAS” began, buoy data indicated a rapid decline from 21.3 m/s, which resulted in a steep descent curve. In contrast, the WS curve of ERA5 shows a gentle decrease, which underestimates the wind speed by 4 m/s at the time of hurricane landfall and is accompanied by a phase lag of 1–2 h.
Figure 5c indicates that merely 8 out of 30 h share the same value, highlighting a discrepancy between ERA5 and the observed values. The examination of wind-speed maxima indicates an error in the peak value of ERA5, as illustrated in Figure 5e. Using station 41004 as an example, the buoy experiences a rapid increase in speed from 10 m/s to a peak of 25 m/s within 2 h as the hurricane approaches. This rising process exhibits a steep curve, indicating a significant increase in wind influence. In contrast, the ERA5 data reflect a similar upward trend, but the peak reaches only 17 m/s in Figure 5, which is same as that in six stations.
Using buoy data as a reference, CC, RMSE, and MD analyses were performed on ERA5 WS, and the results are shown in Table 3. Table 3 indicates an average CC of 0.82 across all stations, with CC values reaching or exceeding 0.83 for all stations except SPGF1. Station 41029 exhibits a CC of 0.94, reflecting a very strong correlation with ERA5 wind speed. The nearshore SPGF1 station exhibits a correlation coefficient of 0.52, indicating a weak correlation. In contrast, the open-water stations (41029, 41004) demonstrate correlation coefficients ranging from 0.90 to 0.94, reflecting a very strong correlation. Error analysis indicated that open-water station 42059 exhibited the lowest error (RMSE = 1.32 m/s, MD = 0.45 m/s), remaining within the acceptable error limit (RMSE < 2.0 m/s). In contrast, SPGF1 recorded the highest RMSE (2.92 m/s, surpassing the acceptable threshold) and MD (−0.99 m/s), suggesting that nearshore topography significantly impacts ERA5 accuracy, leading to increased error.

3.2. Accuracy Assessment of SST During “ISAIAS”

3.2.1. Spatial Distribution of SST

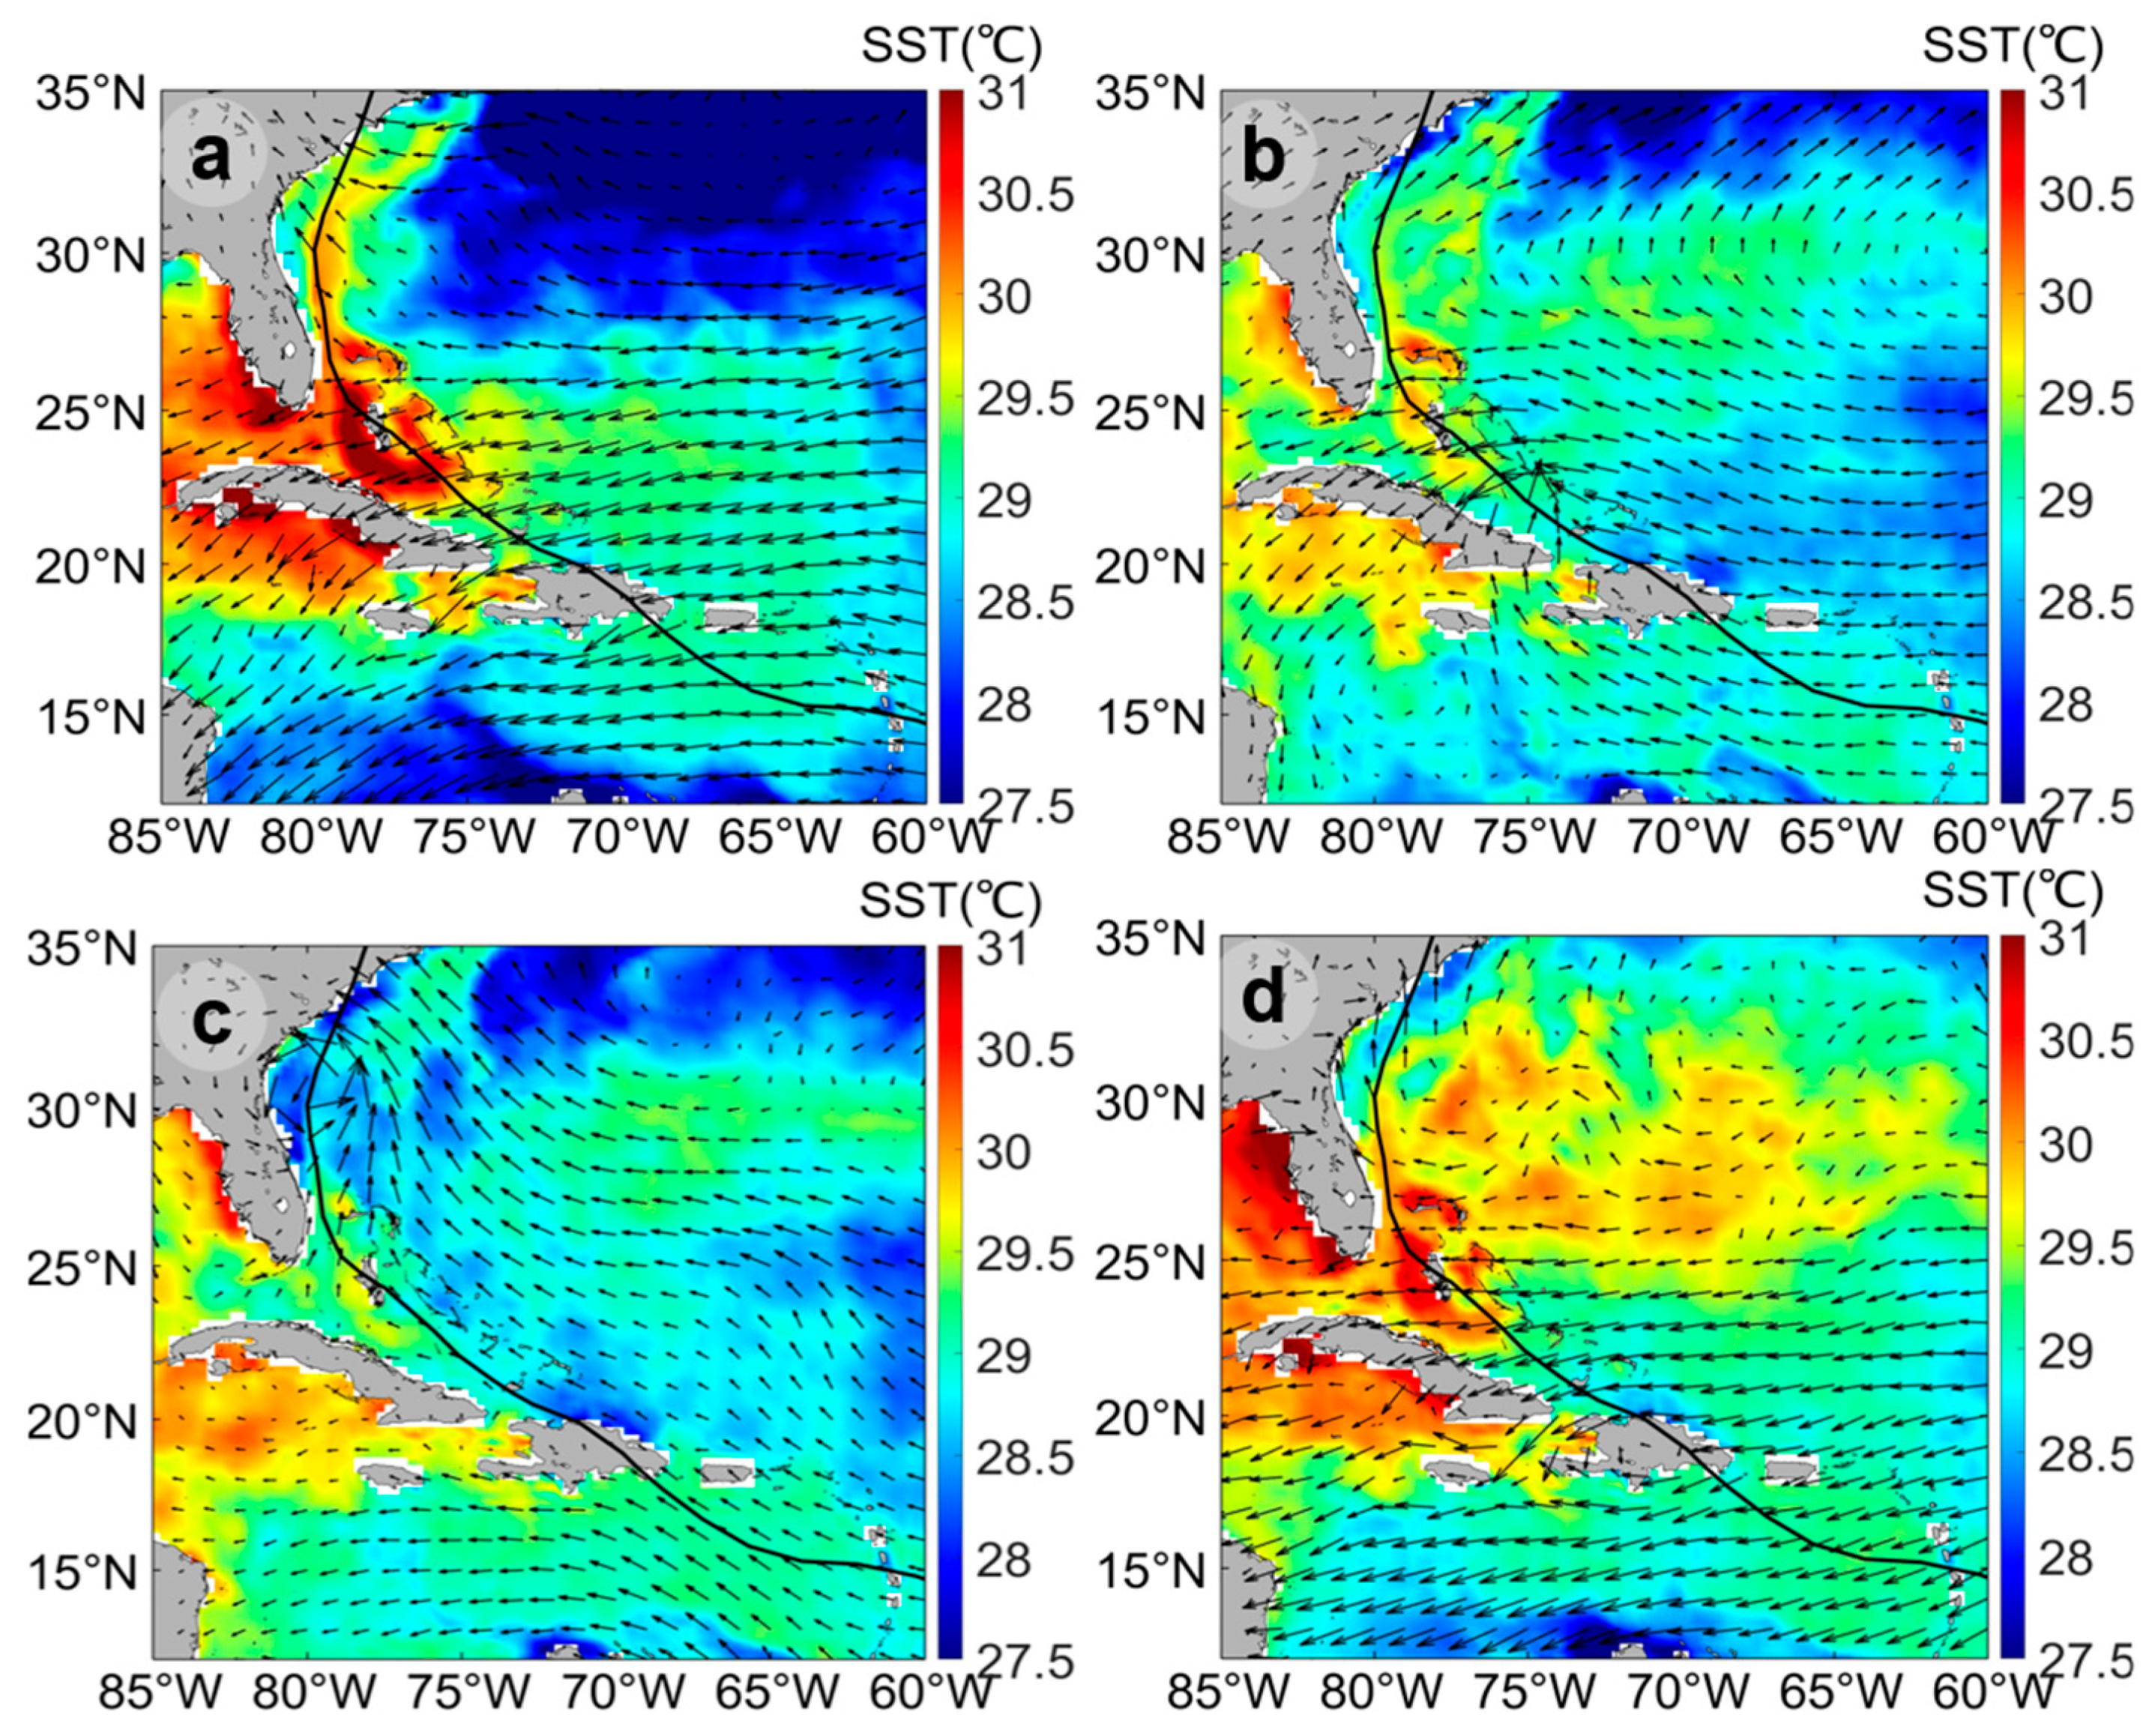
Analysis of the spatial distribution of SST was conducted before (15 July), during (31 July and 3 August), and after (15 August) “ISAIAS” using ERA5 data, as illustrated in Figure 6.
Figure 6a–d illustrate the wind speed direction with arrows, while the solid line denotes the actual path of “ISAIAS”. The color gradient from blue to red indicates the increase in SST, ranging from 27 to 31 °C. Prior to the hurricane’s arrival (15 July, Figure 6a), a warm tongue influenced by the Gulf Stream (>30 °C, red band) extends northward from the Florida Straits, creating a distinct temperature front with a cold water mass (<26 °C, blue zone), exhibiting a clear spatial gradient. On 31 July, during the hurricane development period, “ISAIAS” passes through the Caribbean high-temperature zone, reaching the southeastern Bahamas. The warm tongue vanishes in the eastern Florida waters, while a cooling zone emerges along the hurricane track in the northern Dominican waters. On 3 August, as “ISAIAS” progressed northward, it reached offshore eastern Florida (78.5° W, 27.5° N), as shown in Figure 6c. In comparison to Figure 6a, the high-temperature zone surrounding Florida was no longer present in the hurricane’s path, and a cooling zone developed along the hurricane track (20° N–32° N, 72° W–32° N). Following the dissipation of the hurricane on 15 August (Figure 6d), a low-temperature zone created by the surface cold water persisted in the southern waters of North Carolina. Meanwhile, the high-temperature zone associated with the warm tongue of the Gulf Stream gradually recovered and expanded northward along the U.S. east coast. ERA5’s SST data can reflect the downward trend in sea-surface temperature under the influence of hurricanes but cannot reflect the spiral spatial structure characteristics of hurricanes.

3.2.2. SST Error Analysis

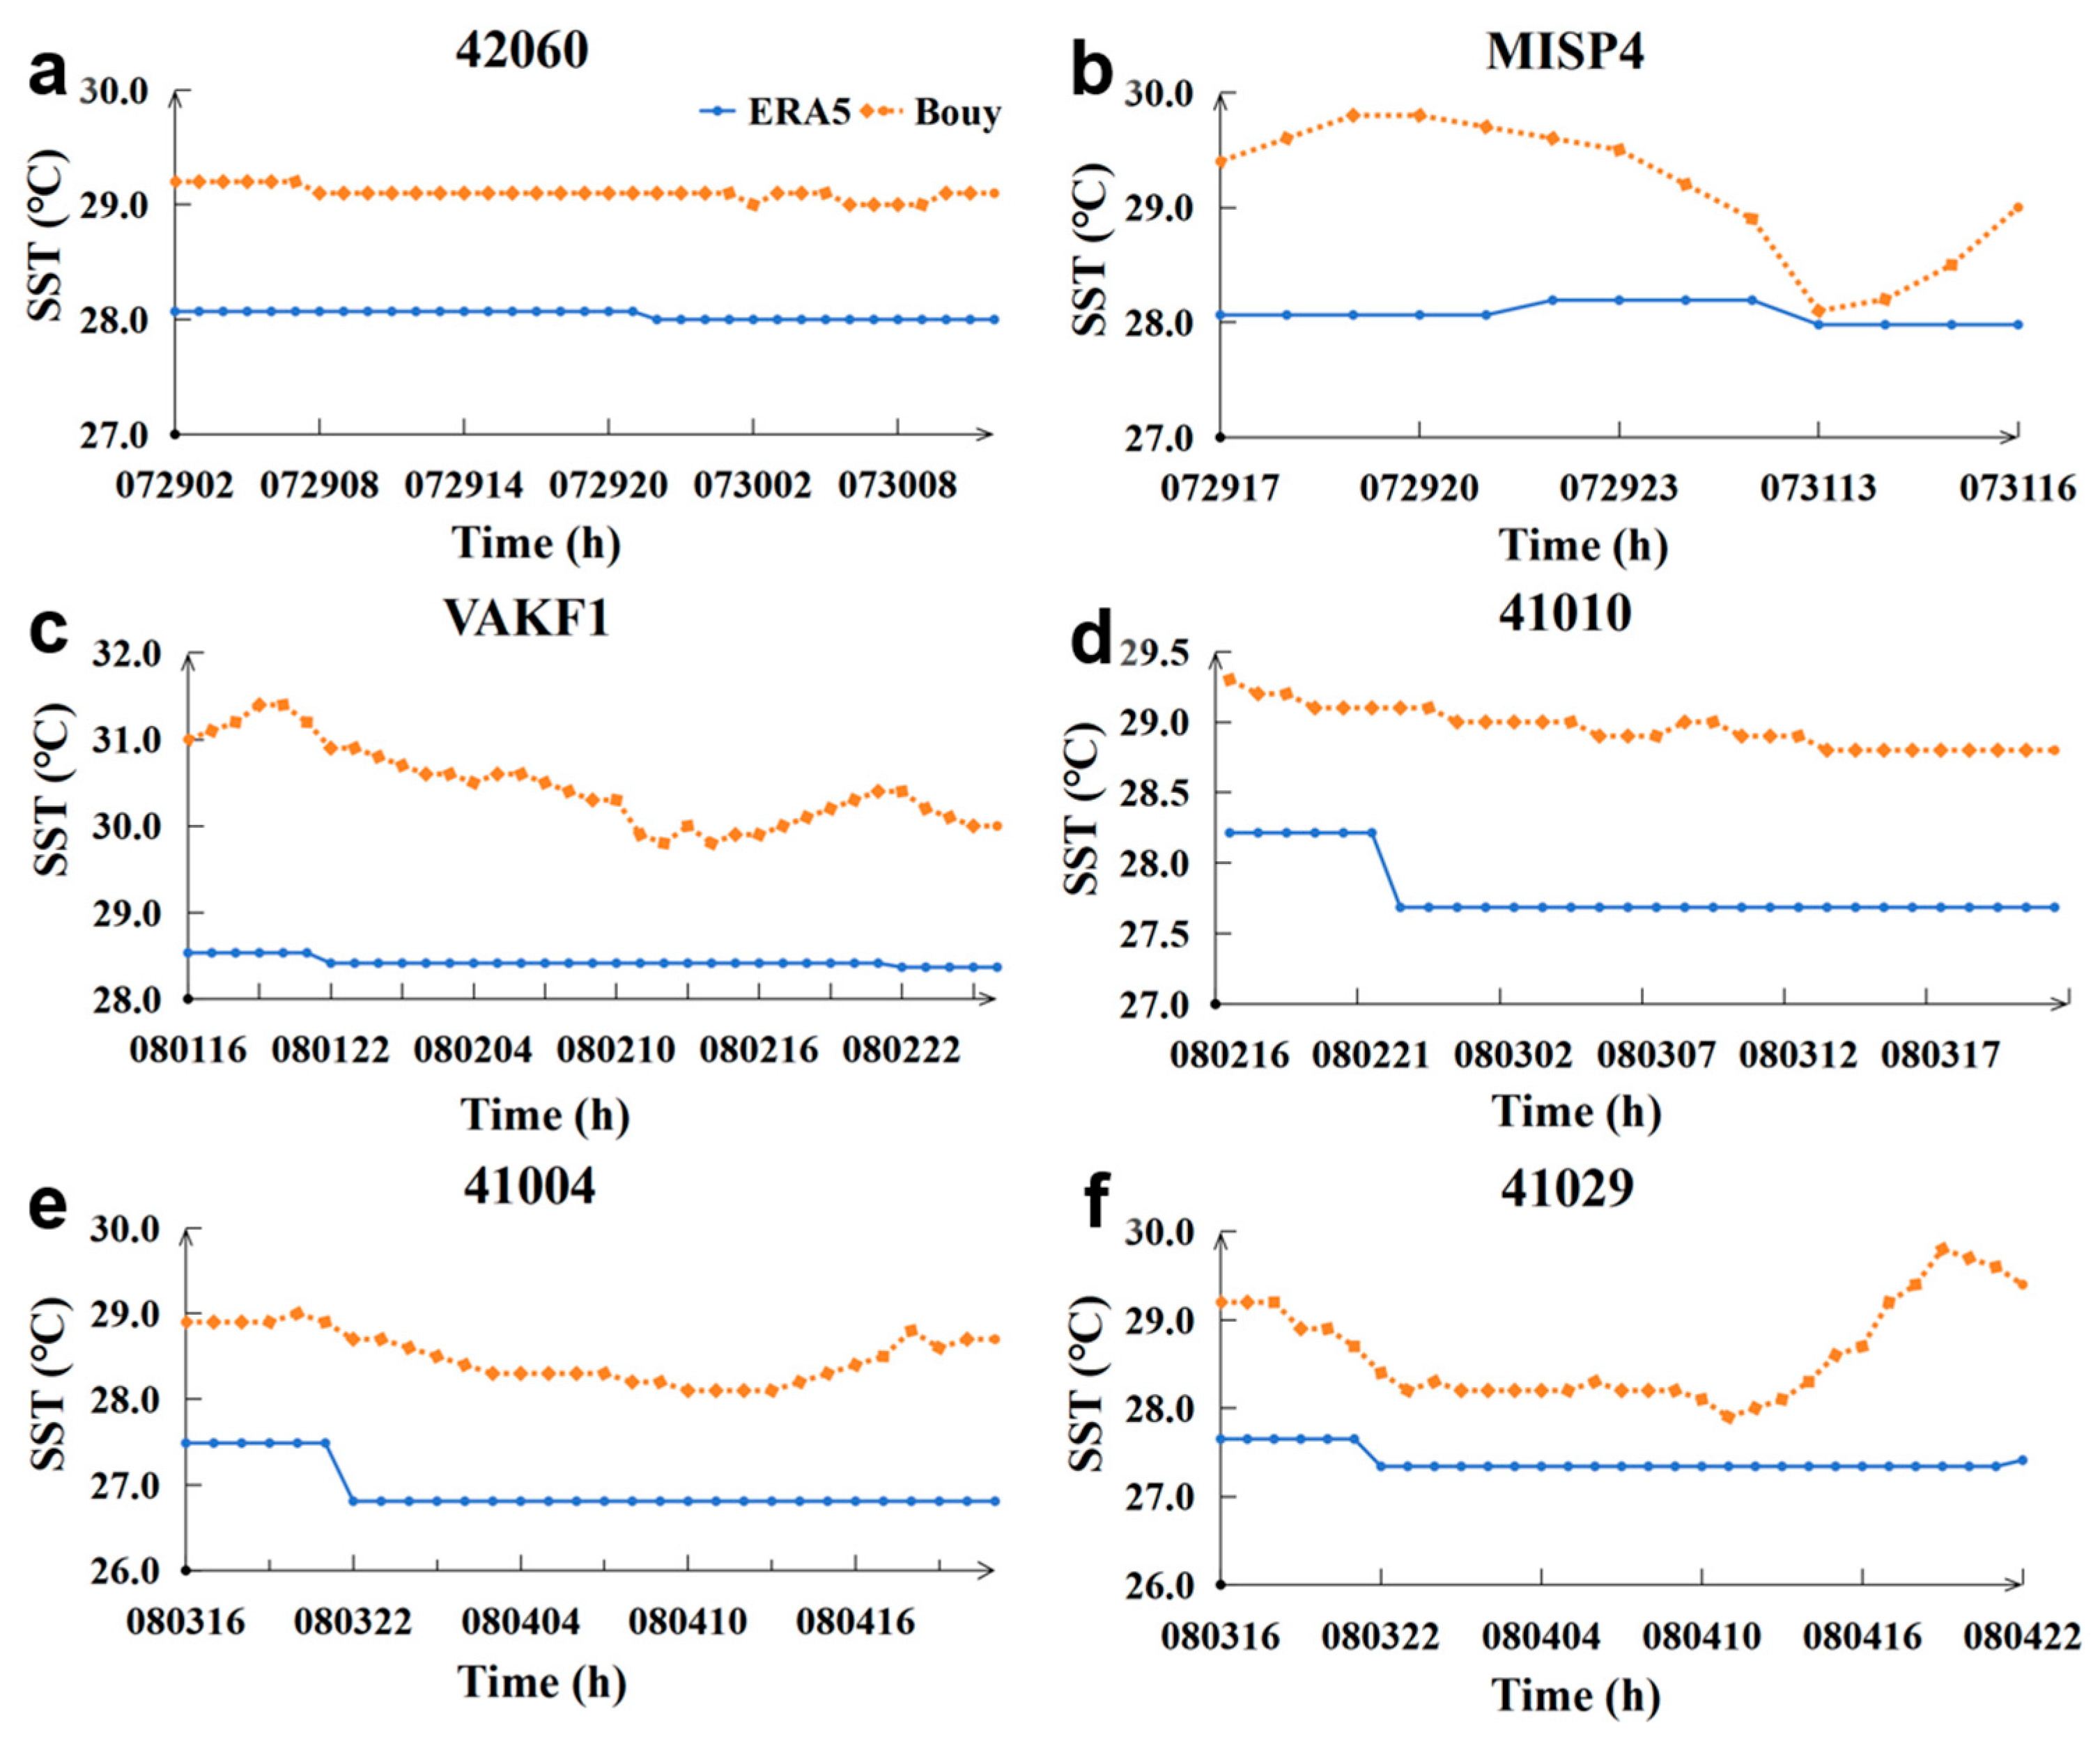
The statistical analysis of SST trends from ERA5 and buoy values during “ISAIAS” is presented in Figure 7. Figure 7 displays the ERA5 data as a solid line and the buoy data as a dashed line. The horizontal axis represents time in hours, with 072902 indicating 29 July at 02:00, while the vertical axis shows temperature in degrees Celsius.
Figure 7 shows that ERA5 maintains a consistent trend. However, it exhibits a notable error, with buoy values consistently higher than ERA5 (ERA5 is 1–2 °C lower than observed values). For instance, at the VAKF1 station (Figure 7c), during the hurricane, the buoy SST dropped to 29.8 °C while ERA5 decreased to 28.4 °C, indicating an underestimation of 1.4 °C by ERA5. Figure 7 illustrates the significant fluctuations in buoy value during the hurricane, in contrast to the more gradual changes observed in the ERA5 data. The response of ERA5 exhibits a lag of 1–5 h. For instance, in Figure 7c, the buoy begins a continuous decrease at 19:00, whereas ERA5 shows a decrease starting at 21:00, marked by a single fluctuation, indicating a 2 h lag. Figure 7b illustrates an abrupt decrease in the buoy’ s temperature from 30 °C to 28 °C over a short duration, resulting in a total drop of 2 °C, while ERA5 shows only a decrease of 0.2 °C. ERA5 sea-surface temperature (SST) is underestimated, and there is a delay in SST changes, as shown in Figure 7.
The SST of ERA5 was analyzed for the CC, RMSE, and MD using the buoy data as a reference, with results presented in Table 4. Table 4 indicates a significant error in SST, with the CC for all ERA5 stations varying between 0.36 and 0.76. Notably, station 41029 has a CC of 0.36, complicating ERA5’s ability to represent the actual changes during the “ISAIAS” period. The ERA5 data range and RMSE for each station during “ISAIAS” are between 1.04 and 2.07. The overall deviation of ERA5 is significant, surpassing the acceptable threshold of 0.5–1.0 °C, particularly at station VAKF1, which shows an RMSE deviation of 2.07 °C. In the hurricane period, the MD values of ERA5 and the SST reference values from each buoy were negative, with ERA5 deviating from the reference values by an average of 1.03–2.03 °C. The reduced SST values of ERA5 relative to actual values could affect the evaluation of hurricane damage and undermine the precision. The SST during “ISAIAS” requires a correction of 1–2 °C for applications related to ERA5 in the western Atlantic nearshore.

3.3. Accuracy Assessment of SSP During “ISAIAS”

3.3.1. Spatial Distribution of SSP

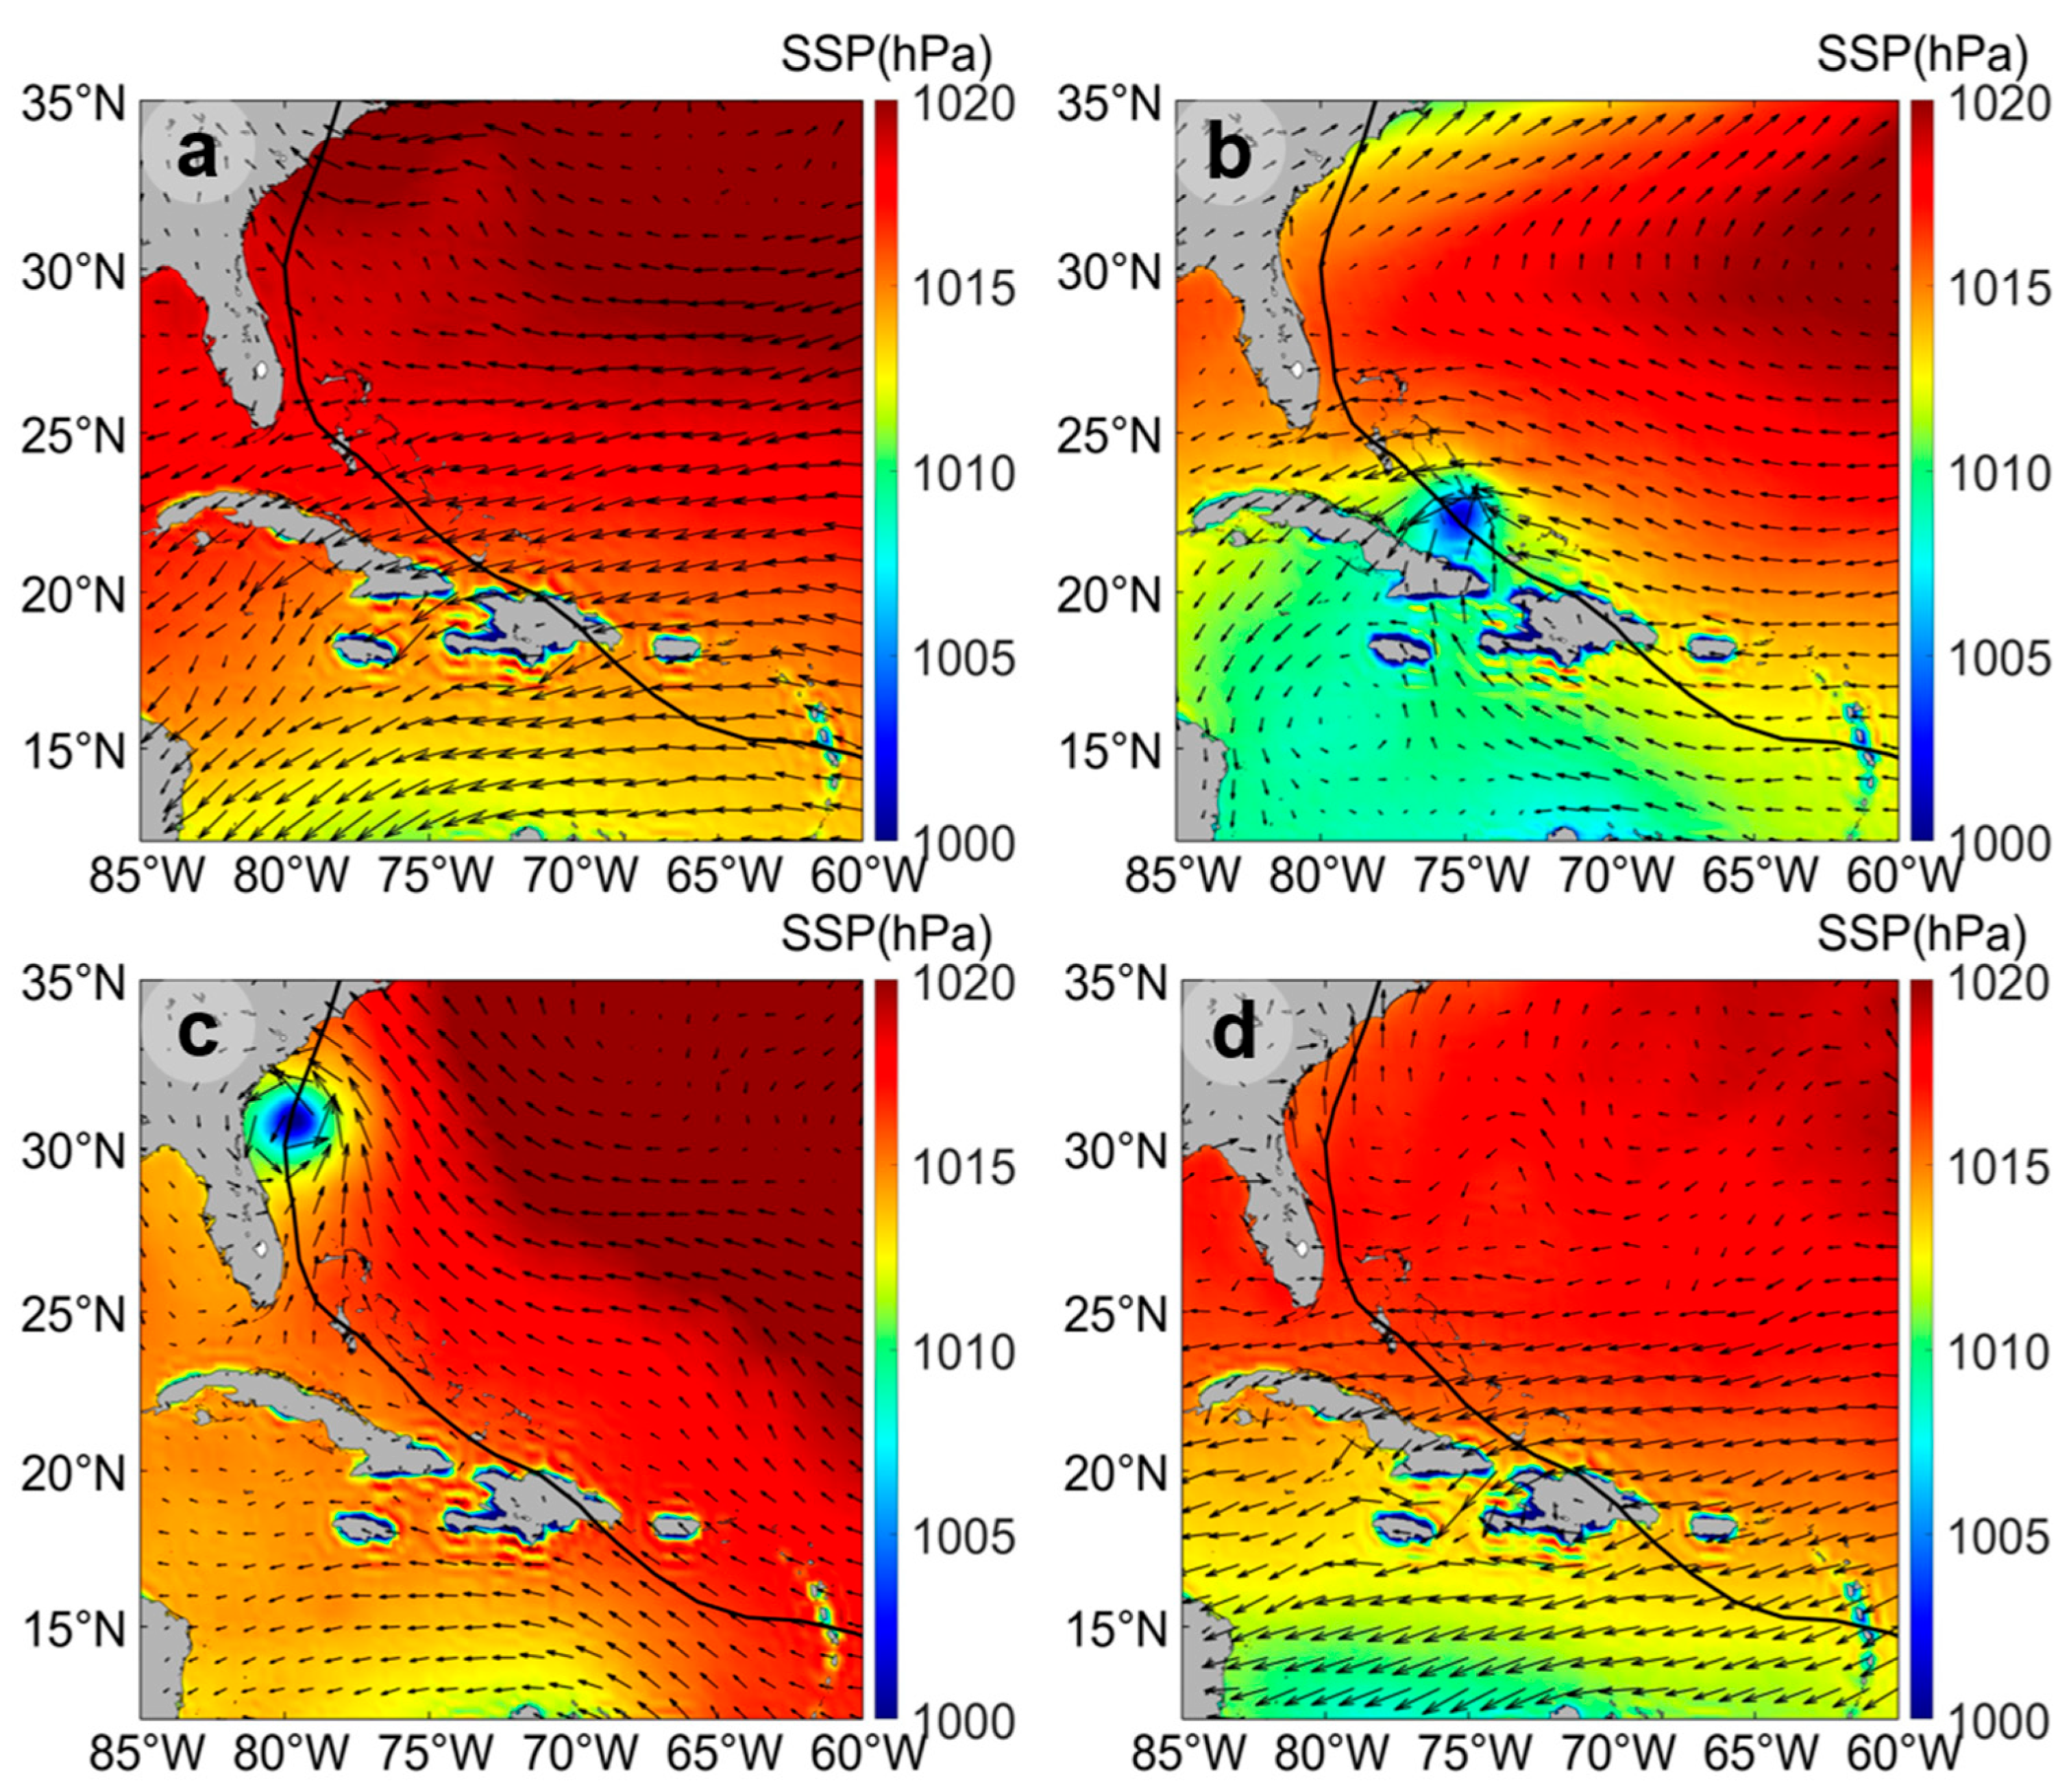
The spatial distribution of SSP was analyzed using ERA5 data before (15 July), during (31 July and 3 August), and after (15 August) “ISAIAS”, as illustrated in Figure 8. Figure 8a–d illustrates the wind speed direction with arrows, the solid line indicates the actual path of “ISAIAS”, and the color gradient from blue to red signifies the increase in SSP (range: 1000–1020 hPa). Prior to the hurricane’s arrival on 15 July (Figure 8a), the SSP exhibited an even distribution, characterized by high pressure (subtropical high pressure) north of the Tropic of Cancer and low pressure (tropical low pressure) south of the Tropic of Cancer. This configuration corresponds with the typical barometric distribution patterns observed in the northern hemisphere during summer [27,28,29]. Pressure varied between 1010 and 1020 hPa, exhibiting a uniform distribution of isobars. On 31 July, “ISAIAS” developed and traversed the Caribbean Sea, reaching the southeastern Bahamas. A low-pressure area exhibited a blue spiral distribution, aligning with the actual path of “ISAIAS”. The center of this low-pressure area, representing the eye of the hurricane, was in the sea north of Cuba. The low-pressure center, or eye of the hurricane, was in the northern Cuban waters. It exhibited an anticlockwise distribution and a distinct spatial structure of the SSP gradient. On 3 August (Figure 8c), a distinct low-pressure zone developed along the hurricane’s path, revealing a clear hurricane structure characterized by a dense spiral of isobars radiating outward from the low-pressure center. Following the dissipation of the hurricane on 15 August (Figure 8d), a low-pressure area influenced by the hurricane persisted in the offshore waters of North Carolina. Meanwhile, the SSP in surrounding waters gradually returned to pre-hurricane conditions, characterized by sparse and uniformly distributed isobars. The SSP of ERA5 accurately reflects the spiral distribution characteristics and spatial gradient characteristics of sea level pressure affected by hurricanes.

3.3.2. SSP Error Analysis

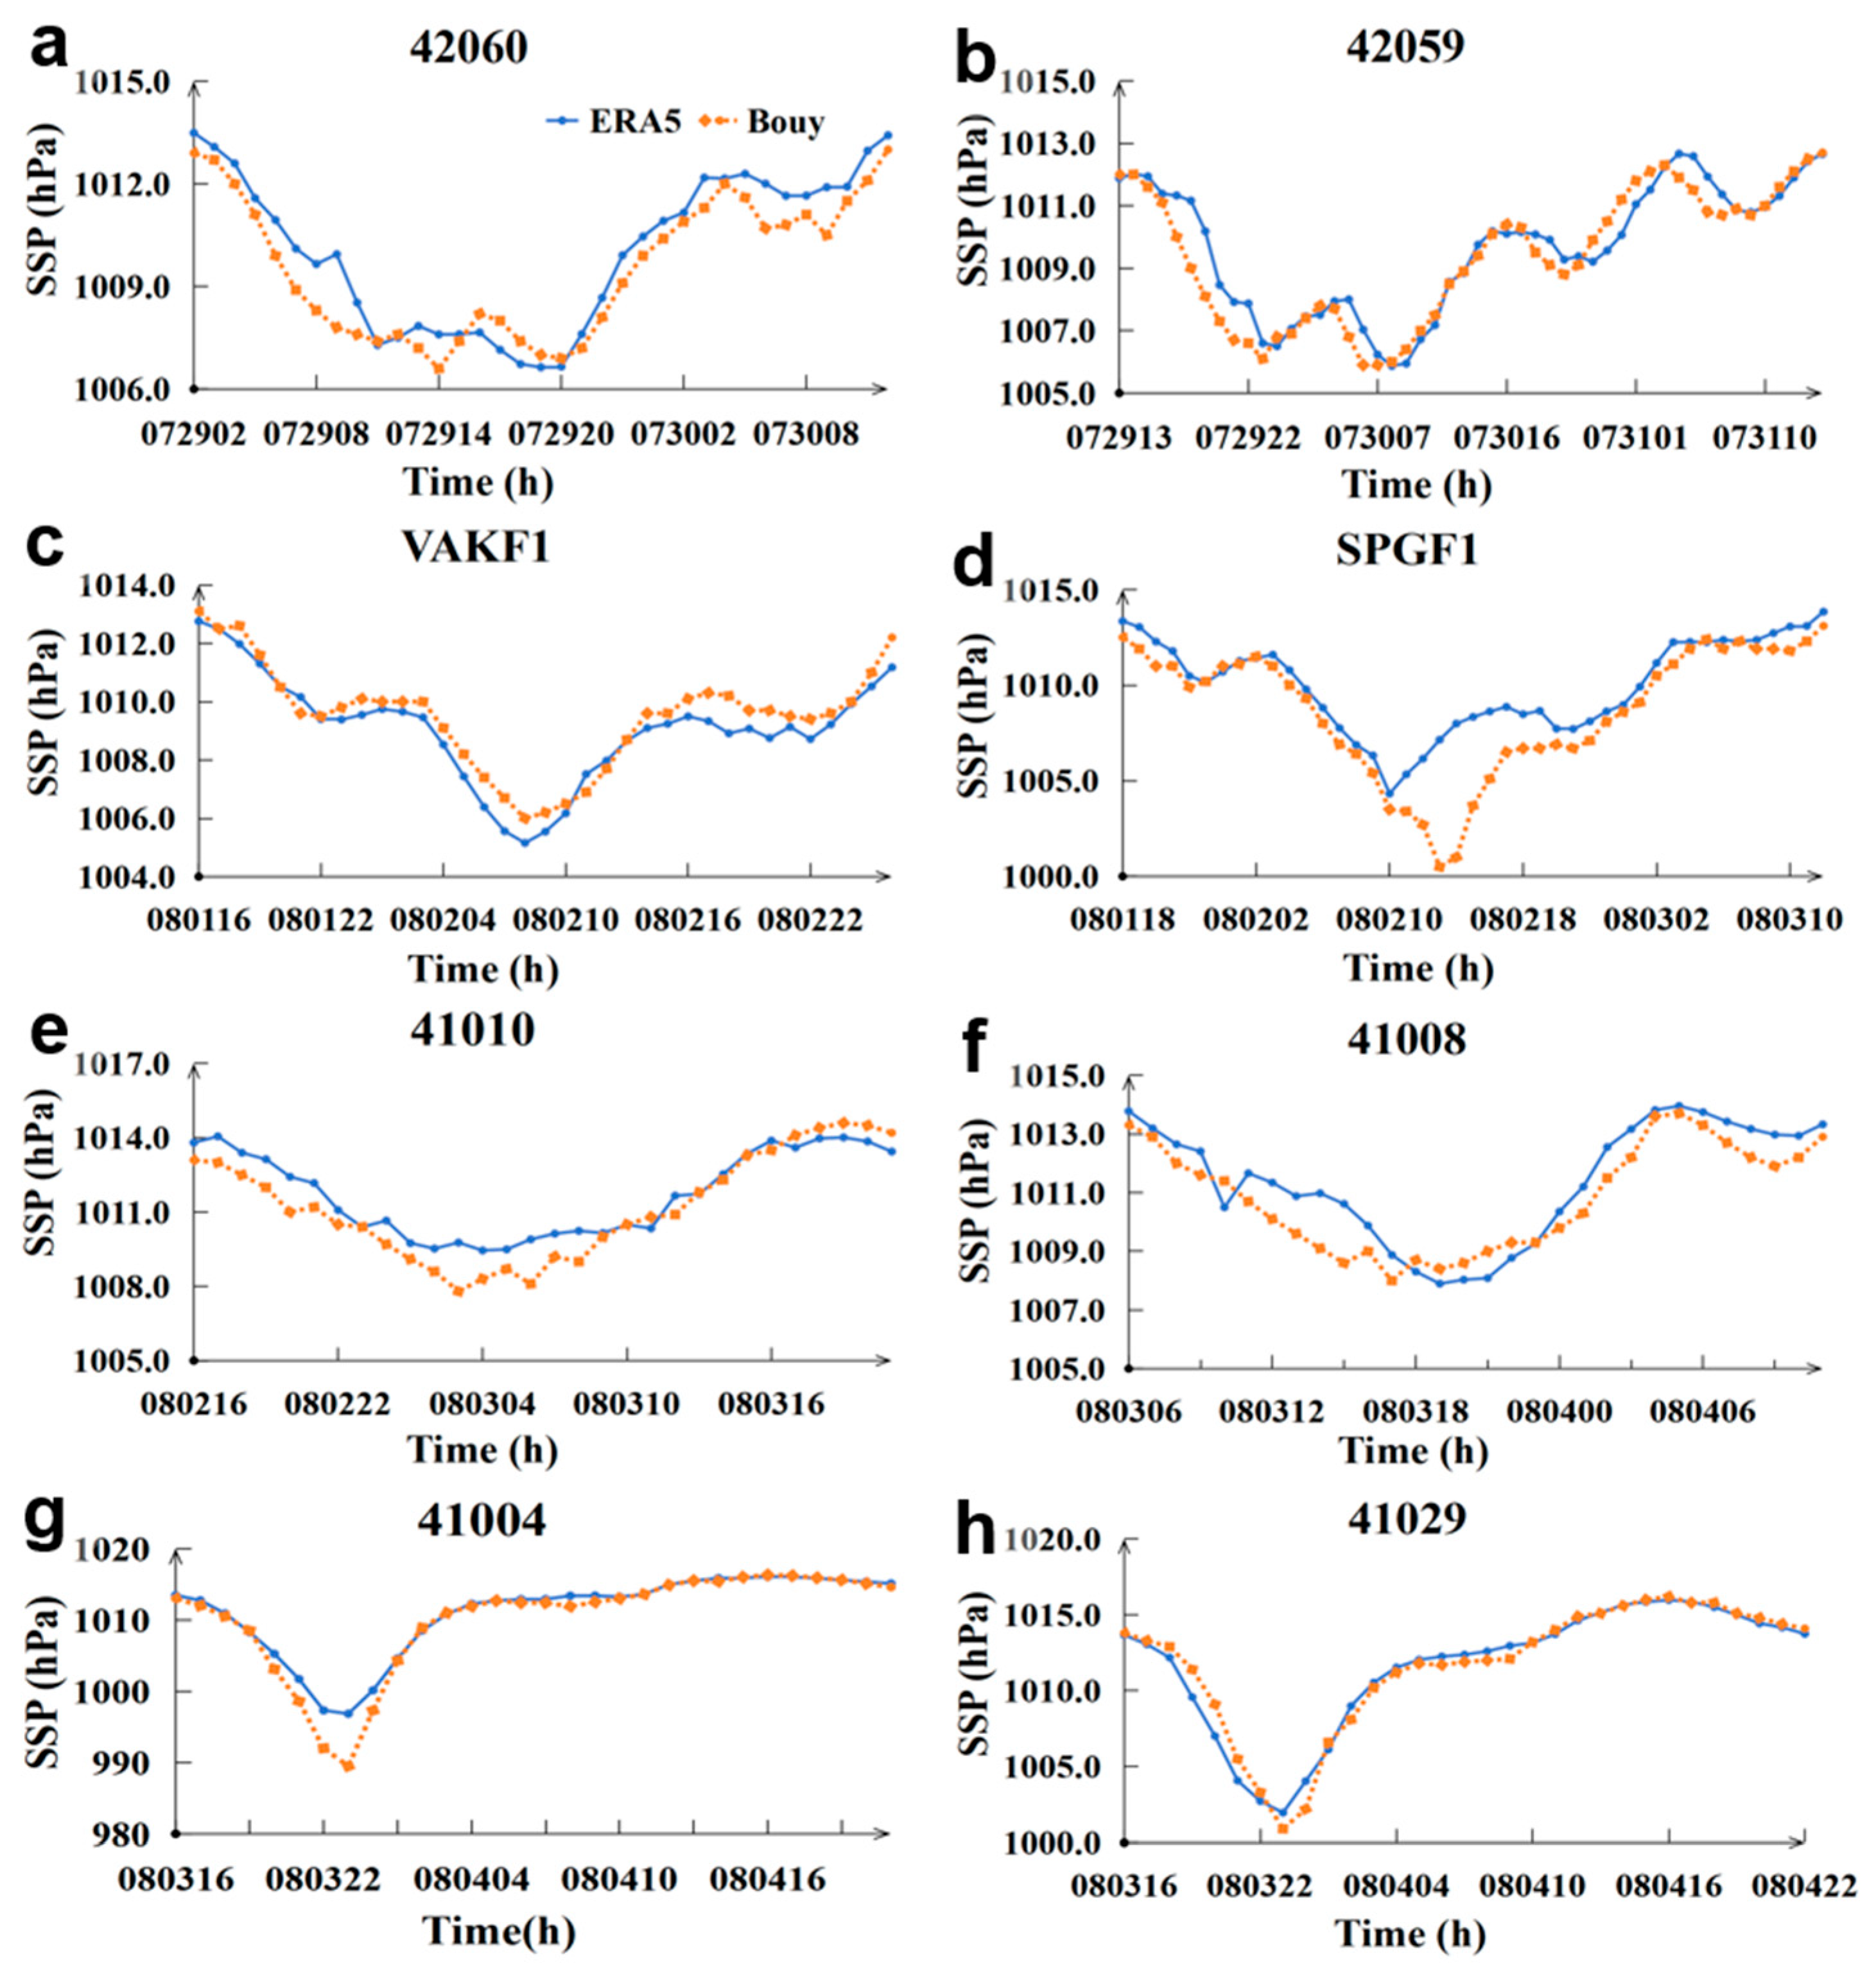
The statistical analysis of SSP trends from ERA5 and buoy values during “ISAIAS” is presented in Figure 9. Figure 9a–h presents the ERA5 data as a solid line and the buoy data as a dashed line. The horizontal axis represents time, with an example being 072902 (29 July 02:00), while the vertical axis indicates barometric pressure in hPa. Figure 9 illustrates a decline in the SSP during the “ISAIAS” period. The ERA5 data trend aligns with the actual values, showing a similar rate of decline, which reflects the typical characteristics of the SSP. The actual value changes consistently, with a consistent rate of decline and typical “V” and “W” type variations. The curves overlap in most periods, indicating that ERA5 effectively reflects the characteristics of sudden drops in barometric pressure during hurricane transits, demonstrating high data reliability. Except for the SPGF1 station (Figure 9d), the errors at the other stations are ≤1.47 hPa. In the open ocean, using station 41029 as an example (Figure 9h), during the hurricane, the SSP of the buoy data decreased from 1014 hPa to 1000.9 hPa and subsequently increased to 1016 hPa, creating a “V”-type fluctuation. ERA5 also reached its minimum simultaneously, with the decreasing trend aligning with the observed values. Using the SPGF1 station as a case study in the nearshore area (Figure 9d), in the “ISAIAS” period, both ERA5 and buoy data exhibited “V”-type fluctuations. However, the minimum value recorded by ERA5 was 3.8 hPa higher than that of the buoy, and the timing of ERA5’s minimum occurred 3 h earlier. The minimum of ERA5 occurred 3 h earlier than that of buoy data, and this was consistent across observations.
The analysis of SST for ERA5 included the CC, RMSE, and MD, as presented in Table 5. The CC thresholds for each station ranged from 0.90 to 0.99, indicating a strong correlation with ERA5. The CC is greater than or equal to 0.93 at all stations except SPGF1, showing highly consistent trends, with the CC reaching up to 0.99 at station 41004, where the SSP data for ERA5 matched the observation level. The RMSE threshold for each station ranges from 0.62 to 2.01, with an acceptable RMSE of ≤0.92 (0.5–1.0 hPa), except for SPGF1 (RMSE = 2.01 hPa). The absolute value of the MD for each station is ≤1.27 hPa, while for all other stations except SPGF1 (MD ≤ 0.89 hPa, indicating a minimal degree of error and deviation. The ERA5 SSP data during “ISAIAS” clearly show the influence of nearshore topography; however, the errors remain minimal and within acceptable limits, with some stations achieving observation-level accuracy.
SSP data from ERA5 accurately represent the spatial and temporal structure of the hurricane low-pressure center, including the “V”-shaped fluctuation and spatial pressure gradient. It demonstrates the highest accuracy in open-ocean areas, with a 3–4 hPa overestimation nearshore. Additionally, the SSP of ERA5 effectively captures significant changes in hurricane pressure and structural characteristics, serving as crucial data support for disaster warnings.

4. Discussion

Hurricanes are destructive meteorological events, and accurate forecasts rely on high-precision meteorological data. This study examines hurricane “ISAIAS” No. 9 from 2020, utilizing buoy data as measured values to assess the applicability of WS, SST, and SSP from ERA5. The analysis focuses on spatial distribution and error evaluation during the “ISAIAS”. ERA5’s SSP and WS accurately reflect the structural characteristics of hurricanes, such as low-pressure centers and hurricane-affected areas, on a spatial scale. In contrast, SST only reflects overall changes in sea-surface temperature within the study area. The WS data from ERA5 indicate the presence of a spiral high-wind-speed zone (maximum wind speed > 22 m/s) and counterclockwise circulation features in the hurricane eyewall region. The distribution of the wind field aligns with the position of the low-pressure center of the SSP (Figure 8). The SST of ERA5 indicates cooling changes along the hurricane path, such as the disappearance of high-temperature areas in the waters surrounding Florida (Figure 6). The low-pressure system at the hurricane center primarily governs the SSP variations. ERA5 features a high resolution of 0.25° × 0.25° and utilizes advanced data assimilation techniques [15,38,39,40,41,42,43,44,45,46]. It accurately reflects the “V”-shaped fluctuation and spiral isobar distribution of the hurricane low-pressure center.
This is consistent with the actual path of the hurricane, which exhibited significant pressure gradient characteristics off the southeast coast of the Bahamas and the east coast of Florida (Figure 8). Concerning error analysis, ERA5 demonstrates the highest SSP precision (CC: 0.90–0.99), indicating a strong agreement in the open ocean (station 41029, CC = 0.98, Table 5), and a CC of 0.90 for the nearshore station (SPGF1), both showing a very strong correlation. The SSP meets the acceptable threshold (0.5–1.0 hPa) for open-ocean RMSE ≤ 0.92 hPa, and the absolute value of MD ≤ 1.27 hPa, indicating a minimal error. The WS accuracy of ERA5 ranks among the second (CC: 0.52–0.94), influenced by surface roughness, topographic friction, and turbulent exchange [42,43,44,45,46,47,48].
The correlation coefficient reaches CC = 0.94 in the open ocean (station 41029) and drops to CC = 0.52 at offshore station SPGF1, indicating a weak correlation. The RMSE of WS is ≤2.50 m/s in the open ocean, and the RMSE is 2.92 m/s at the offshore station SPGF1, which exceeds acceptable thresholds. The MD of ERA5 is underestimated by 0.99 m/s at the offshore station (SPGF1) and overestimated by 0.75 m/s in the open ocean (41008). In 41008, the overestimation was 0.75 m/s, and the WS peak of ERA5 lagged by 1–2 h at certain stations. The SST precision of ERA5 exhibited the lowest correlation coefficient (CC: 0.36–0.76), reaching a minimum of 0.36 at station 41029, indicating a poor consistency in the trend of changes between ERA5 and the observed values. The RMSE of SST ranged from 1.04 to 2.07 °C, indicating a significant deviation, while the MD values were consistently negative, averaging an underestimation of 1.03 to 2.03 °C (Table 4, Figure 7). The ocean mixing process triggered by hurricanes causes surface seawater to rise, leading to a decrease in SST and the disappearance of high-temperature areas (Figure 8) [10,47,48,49,50,51].
In strong current areas like the Gulf Stream, SST fails to effectively represent the spatial distribution characteristics of hurricanes. ERA5′s accuracy arises from the influence of various geographical mechanisms and physical processes on each parameter [43,52,53,54,55,56]. Variations exist in the applicability of various parameters at the same station, along with discrepancies in the correlations observed at station 41004 (WS = 0.90, SST = 0.73, SSP = 0.99, in Table 3, Table 4 and Table 5). The error in ERA5 data increases notably as proximity to land increases (station SPGF1). The variation in water depth in the nearshore area of the western Atlantic (ranging from shallows less than 200 m to depths exceeding 3000 m), along with the peninsular topography of the Florida Peninsula, results in nonlinear dynamics affecting hurricane paths. ERA5’s resolution remains inadequate for accurately representing small-scale topography and terrain features such as islands and narrow straits [57,58,59,60,61]. In Table 3, the WS correlation shows a comparison between open-ocean sites (42059, CC = 0.85) and nearshore sites (SPGF1, CC = 0.52), indicating that the complex topography of land amplifies the data error.
The ERA5 WS peaks exhibited a lag of 1–4 h (Figure 5). The timing and magnitude of the WS peak observed at each station varied, as did the onset of the increase. The values remained consistent for a brief duration (Figure 7 and Figure 9), attributed to the spatial-temporal discrepancy between the data assimilation period and the hurricane’s velocity. Future developments should focus on creating a higher-frequency assimilation scheme or incorporating real-time observations, such as drone and ship data, to enhance timeliness [14,62,63,64,65].

5. Conclusions

This study analyzed the applicability of ERA5 during hurricane ISAIAS, using 2020 buoy data as a reference benchmark. The results showed that ERA5 was consistent with the reference values in terms of trend. The average correlation coefficients for SSP, WS, and SST are 0.953, 0.822, and 0.607, respectively. Additionally, the accuracy of ERA5 data is higher in open seas than in coastal areas. SSP and WS can reveal the spatial structural characteristics of hurricanes, including spiral-shaped high-wind zones and low-pressure centers.
ERA5 provides high-resolution and global ocean data, addressing issues such as the scarcity of observational data. ERA5 reanalysis data provide essential data support for assessing the impact of disasters during extreme weather events. This study is limited to a single hurricane, “ISAIAS.” Future research should be expanded to include various tropical cyclones to verify the general applicability of the research results. The results of this study will provide a scientific basis for disaster risk assessment.

Author Contributions

Conceptualization, Z.X., B.G., G.S., W.X., C.W. and J.S.S.; methodology, Z.X.; software, Z.X.; validation, G.S., V.S.M., Z.X. and B.G.; formal analysis, Z.X.; investigation, Z.X.; resources, B.G.; data curation, Z.X.; writing—original draft preparation, Z.X.; writing—review and editing, V.S.M. and B.G.; visualization, Z.X.; supervision, B.G.; project administration, B.G.; funding acquisition, B.G. All authors have read and agreed to the published version of the manuscript.

Funding

This research was funded by the Key R&D projects in Zhejiang Province (No. 2023C03120); National Key R&D Program of China (2024YFC3013200); the Open Research Fund Program of Key Laboratory for Water Ecology Management and Protection in River Source Areas, Ministry of Water Resources (No. 2024slbjh02); the National Natural Science Foundation of China (No. U2243226); Consultation and Evaluation Program of the Department of Chinese Academy of Science (No. 2020-ZW11-A-023); and Zhejiang Provincial Virtual Simulation Experiment Projects (virtual simulation experiment project of monitoring of suspended sediment in coastal waters using remote sensing).

Institutional Review Board Statement

Not applicable.

Informed Consent Statement

Not applicable.

Data Availability Statement

Data are contained within the article.

Conflicts of Interest

The authors declare no conflicts of interest.

Abbreviations

The following abbreviations are used in this manuscript:
WSwind speed
SSTsea-surface temperature
SSPsea-surface pressure
NDBCNational data Buoy Center
ECMWFEuropean Centre for Medium-Range Weather Forecasts
NHCNational Hurricane Center
LatLatitude
LonLongitude
CCcorrelation coefficient
RMSEroot mean square error
MDmean deviation

References

  1. Xue, Y.; Simon, S.M.; Anderson, J.R.; Pegion, P.; Barton, N.P.; Baggett, C.F.; Stan, C.; Johnson, N.C.; Akella, S.; Becker, E.; et al. Advancing NOAA’s Subseasonal and Seasonal Applications and Enhancing Collaboration among Stakeholders, Modelers, and Researchers. Bull. Am. Meteorol. Soc. 2025, 106, E1295–E1302. [Google Scholar] [CrossRef]
  2. Sheng, C.; Bocchini, P. An Improved Physics-Based Hurricane Track Model over the North Atlantic Basin with Its Application for Wind-Hazard Assessment. J. Struct. Eng. 2025, 151, 04025122. [Google Scholar] [CrossRef]
  3. Cannon, J.B.; Whelan, A.W.; Johnson, A.S.; Wells, M.L. Mitigating tropical cyclone susceptibility in pecan (Carya illinoinensis) orchards. Sci. Hortic. 2025, 349, 114236. [Google Scholar] [CrossRef]
  4. Bethel, B.J.; Dong, C.; Wang, J.; Cao, Y. An analysis of surface waves in the Caribbean Sea based on a high-resolution numerical wave model. Ocean Model. 2024, 190, 102377. [Google Scholar] [CrossRef]
  5. Martinez, B.; Da Silva, B.F.; Aristizabal-Henao, J.J.; Denslow, N.D.; Osborne, T.Z.; Morrison, E.S.; Bianchi, T.S.; Bowden, J.A. Increased levels of perfluorooctanesulfonic acid (PFOS) during Hurricane Dorian on the east coast of Florida. Environ. Res. 2022, 208, 112635. [Google Scholar] [CrossRef] [PubMed]
  6. Cantine, M.; Orzechowski, E.; Stein, N.; Lincoln, T.; Hibner, B.; Present, T.; Thorpe, M.; Strauss, J.; Rumbelsperger, A.M.B.; Knoll, A.H.; et al. Rapid growth of a carbonate island over the last millennium. Sedimentology 2024, 71, 2119–2143. [Google Scholar] [CrossRef]
  7. Grey, S.; Liu, Y.; Simmons, J. Hurricane surge and inundation in the Bahamas, part 2: Flood risk assessment. J. Flood Risk Manag. 2025, 18, e13022. [Google Scholar] [CrossRef]
  8. Miyamoto, Y.; Yamaura, T.; Yoshida, R.; Yashiro, H.; Tomita, H.; Kajikawa, Y. Precursors of deep moist convection in a subkilometer global simulation. J. Geophys. Res. Atmos. 2016, 121, 12080–12088. [Google Scholar] [CrossRef]
  9. Jiang, D.; Huang, B.; Miao, Q.; Sun, H.; Wang, Z. Typhoon wind and wave numerical forecasting optimization in the South China Sea based on observation data. Nat. Hazards 2025, 121, 9653–9677. [Google Scholar] [CrossRef]
  10. Shanahan, T.; Fitzgerald, B. Wind–Wave Misalignment in Irish Waters and Its Impact on Floating Offshore Wind Turbines. Energies 2025, 18, 372. [Google Scholar] [CrossRef]
  11. Sreejith, M.; Remya, P.G.; Sreelakshmi, S.; Kumar, B.P.; Malavika, S.; Nair, T.M.B.; Kumar, T.S. A Performance Evaluation of CMIP6 Wind Fields for Robust Forcing in Indian Ocean Wave Climate Studies. Int. J. Clim. 2025, 45, e8744. [Google Scholar] [CrossRef]
  12. Dai, Y.; Abhishek, L.; Gong, Y.; Wu, X.; Sheng, B.; Zhao, W. Variations in Present and Future Hourly Extreme Rainfall: Insights from High-Resolution Data and Novel Temporal Disaggregation Model. Water 2024, 16, 3463. [Google Scholar] [CrossRef]
  13. Atkinson, J.; Smith, J.M.; Bender, C. Sea-Level Rise Effects on Storm Surge and Nearshore Waves on the Texas Coast: Influence of Landscape and Storm Characteristics. J. Waterw. Port Coast. Ocean Eng. 2013, 139, 98–117. [Google Scholar] [CrossRef]
  14. Sakazaki, T.; Fujiwara, M.; Zhang, X.; Hagan, M.E.; Forbes, J.M. Diurnal tides from the troposphere to the lower mesosphere as deduced from TIMED/SABER satellite data and six global reanalysis data sets. J. Geophys. Res. Atmos. 2012, 117. [Google Scholar] [CrossRef]
  15. Babagolimatikolaei, J. A comparative study of the sensitivity of an ocean model outputs to atmospheric forcing: ERA-Interim vs. ERA5 for Adriatic Sea Ocean modelling. Dyn. Atmos. Ocean. 2025, 109, 101525. [Google Scholar] [CrossRef]
  16. Ding, M.; Zhang, L.; Dou, T.; Huang, Y.; Luo, Y.; Lyu, J.; Xiao, C. On the Shallowing of Antarctic Low-Level Temperature Inversions Projected by CESM-LE under RCP8.5. J. Meteorol. Res. 2024, 38, 586–599. [Google Scholar] [CrossRef]
  17. King, J.C.; Marshall, G.J.; Colwell, S.; Arndt, S.; Allen-Sader, C.; Phillips, T. The performance of the ERA-Interim and ERA5 atmospheric reanalyses over Weddell Sea pack ice. J. Geophys. Res. Ocean. 2022, 127, e2022JC018805. [Google Scholar] [CrossRef]
  18. Munsi, A.; Kesarkar, A.; Bhate, J.; Panchal, A.; Singh, K.; Kutty, G.; Giri, R. Rapidly intensified, long duration North Indian Ocean tropical cyclones: Mesoscale downscaling and validation. Atmos. Res. 2021, 259, 105678. [Google Scholar] [CrossRef]
  19. Sahu, H.; Burman, P.K.D.; Gnanamoorthy, P.; Song, Q.; Zhang, Y.; Wang, H.; Chen, Y.; Wang, S. Estimating latent heat flux of subtropical forests using machine learning algorithms. Meteorol. Appl. 2025, 32, e70023. [Google Scholar] [CrossRef]
  20. Mooney, P.A.; Mulligan, F.J.; Fealy, R. Comparison of ERA-40, ERA-Interim and NCEP/NCAR reanalysis data with observed surface air temperatures over Ireland. Int. J. Climatol. 2011, 31, 545–557. [Google Scholar] [CrossRef]
  21. Decker, M.; Brunke, M.A.; Wang, Z.; Sakaguchi, K.; Zeng, X.; Bosilovich, M.G. Evaluation of the reanalysis products from GSFC, NCEP, and ECMWF using flux tower observations. J. Clim. 2012, 25, 1916–1944. [Google Scholar] [CrossRef]
  22. Wang, C.; Graham, R.M.; Wang, K.; Gerland, S.; Granskog, M.A. Comparison of ERA5 and ERA-Interim near-surface air temperature, snowfall and precipitation over Arctic sea ice: Effects on sea ice thermodynamics and evolution. Cryosphere 2019, 13, 1661–1679. [Google Scholar] [CrossRef]
  23. Tarek, M.; Brissette, F.P.; Arsenault, R. Evaluation of the ERA5 reanalysis as a potential reference dataset for hydrological modelling over North America. Hydrol. Earth Syst. Sci. 2020, 24, 2527–2544. [Google Scholar] [CrossRef]
  24. Lv, X.; Yuan, D.; Ma, X.; Tao, J. Wave characteristics analysis in Bohai Sea based on ECMWF wind field. Ocean Eng. 2014, 91, 159–171. [Google Scholar] [CrossRef]
  25. Mondal, I.; Das, A.; Hossain, S.A.; Jose, F.; Altuwaijri, H.A. Climate change-induced vulnerability assessment for the Florida Coast using hybrid machine learning models. Ecol. Indic. 2025, 171, 113242. [Google Scholar] [CrossRef]
  26. Wang, K.; Chen, J.; Valseth, E.; Wells, G.; Bettadpur, S.; Jones, C.E.; Dawson, C. Subtle land subsidence elevates future storm surge risks along the Gulf Coast of the United States. J. Geophys. Res. Earth Surf. 2024, 129, e2024JF007858. [Google Scholar] [CrossRef]
  27. Klotzbach, P.J.; Wood, K.M.; Bell, M.M.; Blake, E.S.; Bowen, S.G.; Caron, L.P.; Collins, J.M.; Gibney, E.J.; Schreck, C.J., III; Truchelut, R.E. A hyperactive end to the Atlantic hurricane season October–November 2020. Bull. Am. Meteorol. Soc. 2022, 103, E110–E128. [Google Scholar] [CrossRef]
  28. Shi, J.; Hu, C.; Cannizzaro, J.; Barnes, B.; Zhang, Y.; Lembke, C.; Le Henaff, M. Intensification of Hurricane Idalia by a river plume in the eastern Gulf of Mexico. Environ. Res. Lett. 2025, 20, 024050. [Google Scholar] [CrossRef]
  29. Mao, S.; Shropshire, T.; He, R. Quantifying surface shelf water export in the southern middle Atlantic Bight using a Lagrangian particle tracking approach. J. Geophys. Res. Ocean. 2024, 129, e2023JC020752. [Google Scholar] [CrossRef]
  30. Monica, S.B.; Wallace, D.J.; Wallace, E.J.; Du, X.; Dee, S.G.; Anderson, J.B. 4500-year paleohurricane record from the Western Gulf of Mexico, Coastal Central TX, USA. Mar. Geol. 2024, 473, 107303. [Google Scholar] [CrossRef]
  31. Lodise, J.; Merrifield, S.; Collins, C.; Rogowski, P.; Behrens, J.; Terrill, E. Global climatology of extratropical cyclones from a new tracking approach and associated wave heights from satellite radar altimeter. J. Geophys. Res. Ocean. 2022, 127, e2022JC018925. [Google Scholar] [CrossRef]
  32. Manchia, C.M.; Mulligan, R.P. Hurricane wind-driven surface waves on a narrow continental shelf and exposed coast. Cont. Shelf Res. 2022, 237, 104681. [Google Scholar] [CrossRef]
  33. Ayyad, M.; Orton, P.M.; El Safty, H.; Chen, Z.; Hajj, M.R. Ensemble forecast for storm tide and resurgence from Tropical Cyclone Isaias. Weather. Clim. Extrem. 2022, 38, 100504. [Google Scholar] [CrossRef]
  34. Bu, J.; Wang, Q.; Ni, J. Estimating sea surface swell height using a hybrid model combining CNN, ConvLSTM, and FCN based on spaceborne GNSS-R data from the CYGNSS mission. GPS Solut. 2024, 28, 133. [Google Scholar] [CrossRef]
  35. Wang, X.; Jiang, L.; Guo, Z.; Xie, X.; Li, L.; Gong, K.; Hu, J. Influence of meteorological reanalysis field on air quality modeling in the Yangtze River Delta, China. Atmos. Environ. 2024, 318, 120231. [Google Scholar] [CrossRef]
  36. Vance, J.M.; Currie, K.; Zeldis, J.; Dillingham, P.W.; Law, C.S. An empirical MLR for estimating surface layer DIC and a comparative assessment to other gap-filling techniques for ocean carbon time series. Biogeosciences 2022, 19, 241–269. [Google Scholar] [CrossRef]
  37. Nadezhda, V.; Anna, R.; Egor, D. High-resolution bias-corrected precipitation data over South Siberia, Russia. Atmos. Res. 2021, 254, 105528. [Google Scholar]
  38. Xiong, Y.; Zhao, T.; Lü, H.; Peng, Z.; Zheng, J.; Bai, Y.; Yao, P.; Guo, P.; Song, P.; Wei, Z.; et al. FengYun-3 meteorological satellites’ microwave radiation Imagers enhance land surface temperature measurements across the diurnal cycle. ISPRS J. Photogramm. Remote. Sens. 2025, 222, 204–224. [Google Scholar] [CrossRef]
  39. Xue, Y.; Li, J.; Menzel, W.P.; Borbas, E.; Ho, S.; Li, Z.; Li, J. Characteristics of satellite sampling errors in total precipitable water from SSMIS, HIRS, and COSMIC observations. J. Geophys. Res. Atmos. 2019, 124, 6966–6981. [Google Scholar] [CrossRef]
  40. Hillebrand, F.L.; Bremer, U.F.; Arigony-Neto, J.; da Rosa, C.N.; Mendes, C.W.; Costi, J.; de Freitas, M.W.D.; Schardong, F. Comparison between atmospheric reanalysis models ERA5 and ERA-Interim at the North Antarctic Peninsula region. Ann. Assoc. Am. Geogr. 2021, 111, 1147–1159. [Google Scholar] [CrossRef]
  41. Zhang, X.; Xie, J.; Yao, G.; Cao, C. Extraction of Significant Wave Height from Spreading First-Order Bragg Peaks of Shipborne High-Frequency Surface Wave Radar with a Single Antenna. Remote. Sens. 2025, 17, 1006. [Google Scholar] [CrossRef]
  42. Dimitriadou, K.; Olsen, B.T.; Badger, M.; Hasager, C.B. SAR offshore wind fields in the Gulf of Lion. J. Appl. Meteorol. Climatol. 2025, 64, 353–364. [Google Scholar] [CrossRef]
  43. Chen, B.F.; Davis, C.A.; Kuo, Y.H. Examination of the combined effect of deep-layer vertical shear direction and lower-tropospheric mean flow on tropical cyclone intensity and size based on the ERA5 reanalysis. Mon. Weather Rev. 2021, 149, 4057–4076. [Google Scholar] [CrossRef]
  44. Duan, Y.; Liu, H.; Feng, M.; Song, X.; Li, K.; Liu, L.; Liu, B.; Yang, G.; Yu, W. The onset process of the 2018/2019 Indonesian–Australian summer monsoon: The importance of the air–sea interaction. Front. Mar. Sci. 2023, 9, 1089493. [Google Scholar] [CrossRef]
  45. Dymova, O.; Markova, N. Numerical Estimation of the Black Sea Circulation near the Continental Slope Using SKIRON and ERA5 Atmospheric Forcing. Environ. Sci. Proc. 2023, 25, 61. [Google Scholar]
  46. Ricker, M.; Kousal, J.; Günther, H.; Behrens, A.; Staneva, J. The Introduction of Observation-Based Wave Physics into the Wind-Wave Model WAM: Wave Assessments for a Semi-Enclosed Basin. Ocean Model. 2025, 197, 102564. [Google Scholar] [CrossRef]
  47. Gao, Y.; Guan, C.; Sun, J.; Xie, L. Tropical cyclone wind speed retrieval from dual-polarization Sentinel-1 EW mode products. J. Atmos. Ocean. Technol. 2020, 37, 1713–1724. [Google Scholar] [CrossRef]
  48. Pereira, A.G.; Melo, D.L.; Dantas, M.I.S.; Barros, L.O.; Pereira, Á.M.; Ferreira, N.S.; Morais, R.S.; Seluchi, M.E. Strengths and limitations of the Gálvez-Davison Index in forecasting tropical and subtropical convection over South America. Atmos. Res. 2025, 323, 108184. [Google Scholar] [CrossRef]
  49. Abdikerimova, G.; Khamitova, D.; Kassymova, A.; Bissengaliyeva, A.; Nurova, G.; Aitimov, M.; Shynbergenov, Y.A.; Yessenova, M.; Bekbayeva, R. Development of a Model for Soil Salinity Segmentation Based on Remote Sensing Data and Climate Parameters. Algorithms 2025, 18, 285. [Google Scholar] [CrossRef]
  50. Paul, S.; Alemohammad, H. Examining the performance of precipitation products in characterizing the Indian summer monsoon rainfall (ISMR) using triple collocation. J. Hydrol. 2025, 657, 133136. [Google Scholar] [CrossRef]
  51. Huang, W.; Wu, X.; Xia, H.; Zhu, X.; Gong, Y.; Sun, X. Reinforcement learning-based multi-model ensemble for ocean waves forecasting. Front. Mar. Sci. 2025, 12, 1534622. [Google Scholar] [CrossRef]
  52. Zhao, P.; He, Z. Evaluation of ERA5 reanalysis temperature data over the Qilian Mountains of China. J. Mt. Sci. 2024, 22, 198–209. [Google Scholar] [CrossRef]
  53. Chen, X.; Ni, Y.; Shen, Y.; Ying, Y.; Wang, J. The research on the applicability of different typhoon wind fields in the simulation of typhoon waves in China’s coastal waters. Front. Mar. Sci. 2024, 11, 1492521. [Google Scholar] [CrossRef]
  54. Ascenso, G.; Ficchì, A.; Giuliani, M.; Scoccimarro, E.; Castelletti, A. Downscaling, bias correction, and spatial adjustment of extreme tropical cyclone rainfall in ERA5 using deep learning. Weather. Clim. Extrem. 2024, 46, 100724. [Google Scholar] [CrossRef]
  55. Wang, X.; Xu, M.; Kang, S.; Li, X.; Han, H.; Li, X. Comprehensive applicability evaluation of four precipitation products at multiple spatiotemporal scales in Northwest China. J. Arid Land 2024, 16, 1232–1254. [Google Scholar] [CrossRef]
  56. Tian, W.; Wu, Y.L.; Lin, C.; Zhang, J.G.; Sian, K.T.C.L.K. Assessing the Applicability of Multi-Source Precipitation Products over the Chinese Mainland and Its Seven Regions. J. Trop. Meteorol. 2024, 30, 275–288. [Google Scholar] [CrossRef]
  57. Park, I.; Ho, C.H.; Kim, J.; Kim, J.H.; Jun, S.Y. Development of a monthly PM2.5 forecast model for Seoul, Korea, based on the dynamic climate forecast and a convolutional neural network algorithm. Atmos. Res. 2024, 309, 107576. [Google Scholar] [CrossRef]
  58. Wilczak, J.M.; Akish, E.; Capotondi, A.; Compo, G.P. Evaluation and Bias Correction of the ERA5 Reanalysis over the United States for Wind and Solar Energy Applications. Energies 2024, 17, 1667. [Google Scholar] [CrossRef]
  59. Zhu, J.; Dai, Q.; Xiao, Y.; Liu, C.; Zhang, J.; Zhuo, L.; Han, D. Microphysics-based rainfall energy estimation using remote sensing and reanalysis data. J. Hydrol. 2023, 627, 130314. [Google Scholar] [CrossRef]
  60. Dhmane, L.A.; Moustadraf, J.; Rachdane, M.; Saidi, M.E.; Benjmel, K.; Amraoui, F.; Ezzaouini, M.A.; Sliman, A.A.; Hadri, A. Spatiotemporal Assessment and Correction of Gridded Precipitation Products in North Western Morocco. Atmosphere 2023, 14, 1239. [Google Scholar] [CrossRef]
  61. Kreuwel, F.P.; Knap, W.; Schmeits, M.; de Arellano, J.V.G.; van Heerwaarden, C.C. Forecasting day-ahead 1-minute irradiance variability from numerical weather predictions. Sol. Energy 2023, 258, 57–71. [Google Scholar] [CrossRef]
  62. Han, Z.; Yue, C.; Liu, C.; Gu, W.; Tang, Y.; Li, Y. Evaluation on the applicability of ERA5 reanalysis dataset to tropical cyclones affecting Shanghai. Front. Earth Sci. 2022, 16, 1025–1039. [Google Scholar] [CrossRef]
  63. Wang, R.; Zhou, R.; Yang, S.; Li, R.; Pu, J.; Liu, K.; Deng, Y. A New Algorithm for Estimating Low Cloud-Base Height in Southwest China. J. Appl. Meteorol. Climatol. 2022, 61, 1179–1197. [Google Scholar] [CrossRef]
  64. Liu, Y.; Zhuo, L.; Pregnolato, M.; Han, D. An assessment of statistical interpolation methods suited for gridded rainfall datasets. Int. J. Climatol. 2021, 42, 2754–2772. [Google Scholar] [CrossRef]
  65. Frid, S.E.; Lisitskaya, N.V.; Popel, O.S. Results of Analysis of the Applicability of Satellite Observations and Reanalysis Data for Simulations of Autonomous Solar Power Systems. Dokl. Phys. 2019, 64, 381–383. [Google Scholar] [CrossRef]
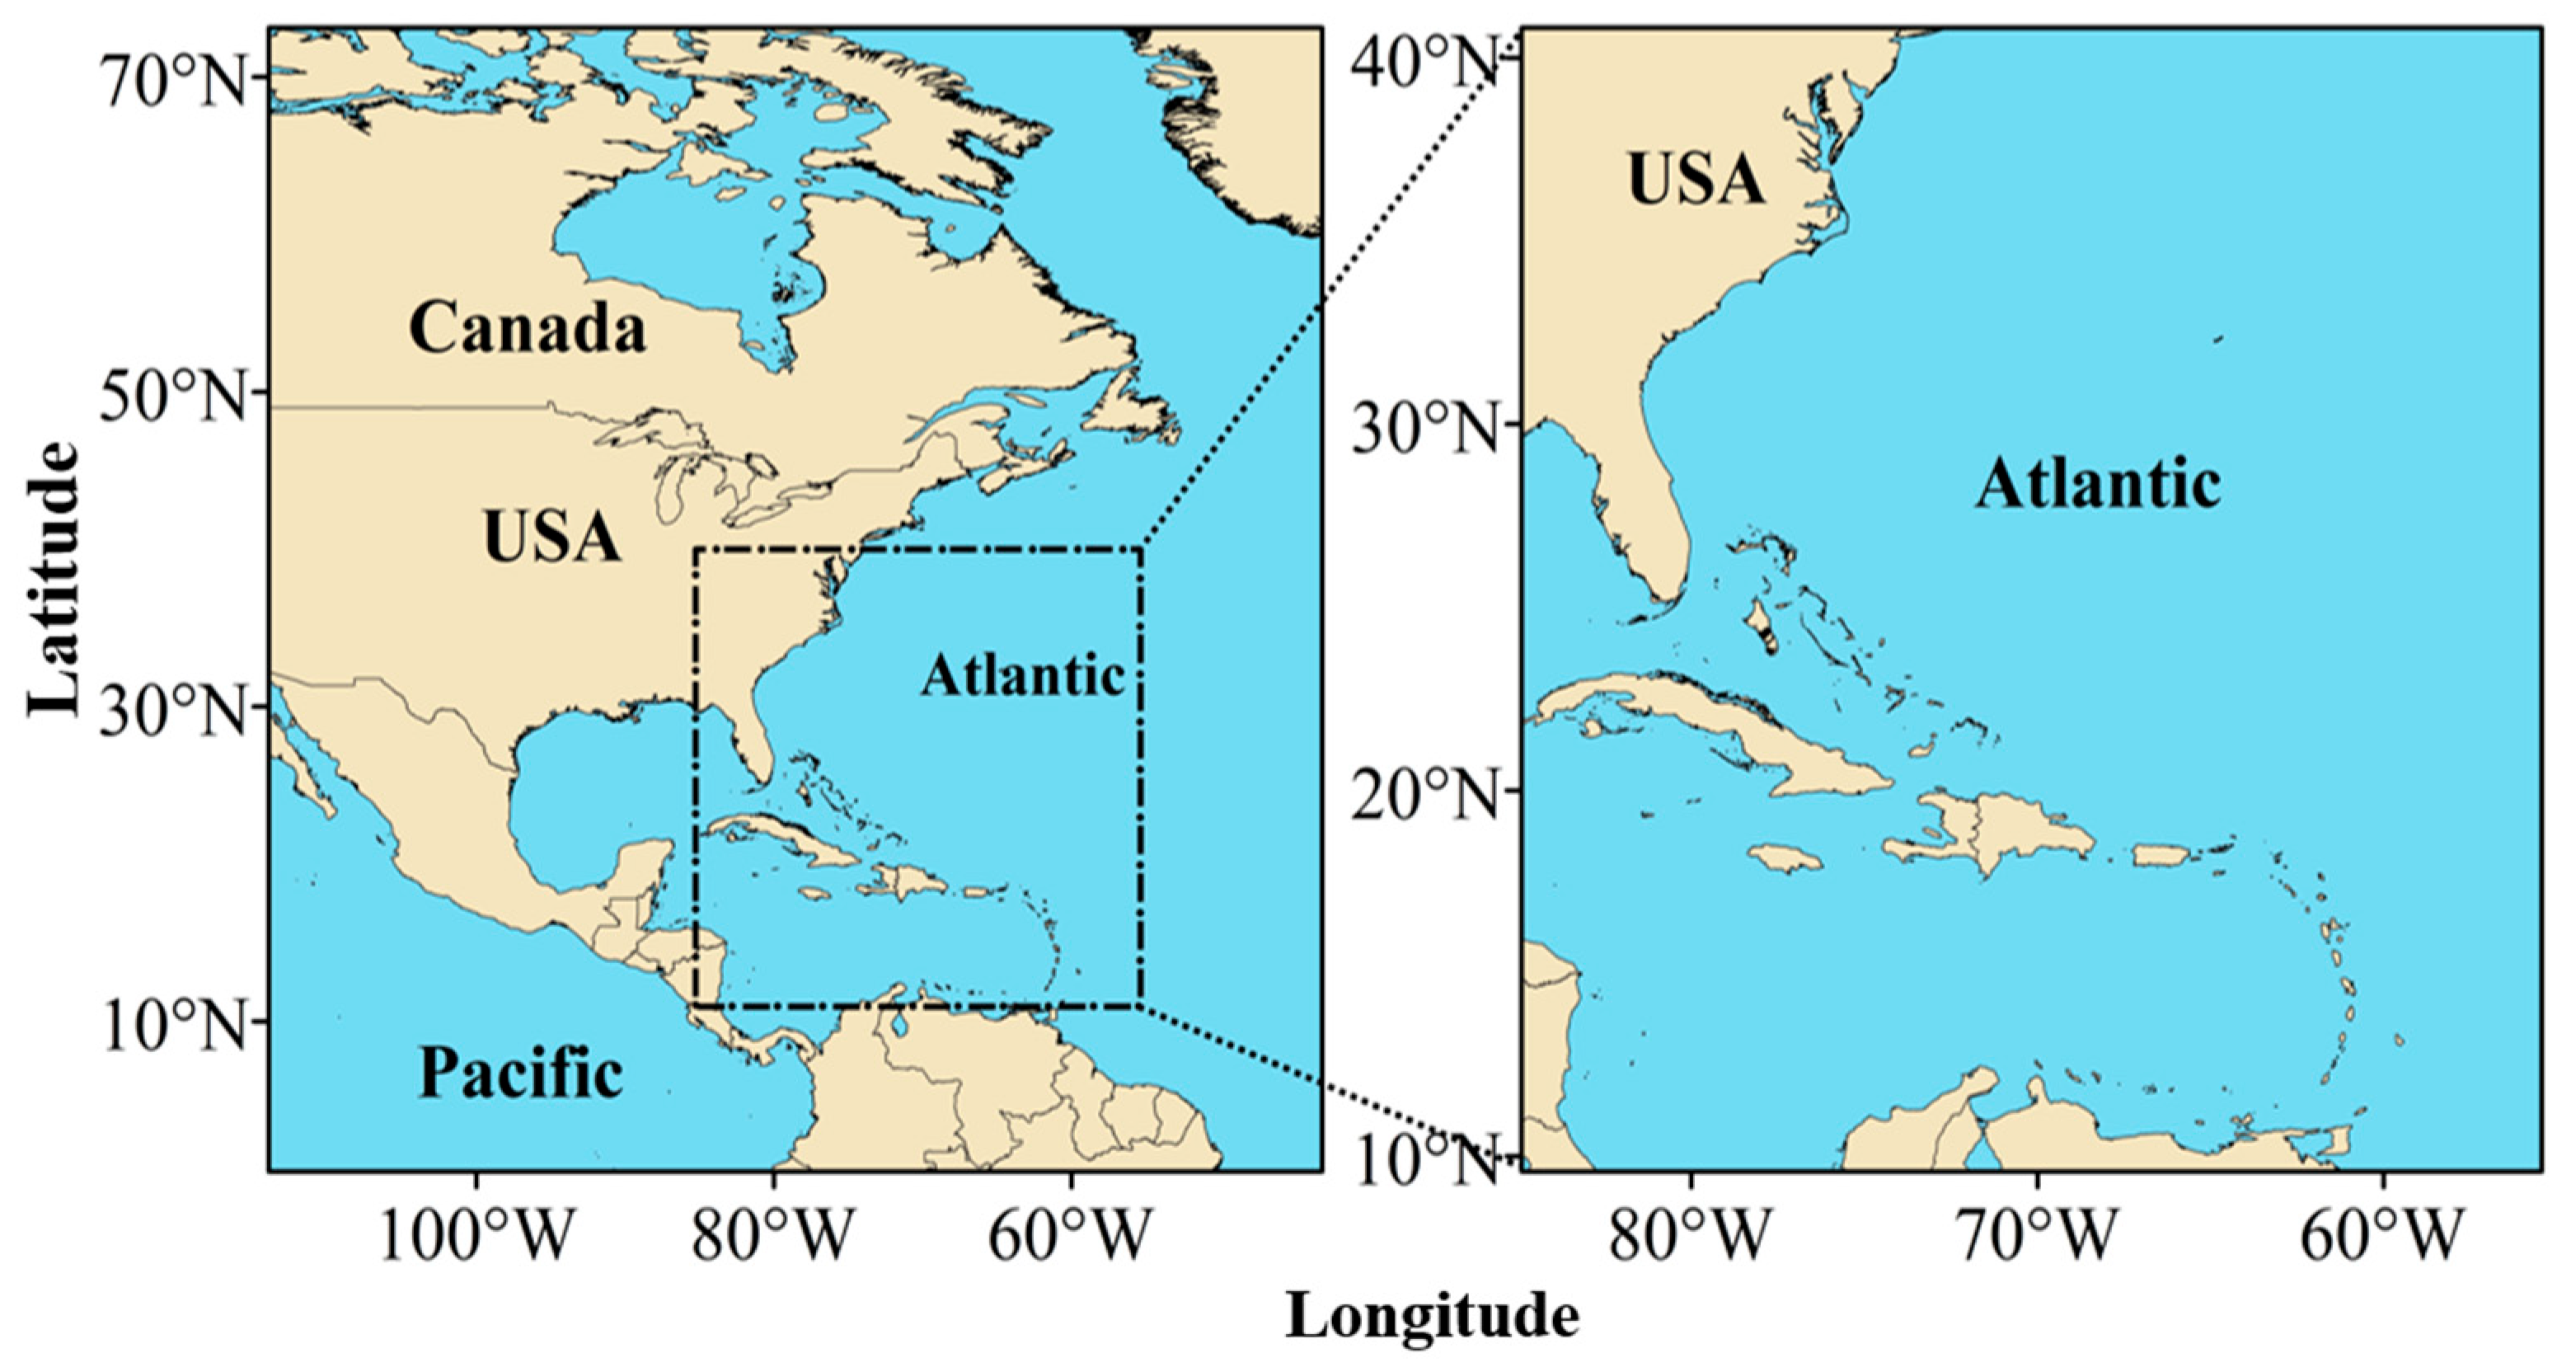
Figure 1. Study area. The figure on the right shows the study area, which is outlined in dotted lines in the figure on the left.
Atmosphere 16 00967 g001
Figure 2. Buoy position and SPGF1 buoy position. In the figure, the vertical axis is latitude and the horizontal axis is longitude.
Atmosphere 16 00967 g002
Figure 3. Movement trajectory of hurricane “ISAIAS”. In Figure 3, the colored dots represent different hurricane categories of the SSP, and the solid lines indicate the movement trajectory of ISAIAS. 0804 is UTC 4 August. Hurricane information is sourced from the National Hurricane Center (NHC), specifically the tropical cyclone report on “ISAIAS”.
Atmosphere 16 00967 g003
Figure 4. The spatial distribution of wind speed at three distinct phases, before, during and after hurricane “ISAIAS”. (ad) illustrates the timeline, 15 July (a) prior to “ISAIAS”, 31 July (b) and 3 August (c) during the hurricane, and 15 August (d) following the hurricane. In the figure, WS is wind speed, the vector diagram shows wind direction, color is wind speed (unit: m/s), the vertical axis is latitude, the horizontal axis is longitude, and the solid line is the hurricane path.
Atmosphere 16 00967 g004
Figure 5. WS of buoys and ERA5 during “ISAIAS”. (af) displays the buoy data as a dashed line and the ERA5 data as a solid line. The variations in wind speed at various stations are represented by (af). The horizontal axis indicates time (072913 is 29 July at 13:00), while the vertical axis shows wind speed in m/s.
Atmosphere 16 00967 g005
Figure 6. “ISAIAS” spatial distribution of SST before–during–after. (ad) present the SST prior to “ISAIAS” on 15 July (a), during the events on 31 July (b) and 3 August (c), and subsequent to 15 August (d). In the study area, the arrows indicate wind speed direction, the solid line depicts the hurricane’s actual path, and the vertical axis represents the SST. The color transitions from blue to red, with a gradual increase in SST (°C).
Atmosphere 16 00967 g006
Figure 7. During “ISAIAS” the buoy and ERA5 SST. In (af), dashed lines represent buoy data, and solid lines represent ERA5 data. The horizontal coordinate is time/h, for example, 072902 is 29 July 02:00, and the vertical coordinate is temperature, in °C.
Atmosphere 16 00967 g007
Figure 8. Spatial distribution of SSP before, during, and after “ISAIAS”. (ad) show the SSP of the study area before “ISAIAS” on 15 July (a); during 31 July (b) and 3 August (c); and after 15 August (d). In Figure 8, the SSP is represented by a vertical coordinate, with an arrow indicating the direction of wind speed and a solid line showing the actual path of the hurricane; colors range from blue to red, indicating that the SSP increases gradually, in hPa.
Atmosphere 16 00967 g008
Figure 9. SSP of buoys and ERA5 during “ISAIAS”. (ah) display dashed lines for buoy data and solid lines for ERA5 data. The horizontal axis represents time/h, for instance, 072902 is 29 July at 02:00, while the vertical axis indicates SSP, in hPa.
Atmosphere 16 00967 g009
Table 1. Coordinates of the buoy site.
Bouy410044100841010410294205942060MISP4SPGF1VAKF1
Lat (°N)32.50231.40028.87832.80315.30016.43418.09026.70425.731
Lon (°W)79.09980.86678.46779.62467.48363.32967.93978.99580.162
Table 2. Data information.
DataStyleSourceSpatial ResolutionTimeTemporal Resolution
SST
WS
SSP
BouyNOBC/29 July–5 August 1 h
SST
WS
SST
ERA5ECMWF0.25 × 0.25°15 July–15 August
Hurricane information/NHC/
European Centre for Medium-Range Weather Forecasts (ECMWF), (https://cds.climate.copernicus.eu/, accessed on 1 September 2024). National Data Buoy Center (NDBC), (https://www.ndbc.noaa.gov/, accessed on 1 September 2024). National Hurricane Center (NHC), (https://www.nhc.noaa.gov/, accessed on 1 September 2024).
Table 3. Correlation analysis of WS of ERA5 with buoy data.
StationCCRMSEMD
420590.851.320.45
SPGF10.522.92−0.99
410100.822.141.12
410080.901.740.75
410040.902.50−0.38
410290.941.96−0.51
Table 4. Correlation analysis of SST and buoy data for ERA5.
StationCCRMSEMD
420600.561.04−1.03
MISP40.491.22−1.10
VAKF10.762.07−2.03
410100.741.18−1.17
410040.731.57−1.55
410290.361.34−1.23
Table 5. Correlation analysis between SSP and buoy data for ERA5.
StationCCRMSEMD
420600.960.810.52
420590.940.750.25
VAKF10.970.62−0.45
SPGF10.902.011.27
410100.950.880.51
410080.930.900.53
410040.990.920.89
410290.980.78−0.08
Disclaimer/Publisher’s Note: The statements, opinions and data contained in all publications are solely those of the individual author(s) and contributor(s) and not of MDPI and/or the editor(s). MDPI and/or the editor(s) disclaim responsibility for any injury to people or property resulting from any ideas, methods, instructions or products referred to in the content.