Abstract
This study assesses the efficacy of the ZJWARMS model’s AI-based post-processing correction method for temperature and wind speed forecasts in complex terrain. By analyzing 72 h forecasts at four stations with varying elevations (from 273 m to 1327 m) in the Liuchun Lake region during December 2021–December 2022, the study found that AI-based corrections substantially enhanced both forecast accuracy and stability. The results indicate that, after correction, temperature forecast accuracy at all stations exceeded 99%, with the most notable relative gains at higher elevations (up to 48.1%). The mean absolute error (MAE) for temperature declined from 3.08 °C to below 0.8 °C at Octagonal Palace, and from 3.29 °C to below 0.6 °C at Mountaintop. Wind speed forecast accuracy also increased from approximately 60–70% to nearly 100%, with MAE generally constrained to the range of 0.2–0.4 m/s. In terms of extreme error control, the number of samples with temperature errors exceeding ±2 °C was markedly reduced. For instance, at Mountainside, the count dropped from 127 to 0. Extreme wind speed errors were also effectively eliminated. After correction, error distributions became more concentrated, and both temporal stability and spatial consistency showed notable improvement. These gains enhance operational forecasting and risk management in mountainous regions, for example, through threshold-based wind-hazard alerts and support for mountain-road icing, by providing more reliable, high-confidence guidance.
1. Introduction
Numerical Weather Prediction (NWP) models simulate atmospheric evolution through the numerical integration of motion equations derived from fundamental physical principles, including dynamics and thermodynamics [1,2]. These models are grounded in robust theoretical frameworks and well-structured systems, providing unparalleled advantages in terms of physical consistency and predictive reliability. Consequently, NWP constitutes the cornerstone of modern weather forecasting and is extensively utilized in operational meteorological services worldwide [2,3,4]. Notable NWP systems include the following: the ECMWF developed by the European Centre for Medium-Range Weather Forecasts, noted for its high accuracy and stability; the GFS from the U.S. National Weather Service, recognized for its openness and frequent updates; the WRF developed by NCAR, widely applied in mesoscale meteorological research; China’s domestically developed GRAPES model, which serves as the backbone of national operational forecasting systems; and ICON by the German Weather Service, representing a new generation of high-performance global models.
Forecast errors in NWP systems tend to be significantly higher in complex terrains, such as mountainous and plateau regions, compared to flatlands [1,3]. Systematic biases in these areas often manifest as significant errors in near-surface wind and temperature forecasts [3,5]. Although increasing horizontal resolution and improving physical parameterizations have alleviated some of the forecast biases in mountainous regions, model accuracy in high-altitude complex terrain continues to be markedly inferior [3]. These challenges underscore the pressing need for tailored strategies to improve forecasting performance in complex terrain environments.
Located in the mountainous western region of Zhejiang Province, Liuchun Lake is characterized by complex topography and highly variable microclimatic conditions. As tourism development in the area continues, demand for high-resolution and refined meteorological services—particularly in key variables such as temperature and wind speed—has grown substantially. The regional forecast system currently in use is ZJWARMS, a regionally developed mesoscale operational model. Based on WRF-ADAS, ZJWARMS operates with a 3 km horizontal resolution and 36 vertical layers, assimilating multi-source observational data every 12 h and providing hourly outputs for 72 h forecasts. The system has served a vital role in typhoon response and weather support for major events. However, due to the steep and highly variable terrain around Liuchun Lake, ZJWARMS continues to fall short of practical accuracy standards in simulating temperature and wind fields, highlighting the necessity for further enhancements.
In recent years, artificial intelligence (AI) methods have demonstrated clear advantages in correcting NWP forecasts. Unlike traditional approaches that rely on linear assumptions, machine learning algorithms can automatically learn complex nonlinear relationships between model outputs and observational data, making them particularly suitable for bias correction in complex terrain [6]. Nevertheless, much of the existing AI-based bias-correction literature focuses on urban or gently varying landscapes and often presupposes dense gridded predictors; few studies systematically examine elevation-driven errors or operational deployment under sparse station networks in mountainous basins like Liuchun Lake. Given that site-specific data often serve as the foundation for forecasting in such areas, this study focuses on AI-based correction methods at the station level for temperature and wind speed. By constructing data-driven models, this study aims to enhance the adaptability of the ZJWARMS system in topographically complex areas.
There are two primary approaches to improving the accuracy of NWP: (1) enhancing the quality of initial conditions and (2) refining the model’s physical structure. The former is typically achieved through advanced data assimilation techniques. Methods such as ensemble Kalman filtering and four-dimensional variational assimilation integrate large volumes of observational data to significantly reduce initial condition errors [7,8,9]. Meanwhile, improving the parameterization schemes of physical processes within the model can contribute significantly to reducing systematic errors. For example, optimizing the combination of physical parameterizations has been shown to significantly improve the simulation of typhoon tracks and intensity [10]. These enhancements are fundamental to model development but often involve extended research timelines and intricate implementation processes. (2) As a vital complementary approach, post-processing corrections to model output have garnered growing attention in recent years [11]. Traditional methods, such as Model Output Statistics, correct systematic biases by establishing linear relationships between observations and model forecasts [12]. However, these methods are generally based on linear assumptions and are often inadequate in addressing nonlinear errors introduced by complex terrain [13,14]. Accordingly, it remains insufficiently documented whether modern, lightweight AI post-processing can provide robust, temporally stable corrections across elevations under real-time operational constraints.
In contrast, AI techniques have demonstrated substantial potential in correcting NWP outputs. For example, Cho et al. [15] employed algorithms such as Random Forests and Support Vector Machines to correct extreme temperature biases in urban areas, achieving better results than linear methods. Li et al. [16] proposed the Model Output Machine Learning method, which significantly reduced the mean squared error in 2-meter temperature forecasts over Beijing. Rasp and Lerch [17] further demonstrated that artificial neural networks outperformed traditional Bayesian Model Averaging for ensemble forecast post-processing tasks. For wind speed forecasts, Pang et al. [18] applied a multi-task deep learning model to correct 10-meter wind speeds over the South China Sea, resulting in a marked improvement in forecast accuracy.
Notably, grid-based and station-based corrections represent two primary approaches in forecast post-processing. Grid-based correction preserves spatial continuity and structural coherence in the forecast field, which makes it particularly suitable for gridded forecast products [19]. However, it relies heavily on dense observational networks or reanalysis datasets for training purposes, which leads to substantial implementation costs and limits its applicability in real-time operations. In contrast, station-based correction focuses on individual observational sites and is characterized by simpler implementation and greater computational efficiency, thereby enhancing its suitability for operational applications [20,21]. This unresolved balance between spatial coherence and operational feasibility further motivates a focused assessment at the station level in complex terrain.
Bias-correction studies have improved numerical weather prediction (NWP) forecasts across many settings, yet important gaps remain in mountainous basins: prior work often (i) evaluates limited station networks or single-elevation settings and (ii) devotes insufficient attention to how error structures vary with elevation and time. Systematic applications of ZJWARMS in complex terrain are also scarce. To enhance forecast accuracy for ZJWARMS in the Liuchun Lake region, we leverage the area’s complex topography by deploying meteorological stations across multiple elevations, providing robust observational support for model evaluation and correction. We analyzed ZJWARMS forecast performance and error characteristics in complex terrain using four stations at distinct altitudes—Octagonal Palace, Zheyuanli, and the Mountainside and Mountaintop near Liuchun Lake. On this basis, we develop machine-learning-based bias-correction methods for station-level temperature and wind-speed forecasts, aiming to improve both accuracy and temporal stability. Specifically, we (1) characterize ZJWARMS biases and error structures across the selected elevations; (2) develop and validate station-level machine-learning bias-correction models for temperature and wind speed; and (3) evaluate the accuracy gains and temporal stability of the corrected forecasts over the study period.
2. Data and Methodology
2.1. Data Sources
The study employs 72 h forecast products generated by the ZJWARMS model, released daily at 08:00, covering temperature, wind speed, and precipitation data from December 2021 to December 2022 at a spatial resolution of 3 km × 3 km. To evaluate the effectiveness of the correction method, both original and AI-corrected model outputs are incorporated into the analysis for comparative evaluation.
Observational data, coincident with the forecast-model evaluation period (i.e., December 2021 to December 2022), were obtained from the Longyou County Meteorological Bureau and used in this study. These data include hourly records of temperature and wind speed from four automatic weather stations situated in and around the Liuchun Lake region: Octagonal Palace, Zheyuanli, Mountainside, and Mountaintop. A map of the observation sites is provided in Figure 1, with further details in Table 1.
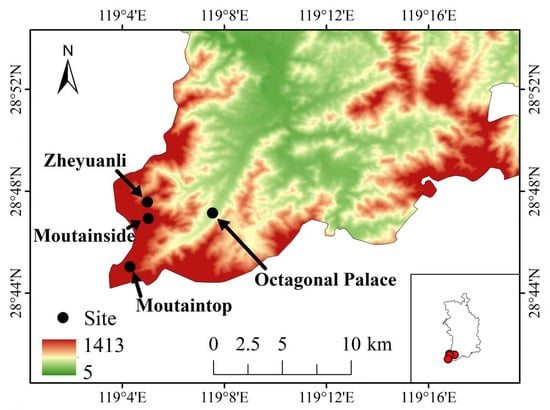
Figure 1.
Topographic map of the Liuchun Lake region and distribution of meteorological stations.

Table 1.
Basic information of meteorological stations in the Liuchun Lake region.
All station data have undergone quality control and are suitable for model error correction and evaluation analysis.
2.2. Correction Method Overview
2.2.1. XGBoost
Extreme Gradient Boosting (XGBoost) is an ensemble learning algorithm based on the gradient boosting technique. The core idea behind XGBoost is to iteratively train multiple weak learners, with each round correcting the residuals of the previous model. Using weighted learning and gradient descent, it optimizes each weak learner, ultimately building an efficient ensemble model.
XGBoost uses a second-order Taylor expansion of the loss function, incorporating regularization terms to effectively prevent model overfitting. XGBoost is represented as a summation of k base models, with its prediction result being expressed by the following formula:
where is the predicted result, is the predicted score for sample , k is the total number of trees, represents the k-th decision tree, and denotes the function space corresponding to the decision trees.
The loss function is defined as
The training loss of the sample is denoted by , and represents the regularization term for the j-th tree.
The optimized objective function and the Gain function based on the second-order Taylor expansion are given as follows:
In the formula, represents the loss reduction in the objective function after the tree split; is the sum of the first-order derivatives of the loss function; is the sum of the second-order derivatives of the loss function; is the regularization term; and are the sums of the first-order derivatives of the loss function for the left and right nodes, respectively; and are the sums of the second-order derivatives of the loss function for the left and right nodes, respectively; is the regularization coefficient.
In this study, we choose XGBoost over alternatives such as random forest, support vector regression, and shallow neural networks because it (i) captures non-linear interactions while controlling complexity through L1/L2 regularization and tree-structure penalties, (ii) is robust and computationally efficient for station-level tabular data, facilitating real-time operations, and (iii) provides interpretable diagnostics (e.g., feature importance/SHAP) that help analyze elevation-dependent biases in complex terrain. In preliminary trials on our training/validation splits, XGBoost delivered stable and generally superior RMSE/MAE, so we adopt it as the primary correction model.
2.2.2. Correction Model
In this study, the XGBoost algorithm is employed to construct correction models for temperature and average wind speed. All models are developed within the Python 3.9 environment and mainly consist of the following key procedures: data preprocessing, feature selection, data standardization, dataset partitioning, model construction and parameter optimization, meteorological element correction, and error evaluation.
The specific correction procedure comprises the following steps:
- 1.
- Data Preprocessing:To correct the model outputs, the ZJWARMS model data is first spatiotemporally matched with observational data from meteorological stations, thereby generating a dataset in which each model prediction corresponds to an observed value.
- 2.
- Feature Selection:Based on the spatiotemporally matched dataset, the correlation between each observed meteorological variable (e.g., air temperature, 10 m wind speed, wind direction, daily maximum and minimum temperatures, etc.) and the target variables for correction (2 m air temperature, 10 m wind speed) is statistically analyzed. Observed variables with strong correlations are selected as input features for the correction model. Additionally, the uncorrected model outputs (2 m air temperature and 10 m wind speed) are also included as input features. The target labels of the correction model are the observed 2 m air temperature and 10 m wind speed.
- 3.
- Dataset Partitioning:The first 80% of the dataset is used for model training and parameter tuning, while the remaining 20% is reserved for evaluating the correction performance. To respect temporal dependence and avoid information leakage, no shuffling was performed. Within the 80% training portion, hyperparameters were tuned using a chronologically ordered validation split (i.e., the last segment of the training period), rather than random K-fold cross-validation.
- 4.
- Model Construction and Parameter Optimization:The XGBoost algorithm is implemented using the xgb library, with the objective function defined as the root mean square error (RMSE). Bayesian optimization is employed to determine the optimal values for key hyperparameters, including maximum tree depth (max_depth), number of trees (n_estimators), learning rate (learning_rate), subsample ratio (subsample), and feature subsample ratio (colsample_bytree), in order to obtain the best-performing correction model. Overfitting control relies on XGBoost’s built-in regularization and stochasticity (e.g., lambda/alpha, max_depth, min_child_weight, subsample, colsample_bytree), and all tuning uses the above time-ordered validation split.
- 5.
- Meteorological Element Correction:The optimized correction model is applied to the test set inputs to produce corrected (standardized) values of 2-m air temperature and 10-m wind speed, which are subsequently transformed back to the original scale through inverse standardization.
- 6.
- Error Evaluation:The correction results are assessed using various evaluation metrics, including error (E), RMSE, MAE, and accuracy. Here, “accuracy” denotes a tolerance-based hit rate: a forecast is counted as accurate when the absolute error for 2 m temperature is within 2 °C and the absolute error for 10 m wind speed is within 2 m/s. These thresholds were fixed in advance based on (i) approximate observational/representativeness uncertainty at the stations, (ii) the resolution and decision needs of user-facing products, and (iii) common practice in station-level post-processing. To facilitate international comparisons, we additionally report RMSE, MAE, and skill scores relative to the raw ZJWARMS forecasts.
2.2.3. Forecast Error Analysis and Evaluation Methods of the Model
To assess the performance of the ZJWARMS model in forecasting air temperature and wind speed, this study extracts 2-meter air temperature and 10-meter wind speed data from the gridded forecast fields at four stations: Octagonal Palace, Zheyuanli, Mountainside, and Mountaintop. The model’s performance is evaluated using a set of statistical metrics, including error (E), MAE, and forecast accuracy. The specific formulas are as follows:
(1) Error (E)
In the formula, represents the difference between the forecast and the observed value, where denotes the forecasted value and denotes the actual (observed) value. By taking the forecast time as the X-axis and the temperature (or wind speed) difference as the Y-axis, boxplots can be constructed to visually illustrate the distribution characteristics of the error E.
(2) MAE
Using forecast time as the X-axis and the MAE as the Y-axis, line charts can be drawn to illustrate the forecasting performance of the model.
Forecast accuracy refers to the ratio of the number of correct forecasts to the total number of forecasts made by the model. According to the guidelines of the Weather Analysis and Forecast Quality Verification Methods issued by the China Meteorological Administration: For air temperature, forecasts are considered accurate when . For wind speed, forecasts are considered accurate when .
3. Results and Analysis
3.1. Evaluation of ZJWARMS Forecasts and AI-Corrected Products
3.1.1. Temporal Evolution of Temperature Forecast Accuracy
This study assesses the performance of the ZJWARMS correction method in complex terrain by analyzing four stations at varying elevations: Octagonal Palace (273 m), Zheyuanli (608 m), Mountainside (903 m), and Mountaintop (1327 m). Temperature and wind speed forecasts over a 72 h period were assessed for accuracy, with emphasis on stability and improvements before and after correction. The accuracy profiles for these stations are shown in Figure 2, which reveal substantial improvements following correction.
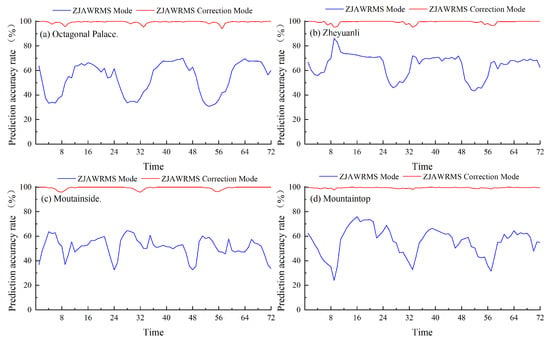
Figure 2.
The 72 h temperature forecast accuracy for model output and corrected results: (a) Octagonal Palace. (b) Zheyuanli. (c) Mountainside. (d) Mountaintop.
(1) Forecast accuracy was greatly improved after correction, especially at higher elevations. Octagonal Palace’s accuracy rose from 53.7% to 99.3%, Zheyuanli’s from 64.5% to 99.4%, and Mountainside and Mountaintop from 51.3% and 55.7% to 99.4% and 99.5%, respectively. The 48.1% and 43.8% gains at higher altitudes underscore the correction’s effectiveness in mitigating terrain-induced biases.
(2) Temporal stability was markedly improved. In the original model, station-dependent troughs recurred with an approximately daily cadence. At Mountaintop, distinct minima appear near 9, 33, and 57 h at approximately 24–33%; Mountainside exhibits dips near 24 and 48 h at about 33%; Octagonal Palace demonstrates a pronounced early-hour decline between 4 and 8 h at roughly 33–39%, followed by troughs near 31 h (34%) and 53 h (31%); whereas Zheyuanli exhibits only modest undulations. After correction, these valleys largely disappeared, and the curves became smoother, with most lead times approaching 100%.
(3) The sustainability of high forecast accuracy was also enhanced. Prior to correction, Octagonal Palace’s accuracy did not exceed 85% until after hour 45, and Mountaintop maintained this level for only 8 h. After correction, all stations maintained accuracy above 85% throughout the entire 72 h forecast period.
The MAE in the 72 h temperature forecasts at the four stations is presented in Figure 3. As a threshold-free diagnostic, the 72 h MAE trajectories offer a complementary perspective that is independent of any accuracy threshold and quantify both the magnitude and the temporal stability of errors. Comparing pre- and post-correction errors highlights the improvements achieved through AI-based correction.
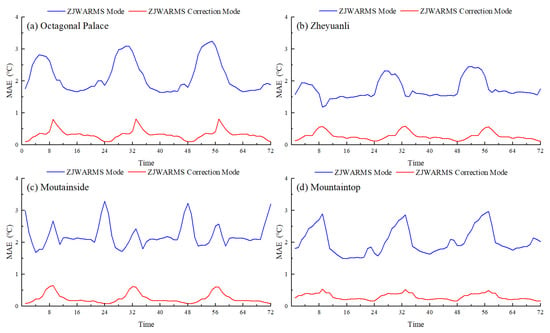
Figure 3.
The 72 h temperature forecast MAE for model output and corrected results: (a) Octagonal Palace. (b) Zheyuanli. (c) Mountainside. (d) Mountaintop.
(1) Errors were significantly reduced, with greater improvements observed at higher elevations. Octagonal Palace’s MAE dropped from 3.08 °C to below 0.80 °C, representing a 70–95% reduction. Zheyuanli’s MAE decreased from 2.46 °C to below 0.6 °C. Mountainside and Mountaintop recorded MAE values below 0.6 °C, compared to pre-correction peaks of 3.00 °C and 3.29 °C, indicating that higher elevations derive greater benefit from the correction.
(2) Temporal fluctuations in error were reduced, resulting in smoother error curves. Before correction, all stations exhibited error peaks at different forecast hours. Post-correction, these peaks were diminished, and error curves were smoother and showed consistently low errors.
(3) The persistence of low errors was enhanced. MAE remained below 0.6 °C for the majority of the forecast period, ensuring more reliable predictions. In contrast, pre-correction errors persisted for longer durations and exhibited greater variability, increasing the risk of extreme deviations.
3.1.2. Temporal Evolution of Wind Speed Forecast Accuracy
The progression of wind speed forecast accuracy at the four stations is illustrated in Figure 4.
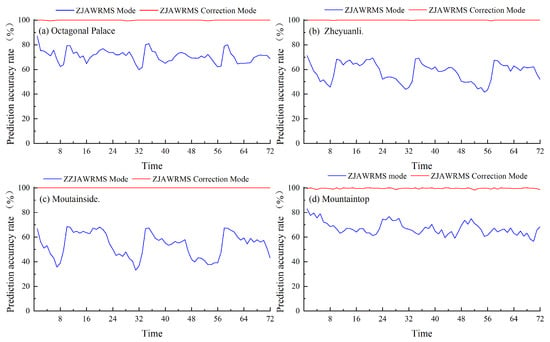
Figure 4.
The 72 h wind forecast accuracy for model output and corrected results: (a) Octagonal Palace. (b) Zheyuanli. (c) Mountainside. (d) Mountaintop.
(1) Forecast accuracy was significantly improved after correction. Octagonal Palace’s accuracy rose from 70.9% to nearly 100%, Zheyuanli’s from 58.1% to 100%, and Mountainside and Mountaintop from 53.8% and 67.2% to over 99.5%. These improvements underscore the effectiveness of the correction method in complex terrain.
(2) Temporal variability in accuracy was notably reduced. Before correction, accuracy exhibited substantial fluctuations, with drops to 33.2% at hour 31 at Mountainside and 39.9% at Zheyuanli. After correction, accuracy was markedly stabilized, approaching 100% for most forecast hours.
(3) The duration of high accuracy was substantially extended. Prior to correction, Octagonal Palace maintained accuracy above 75% for 11 h, Mountainside for 6 h, and Zheyuanli and Mountaintop for less than 1 h. After correction, all stations maintained accuracy above 85% for the entire 72 h forecast period.
The 72 h progression of MAE in wind speed forecasts, demonstrating the efficacy of the correction approach, is illustrated in Figure 5. As a threshold-free diagnostic, Figure 5 confirms the sustained reduction and stabilization of errors, independent of the accuracy threshold.
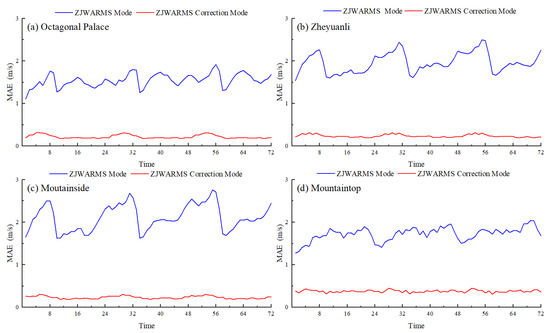
Figure 5.
The 72 h wind forecast MAE for model output and corrected results: (a) Octagonal Palace. (b) Zheyuanli. (c) Mountainside. (d) Mountaintop.
(1) Errors were substantially reduced at all stations. Octagonal Palace’s MAE dropped from 1.1–1.9 m/s to 0.18–0.31 m/s, Zheyuanli’s from 1.5–2.4 m/s to 0.20–0.32 m/s, and Mountainside and Mountaintop at Liuchun Lake from 2.7 m/s and 2.6 m/s to 0.18–0.44 m/s, respectively—reflecting reductions exceeding 80%. These results indicate the effectiveness of the correction, especially in complex terrain.
(2) Temporal stability was improved. After correction, errors were markedly stabilized and smoothed. For example, at Mountainside, the error peaked at 2.68 m/s before correction and remained around 0.28 m/s afterward. This illustrates the correction’s capacity to mitigate large errors and enhance forecast consistency.
(3) Low error levels were maintained throughout the forecast period. The MAE remained within the range of 0.2–0.3 m/s at all stations, with minimal fluctuations. In contrast, the original model exhibited multiple pronounced error peaks. This validates the correction’s stable performance over time.
Overall, the ZJWARMS correction method substantially enhances wind speed forecast accuracy, stabilizes performance, and reduces errors—particularly in high-altitude regions—demonstrating strong potential for application in mountainous terrain.
3.2. Error Distribution and Correction Effect Under Forecast Accuracy Extremes
To evaluate systematic bias and the effectiveness of the correction across thermal regimes, we compare error distributions between the periods of maximum- and minimum-temperature accuracy and report pre- and post-correction results (Figure 6 and Figure 7).

Figure 6.
Frequency distribution of forecast error intervals at maximum temperature accuracy: (a) original ZJWARMS model. (b) after correction.

Figure 7.
Frequency distribution of forecast error intervals at minimum temperature accuracy: (a) original ZJWARMS model. (b) after correction.
(1) Concentration and tails. After correction, errors at all four stations are highly concentrated within −2 to 2 °C: approximately 95%–100% during the maximum-temperature period and about 98%–100% during the minimum-temperature period. Before correction, tails are heavier during the minimum-temperature period; for example, at Octagonal Palace the fraction below −2 °C is 60.4%, and at the Mountaintop the fraction above 2 °C is 74.8%, both clearly exceeding the corresponding tails in the maximum-temperature period.
(2) Elevation effects and magnitude of improvement. Gains are most pronounced at higher-elevation sites. At the Mountainside and Mountaintop, errors in the 2–4 °C and larger bins are nearly eliminated after correction; the central share within −2 to 2 °C reaches 99.5% and 99.6% during the maximum-temperature period and 100% and 97.9% during the minimum-temperature period. Low-elevation sites also exhibit substantial tail reduction; during the minimum-temperature period, cold tails shrink from several tens of percent to zero.
(3) Sign structure and consistency. Post-correction distributions in both periods are narrowly unimodal around zero, with extreme errors °C essentially eliminated. Small positive and negative errors become more balanced; most stations exhibit a slight cold bias, whereas Mountaintop remains slightly warm during the minimum-temperature period.
In summary, the correction consistently increases concentration and suppresses tails, with larger gains during the minimum-temperature period. Improvements are greatest at higher elevations, indicating robust error-control performance across thermal regimes and terrain.
Consistent with these distributional changes, Figure 8 depicts the spread of errors in terms of the standard deviation across the two accuracy periods. At all four stations—Octagonal Palace, Zheyuanli, Mountainside, and Mountaintop—the pre-correction dispersion is greater during the minimum-temperature period, with standard deviations generally ranging from 1.6 to 3.0 °C, distinctly higher than the 1.4 to 1.9 °C observed in the maximum-temperature period. Octagonal Palace and Zheyuanli exhibit the largest values. After correction, the dispersion decreases markedly in both periods: during the maximum-temperature period, values cluster around 0.3 to 0.8 °C, while the minimum-temperature period converges to a comparable range.
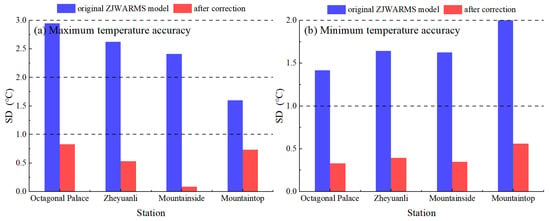
Figure 8.
Standard deviation of temperature forecast errors at accuracy maxima and minima. (a) Maximum accuracy. (b) Minimum accuracy.
The elevation signal remains evident. The improvement is particularly pronounced at the Mountainside, where the standard deviation decreases to approximately 0.09 °C, whereas Octagonal Palace and Zheyuanli achieve reductions of about 70–80%. Overall, the higher-elevation sites—Mountainside and Mountaintop—retain the smallest post-correction spread, whereas the lower-elevation sites exhibit minor residual variability but remain substantially constrained. These results parallel the narrowed histograms in Figure 6 and Figure 7 and demonstrate robust error control across both thermal regimes and terrain.
To evaluate systematic bias and the effectiveness of the wind-speed correction, we compare error distributions across the periods of maximum and minimum forecast accuracy. The pre- and post-correction results are presented in Figure 9 and Figure 10.

Figure 9.
Frequency distribution of forecast error intervals at maximum wind speed accuracy (a) Original ZJWARMS model. (b) After correction.

Figure 10.
Frequency distribution of forecast error intervals at minimum wind speed accuracy (a) Original ZJWARMS Model, (b) After Correction.
(1) The corrected distributions exhibit strong concentration with minimal tails. After correction, errors at all four sites are almost entirely confined within ± in both periods; coverage is approximately 99–100%, with only 0.7% at Mountaintop in the 2–4 m/s range and 0.4%. Before correction, multiple sites exhibited heavy tails, particularly during the minimum-accuracy period; for example, Mountainside recorded 46.4% in the 2–4 m/s range, and Mountaintop displayed substantial negative deviations below −2 m/s.
(2) The elevation signal reveals the largest improvements at higher altitudes. At the Mountainside and Mountaintop, errors exceeding 2 m/s are effectively eliminated in both periods, and the central band increases to nearly complete coverage. Low-elevation sites also exhibit pronounced tail suppression, and during the minimum-accuracy period the large positive tails at Octagonal Palace and Zheyuanli diminish to near zero.
(3) The post-correction sign structure is balanced and consistent across both periods. The distributions become narrowly unimodal around zero, and extreme errors with absolute values of at least 4 m/s are eliminated. Within ±2 m/s, the sign split varies by site but remains close to balanced; most sites lean slightly positive during the minimum-accuracy period, whereas Mountaintop leans slightly negative.
In summary, the correction confines wind-speed errors within ±2 m/s, suppresses both positive and negative tails, and mitigates elevation-related biases under both favorable and adverse conditions, with the largest gains during the minimum-accuracy period.
Consistent with the distributional changes described above, Figure 11 depicts the dispersion of wind-speed errors in terms of the standard deviation across the two accuracy periods. Before correction, all four stations—Octagonal Palace, Zheyuanli, Mountainside, and Mountaintop—exhibit greater dispersion during the minimum-wind-speed period, with standard deviations of approximately 1.4–2.0 m/s, compared with about 1.0–1.8 m/s in the maximum-wind-speed period. Variability is more pronounced at the higher-elevation sites, with Mountainside and Mountaintop generally occupying the upper end of the range.
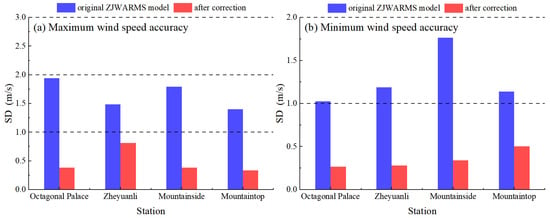
Figure 11.
Standard deviation of wind speed forecast errors at accuracy maxima and minima. (a) Maximum accuracy. (b) Minimum accuracy.
After correction, the dispersion decreases markedly in both periods. During the maximum-wind-speed period, the standard deviation converges to 0.27–0.50 m/s, while during the minimum-wind-speed period it declines to approximately 0.33–0.56 m/s. Representative gains include the Mountainside decreasing from approximately 1.77 to 0.34 m/s and the Mountaintop during the minimum-wind-speed period declining from about 2.00 to 0.56 m/s; Octagonal Palace and Zheyuanli likewise achieve reductions on the order of 70–80%. Overall, the higher-elevation sites retain a small residual spread but are substantially compressed, whereas the lower-elevation sites narrow further, indicating robust error control across wind regimes and terrain.
3.3. Evolution of Extreme Error Samples and Evaluation of Correction Effectiveness
Figure 12 presents a comparison of the model’s bias suppression capability before and after correction by depicting the time-varying number of extreme error samples—defined as forecasts with absolute temperature errors exceeding ±2 °C—across a 72 h forecast period.
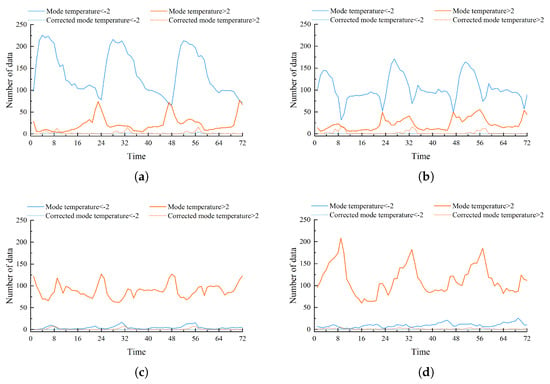
Figure 12.
Number of forecast temperature error samples greater than +2 °C and less than −2 °C: (a) Octagonal Palace. (b) Zheyuanli. (c) Mountainside. (d) Mountaintop.
(1) Extreme errors were significantly reduced following correction. At Liuchun Lake, the number of extreme cases dropped from 127 to 0 at Mountainside and from 208 to 6 at Mountaintop, representing a reduction exceeding 95%. Octagonal Palace and Zheyuanli exhibited a comparable reduction, with the majority of time steps exhibiting zero extreme errors post-correction.
(2) The correction was particularly effective at lower elevations. Octagonal Palace and Zheyuanli recorded a higher number of extreme errors before correction, especially cold-biased ones. After correction, these errors were effectively suppressed. High-altitude stations also showed improvement; however, residual extreme errors persisted during several critical forecast hours.
(3) Extreme errors were initially concentrated and later stabilized. Prior to correction, most extreme errors occurred during the first 30 forecast hours. After correction, the frequency of extreme errors declined sharply, and most stations recorded between 0 and 2 such cases, indicating sustained improvement over time.
In conclusion, the correction method effectively suppresses extreme errors and enhances forecast stability, particularly at lower elevations, while also demonstrating notable gains at higher altitudes.
Figure 13 illustrates wind speed forecast errors exceeding m/s or falling below m/s over the 72 h period, comparing pre- and post-correction conditions.
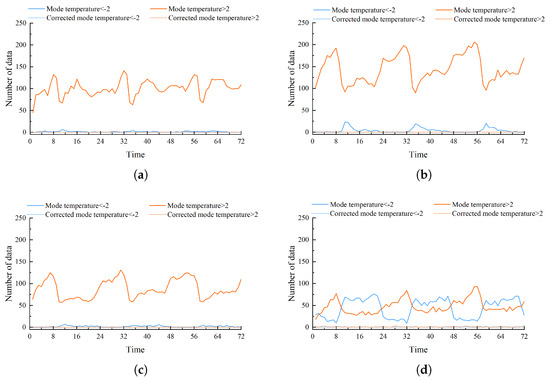
Figure 13.
Number of wind speed forecast error samples greater than m/s and less than m/s: (a) Octagonal Palace. (b) Zheyuanli. (c) Mountainside. (d) Mountaintop.
(1) High wind speed errors were substantially reduced, thereby enhancing forecast accuracy. Prior to correction, large forecast deviations occurred frequently, particularly at higher elevations. For example, Octagonal Palace recorded 45 and 141 instances of high-error forecasts at hours 1 and 32, respectively. After correction, these errors were effectively eliminated, with the count at Octagonal Palace dropping from 45 to 0—demonstrating a marked improvement in forecast performance.
(2) Negative wind speed errors were also reduced, particularly at high-altitude sites. Before correction, such errors were common at Mountaintop, including 76 occurrences during hour 21. After correction, negative errors were largely eliminated, with only isolated cases remaining, such as one at Octagonal Palace during hour 30.
(3) Residual errors at Mountaintop indicate a need for continued model refinement. Despite overall gains, Mountaintop continues to exhibit persistent large deviations across multiple periods, whereas low-elevation sites record near-zero errors. Future work will focus on Mountaintop regimes by employing stability and boundary-layer diagnostics, near-surface wind shear, and terrain descriptors derived from a digital elevation model, including slope, curvature, exposure, and roughness length. We will evaluate regime-aware correction, tail-sensitive objectives, and calibrated uncertainty intervals to further mitigate extremes in complex terrain.
In conclusion, the ZJWARMS correction method demonstrates clear improvements in wind speed forecast accuracy, particularly in complex terrain, with the most notable gains observed at lower elevations, while continued refinement remains necessary for high-elevation sites.
4. Conclusions and Discussion
This study systematically evaluated the forecasting performance of the ZJWARMS model in complex terrain using daily 72 h forecasts of temperature, wind speed, and precipitation from December 2021 to December 2022, along with observational data from four representative automatic weather stations located in and around Liuchun Lake, Longyou County. By integrating an AI-based correction method, this study comprehensively analyzed improvements in forecast accuracy, stability, and extreme error suppression. The main conclusions are as follows:
(1) Forecast accuracy was significantly improved, with more pronounced enhancements observed at higher elevations. For example, Mountaintop’s temperature forecast accuracy increased from 55.7% to 99.5%, and wind speed accuracy rose from 67.2% to over 99.6%, demonstrating the correction’s particular effectiveness in high-altitude areas.
(2) MAE was substantially reduced, thereby enhancing forecast reliability. For instance, temperature MAE at Mountaintop decreased from 3.29 °C to below 0.6 °C, and wind speed MAE at Zheyuanli decreased from 2.4 m/s to below 0.32 m/s. Temporal fluctuations in error were also reduced, indicating improved forecast stability.
(3) The number of extreme error samples was significantly reduced, thereby enhancing the robustness of the forecasting system. Temperature error samples exceeding ±2 °C dropped to single digits at most stations, and extreme wind speed errors were effectively eliminated. Even during the worst forecast periods, forecast accuracy was maintained above 97.8%.
(4) The correction method exhibited strong adaptability, benefiting both low- and high-altitude stations. Although minor residual errors remained at higher elevations (e.g., occasional large wind speed errors at Mountaintop), the model exhibited excellent overall performance, with particularly notable improvements observed during the first 30 h of the forecast period.
Compared with traditional correction methods commonly applied in complex terrain, such as linear MOS and distribution mapping, the AI-based approach more effectively captures nonlinear and elevation-dependent effects, consistent with the greater MAE reductions and fewer extremes observed in this study. The findings depend on station data quality and on the coverage of the training data within a single region and period; therefore, extension to other terrains and climate regimes should be approached with caution. The observed reductions in dispersion and extremes hold practical value, as they enable higher-confidence operational guidance, including wind hazard alerts and support for mountain road icing.
In summary, the AI-enhanced ZJWARMS forecasting system demonstrates substantial improvements in temperature and wind speed prediction performance in complex terrain by enhancing forecast accuracy, consistency, and stability. It offers robust technical support for weather forecasting in mountainous regions. Future work will evaluate the integration of topographic and atmospheric stability descriptors with regime-aware correction to reduce residual summit errors and to assess transferability across regions.
Author Contributions
Conceptualization, Q.Z. and Y.S.; Methodology, Y.S. and Y.W.; Software, S.M.; Validation, Q.Z., Y.W., and S.M.; Formal analysis, Y.W.; Investigation, Z.Z. and T.Q.; Resources, Z.M., S.Y., and X.L.; Data curation, L.H.; Writing—original draft preparation, Q.Z. and Y.W.; Writing—review and editing, Y.S., S.M., and Z.Z.; Visualization, Y.S. and Y.W.; Supervision, Z.M. and X.L.; Project administration, Q.Z.; Funding acquisition, S.Y. All authors have read and agreed to the published version of the manuscript.
Funding
This research was funded by the Sichuan Provincial Science and Technology Program Project (Grant No. 2024YFTX0016), “Research on Forest Fire Warning Technology and Development of Meteorological Risk Level Forecasting System in Muli Tibetan Area”, and the Ningxia Natural Science Foundation Project (Grant No. 2023AAC02088), “Research on Intelligent Monitoring and Assessment Technology for Wind Disaster Indicators in Facility Greenhouses”. The APC was funded by the above projects.
Institutional Review Board Statement
Not applicable.
Informed Consent Statement
Not applicable.
Data Availability Statement
The data supporting reported results can be found upon reasonable request from the corresponding author. Due to privacy or ethical restrictions, the data cannot be publicly shared.
Conflicts of Interest
The authors declare no conflict of interest.
Abbreviations
The following abbreviations are used in this manuscript:
| MAE | Mean Absolute Error |
| NWP | Numerical Weather Prediction |
| AI | Artificial Intelligence |
| XGBoost | Extreme Gradient Boosting |
| RMSE | Root Mean Square Error |
References
- Xue, W.; Yu, H.; Tang, S.; Huang, W. Relationships between terrain features and forecasting errors of surface wind speeds in a mesoscale numerical weather prediction model. Adv. Atmos. Sci. 2024, 41, 1161–1170. [Google Scholar] [CrossRef]
- Zhou, S.; Gao, C.Y.; Duan, Z.; Xi, X.; Li, Y. A robust error correction method for numerical weather prediction wind speed based on Bayesian optimization, variational mode decomposition, principal component analysis, and random forest: VMD-PCA-RF (version 1.0.0). Geosci. Model Dev. 2023, 16, 6247–6266. [Google Scholar] [CrossRef]
- Liu, C.; Sun, J.; Yang, X.; Jin, S.; Fu, S. Evaluation of ECMWF precipitation predictions in China during 2015–18. Weather. Forecast. 2021, 36, 1043–1060. [Google Scholar] [CrossRef]
- Barthlott, C.; Zarboo, A.; Matsunobu, T.; Keil, C. Impacts of combined microphysical and land-surface uncertainties on convective clouds and precipitation in different weather regimes. Atmos. Chem. Phys. 2022, 22, 10841–10860. [Google Scholar] [CrossRef]
- Rotach, M.W.; Adams, K.; Adler, B.; Cermak, J.; Gohm, A.; Serafin, S. A collaborative effort to better understand, measure, and model atmospheric exchange processes over mountains (TEAMx). Bull. Am. Meteorol. Soc. 2022, 103, E1282–E1295. [Google Scholar] [CrossRef]
- Lagerquist, R.; McGovern, A.; Gagne II, D.J. Deep learning for spatially explicit prediction of synoptic-scale fronts. Weather. Forecast. 2019, 34, 1137–1160. [Google Scholar] [CrossRef]
- Houtekamer, P.L.; Zhang, F. Review of the ensemble Kalman filter for atmospheric data assimilation. Mon. Weather. Rev. 2016, 144, 4489–4532. [Google Scholar] [CrossRef]
- Bannister, R.N. A review of operational methods of variational and ensemble-variational data assimilation. Q. J. R. Meteorol. Soc. 2017, 143, 607–633. [Google Scholar] [CrossRef]
- Carrassi, A.; Bocquet, M.; Bertino, L.; Evensen, G. Data assimilation in the geosciences: An overview of methods, issues, and perspectives. Wiley Interdiscip. Rev. Clim. Change 2018, 9, e535. [Google Scholar] [CrossRef]
- Di, Z.; Duan, Q.; Shen, C.; Xie, Z. Improving WRF typhoon precipitation and intensity simulation using a surrogate-based automatic parameter optimization method. Atmosphere 2020, 11, 89. [Google Scholar] [CrossRef]
- Vannitsem, S.; Bremnes, J.B.; Demaeyer, J.; Evans, G.R.; Flowerdew, J.; Hemri, S.; Lerch, S.; Roberts, N.; Theis, S.; Atencia, A.; et al. Statistical postprocessing for weather forecasts: Review, challenges, and avenues in a big data world. Bull. Am. Meteorol. Soc. 2021, 102, E681–E699. [Google Scholar] [CrossRef]
- Glahn, H.R.; Lowry, D.A. The use of model output statistics (MOS) in objective weather forecasting. J. Appl. Meteorol. 1972, 11, 1203–1211. [Google Scholar] [CrossRef]
- Dueben, P.D.; Bauer, P. Challenges and design choices for global weather and climate models based on machine learning. Geosci. Model Dev. 2018, 11, 3999–4009. [Google Scholar] [CrossRef]
- Boukabara, S.A.; Krasnopolsky, V.; Stewart, J.Q.; Maddy, E.S.; Shahroudi, N.; Hoffman, R.N. Leveraging modern artificial intelligence for remote sensing and NWP: Benefits and challenges. Bull. Am. Meteorol. Soc. 2019, 100, ES473–ES491. [Google Scholar] [CrossRef]
- Cho, D.; Yoo, C.; Im, J.; Cha, D.H. Comparative assessment of various machine learning-based bias correction methods for numerical weather prediction model forecasts of extreme air temperatures in urban areas. Earth Space Sci. 2020, 7, e2019EA000740. [Google Scholar] [CrossRef]
- Li, H.; Yu, C.; Xia, J.; Wang, Y.; Zhu, J.; Zhang, P. A model output machine learning method for grid temperature forecasts in the Beijing area. Adv. Atmos. Sci. 2019, 36, 1156–1170. [Google Scholar] [CrossRef]
- Rasp, S.; Lerch, S. Neural networks for postprocessing ensemble weather forecasts. Mon. Weather. Rev. 2018, 146, 3885–3900. [Google Scholar] [CrossRef]
- Pang, C.; Song, T.; Sun, H.; Li, X.; Xu, D. A deep learning method for bias correction of wind field in the South China Sea. Front. Mar. Sci. 2024, 11, 1429057. [Google Scholar] [CrossRef]
- Han, L.; Chen, M.; Chen, K.; Chen, H.; Zhang, Y.; Lu, B.; Song, L.; Qin, R. A deep learning method for bias correction of ECMWF 24–240 h forecasts. Adv. Atmos. Sci. 2021, 38, 1444–1459. [Google Scholar] [CrossRef]
- Chang, J.; Peng, X.; Fan, G.; Che, Y. Error correction of numerical weather prediction with historical data. Acta Meteorol. Sin. 2015, 73, 341–354. (In Chinese) [Google Scholar]
- Xia, J.; Li, H.; Kang, Y.; Yu, C.; Ji, L.; Wu, L.; Lou, X.; Zhu, G.; Wang, Z.; Yan, Z.; et al. Machine learning-based weather support for the 2022 Winter Olympics. Adv. Atmos. Sci. 2020, 37, 927–932. [Google Scholar] [CrossRef]
Disclaimer/Publisher’s Note: The statements, opinions and data contained in all publications are solely those of the individual author(s) and contributor(s) and not of MDPI and/or the editor(s). MDPI and/or the editor(s) disclaim responsibility for any injury to people or property resulting from any ideas, methods, instructions or products referred to in the content. |
© 2025 by the authors. Licensee MDPI, Basel, Switzerland. This article is an open access article distributed under the terms and conditions of the Creative Commons Attribution (CC BY) license (https://creativecommons.org/licenses/by/4.0/).