Article

The Potential of Green Development and PM2.5 Emission Reduction for China’s Cement Industry

1
National Critical Zone Observatory of Red Soil Hilly Region in Qianyanzhou, Key Laboratory of Ecosystem Network Observation and Modeling, Institute of Geographic Sciences and Natural Resources Research, Chinese Academy of Sciences, Beijing 100101, China
2
The Zhongke-Ji’an Institute for Eco-Environmental Sciences, Ji’an 343000, China
3
State Key Laboratory of Hydrology-Water Resources and Hydraulic Engineering, Nanjing Hydraulic Research Institute, Nanjing 210029, China
Atmosphere 2023, 14(3), 482; https://doi.org/10.3390/atmos14030482
Submission received: 28 December 2022 / Revised: 15 February 2023 / Accepted: 17 February 2023 / Published: 28 February 2023

Abstract

:
The atmospheric dust caused by the cement industry is one of the main components of air pollutants. China is the largest producer and consumer of cement. It is challenging to balance cement needs and environmental protection. Based on the emission source data, this study examined the spatial and temporal patterns of PM2.5 by the cement industry’s contribution (PM2.5Cement). The annual value of PM2.5Cement decreased from 1.40 × 10⁶ µg/m3 in 2010 to 0.98 × 10⁶ µg/m3 in 2017, which was reduced by 30.31%. I used the standard deviation ellipse and gravity center transfer method and identified that the cement industry center shifted from the east to the midwest of China, where a high-density population exists and a large portion of the population is exposed to the air pollution. The geographical detector method was used to analyze the contribution of the natural environment, green development, and socioeconomic development to PM2.5Cement. The main driving factors were identified as the socioeconomic development and the traffic conditions in 2010, which was giving way to the regional independent innovation in 2017. The cement industry’s contributions to atmospheric PM2.5 vary spatially, suggesting that green development and optimized location for the cement industry are crucial to reducing the size of the population exposed to the pollutants.

1. Introduction

The cement industry is considered to be one of the energy, resource, CO2, and pollutant emission-intensive sectors; the caused dust is a main component of air pollution [1], and its particles contributed 92.5% PM2.5 and 61.0% PM10 [2]. In China, with high levels of PM2.5 pollution and a large population, the harm is extensive and far-reaching, including sickness and economic burdens [3], high risks for cancer [4], increased morbidity and mortality of respiratory [5,6], rebrovascular diseases [7], and, even worse, the impact on children [8,9]. Meanwhile, the dust emitted by the cement industry is classified as “mixed dust”, including silica, SO2, and other elements [10,11]. Silica content in the air directly determines the probability of pneumoconiosis [12]. Mahlet [13] found that 50.8% of cement factory workers suffered from chronic respiratory symptoms. Meanwhile, types of aerodynamic noise generated during the operation of equipment in the cement industry causes irreversible sensorineural hearing damage [14,15]. In addition, dust emitted by the cement industry is mostly composed of alkaline, which can easily cause the alkalization of surrounding land and affects plant growth [16]. Moreover, in the production of building materials, cement can result in high CO2 emissions that contribute to greenhouse gases’ accumulation and cause environmental pollution [17,18], reducing essential short-term health benefits.
China is the world’s largest cement producer and consumer (https://www.emis.com/, accessed on 12 March 2021) making up about 60% of global production (USGS, 2015). The pollutant emissions by the cement production are far higher than the air quality control standard [19,20,21,22,23,24]. The environmental pollution by the cement industry should not be underestimated under the requirement of advocating green development [25]. From 2013 to 2017, with the implementation of the toughest-ever clean air policy in China, significant declines in fine particle (PM2.5) concentrations occurred nationwide [26,27], but it is still far below the international standards. Linked in 2017 in mainland China, premature deaths and a loss of quality of life due to PM2.5, approximately a total of 852,000 and 19.98 million people, respectively, represented 30% of all victims worldwide [28]. Meanwhile, more cement output was demanded for infrastructure systems due to the ongoing urbanization in China. The conflict is inevitable between industrial development and environmental pollution [29].
In response, China launched the “Pollution Prevention and Control Battle” to control atmospheric pollution by focusing on limiting pollution emissions, adjusting industrial and energy structures, improving policies and regulations, exercising strict supervision and management, and strengthening scientific research [30,31,32]. The polluting industries seeking the “pollution refuge” phenomenon were evident in the local government department, where underdeveloped areas in the central and western regions accommodated portions of highly polluting industries from the eastern areas through “regional competition” and “policy depression.” The industrial agglomeration and pollution antagonistic zones were dominated by polluting industries; environmental risks were the greatest in these areas [33]. Therefore, it remains unknown whether PM2.5 concentration through cement production in China was significantly reduced or whether the drop was caused by regional transfer. More importantly, it is urgent to know what the main driving factors of such transfer are that should be formulated by region and pollutant industry to improve environmental quality. In this paper, I explore the cement industry in China and its spatial distribution of PM2.5 and target and adopt more reasonable and precise policies to reduce air pollution caused by the cement industry. My purposes were to understand (1) the temporal and spatial patterns of the cement industry and their contribution to regional air quality and (2) the main factors driving the spatiotemporal distribution of the cement industry in different regions. This study can provide a guidance for formulating corresponding policies on the cement industry’s layout in different regions and promoting clean production and green development.

2. Materials and Methods

2.1. Data Sources

PM2.5 emission inventory data of cement production and PM2.5 emission inventory data of the whole department (http://www.meicmodel.org, accessed on 1 January 2021) and the spatial distribution of the cement industry (http://www.shuini.biz, accessed on 1 January 2021) during 2010–2017 in China were collected. Here, I chose 2010 and 2017 annual data to demonstrate the differences in PM2.5 spatial and temporal distribution prior/after the air pollution control enforcement. From 2013 to 2017, to address the severe air pollution issues and protect public health, the State Council of China promulgated the toughest-ever Air Pollution Prevention and Control Action Plan (Action Plan) [34]. The national five-year plan (2013–2017) aims to decrease the concentrations of PM2.5 by 10% by 2017 in populated regions and metropolises, compared to before 2013 [35]. The data cover 22 provinces, 5 autonomous regions, and 4 municipalities that are directly under the Central Government. In addition, the cement industry development is affected by regional social development level, policy, and innovation ability, and the pollution emissions are affected by pollution sources, pollution path, emission reduction, environmental purification capacity, pollution diffusion, vegetation coverage, meteorological conditions, and so on. Consequently, I analyzed the factors that are potentially responsible for the spatial and temporal changes of the cement industry from three aspects: natural factors, socioeconomic factors, and green development (Table 1).
Green development policy can affect the distribution and output of cement enterprises and the discharge of pollutants. In the process of transportation, cement products will also cause serious dust hazards [18]. The comprehensive utilization rate of general industrial solid waste reflects the intensity of pollutant reduction. Gross Regional Product (labeled as GDP) and the secondary industry structure reflect the quality of regional economic development. The workforce reflects the potential for regional development. Vegetation coverage and atmospheric environment regulate the potential for atmospheric purification and pollutant diffusion in the region. The government’s investment in science and technology is evident; the number of green patent applications and grants reflect the government’s emphasis on green technology and the ability to improve pollution prevention and control, energy conservation, and emission reduction. Considering all the above factors, six parameters of socioeconomic factors, three green development factors, and five meteorological and natural factors were selected for every province in the study (Table 1).

2.2. Methods

2.2.1. PM2.5 by Cement Industry

The Community Multiscale Air Quality (CMAQ) modeling system used in this study was developed by the U.S. Environmental Protection Agency [36,37,38] for air quality management and atmospheric research. The model represents atmospheric processes including emissions from anthropogenic and biogenic sources, meteorological transport, atmospheric chemical reactions, radiation, cloud processing, and deposition. Here, I evaluate the annual PM2.5Cement value and the percentage of PM2.5Cement in the atmosphere (PPM2.5Cement). First, I used the CMAQ model to simulate the ambient air quality based on the emission inventory of 2010 and 2017, through which the annual average concentration of PM2.5 was predicted by summing the emission inventory (PM2.5total). Then the cement industry was removed from the emission inventory. The average annual concentration of PM2.5 was not included in the emission of the cement industry (PM2.5no-Cement). The formula is as follows:
PM 2.5 C e m e n t = PM 2.5 t o t a l PM 2.5 n o C e m e n t
  PPM 2.5 C e m e n t = PM 2.5 C e m e n t PM 2.5 t o t a l
where PM2.5Cement is the annual contribution value of PM2.5 from cement production; PM2.5total is the annual contribution value by totaling emission inventory; PM2.5no-Cement is the PM2.5 excluding cement industry emission inventory; PPM2.5Cement is the percentage contribution of PM2.5Cement to PM2.5total. I also used the standard deviation ellipse and gravity center transfer method [39] to explore the spatiotemporal changes in the cement industry between 2010 and 2017.

2.2.2. Geographic Detector Model

I used the Geographic detector model [40] to analyze the main factors affecting PM2.5Cement. The model includes four detectors: factor detection, interaction detection, risk detection, and ecological detection. To achieve my study objectives, I chose factor detection and interaction detection, with factor detection defined as follows: to detect spatial association of the dependent variable Y(PM2.5Cement) and independent factor Xj (j = 1,2…14). Here, the independent variable X was the natural factor, socioeconomic factor, and green development factor, and the formula is as follows:
q = 1 i = 1 L N i , j σ i , j 2 N σ 2 = 1 SSW SST
SSW = i = 1 L N i , j σ i . j 2 ,   SST = N σ 2
where q is the explanatory strength of a given independent variable Xj on the dependent variable Y(PM2.5Cement), with a range of [0,1]; L represents the number of stratum of X variable; N and Ni,j represent the size of sample in the whole study region and the i-th stratum of the j-th variable. A large value indicates a high degree of explanation, i.e., stronger effect of the independent variable Xi on the dependent variable Y. σi,j2 and σ2 are the variances of Y value in each stratum of j-th variable and whole region, respectively; SSW is the sum of squares, and SST is the total sum of the squares. The method has no linear or non-linear relationship assumption; it can only be used to measure the actual spatial association between two variables. Interaction detection is as follows: to judge the interaction effects of two factors on the PM2.5Cement value (q (Xa1 ∩ Xb)). The relationship between the two factors can be divided into the following categories (Table 2).

3. Results

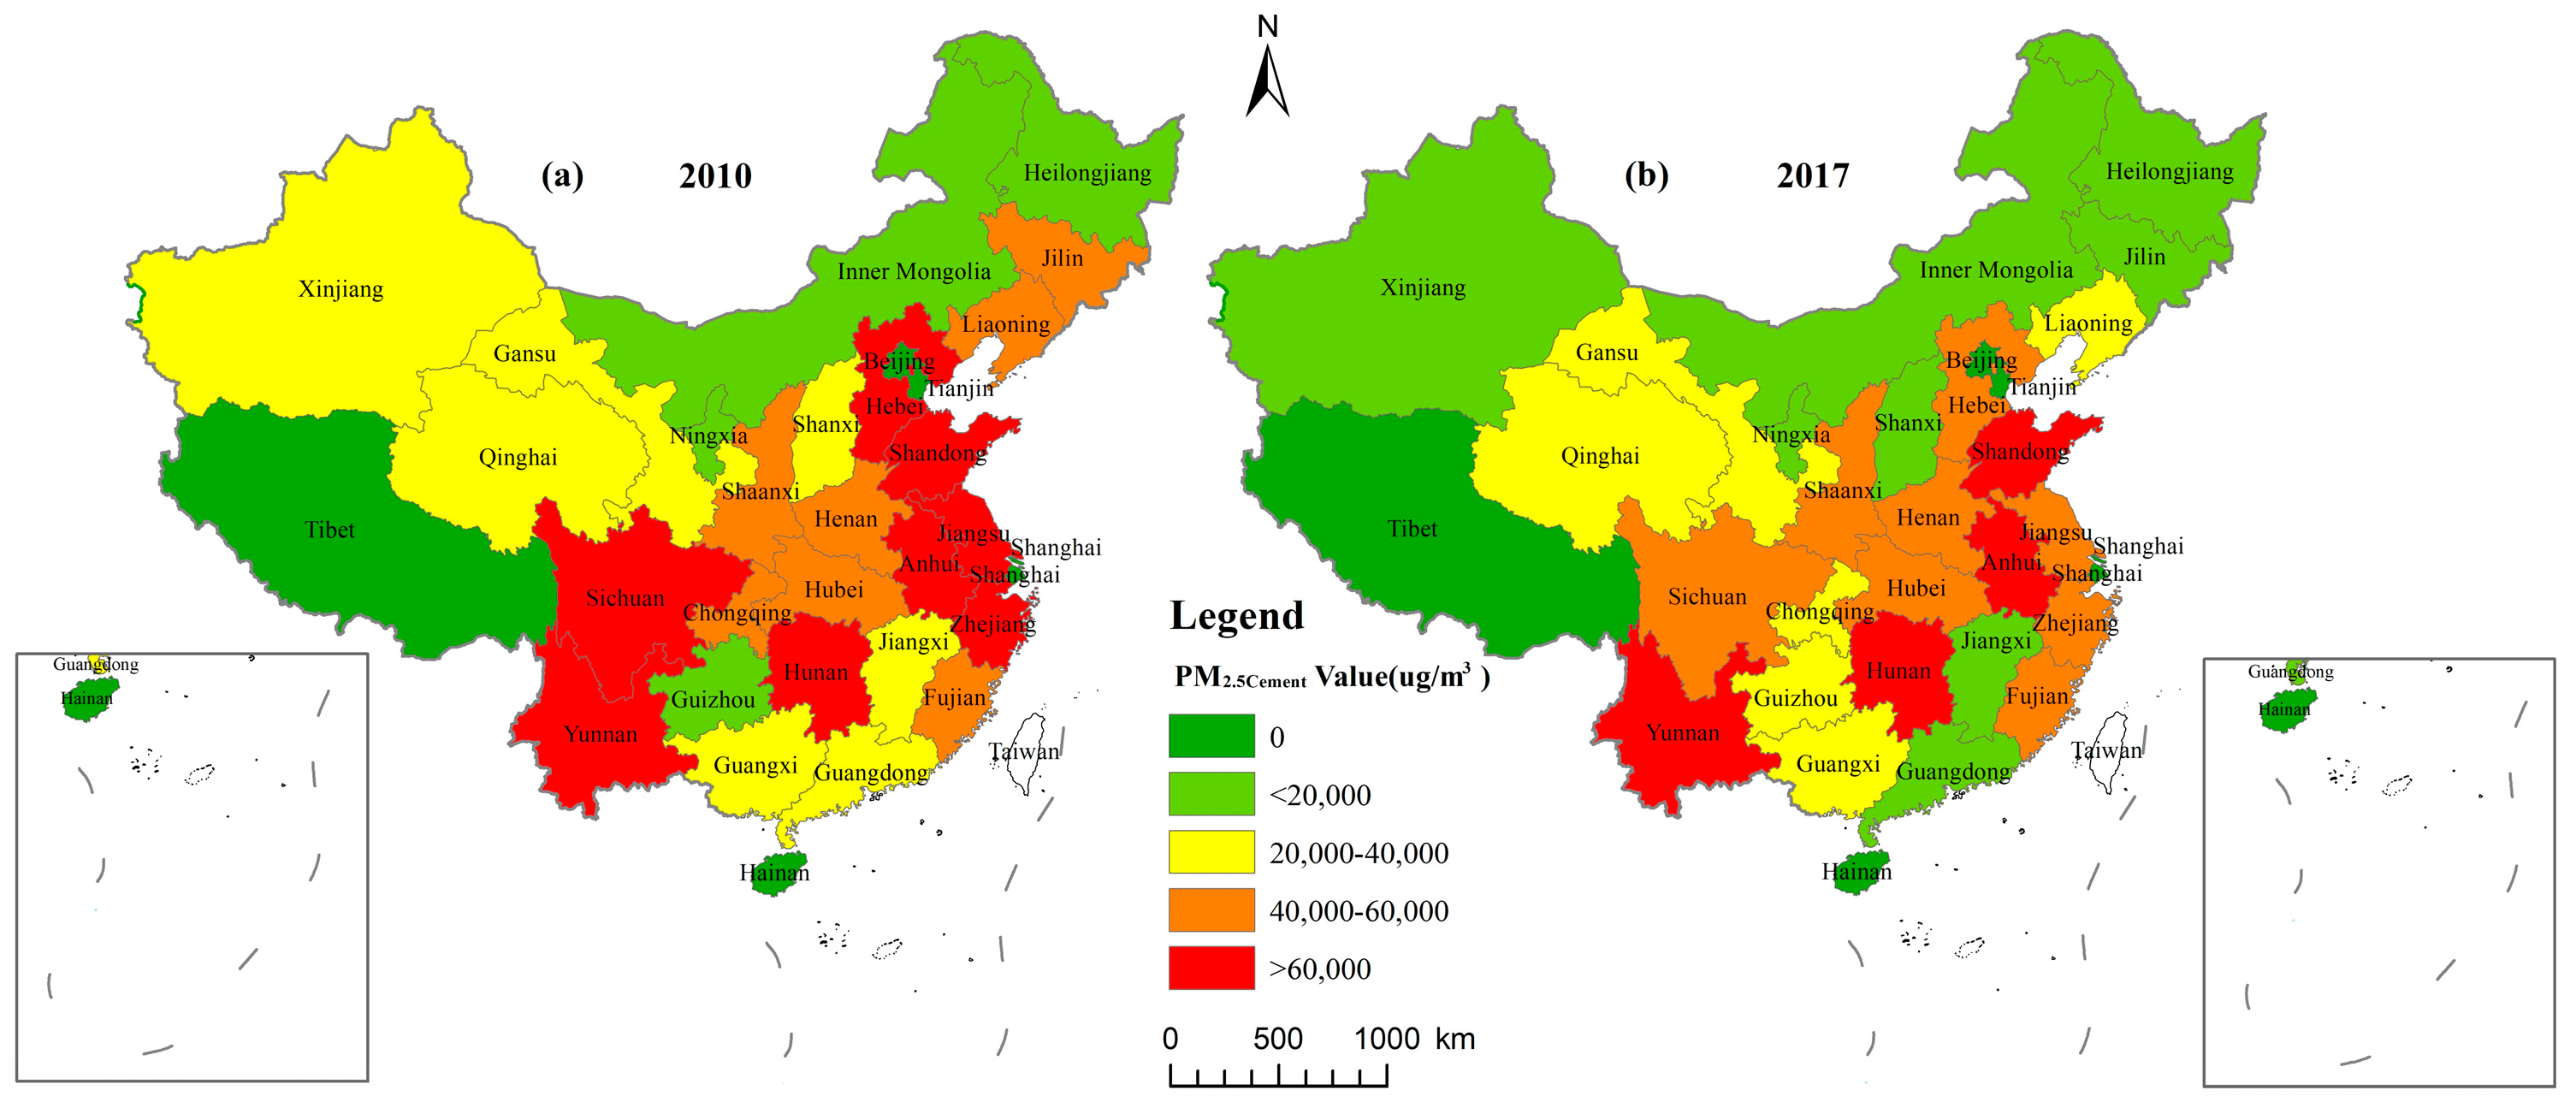
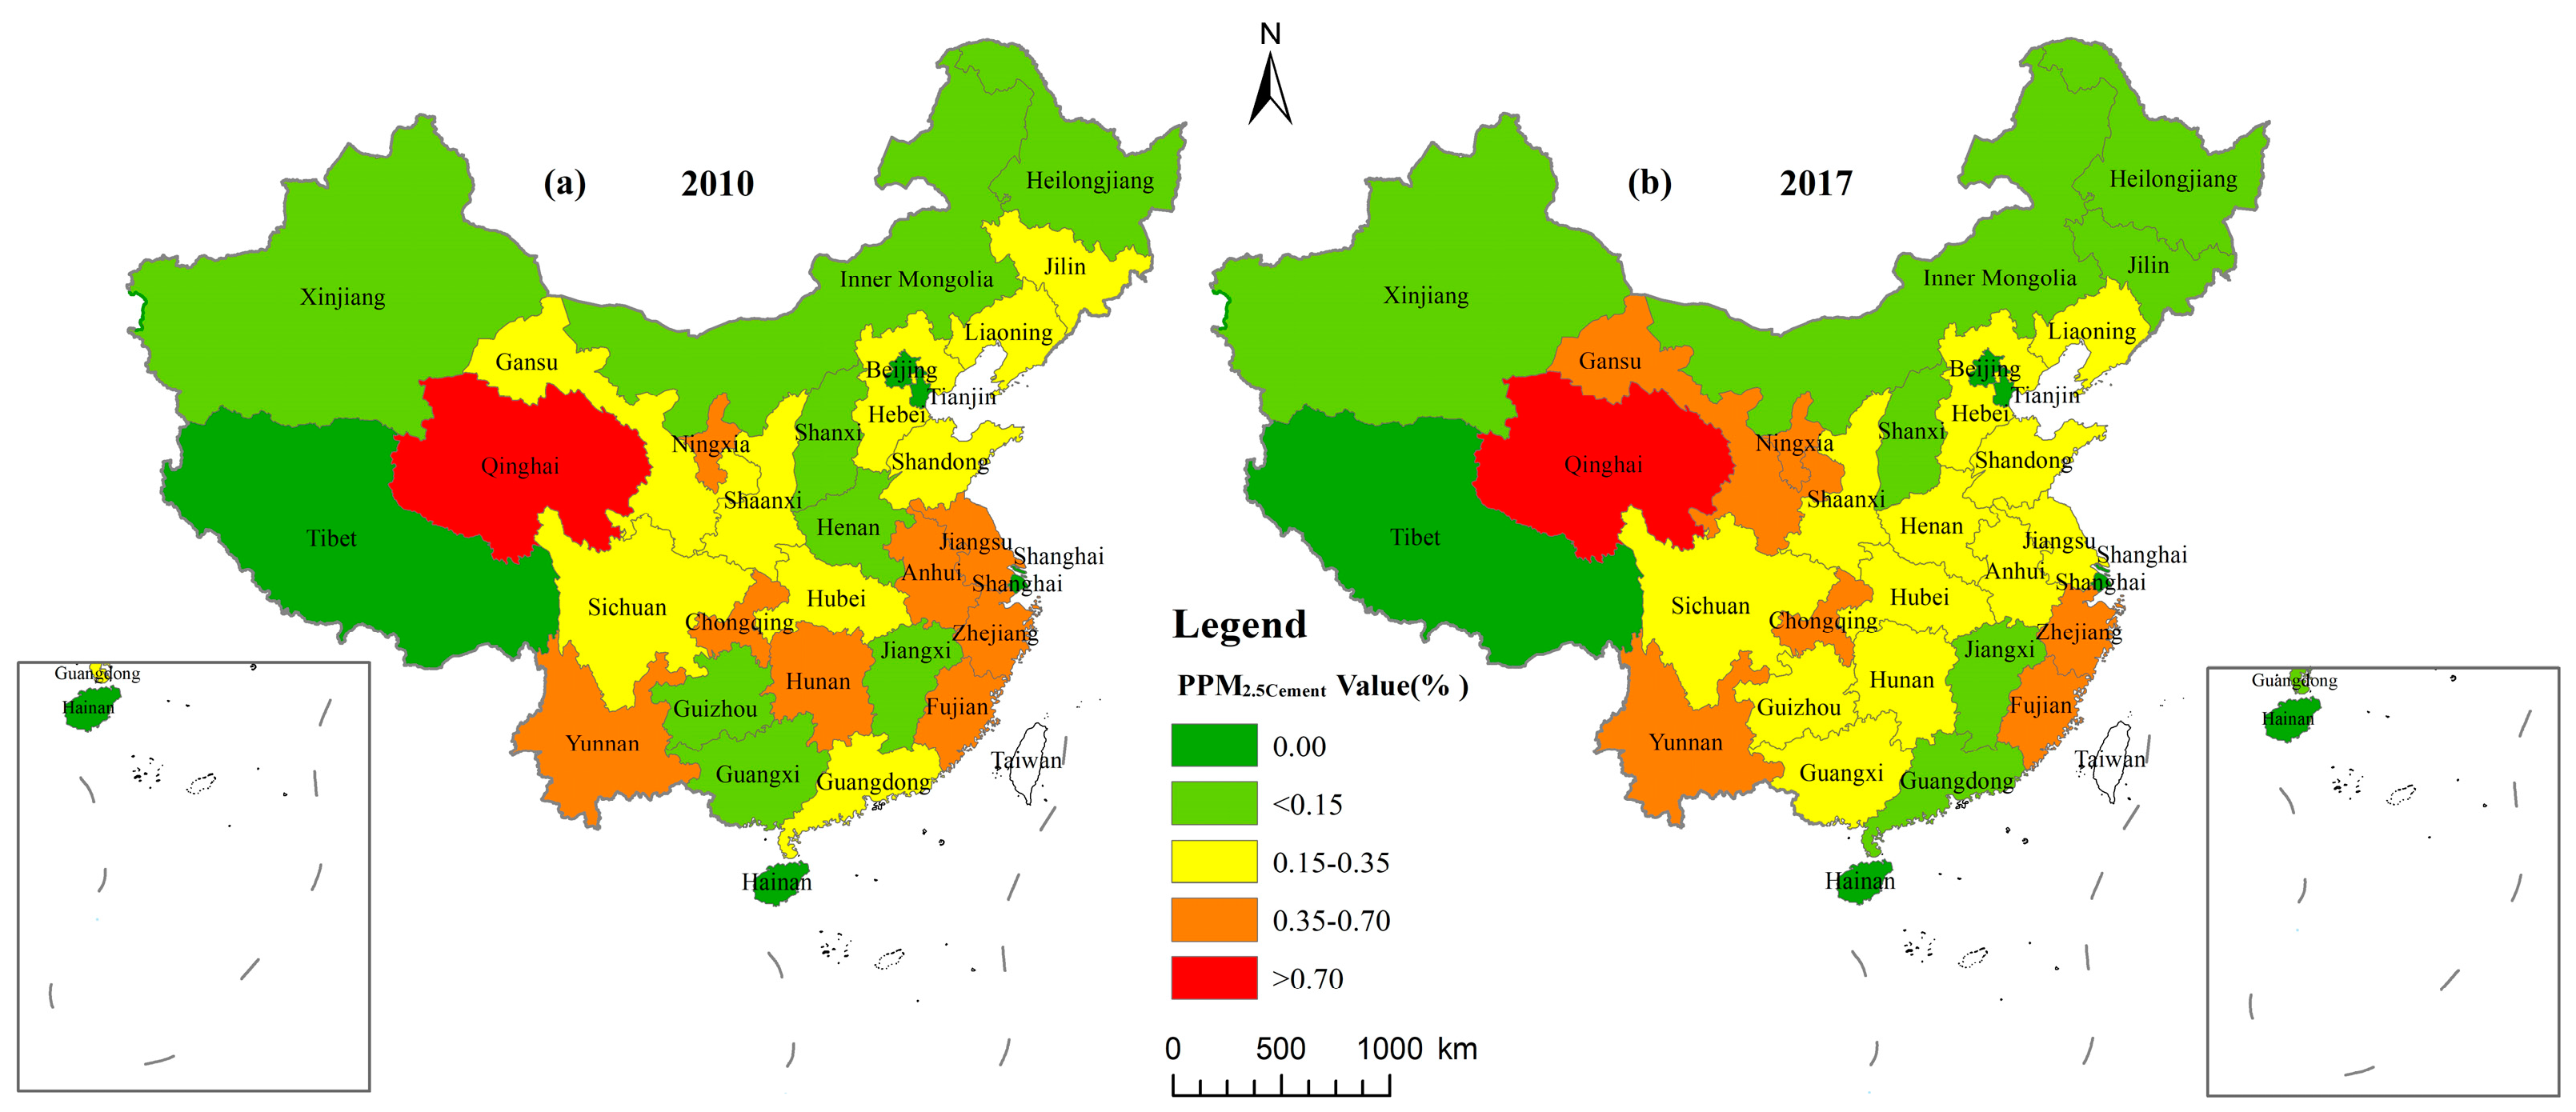
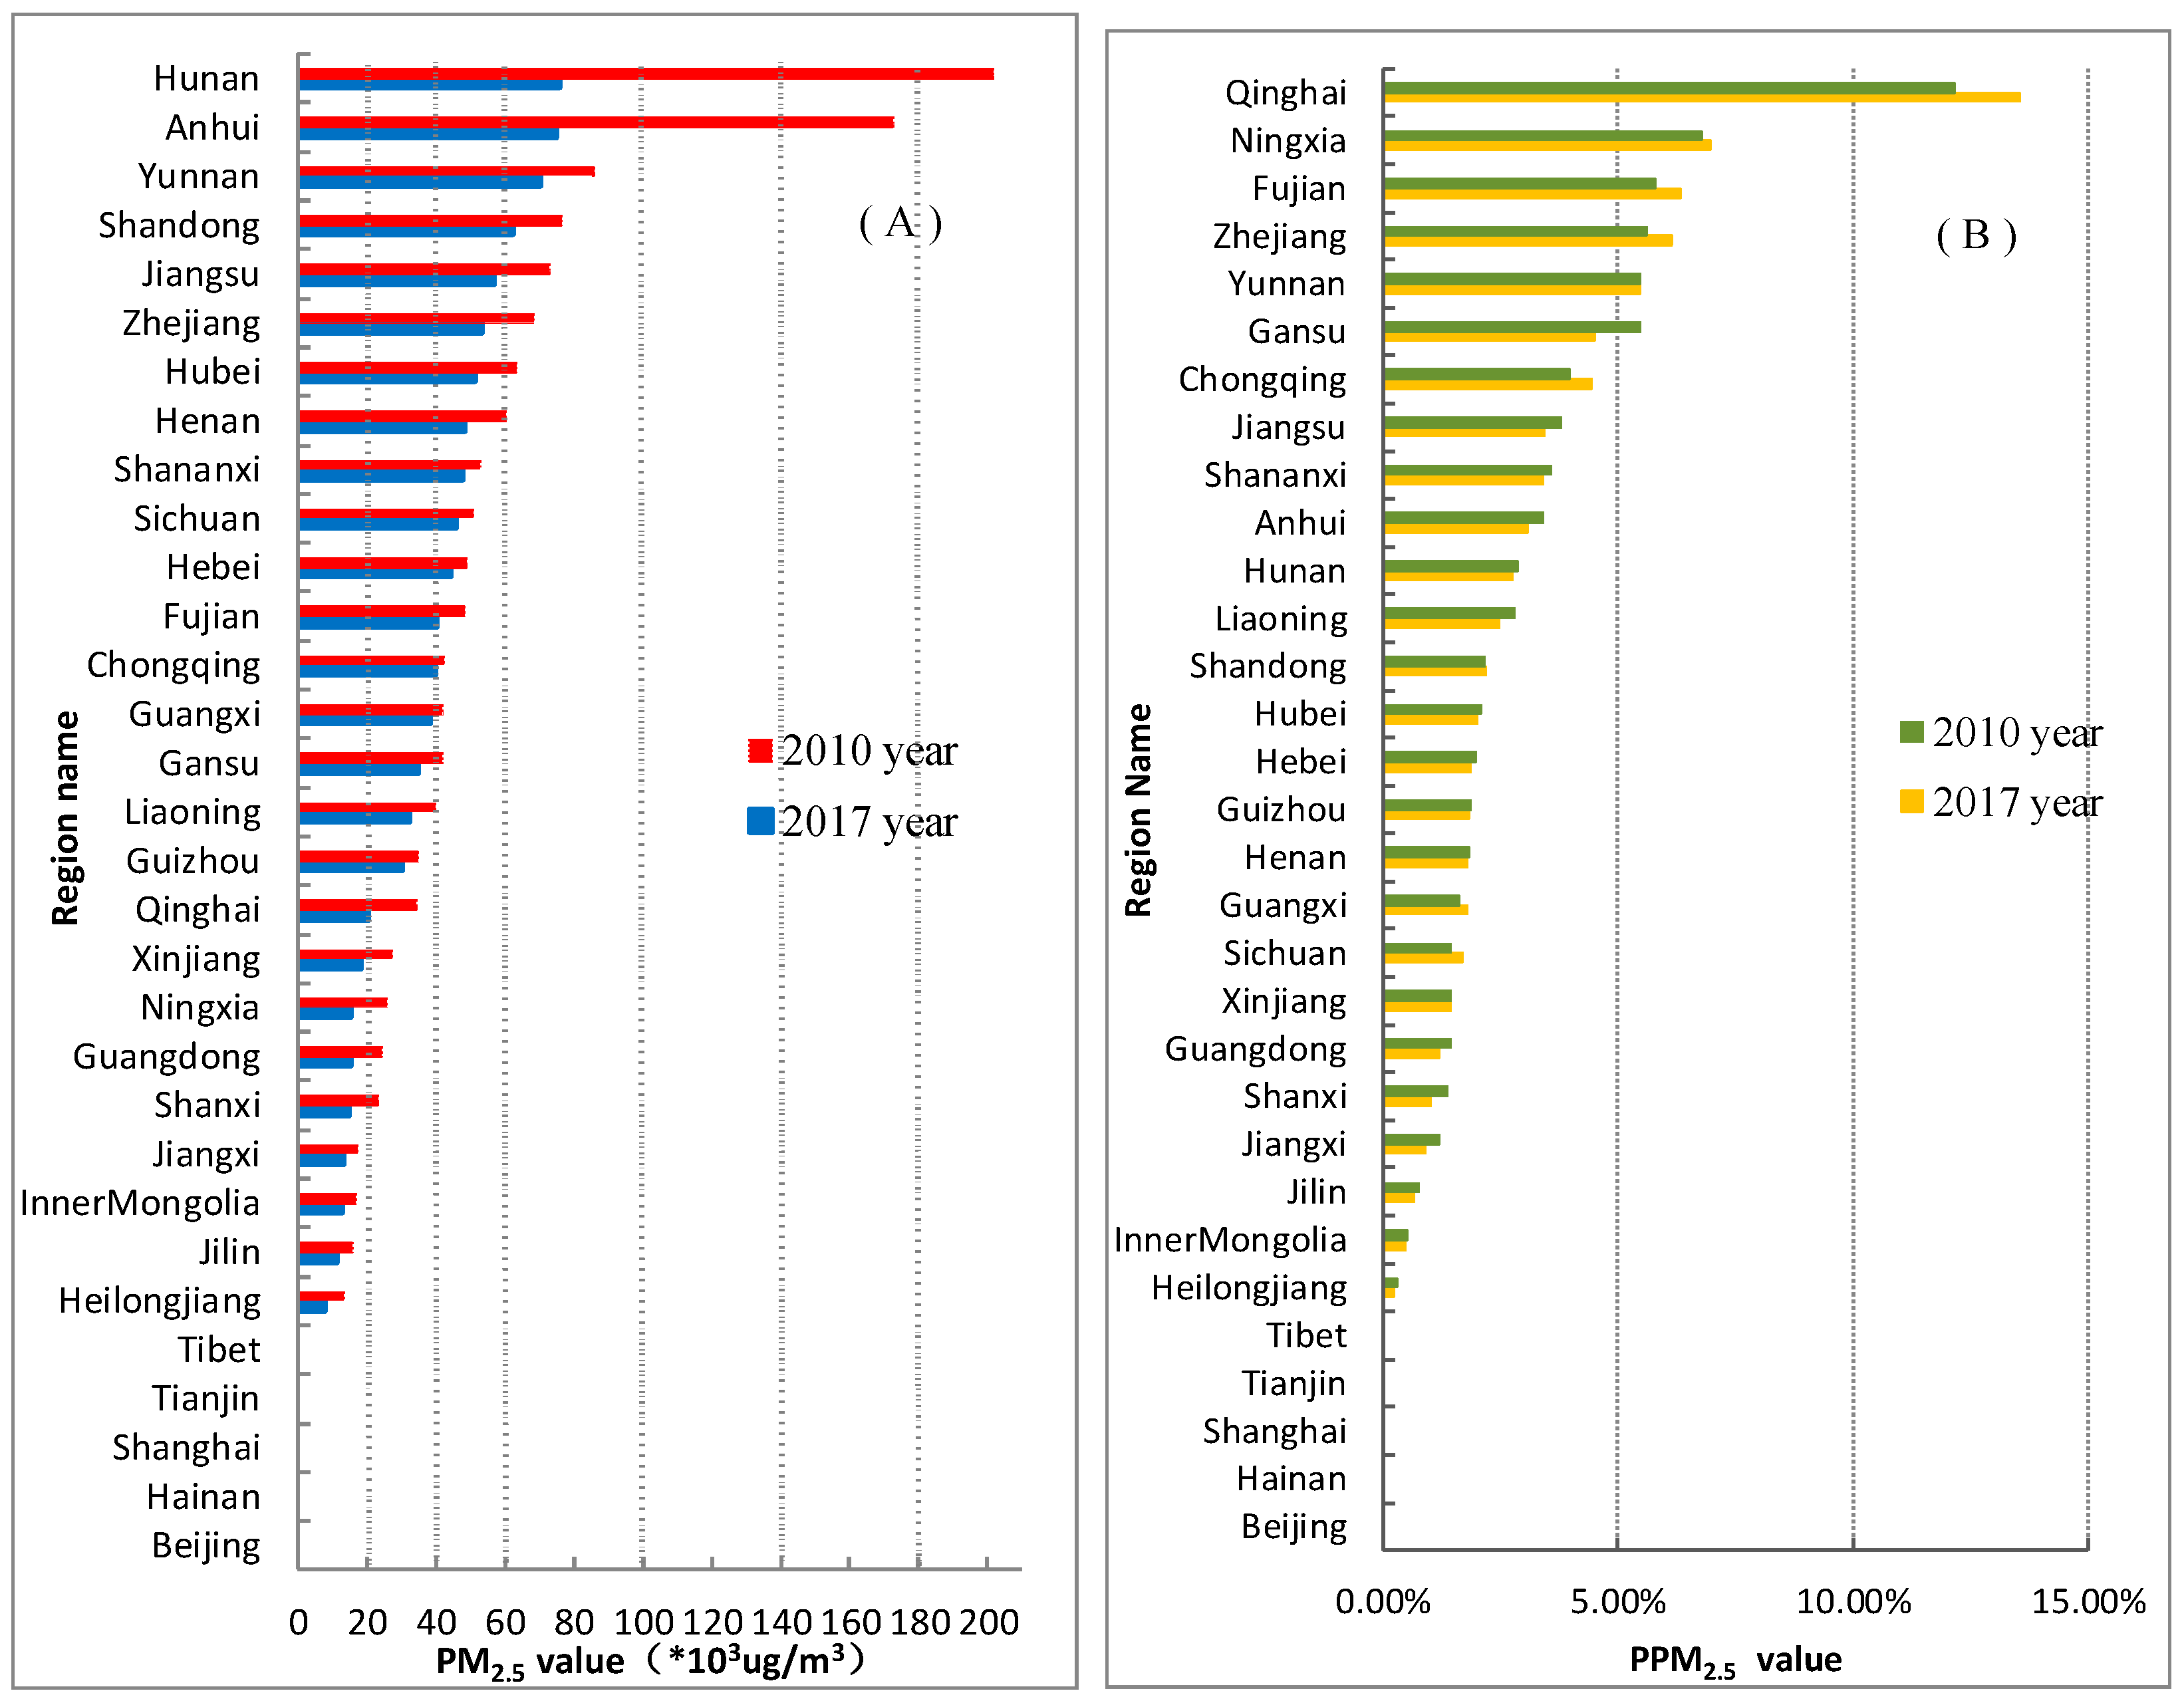
3.1. Spatial and Temporal Characteristics of PM2.5Cement

The annual total PM2.5Cement value was 1.40 × 10⁶ µg/m3 in 2010 and 0.98 × 10⁶ µg/m3 in 2017 for the study areas, which was decreased by 30.31%. The PPM2.5Cement decreased from 0.24% in 2010 to 0.21% in 2017. Spatially, the high annual PM2.5Cement were concentrated in the east and southwest (Figure 1a), and the high PPM2.5Cement measures were mainly found in the central region, western and eastern provinces, and Qinghai Provinces (Figure 2a) in 2010. Interestingly in Qinghai provinces, although its PPM2.5Cement value was the highest (1.22%, 1.35%) in all provinces in the two years, the annual PM2.5Cement was only 23,463 µg/m3 in 2010 and 20,115 µg/m3 in 2017, and it ranked 18th in the 31 study regions (Figure 4). Then I used the annual PM2.5Cement value to range segmentation. In 2010, there were eight provinces with PM2.5Cement > 60,000 µg/m3, including Hunan (PM2.5Cement, 20,152.8 µg/m3, PPM2.5Cement, 0.56%), Anhui (17,247.2 µg/m3, 0.55%), Jiangsu (85,846 µg/m3, 0.40%), Zhejiang (76,522.03 µg/m3, 0.68%), Sichuan (73,124.01 µg/m3, 0.21%), Shandong (68,368µg/m3, 0.18%), Yunnan (63,530 µg/m3, 0.38%), Hebei (60,344 µg/m3, 0.20%); in seven provinces, the PM2.5Cement was between 40,000–60,000 µg/m3, which can be ordered as follows: Hubei, Shanxi, Liaoning, Fujian, Jilin, Henan, Chongqing. The area with an annual PM2.5Cement between 20,000–40,000 µg/m3 covered seven provinces, which can be ordered as follows: Guangxi, Guangdong, Gansu, Jiangxi, Shanxi, Xinjiang, Qinghai. Provinces with an annual PM2.5Cement value between 0–20,000 µg/m3 included Inner Mongolia, Guizhou, Ningxia, Heilongjiang. Provinces with the lowest the annual PM2.5Cement value were Beijing, Shanghai, Tianjin, Hainan province, and Tibet Autonomous Region (Figure 1a and Figure 2a).
The annual PM2.5Cement in 2017 showed a decreasing trend compared with 2010 (Figure 4A). The region with high PM2.5Cement value shifted to the midwest region (Figure 1b), and the high PPM2.5Cement value also migrated to the northwest (Figure 2b). The number of provinces with PM2.5Cement > 60,000 µg/m3 decreased from seven in 2010 to four in 2017. The four provinces included Hunan (76,120 µg/m3, 0.28%), Anhui (74,786 µg/m3, 0.31%), Yunnan (70,200 µg/m3, 0.55%), and Shandong (62,456 µg/m3, 0.22%). The PM2.5Cement value in Hunan and Anhui decreased from 125,408 µg/m3 to 97,686 µg/m3 from 2010 to 2017 (Figure 4A), and their PPM2.5Cement values decreased by 0.28% and 0.24%, respectively (Figure 4B). However, Shandong and Yunnan provinces showed a slightly decreasing trend, indicating that the cement industry was still a very severe air pollution emission source. For Jiangsu, Zhejiang, Sichuan, and Hebei provinces, the annual PM2.5Cement value dropped to 40,000–60,000 µg/m3. There were eight provinces in this value range and another four provinces were Hubei, Henan, Shaanxi, and Fujian. Six provinces were in the range between 20,000–40,000 µg/m3, including Chongqing, Guangxi, Gansu, Liaoning, Guizhou, Qinghai. Eight provinces were in the range of 0–20,000 µg/m3, including Xinjiang, Ningxia, Guangdong, Shanxi, Jiangxi, Inner Mongolia, Jilin, Heilongjiang. No PM2.5Cement value was provided for Beijing, Shanghai, Tianjin, Hainan province, and Tibet Autonomous Region (Figure 1b).

3.2. Gravity Center Transfer of the Cement Industry

The standard deviation ellipse and gravity center transfer analysis showed that the PM2.5Cement center of gravity shifted 100.8 km from east to west, and the PPM2.5Cement center shifted 120.8 km from southeast to northwest (Figure 3) from 2010 to 2017, which reflected that the cement industry in China migrated to the midwest region from the eastern region during 2010 and 2017. The spatial shift might be related to air quality control and a change in the industrial structure policy in China. The gravity center transfer analysis also illustrates that midwestern people were more exposed to environmental pollution from the cement industry.
The PPM2.5Cement was the highest in Qinghai among the region, with a value of 1.22% in 2010 and 1.35% in 2017 (Figure 4B). The PPM2.5Cement in 2017 was slightly higher than that in 2010, but its annual PM2.5Cement value was down from 23,463.5 µg/m3 in 2010 to 20,115.13 µg/m3 in 2017 (Figure 4A). Except the no-emission source regions, the lowest annual PM2.5Cement (PPM2.5Cement) was found for Heilongjiang in both years; the value was 13,164 µg/m3 (PPM2.5Cement, 0.03%) in 2010 and 7828 µg/m3 (0.02%) in 2017 (Figure 4). The PM2.5Cement value dropped more than 40% during this period. With China’s transformation from extensive to intensive development during 2010–2017 and with it supervised by the stringent pollution control measures since 2013, PM2.5Cement in each province has decreased to some extent, but the magnitude is limited to minimal decreases, except larger decreases in Hunan and Anhui.

3.3. Geographical Dtection of Driving Factors

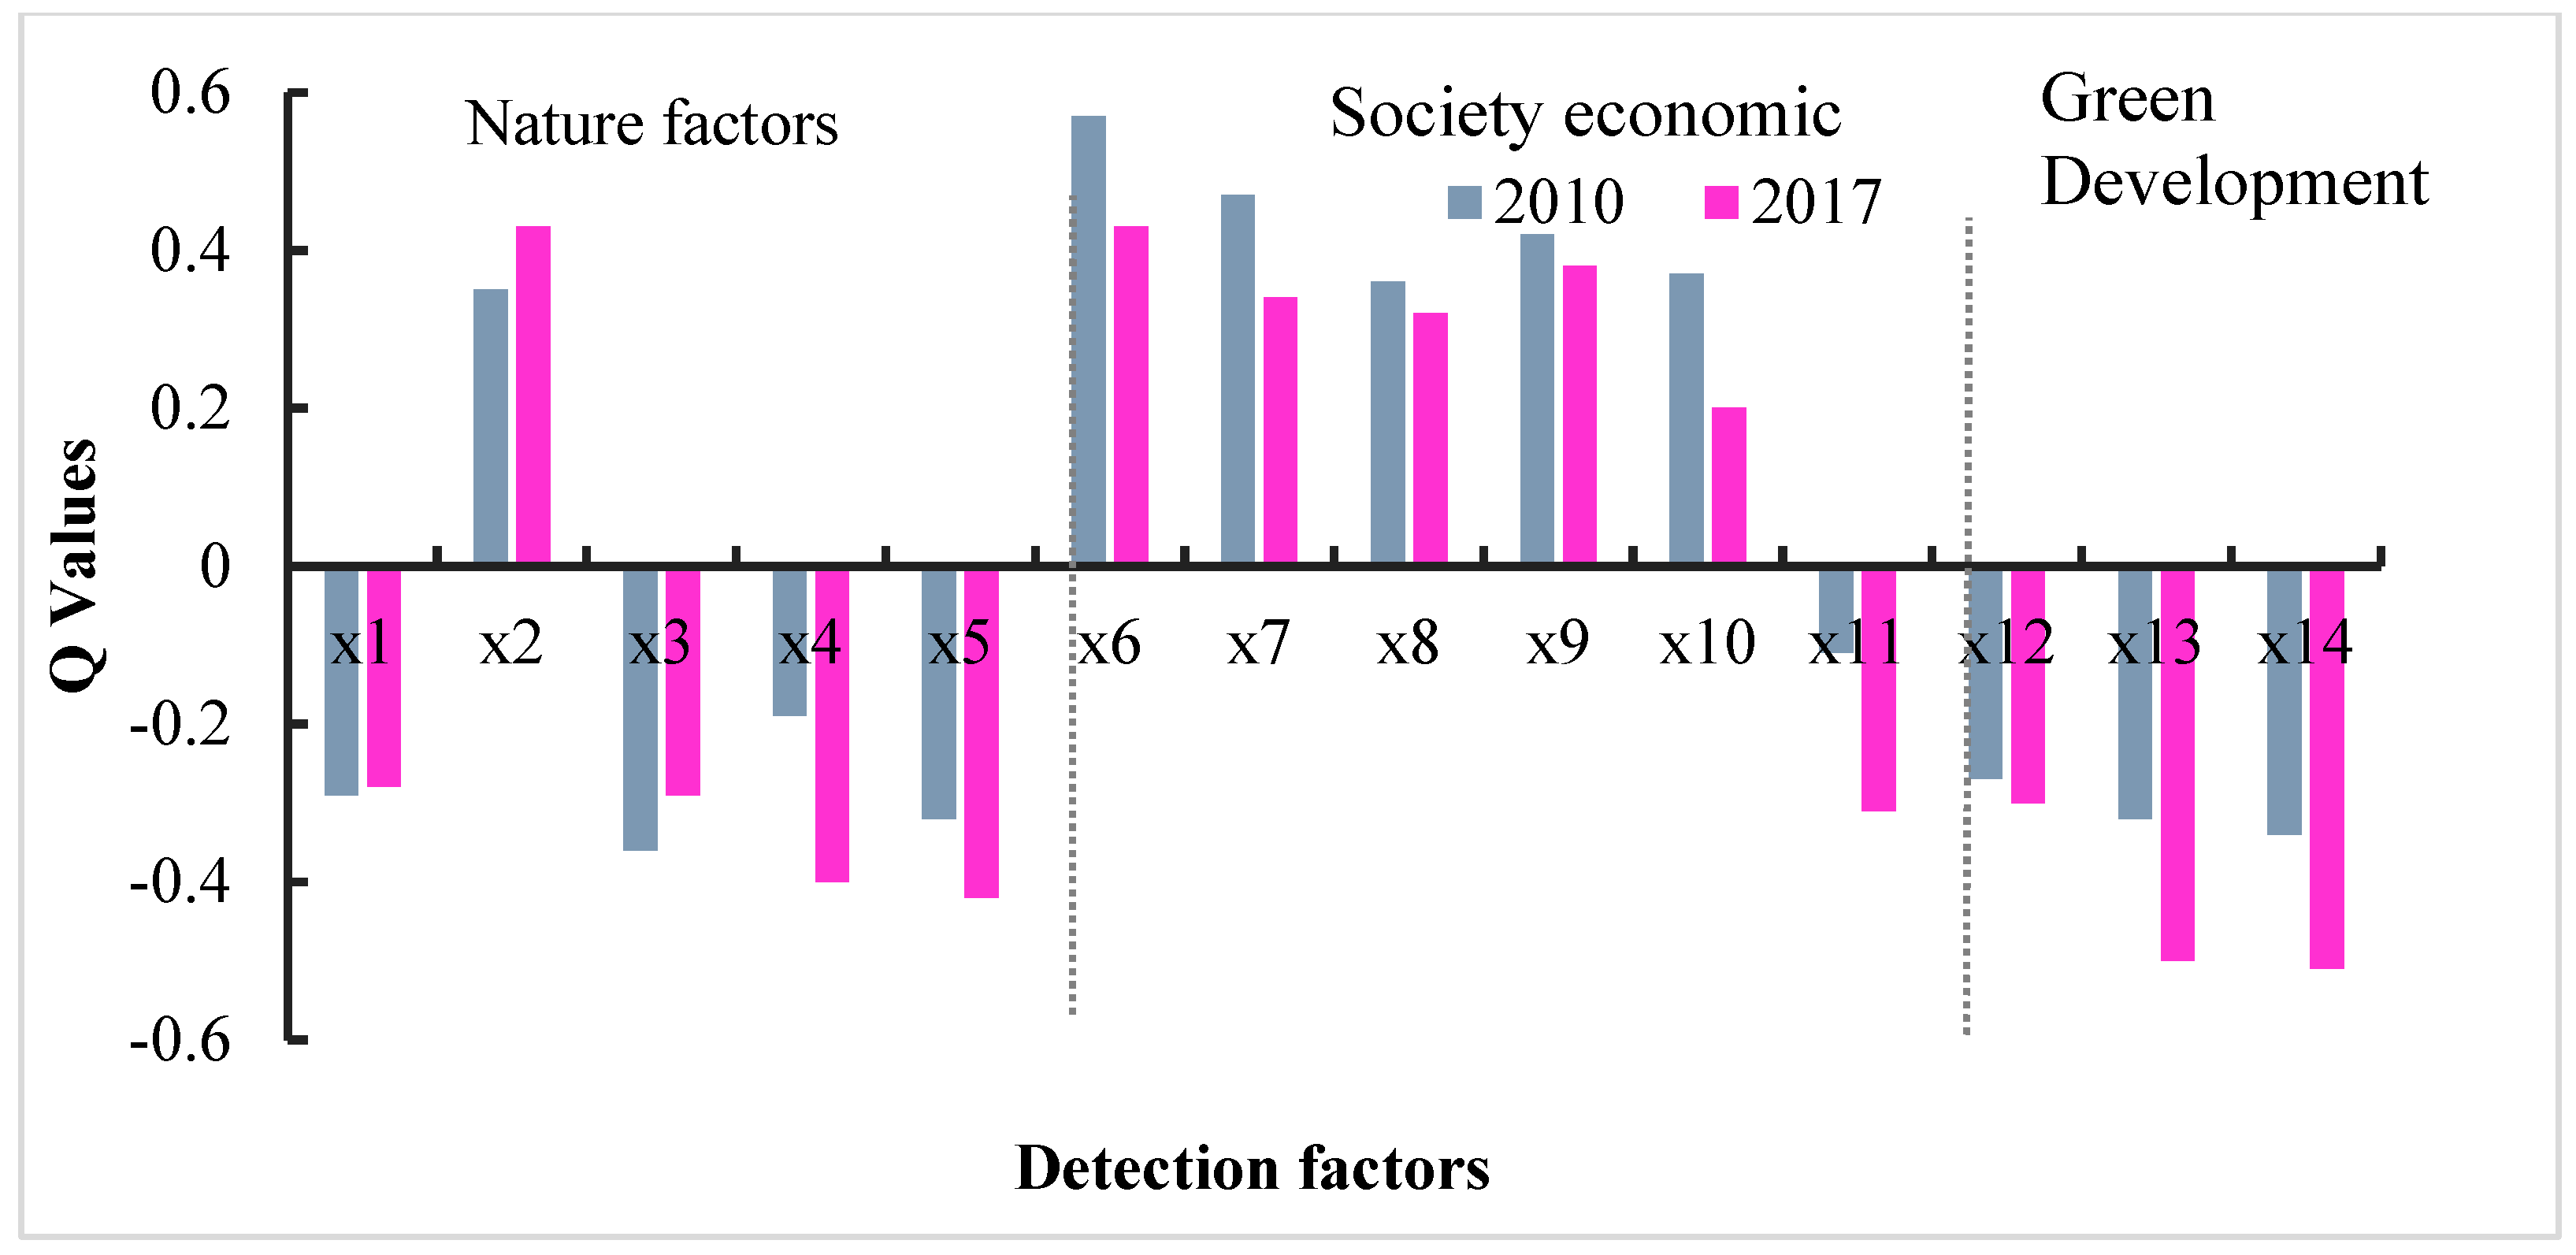
3.3.1. Influence of Detection Factor

The explanatory intensity of PM2.5Cement based on factor detection (q value) includes 14 factors. According to the q value classification, the explanatory intensity in 2010 was GDP (0.57) > the proportion of secondary industry (0.47) > the road length (0.42) > the number of labor (0.38) > the industrial smoke (powder) dust emission (0.37) > the sunshine duration (0.36) > the air temperature (0.35) > the number of green patents (−0.34) > the Green patent application (−0.32) > the green area (−0.32) > the rainfall (−0.29) > the science and technology expenditure (−0.27) > the wind speed (−0.19) > the comprehensive utilization rate of general industrial solid waste (−0.11) (Table 1, Figure 5).
In 2017, ranking order on contribution of each factor was the green patent authorization (−0.51) > the green patent application (−0.50) > the GDP (0.43) > the air temperature (0.43) > the green area (−0.42) > the wind speed (−0.40) > the road area at the end of the year (0.38) > the proportion of secondary industry (0.34) > the number of the labor force (0.32) > the comprehensive utilization rate of general industrial solid waste (−0.31) > the science and technology expenditure (−0.30) > the rainfall (−0.28) > the sunshine duration (−0.29) > the industrial smoke (powder) dust emission (0.20) (Table 1). From 2010 to 2017, with the change in China’s development mode and the regional government’s mounting attention to green technology, the strengthened pollution prevention and control, energy conservation, as well as the emission reduction, the cement industry’s emissions of air pollutants have relieved (Figure 5).
I also analyzed factor detection results (q value) for each region and found there existed high variations (Table 3). In 2010, for the eight provinces with PM2.5Cement > 60,000 µg/m3, the top three factors with the highest explanation were the industrial smoke (powder) dust emission (0.72) > GDP (0.53) > the secondary industry (0.44), and the three factors with the lowest explanation were road length (0.07) < wind speed (0.13) < air temperature < (0.16). In 2017, the three factors with the highest q value were industrial smoke (powder) dust emission (0.59) > road length (0.58) > proportion of secondary industry (0.55), and the three factors with the lowest q value were the sunshine duration (0.05) < rainfall (0.17) < science and technology expenditure (0.21). For the PM2.5Cement between 40,000–60,000 µg/m3, in 2010, the three factors with the highest q value were GDP (0.82) > road length (0.76) > the green space area (0.74), and the three factors with the lowest q value were the temperature (0.13) < rainfall (0.18) < the sunshine duration (0.28). In 2017, the three factors with the highest q value were GDP (0.70) > the comprehensive utilization rate of general industrial solid waste (0.69) > the number of green patents granted (0.61), and the three factors with the lowest q value were meteorological factors: sunshine duration (0.13) < wind speed (0.17) < rainfall (0.18). For PM2.5Cement < 40,000 µg/m3, the results showed similar explanatory strength. In 2010, factors with the highest q value were GDP (0.85) > the industrial smoke (powder) dust emission (0.84) > the general industrial solid waste comprehensive utilization rate (0.73), and those with the lowest q value were the sunshine duration (0.01) < the rainfall (0.20) < the number of the green patent application and green patent grant (0.21). In 2017, factors with the largest q value were the road length (0.95), the industrial dust emission (0.95) > GDP (0.89), and the three factors with the least q value were the sunshine duration (0.18) < the air temperature (0.19) < the number of green patents granted (0.26) (Table 3).

3.3.2. Interactive Factors

Based on the geospatial characteristics of each driving factor, I used the interaction detection module to analyze the explanatory intensity of PM2.5Cement by driving factor. The q value increased after including the interaction of any two factors. Specifically for the natural environment factors in 2010, the q value gained the greatest increases (0.48, 0.55, 0.57, 0.49) for the green space area interaction with the other four factors, followed by interactions between wind speed and sunshine duration (0.48), air temperature and sunshine duration (0.48) (Table 4). In 2017, the interaction between wind speed and the other four factors enhanced the explanatory intensity, and the q value increased to 0.59, 0.55, 0.59, 0.72, respectively, followed by interactions of sunshine duration and temperature (Table 4). For the green development factors, the q value strength in 2010 increased after including the interaction between science and technology input, such as the factors of the green patent application volume, and the green patent grant volume were 0.72 and 0.65, respectively (Table 5). In 2017, including the interaction between science and technology input and the other two factors also increased the explanatory strength (Table 5). For socioeconomic factors, including the combined effect of GDP and road length increased the q value to 0.85. Including the proportion of secondary industry and the road length increased the q value to 0.82, and including the labor force and industrial smoke (powder) dust emission increased the q value to 0.76. For other factors, including their interactions, all increased the q value (Table 6).
Except in 2017, the interaction between GDP and other factors did not enhance explanatory strength. The highest q value was the interaction between the proportion of the secondary industry and the comprehensive utilization rate of general industrial solid waste (0.86), the comprehensive utilization rate of general industrial solid waste, and industrial smoke (powder) dust emissions (0.86). The second highest was interactions between road length and the proportion of the secondary industry (0.83). Clearly, interactions with other factors also increased the q value (Table 6).

4. Discussion

The rapid development of China’s industrial economy has caused serious pollution; the Chinese government has been investing mounting efforts on environmental protection [5,41,42,43]. In 2013, China reinforced national air quality monitoring [44,45]. The PM2.5 values, as an important air quality index, was included in the emissions standards. Although, it is a very complex process to determine the source of PM2.5 in the atmosphere [41], attributing its sources and revealing its spatial pattern are vital for implementing prevention and control measures [46]. The cement production, as a basic supporting material in urbanization construction, is also a heavy industry with high energy consumption and high pollution. One needs to weigh its impact on the ecological environment, which is directly related to sustainable development.
Here, I quantified the temporal and spatial patterns of the cement industry and atmospheric PM2.5Cement content in two typical years, 2010 and 2017 (before and after the national PM2.5 control). Overall, the annual PM2.5Cement value decreased 30.31% from 2010 to 2017, as a number of cement-related environmental protections and energy saving policies were introduced since 2013, such as the “Technical Policy of Pollution Control in Cement Industry” by the Ministry of Environmental Protection, which has greatly increased the operation cost of the backward production capacity of the cement industry and has reflected the environmental protection requirements in a market-oriented way that affects the price of production factors of enterprises and “forced” industrial transformation and upgrading, structural adjustment, and optimization of the layout, but the reduction magnitudes vary greatly among each province. Hunan and Anhui provinces have witnessed a significant reduction, with a declining rate of 62.23% and 56.64%, respectively. The decreasing values are in line with other studies [21,47,48], in which the implementation of environmental protection policies by the central government are considered, strict emission reform policy for cement enterprises, closure of small and medium-sized cement enterprises, the transformation and upgrading of large enterprises, which were also the main factors for reducing pollution. The decreasing rate for other provinces appeared small, especially for Shandong, Yunnan, Hubei, Shanxi, Sichuan, and Hebei provinces. The main reason is that these provinces play a key role in China’s cement production, and they are obligated to improve energy efficiency and reduce air pollution. In addition, the PPM2.5Cement also varies greatly among provinces. Qinghai, Ningxia, Fujian, Zhejiang, and Chongqing have seen increasing trends of PPM2.5Cement from 2010 to 2017. These provinces play a key role in China’s cement production and have great potential to improve energy efficiency and reduce air pollution.
The cement industry’s gravity center shifted from the east to the midwest (Figure 4), to places such as Hunan, Hubei, Sichuan, Shanxi, Guizhou, Henan, Shandong provinces, and so on. This conclusion was consistent with previous studies [49,50]. These regions are all highly populated. Transitioning to green production of cement may be the most efficient way to balance economic development and human well-being [17,42,51,52].
There are great differences in the socioeconomic development levels and the natural environment in each province. The geographic detector model analysis shows that, for the natural factors, only the contribution of green space area was relatively large in the two study years. For the social economic factors, GDP and the second industry area play an important role, which shows that the regional economy and industry regulate the regional cement industry layout. In addition, industrial smoke dust emissions (powder) were also important explanatory variables. The cement industry is the second greatest industry of heavy pollution industries. The rapid social development in China and the increasing demand for cement have added to the regional tolerance for the cement industry. Interestingly, in 2017, road length boosted regional PM2.5Cement, and long-distance transportation increased air pollutants. Meanwhile, the q value increased when an interaction of any two factors was considered based on the geospatial characteristics of each driving factor. The three factors of green development showed a higher contribution value in 2017 than that in 2010. It meant that green development has become the main driving force in reducing air pollution in the cement industry. This change is conducive to the sustainable development of the cement industry in China [17,37,41].

5. Conclusions

I analyzed the contribution of the cement industry to PM2.5 in each province in China and examined the gravity center shift and the main driving factors on the annual PM2.5Cement in each province based on their natural, green development, and socioeconomic environments. I found that the annual PM2.5Cement value of all provinces showed a decreased trend from 2010 to 2017, especially in Hunan and Anhui, but the decreasing was slight in other regions. Even PPM2.5Cement for each region was not significantly decreasing, especially in Qinghai, Ningxia, Fujian, and Zhejiang regions, and some of them even saw a slight increase. It seems that the influence of the cement industry on air quality in these regions was still very severe. The cement industry’s center of gravity shifted from the east to the midwest of China, which has a large population exposed to the dangers of air pollution. The driving factors analysis showed that social economic development was the main driving factor for the PM2.5Cement in 2010; the main driving factors in 2017, however, changed to green development, regional independent innovation ability, and traffic conditions, while meteorological environment play a less influential role in the two years. At the same time, the contributions of the cement industry to atmospheric PM2.5 varies spatially. The cement production process needs to be further refined to minimize pollution effects.

Funding

This research was funded by the second Tibetan Plateau Scientific Expedition Program (2019QZKK0608), the Basic Frontier Science Research Program of the Chinese Academy of Sciences Original innovation projects from 0 to 1 (ZDBS-LY-DQC023), and the Belt and Road Special Foundation of the State Key Laboratory of Hydrology-Water Resources and Hydraulic Engineering (2021490111).

Data Availability Statement

Not applicable.

Acknowledgments

I thank the developers of the emission source inventory data and cement plants data for making it free to the public. Three anonymous reviewers provided valuable suggestions to improve the quality of the original manuscript.

Conflicts of Interest

The author declares no conflict of interest.

References

  1. Branquinho, C.; Gaio-Oliveira, G.; Augusto, S.; Pinho, P.; Maguas, C.; Correia, O. Biomonitoring spatial and temporal impact of atmospheric dust from a cement industry. Environ. Pollut. 2008, 151, 292–299. [Google Scholar] [CrossRef] [PubMed]
  2. Koh, D.H.; Kim, T.W.; Jang, S.; Ryu, H.W. Dust exposure and the risk of cancer in cement industry workers in Korea. Am. J. Ind. Med. 2013, 56, 276–281. [Google Scholar] [CrossRef]
  3. Lian, L.; Chen, S.; Ma, J.; Li, T.; Yang, Y.; Huang, T.; Wang, Y.; Li, J. Population aging driven slowdown in the reduction of economic cost-Attributed to PM2.5 Pollution after 2013 in China. Environ. Sci. Technol. 2023, 57, 1237–1245. [Google Scholar]
  4. Cao, W.; Wang, X.; Li, J.L.; Yan, M.; Chang, C.H.; Kim, J.; Jiang, J.H.; Liao, Y.P.; Tseng, S.; Kusumoputro, S.; et al. NLRP3 inflammasome activation determines the fibrogenic potential of PM2.5 air pollution particles in the lung. J. Environ. Sci. 2022, 111, 429–441. [Google Scholar] [CrossRef] [PubMed]
  5. Liang, S.L.; Zhao, X.; Liu, S.H.; Yuan, W.P.; Cheng, X.; Xiao, Z.Q.; Zhang, X.T.; Liu, Q.; Cheng, J.; Tang, H.R.; et al. A long-term Global LAnd Surface Satellite (GLASS) data-set for environmental studies. Int. J. Digit. Earth 2013, 6, 5–33. [Google Scholar] [CrossRef]
  6. Chen, J.Q.; Zhu, L.; Fan, P.; Tian, L.; Raffaele, L. Do green spaces affect the spatiotemporal changes of PM2.5 in Nanjing? Ecol. Process. 2016, 5, 7. [Google Scholar] [CrossRef] [PubMed] [Green Version]
  7. Qin, Y.; Wagner, F.; Scovronick, N.; Peng, W.; Yang, J.N.; Zhu, T.; Smith, K.R.; Mauzerall, D.L. Air quality, health, and climate implications of China’s synthetic natural gas development. Proc. Natl. Acad. Sci. USA 2017, 114, 4887–4892. [Google Scholar] [CrossRef] [PubMed] [Green Version]
  8. Mohammed, M.O.A.; Song, W.W.; Ma, W.L.; Li, W.L.; Li, Y.F.; Khan, A.U.; Ibrahim, M.A.E.M.; Maarouf, O.A.; Ahmed, A.A.; Ambuchi, J.J. Potential Toxicological and Cardiopulmonary Effects of PM2.5 Exposure and Related Mortality: Findings of Recent Studies Published during 2003-2013. Biomed. Environ. Sci. 2016, 29, 66–79. [Google Scholar] [CrossRef] [PubMed]
  9. Tian, L.; Hou, W.; Chen, J.; Chen, C.; Pan, X. Spatiotemporal Changes in PM2.5 and Their Relationships with Land-Use and People in Hangzhou. Int. J. Environ. Res. Public Health 2018, 15, 2192. [Google Scholar] [CrossRef] [Green Version]
  10. Rahmani, A.H.; Almatroudi, A.; Babiker, A.Y.; Khan, A.A.; Alsahly, M.A. Effect of exposure to cement dust among the workers: An evaluation of health related complications. Open Access Maced. J. Med. Sci. 2018, 6, 1159–1162. [Google Scholar] [CrossRef] [Green Version]
  11. Hu, Y.; Zang, Z.; Chen, D.; Ma, X.; Liang, Y.; You, W.; Pan, X.; Wang, L.; Wang, D.; Zhang, Z. Optimization and evaluation of SO2 emissions based on WRF-Chem and 3DVAR Data assimilation. Remote Sens. 2022, 14, 220. [Google Scholar] [CrossRef]
  12. Chu, M.J.; Wu, S.S.; Wang, W.; Yu, Y.H.; Zhang, M.J.; Sang, L.L.; Tian, T.; Lu, Y.H.; Yuan, W.W.; Huang, Q.Q.; et al. Functional variant of the carboxypeptidase M (CPM) gene may affect silica- related pneumoconiosis susceptibility by its expression: A multistage case-control study. Occup. Environ. Med. 2019, 76, 169–174. [Google Scholar] [CrossRef] [PubMed] [Green Version]
  13. Mahlet, M.; Alemayehu, H.; Tamrat, S.; Seid, A.M. Emission level of PM2.5 and its association with chronic respiratory symptoms among workers in cement industry: A case of mugher cement industry, central ethiopia. Avicenna J. Environ. Healthc. Eng. 2018, 5, 1–7. [Google Scholar]
  14. Ekinci, E.; Kazancoglu, Y.; Mangla, S.K. Using system dynamics to assess the environmental management of cement industry in streaming data context. Sci. Total Environ. 2020, 715. [Google Scholar] [CrossRef] [PubMed]
  15. Sleight, R.B.; Tiffin, J. Industrial noise and hearing. J. Appl. Psychol. 1948, 32, 476. [Google Scholar] [CrossRef]
  16. Caravaca, F.; Lozano, Z.; Rodriguez-Caballero, G.; Roldan, A. Spatial Shifts in Soil Microbial Activity and Degradation of Pasture Cover Caused by Prolonged Exposure to Cement Dust. Land Degrad. Dev. 2017, 28, 1329–1335. [Google Scholar] [CrossRef]
  17. Marques, M.; Neves-Silva, R. Decision support for energy savings and emissions trading in industry. J. Clean. Prod. 2015, 88, 105–115. [Google Scholar] [CrossRef]
  18. Zhang, C.Y.; Yu, B.Y.; Chen, J.M.; Wei, Y.M. Green transition pathways for cement industry in China. Resour. Conserv. Recycl. 2021, 166, 105355. [Google Scholar] [CrossRef]
  19. Chopping, M.; North, M.; Chen, J.Q.; Schaaf, C.B.; Blair, J.B.; Martonchik, J.V.; Bull, M.A. Forest Canopy Cover and Height From MISR in Topographically Complex Southwestern US Landscapes Assessed With High Quality Reference Data. IEEE J. Sel. Top. Appl. Earth Obs. Remote Sens. 2012, 5, 44–58. [Google Scholar] [CrossRef]
  20. Mbelambela, E.P.; Eitoku, M.; Muchanga, S.M.J.; Villanueva, A.F.; Hirota, R.; Pulphus, T.Y.; Sokolo, G.J.; Yasumitsu-Lovell, K.; Komori, K.; Suganuma, N. Prevalence of chronic obstructive pulmonary disease (COPD) among Congolese cement workers exposed to cement dust, in Kongo Central Province. Environ. Sci. Pollut. Res. 2018, 25, 35074–35083. [Google Scholar] [CrossRef]
  21. Li, M.; Zhang, Q.; Kurokawa, J.; Woo, J.H.; He, K.B.; Lu, Z.F.; Ohara, T.; Song, Y.; Streets, D.G.; Carmichael, G.R.; et al. MIX: A mosaic Asian anthropogenic emission inventory under the international collaboration framework of the MICS-Asia and HTAP. Atmos. Chem. Phys. 2017, 17, 935–963. [Google Scholar] [CrossRef] [Green Version]
  22. Zhang, S.H.; Worrell, E.; Crijns-Graus, W.; Krol, M.; de Bruine, M.; Geng, G.P.; Wagner, F.; Cofala, J. Modeling energy efficiency to improve air quality and health effects of China’s cement industry. Appl. Energy 2016, 184, 574–593. [Google Scholar] [CrossRef] [Green Version]
  23. Xu, J.H.; Fleiter, T.; Fan, Y.; Eichhammer, W. CO2 emissions reduction potential in China’s cement industry compared to IEA’s Cement Technology Roadmap up to 2050. Appl. Energy 2014, 130, 592–602. [Google Scholar] [CrossRef]
  24. Lei, Y.; Zhang, Q.A.; Nielsen, C.; He, K.B. An inventory of primary air pollutants and CO2 emissions from cement production in China, 1990-2020. Atmos. Environ. 2011, 45, 147–154. [Google Scholar] [CrossRef]
  25. Meng, J.; Liu, J.F.; Xu, Y.; Tao, S. Tracing Primary PM2.5 emissions via Chinese supply chains. Environ. Res. Lett. 2015, 10, 054005. [Google Scholar] [CrossRef]
  26. Li, M.G.; Wang, L.L.; Liu, J.D.; Gao, W.K.; Song, T.; Sun, Y.; Li, L.; Li, X.R.; Wang, Y.H.; Liu, L.L.; et al. Exploring the regional pollution characteristics and meteorological formation mechanism of PM2.5 in North China during 2013-2017. Environ. Int. 2020, 134, 105283. [Google Scholar] [CrossRef] [PubMed]
  27. Zhang, S.; Xie, Y.; Robet, S.; Yue, H.; Shu, Y. Potentials of energy efficiency improvement and energy–emission–health nexus in Jing-Jin-Ji’s cement industry. J. Clean. Prod. 2021, 278, 123335. [Google Scholar] [CrossRef]
  28. Roth, G.A.; Abate, D.; Abate, K.H.; Abay, S.M.; Abbafati, C.; Abbasi, N.; Abbastabar, H.; Abd-Allah, F.; Abdela, J.; Abdelalim, A. Global, regional, and national age-sex-specific mortality for 282 causes of death in 195 countries and territories, 1980–2017: A systematic analysis for the Global Burden of Disease Study 2017. Lancet 2018, 392, 1736–1788. [Google Scholar] [CrossRef] [Green Version]
  29. Han, F.; Li, J. Spatial Pattern and Spillover of Abatement Effect of Chinese Environmental Protection Tax Law on PM2.5 Pollution. Int. J. Environ. Res. Public Health 2022, 19, 1440. [Google Scholar] [CrossRef]
  30. Huang, J.; Pan, X.; Guo, X.; Li, G. Health impact of China’s Air Pollution Prevention and Control Action Plan: An analysis of national air quality monitoring and mortality data. Lancet Planet. Health 2018, 2, 313–323. [Google Scholar] [CrossRef] [Green Version]
  31. Liu, T.; Cai, Y.; Feng, B.; Cao, G.; Lin, H.; Xiao, J.; Li, X.; Liu, S.; Pei, L.; Fu, L. Long-term mortality benefits of air quality improvement during the twelfth five-year-plan period in 31 provincial capital cities of China. Atmos. Environ. 2018, 173, 53–61. [Google Scholar] [CrossRef]
  32. Sun, D.; Fang, J.; Sun, J. Health-related benefits of air quality improvement from coal control in China: Evidence from the Jing-Jin-Ji region. Resour. Conserv. Recycl. 2018, 129, 416–423. [Google Scholar] [CrossRef]
  33. Li, G.; Fang, C.; Wang, S.; Sun, S. The effect of economic growth, urbanization, and industrialization on fine particulate matter (PM2.5) concentrations in China. Environ. Sci. Technol. 2016, 50, 11452–11459. [Google Scholar] [CrossRef] [PubMed]
  34. The State Council of China. China’s National Action Plan on Air Pollution Control. State Counc China. 2013. Available online: http://www.gov.cn/zwgk/2013-09/12/content_2486773.htm (accessed on 12 March 2021).
  35. Wang, Y.H.; Gao, W.K.; Wang, S.; Song, T.; Gong, Z.Y.; Ji, D.S.; Wang, L.L.; Liu, Z.R.; Tang, G.Q.; Huo, Y.F.; et al. Contrasting trends of PM2.5 and surface-ozone concentrations in China from 2013 to 2017. Natl. Sci. Rev. 2020, 7, 1331–1339. [Google Scholar] [CrossRef] [PubMed] [Green Version]
  36. U.S. EPA. EPA’s Incident Waste Management Planning and Response Tool; US Environmental Protection Agency: Washington, DC, USA, 2017; Report Number EPA/600/S-17/184.31.
  37. Zhang, R.; Ma, Y.; Ren, J. Green Development Performance Evaluation Based on Dual Perspectives of Level and Efficiency: A Case Study of the Yangtze River Economic Belt, China. Int. J. Environ. Res. Public Health 2022, 19, 9306. [Google Scholar] [CrossRef]
  38. Byun, D.; Schere, K.L. Review of the governing equations, computational algorithms, and other components of the models-3 Community Multiscale Air Quality (CMAQ) modeling system. Appl. Mech. Rev. 2006, 59, 51–77. [Google Scholar] [CrossRef]
  39. Zheng, G.H.; Jiang, D.F.; Luan, Y.F.; Yao, Y. GIS-based spatial differentiation of ethnic minority villages in Guizhou Province, China. J. Mt. Sci. 2022, 19, 987–1000. [Google Scholar] [CrossRef]
  40. Wang, J.f.; Xu, C.D. Geodetector: Principle and prospective. Acta Geogr. Sin. 2017, 72, 116–134. [Google Scholar]
  41. Lu, J.Y.; Cao, X. PM2.5 Pollution in Major Cities in China: Pollution Status, Emission Sources and Control Measures. Fresenius Environ. Bull. 2015, 24, 1338–1349. [Google Scholar]
  42. Talaei, A.; Pier, D.; Iyer, A.V.; Ahiduzzaman, M.; Kumar, A. Assessment of long-term energy efficiency improvement and greenhouse gas emissions mitigation options for the cement industry. Energy 2019, 170, 1051–1066. [Google Scholar] [CrossRef]
  43. Zheng, Y.X.; Xue, T.; Zhang, Q.; Geng, G.N.; Tong, D.; Li, X.; He, K.B. Air quality improvements and health benefits from China’s clean air action since 2013. Environ. Res. Lett. 2017, 12, 114020. [Google Scholar] [CrossRef]
  44. Zhang, Q.; Streets, D.G.; Carmichael, G.R.; He, K.B.; Huo, H.; Kannari, A.; Klimont, Z.; Park, I.S.; Reddy, S.; Fu, J.S.; et al. Asian emissions in 2006 for the NASA INTEX-B mission. Atmos. Chem. Phys. 2009, 9, 5131–5153. [Google Scholar] [CrossRef] [Green Version]
  45. Zheng, B.; Tong, D.; Li, M.; Liu, F.; Hong, C.; Geng, G.; Li, H.; Li, X.; Peng, L.; Qi, J.; et al. Trends in China’s anthropogenic emissions since 2010 as the consequence of clean air actions. Atmos. Chem. Phys. 2018, 18, 14095–14111. [Google Scholar] [CrossRef] [Green Version]
  46. Zhang, Q.; Zheng, Y.X.; Tong, D.; Shao, M.; Wang, S.X.; Zhang, Y.H.; Xu, X.D.; Wang, J.N.; He, H.; Liu, W.Q.; et al. Drivers of improved PM2.5 air quality in China from 2013 to 2017. Proc. Natl. Acad. Sci. USA 2019, 116, 24463–24469. [Google Scholar] [CrossRef] [PubMed] [Green Version]
  47. Liu, J.; Tong, D.; Zheng, Y.X.; Cheng, J.; Qin, X.Y.; Shi, Q.R.; Yan, L.; Lei, Y.; Zhang, Q. Carbon and air pollutant emissions from China’s cement industry 1990-2015: Trends, evolution of technologies, and drivers. Atmos. Chem. Phys. 2021, 21, 1627–1647. [Google Scholar] [CrossRef]
  48. Liu, Y.S.; Cao, Y.; Hou, J.J.; Zhang, J.T.; Yang, Y.O.; Liu, L.C. Identifying common paths of CO2 and air pollutants emissions in China. J. Clean. Prod. 2020, 256, 120599. [Google Scholar] [CrossRef]
  49. Tang, Y.; Wang, S.X.; Wu, Q.R.; Liu, K.Y.; Wang, L.; Li, S.; Gao, W.; Zhang, L.; Zheng, H.T.; Li, Z.J.; et al. Recent decrease trend of atmospheric mercury concentrations in East China: The influence of anthropogenic emissions. Atmos. Chem. Phys. 2018, 18, 8279–8291. [Google Scholar] [CrossRef] [Green Version]
  50. Liu, J.; Mauzerall, D.L.; Chen, Q.; Zhang, Q.; Song, Y.; Peng, W.; Klimont, Z.; Qiu, X.H.; Zhang, S.Q.; Hu, M.; et al. Air pollutant emissions from Chinese households: A major and underappreciated ambient pollution source. Proc. Natl. Acad. Sci. USA 2016, 113, 7756–7761. [Google Scholar] [CrossRef] [Green Version]
  51. Zhang, F.F.; Xing, J.; Zhou, Y.; Wang, S.X.; Zhao, B.; Zheng, H.T.; Zhao, X.; Chang, H.Z.; Jang, C.; Zhu, Y.; et al. Estimation of abatement potentials and costs of air pollution emissions in China. J. Environ. Manag. 2020, 260, 110069. [Google Scholar] [CrossRef]
  52. Gao, T.M.; Shen, L.; Shen, M.; Liu, L.T.; Chen, F.N.; Gao, L. Evolution and projection of CO2 emissions for China’s cement industry from 1980 to 2020. Renew. Sustain. Energy Rev. 2017, 74, 522–537. [Google Scholar] [CrossRef]
Figure 1. Spatial distribution of the annual PM2.5Cement in 2010 and 2017.
Atmosphere 14 00482 g001
Figure 2. Spatial distribution of the PPM2.5Cement in 2010 and 2017.
Atmosphere 14 00482 g002
Figure 3. The standard deviation ellipse and gravity center migration for PM2.5Cement and PPM2.5Cement during 2010 and 2017.
Atmosphere 14 00482 g003
Figure 4. The annual PM2.5Cement value (A) and PPM2.5Cement value (B) of each province in the study area in 2010 and 2017.
Atmosphere 14 00482 g004
Figure 5. The geographic detector model analysis on the contribution of each single factor to regional PM2.5Cement. x1…x14 were the 14 factors for natural, society economical, and green development aspects in Table 1.
Atmosphere 14 00482 g005
Table 1. The 14 influencing factors for three types (natural factors, social economic factors, and green development). The effect shows the positive or negative effect on PM2.5Cement.
TypeIndicatorFactorUnitEffectThe Data Source
Natural
factors
Annual precipitationX1mmChina Meteorological Data Network (http://data.cma.cn/, accessed on 1 June 2021)
Mean annual temperatureX2°C+
Annual sunshine hoursX30.1 h
Wind speedX40.1 m/s
The green areaX5haChina Urban Statistical Yearbook (2011, 2016), China Provincial Statistical Yearbook (2011, 2016), China Environmental Statistical Yearbook (2011, 2016), China Environmental Statistical Yearbook (2011, 2016), China Urban and Rural Construction Statistical Yearbook (2011, 2016)
social economic factorsGross regional Product (GDP)X6×104 Yuan (¥)+
The proportion of secondary industry in GDPX7%+
Labor forceX8×104 (pers)+
The length of the roadX9km+
Industrial smoke (powder) dust emissionX10Tons+
Comprehensive utilization rate of general industrial solid wasteX11%
Green
development
factors
Science and technology spendingX12×104 Yuan (¥)
Green patent grantX13-http://www.cnipa.gov.cn/, accessed on 1 June 2021
Green patent filingsX14-
Table 2. Interaction detection by the Geographic detector model.
CriterionInteraction
q (Xa ⋂ Xb) < Min (q (Xa), q (Xb))Nonlinear weakening
Min(q(Xa), q(Xb))< Q(Xa∩ Xb)< Max(q(Xa), q(Xb))One factor nonlinear attenuation
q (Xa ∩ Xb) > Max (q (Xa), q (Xb))Two factor enhancement
q (Xa ∩ Xb) = q (Xa) + q (Xb)independent
q (Xa ∩ Xb) > q (Xa) + q (Xb)Nonlinear enhancement
Min(q(Xa), q(Xb)): select the minimum value at q(Xa) and q(Xb); q (Xa) + q(Xb): sum of q(Xa) and q(Xb); Max(q(Xa), q(Xb)): select the maximum value between q(Xa) and q(Xb); q (Xa ⋂ Xb): q (Xa), q(Xb) both interact.
Table 3. Differentiation and factor detection from the Geographic detector model. The Effect (+/−) was the promoting or inhibiting factors.
Indicators (I)Indicators (II)FactorsEffectq Value of Factors in Different PM2.5Cenment Value Class
<40,00040,000–60,000>60,000
201020172010201720102017
Natural
factors
Annual precipitationX10.20.310.180.180.310.17
Mean annual temperatureX2+0.240.190.130.520.160.24
Annual sunshine hoursX30.010.180.280.130.430.05
Wind speedX40.510.640.320.170.130.27
The green areaX50.620.730.740.60.310.46
Social economic factorsGross regional Product (GDP)X6+0.850.890.820.70.530.48
The proportion of secondary industry in GDPX7+0.520.650.360.340.440.55
Labor forceX8+0.610.830.680.30.430.51
The length of the roadX9+0.710.950.760.270.070.58
Industrial smoke (powder) dust emissionX10+0.840.950.550.270.720.59
Comprehensive utilization rate of general industrial solid wasteX110.630.410.520.690.360.49
Green
development
factors
Science and technology spendingX120.610.830.360.390.280.21
Green patent grantX130.210.270.480.530.360.39
Green patent filingsX140.210.260.340.610.330.47
Table 4. Interaction effects of the natural environmental factors on PM2.5Cement. The gray shaded items are the top three values in year. X1…54 are the Natural factors found in Table 1.
Natural Factors20102017
X1 X1
X10.29X2 0.28X2
X20.440.37X3 0.430.45X3
X30.460.480.35X4 0.570.550.43X4
X40.420.460.480.2X50.590.550.590.4X5
X50.480.550.570.490.320.470.510.540.720.42
Table 5. Interaction effects of Green Development factors on PM2.5Cement. The gray shaded items are the top three values in the two years. X12–14 are the Green Development factors found in Table 1.
Green Development Factors20102017
X12 X12
X120.27X13 0.3X13
X130.720.32X140.60.5X14
X140.650.480.340.580.520.51
Table 6. Interaction effects of the Social economic factors on PM2.5Cement. The gray shaded items are the top three values in the two years. X6–11 are the Social economic factors found in Table 1.
Social Economic Factors20102017
X6 X6
X60.57X7 0.44X7
X70.650.47X8 0.750.34X8
X80.560.710.36X9 0.540.790.33X9
X90.850.820.540.43X10 0.590.820.530.38X10
X100.70.660.760.710.37X110.680.710.730.780.2X11
X110.590.350.720.60.460.130.650.860.620.730.860.31
Disclaimer/Publisher’s Note: The statements, opinions and data contained in all publications are solely those of the individual author(s) and contributor(s) and not of MDPI and/or the editor(s). MDPI and/or the editor(s) disclaim responsibility for any injury to people or property resulting from any ideas, methods, instructions or products referred to in the content.

