Article

Trends in Rainfall and Temperature Extremes in Ethiopia: Station and Agro-Ecological Zone Levels of Analysis

1
Department of Natural Resource Management, College of Agriculture and Environmental Science, Bahir Dar University, Addis Ababa P.O. Box 5689, Ethiopia
2
Land Use Planning Directorate, Amhara National Regional State Land Bureau, Bahir Dar P.O. Box 5501, Ethiopia
3
International Center for Agricultural Research in the Dry Areas (ICARDA), Addis Ababa P.O. Box 5689, Ethiopia
4
College of Agriculture and Life Sciences, Texas A&M University, College Station, TX 77843, USA
5
International Water Management Institute, Addis Ababa P.O. Box 5689, Ethiopia
6
Department of Earth and Planetary Sciences, Johns Hopkins University, Baltimore, MD 21210, USA
7
Department of Horticulture, College of Agriculture and Natural Resources, Debre Markos University, Debre Markos P.O. Box 269, Ethiopia
8
Department of Forestry, College of Agriculture and Natural Resources, Mekdela Amba University, Germame P.O. Box 32, Ethiopia
9
Water and Land Resource Center, Addis Ababa University, Addis Ababa P.O. Box 3880, Ethiopia
10
College of Development Studies, Addis Ababa University, Addis Ababa P.O. Box 3880, Ethiopia
*
Author to whom correspondence should be addressed.
Atmosphere 2023, 14(3), 483; https://doi.org/10.3390/atmos14030483
Submission received: 18 January 2023 / Revised: 25 February 2023 / Accepted: 27 February 2023 / Published: 28 February 2023
(This article belongs to the Special Issue Water Management and Crop Production in the Face of Climate Change)

Abstract

:
Climate extreme events have been observed more frequently since the 1970s throughout Ethiopia, which adversely affects the socio-economic development of the country, as its economy depends on agriculture, which, in turn, relies heavily on annual and seasonal rainfall. Climate extremes studies conducted in Ethiopia are mainly limited to a specific location or watershed, making it difficult to have insights at the national level. The present study thus aims to examine the observed climate extreme events in Ethiopia at both station and agro-ecological zone (AEZ) levels. Daily rainfall and temperature data for 47 and 37 stations, respectively (1986 up to 2020), were obtained from the National Meteorology Agency (NMA). The Modified Mann–Kendall (MMK) trend test and the Theil–Sen slope estimator were employed to estimate the trends in rainfall and temperature extremes. This study examines trends of 13 temperature and 10 rainfall extreme indices using RClimDex in R software. The results revealed that most of the extreme rainfall indices showed a positive trend in the majority of the climate stations. For example, an increase in consecutive dry days (CDD), very heavy rainfall days (R20), number of heavy rainfall days (R10) and consecutive wet days (CWD) were exhibited in most climate stations. In relation to AEZs, the greater number of extreme rainfall indices illustrated an upward trend in cool and sub-humid, cool and humid, and cool and moist AEZs, a declining trend in hot arid AEZ, and equal proportions of increasing and decreasing trends in warm semi-arid AEZs. Concerning extreme temperature indices, the result indicated an increasing trend of warm temperature extreme indices and a downward trend of cold temperature extreme indices in most of the climate stations, indicating the overall warming and dryness trends in the country. With reference to AEZs, an overall warming was exhibited in all AEZs, except in the hot arid AEZ. The observed trends in the rainfall and temperature extremes will have tremendous direct and indirect impacts on agriculture, water resources, health, and other sectors in the country. Therefore, the findings suggest the need for identifying and developing climate change adaptation strategies to minimize the ill effects of these extreme climate events on the social, economic, and developmental sectors.

1. Introduction

The Sixth Assessment Report of the Intergovernmental Panel on Climate Change (IPCC) clearly indicated that climate change is affecting climate extremes across the globe [1]. Several factors contribute to the occurrence of climate extremes, including atmospheric circulation, topography, and human activity [1]. Climate change has increased in recent decades and is projected to become more prevalent in the future, resulting in more frequent and long-lasting extreme events that, in turn, cause extreme ecological responses [2,3,4,5]. For instance, the global average surface air temperature was about 0.85 °C warmer from 1880 to 2012 [6,7,8]. In addition to the increase in temperature, a significant increase in rainfall trend has also been observed globally (1–2% per decade) between 1951 and 2010 [9].
A warmer climate will result in increased atmospheric humidity, which will result in more frequent and intense extreme rainfall events in the future [10,11,12]. As a result of climate change, more severe climate-related events, such as floods, droughts, heat waves, and cold waves, are occurring, which have received much attention. Climate change brings extreme weather and climate events in a significant way and a small change in a climate variable can result in significant changes in extreme weather and climate events [3,13]. Moreover, extreme weather and climate events have devastating impacts on society, the economy, and ecosystems [14,15]. The effect of climate extremes is more severe in developing countries than in developed countries, including in Africa [16].
Ethiopia is one of the areas affected by climate extremes [17,18,19] as a result of its high spatial and temporal variations in rainfall and temperature [20,21,22]. Consequently, changes in the extent of climate extremes have profound impacts on local populations, economies, and environments [23,24,25]. It is therefore fundamental to study long-term changes in climate extremes, including their intensity, frequency, and duration, in order to develop mitigation and adaptation strategies and make better predictions about future changes. Many studies have examined the trend in rainfall and temperature, such as [22,26,27,28,29,30,31,32,33,34], but few have examined the frequency and/or intensity of extreme climate throughout the country. Ref. [35], for instance, examined the change in the observed rainfall and temperature extremes in Upper Blue Nile Basin (UBNB) from 1980 to 2019 and reported consistent and spatially coherent trends of increasing and decreasing extremes of hot and cold temperature extremes, respectively. Similarly, Refs. [17,24] found that cold nights, cold days, and frost days decreased across the country, while warm nights, warm days, and summer days increased. On the other hand, more days with precipitation and a decrease in the number of consecutive wet days have been observed across different parts of Ethiopia [17,24,35]. As a result, of high spatial and temporal variability, no consistent trends in extreme rainfall have been found [21,23,24,35]. Generally, these results for Ethiopia are in agreement with studies on a global scale that indicate widespread warming trends in temperature extremes and changes in rainfall extremes that are more complex, but tend toward wetter conditions [36].
In these studies of rainfall and temperature extremes across the country, variations are observed over a variety of study periods and agro-ecological zones (AEZs). The purpose of this study is to present an updated analysis of the trends in rainfall and temperature extremes, as well as to examine spatial variation in these extremes. It updates some of the previous work presented above, which is conducted at the sub-basin level and does not consider the behavior of spatial-temporal extremes at the countrywide level. Additionally, a modified Mann–Kendall (MMK) statistical test is used to update most previous rainfall and temperature trend results, providing more accurate and realistic estimates than Mann–Kendall (MK) [37]. Therefore, the results from this study will serve as a reference for future scientific research on climate change. This will enable the development of effective adaptation and mitigation measures for climate extremes.

2. Materials and Methods

2.1. Descriptions of the Study Area

The study is conducted in Ethiopia, which is located in the Horn of Africa. The region is bordered by Sudan on the west, Eritrea and Djibouti on the northeast, Somalia on the east and southeast, and Kenya on the south. Ethiopia lies between the Equator and Tropic of Cancer, between 3° and 15° N in latitude or 33° to 48°E in longitude (Figure 1). Approximately 1,119,683 square kilometers of the country is occupied by water bodies, while 7444 square kilometers is occupied by land [38]. Geographically, the country is characterized by high and rugged mountains, flat plateaus, deep gorges, river valleys, and plains, and this diverse relief makes it unique among African countries. Located in the northeast part of the country, the Danakil depression at 120 m below sea level is one of the lowest points on earth, and it is the highest peak in the country at Ras Dashen, which is 4620 m above sea level (m. a.s.l).
According to the National Meteorology Agency (NMA), the Ethiopian lowlands are those below 1500 m of elevation, while the Ethiopian highlands are those above 1500 m, which make up 45% of the country [39]. The Ethiopian climate has three seasons. First, there is the main rainy season from June to September (JJAS), then the dry season from October to January (ONDJ), and finally the small rainy season from February/March to May (FMAM), locally referred to as Kiremt, Bega, and Belg, respectively [39]. The climate of the country is diverse and ranges from semi-arid deserts to humid and temperate climates. The southwest highlands and the southeastern and northeastern lowlands of the country receive the highest (>2000 mm) and the lowest rainfall (<300 mm), respectively. The mean annual temperature varies from 15 °C in the highlands to 25 °C in the lowlands [40].
Ethiopia has diverse agro-ecology, which enables the production of different crops and livestock. According to [41], Ethiopia is subdivided into five regions based on altitude and climate: Bereha (hot arid), Kolla (warm semi-arid), Dega (cool and humid), Weyna Dega (cool sub-humid), and Wurch (cool and moist) (Figure 1).

2.2. Source of Data and Quality Control

This study obtained 35 years (1986–2020) of daily rainfall and temperature (maximum and minimum temperature) data for 47 and 37 stations, respectively, from the NMA (www.ethiomet.gov.et, accessed on 3 February 2022). The stations used in this study were selected based on a combination of factors related to spatial distribution, length, completeness, and quality of the data series. The number of stations were uniformly distributed throughout Ethiopia, with a greater number in the central, eastern, and southern parts of the country, and fewer in eastern and northwestern Ethiopia. For each series of station data, preliminary quality controls were implemented to verify that there were no gaps in the data, and only stations with less than 25% of missing values were reserved for analysis [42,43]. Those daily values above or equal to four standard deviations from the long-term mean value between 1986 and 2020 were considered invalid [24,44]. Additionally, for the daily maximum temperature less than the daily minimum temperature, both maximum and minimum temperatures were set to empty values. There is a possibility that missing data is caused by a malfunctioning machine or a lack of diligence on the part of a station reader.
A multivariate imputation algorithm by chained equations (MICE) package found in R software was used to impute missing values from observed climatic data [45]. The MICE algorithm was chosen over other methods, such as inverse distance weighting and multiple linear regressions, due to its ability to complete missing values at a single station using the complete observed values of all examined stations as predictors. It also makes several predictions for each missing value, accounts for uncertainties, and provides standard errors [45]. Outliers in daily maximum and minimum temperatures and rainfall amounts were also detected by the quality control procedure using RClimDex 1.1 [46]. Finally, data from 47 rainfall and 37 temperature stations with a period from 1986 to 2020 were used for the analysis. The location and detailed information about the selected meteorological stations can be found in Table 1.

2.3. Data Analysis

2.3.1. Trend Analysis of Rainfall and Temperature Extremes

In the present analysis, 13 temperature and 10 rainfall (Table 2) extreme indices were computed using RClimDex 1.1 (http://etccdi.pacificclimate.org/software.shtml, accessed on 27 April 2022) in R software. These extreme indices were developed and proposed by the Expert Team on Climate Change Detection and Indices (ETCCDI) to enhance climate change detection studies and to monitor changes in “moderate” extremes [47,48]. Trend analysis of the rainfall and temperature extremes and magnitudes of the trends (1986–2020) were calculated using the MMK trend test [49] and the Theil–Sen slope estimator [50], respectively, in the modified MK R-package.

2.3.2. Anomaly Analysis of Rainfall and Temperature Extremes

A standardized anomaly index (SAI) has been used to analyze the frequency of dry and wet years in the period between 1986 and 2020. The standardized anomaly of each index is calculated as follows:
SAIi = Xt Xmean μ
where SAIi is the standardized anomaly index in year i, Xt is the annual index value in year t, Xmean is the long-term mean annual indices over a period of observation, and μ is the standard deviation of the annual index over the period of observation. We also used the 5-year moving average to show the variation of extremes within the period.
In this study, trend analysis of the rainfall and temperatures extremes and magnitudes of the trends were undertaken at station and AEZ levels. To estimate the AEZs level trends, the average index of all meteorological stations that are found in the specific AEZs (Table 1) were used. Additionally, the country-wise analysis was performed by taking the average values of the total meteorological stations that are used in this study.

3. Results and Discussion

3.1. Trends in Extreme Rainfall Indices at Station Levels

The trends of extreme rainfall indices in Ethiopia at station levels are presented in Table 3 and Table 4 and Figure 2, Figure 3, Figure 4, Figure 5 and Figure 6. The results indicated that all ten extreme rainfall indices displayed an increasing trend in the majority of the stations (Table 3 and Table 4). With respect to the annual total wet day rainfall (PRCPTOT), 63.8% of climate stations showed an upward trend, with Assosa, Bahir Dar, Bonga, Debre Birhan, and Fiche exhibiting significantly increasing trends (Table 4). Conversely, 32% and 4.2% of the stations exhibit a declining trend and no trend, respectively (Table 4). A positive trend in PRCPTOT was seen in all the country’s regions, including the central, northern, southern, and western parts. Of these regions, a significantly increasing trend was observed in the central part of the country (Figure 2A). As can be seen from the results of the PRCPTOT, insignificant trends are more prevalent than significant trends (Figure 2A). This indicates that the trends of annual total wet day rainfall (PRCPTOT) in Ethiopia showed negligible trends. On the other hand, there was a declining trend in the eastern, northeastern, and southern-central regions. Central (Haramaya station) and eastern (Tulu Bolo station) parts of the country showed no trend in PRCPTOT (Figure 2A). This study revealed that the extreme rainfall indices of PRCPTOT showed an increasing trend at Gore station. In contrast to this finding, Ref. [51] found that PRCPTOT showed a downward trend at Gore station, which may be attributed to the consideration of dissimilar time period of rainfall data. Bonga and Butajira stations showed the highest magnitude of increasing and decreasing trends in PRCPTOT, with a 15.25 mm/year increase and a −9.49 mm/year decrease, respectively (Supplementary Materials Table S1). The increase in PRCPTOT at Bonga and Debre Birhan stations was more significant (at α < 0.01 and α < 0.05, respectively) than at other stations. In line with this study, recent findings by [24,35] also reported an increase in PRCPTOT at Debre Birhan station.
Similarly, 59.6% and 61.7% of the climate stations showed an upward trend in the highest rainfall amount in a one-day period (Rx1day) and highest rainfall amount in a five-day period (Rx5day) extreme rainfall indices, respectively (Table 4). The results are similar to those reported by [35], who found that Rx1day and Rx5day were increasing at 54% of the stations examined in the Upper Blue Nile basin of Ethiopia. Debre Birhan is the only station that showed a significantly increasing trend, while Butajira, Mizan Teferi, Pawe, and Yirgalem showed a significantly decreasing trend for Rx1day indices. Butajira and Mizan Teferi stations experienced significant decreases in Rx5day rainfall indices, but Bonga, Fiche, Jimma, Robe, Wolaita, and Yirgachefe exhibited a significant increase (Table 3). The extreme rainfall indices of Rx1day and Rx5day are all on the rise in the central, southern, western, and northern parts (Figure 2B,C).
The simple daily intensity index (SDII) extreme rainfall indices, which monitor rainfall intensity on wet days, also showed an upward trend in 53.2% of climate stations, while a downward trend was observed in 44.7% of climate stations (Table 4). Among those stations which showed an increasing trend, Bahir Dar, Fiche, and Wolaita illustrated a significant increasing trend at α < 0.05, but Bonga, Haramaya, Mojo, and Yirachefe stations showed a significant increasing trend at α < 0.01 (Table 3). In contrast, Gimbi and Lalibela stations indicated a significantly decreasing trend. Mojo station showed the highest magnitude of an increasing trend (0.14 mm/year) (Supplementary Materials Table S1). Our finding indicated that SDII showed an upward trend at Debre Tabor station. However, [35] reported a downward trend of Debre Tabor station in the SDII. The difference between this finding and [35] in the trends of the SDII at Debre Tabor station may be attributed to the difference in the data periods used for the study, which are 1986–2020 and 1980–2019, respectively. Stations in southwest, northwest, and central Ethiopia displayed a decreasing trend in SDII, but stations in southern, eastern, and northern Ethiopia showed a significant upward trend (Figure 2D).
With regard to the number of heavy precipitation days (R10) and number of very heavy precipitation days (R20), more than 57.5% of the stations exhibited an upward trend (Table 4). A significant increasing trend (α < 0.01) in R10 and R20 was observed at Bonga station. R10 showed a significant (α < 0.05) increase in Bahir Dar and Debre Tabor climate stations. Among the considered climate stations in this study, Arbaminch, Bahir Dar, Dilla, Jimma, and Yirgachefe showed a significant (α < 0.05) upward trend in the R20 indices (Table 3). The extreme rainfall indices R10 and R20 are all on the rise in the central, southern, western, and northern parts of the country (Figure 2E,F).
Consecutive dry days (CDD) revealed rising trends in 76.7% (36 stations) of the total stations, with significant increases in 17.3% (8 stations) of them (Table 3 and Table 4). Thus, CDD exhibited an increasing trend in many parts of the country (Figure 3A). The highest magnitude of rising trends in CDD was observed in Jigjiga (1.61 days/year), Metema (1.44 days/year), and Mekele (1.31 days/year) climate stations (Supplementary Materials Table S1). Additionally, considerable fluctuation was observed at Dilla, Haramaya, Lalibela, and Mekelle stations. This result is consistent with the previous study by [35], who reported a higher spatial coherence in the trend of CDD in the Upper Blue Nile Basin of Ethiopia. Additionally, this result is similar to a recent finding by [52], in which CDD has increased at all study sites. The increase in the frequency of CDD will have a considerable negative impact on the length of the crop growth period (LGP), which will affect crop growth and yield. On the other hand, warming over the study area will also increase water losses through evaporation from water bodies, and transpiration from plant stomata, leading to subsequent decreases in water for agriculture, domestic and municipal uses [53]. Additionally, more frequent and prolonged droughts will reduce the amount of water flow into rivers, streams, and lakes; the water table will drop, which will reduce the supply of groundwater to springs and shallow wells.
Similar to the extreme rainfall indices of CDD, most climate stations (53.2%) exhibited increasing trends in consecutive wet days (CWD) (Table 4). This phenomenon suggests that the consecutive daily rainfall has increased in majority of the climate stations. With reference to CWD, a significantly increasing trend was observed in the central and south-central parts of the country (Figure 3B). There is, however, an insignificant declining trend in CWD distributed across the country. CWD and CDD refers to the result of the presence or absence of rainfall greater than 1 mm, respectively. Disparate to other stations, Bahir Dar, Boditi, Bonga, Dire Dawa, Fiche, Jigjiga, Kombolcha, Moyale, Abomsa, Hawassa, Nekemte, Pawe, and Yirgachefe stations exhibited an increasing trend in CDD and a decreasing trend in CWD (Table 3). This suggests an increase in aridity at these stations. A significant increase in CWD was observed at Yirgalem station (α < 0.01), as well as at Debre Markos and Ambo climate stations (α < 0.05). Our findings are different from [35], who reported negative trends in CWD in most of their study areas. The observed variability of trends in extreme rainfall could therefore be related to the diverse topography and relief features of the country [17,43]. Significant (α < 0.01) decreasing and increasing trends were observed at Asgori and Yirgalem stations, respectively.
Rainfall on very wet days (R95p) and rainfall on extreme wet days (R99p) showed increasing trends in 53.2% and 63.8% of the climate stations, respectively (Table 4). On the other hand, the remaining 46.8% and 36.2% of the climate stations depicted a downward trend in R95p and R99p, respectively. At Bahir Dar, Bonga, Fitche, Jimma, Robe, and Yirgachefe, a significant upward trend in R95p was observed. However, significantly decreasing trends in R95p were found in Butajira and Yirgalem stations. This finding is similar to the findings of [51], who reported that Jimma station showed a significantly increasing trend in R95p. On the contrary, [52] found that R95p showed a decreasing trend at Robe station. With reference to R99p, the climate stations showed insignificant trends, except a significant (α < 0.01) decreasing trend at Yirgalem and a significant (α < 0.05) increasing trend at Fiche (Table 3). The highest magnitude of the increasing trend in R99p was observed at Bonga station at a value of 2.61 mm/year (Supplementary Materials Table S1). In general, R95p, and R99p indices showed upward trends in many parts of Ethiopia (Figure 3C,D). Increased extreme rainfall can cause soil erosion, crop damage, and waterlogging, which will affect the livelihoods of rural and urban communities.
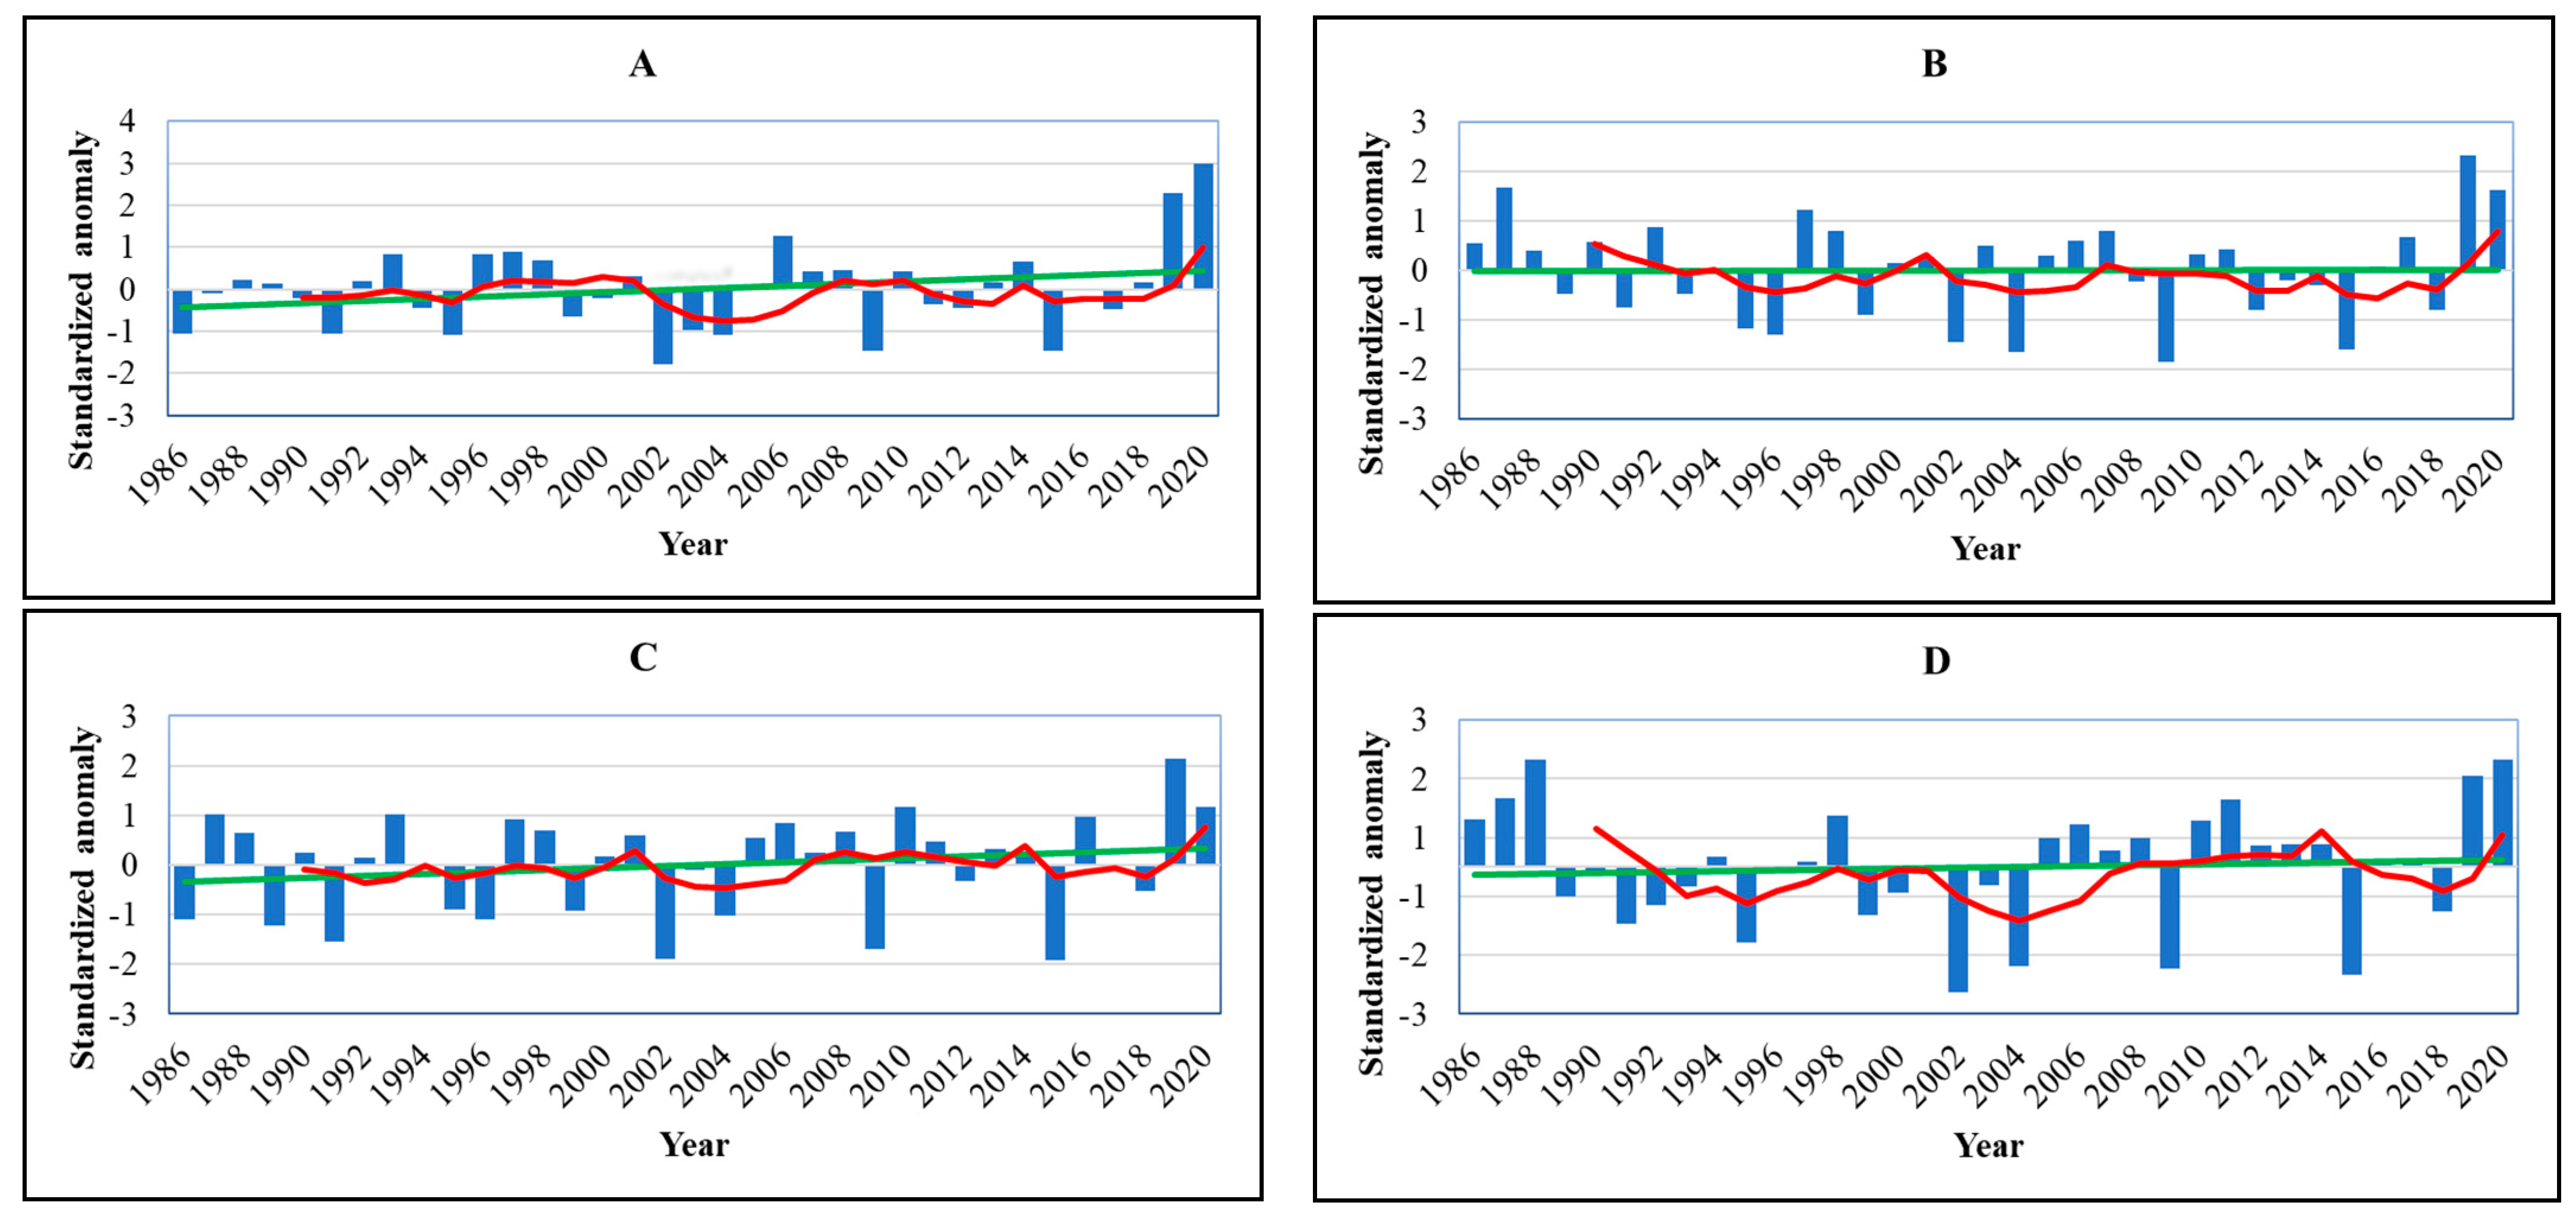
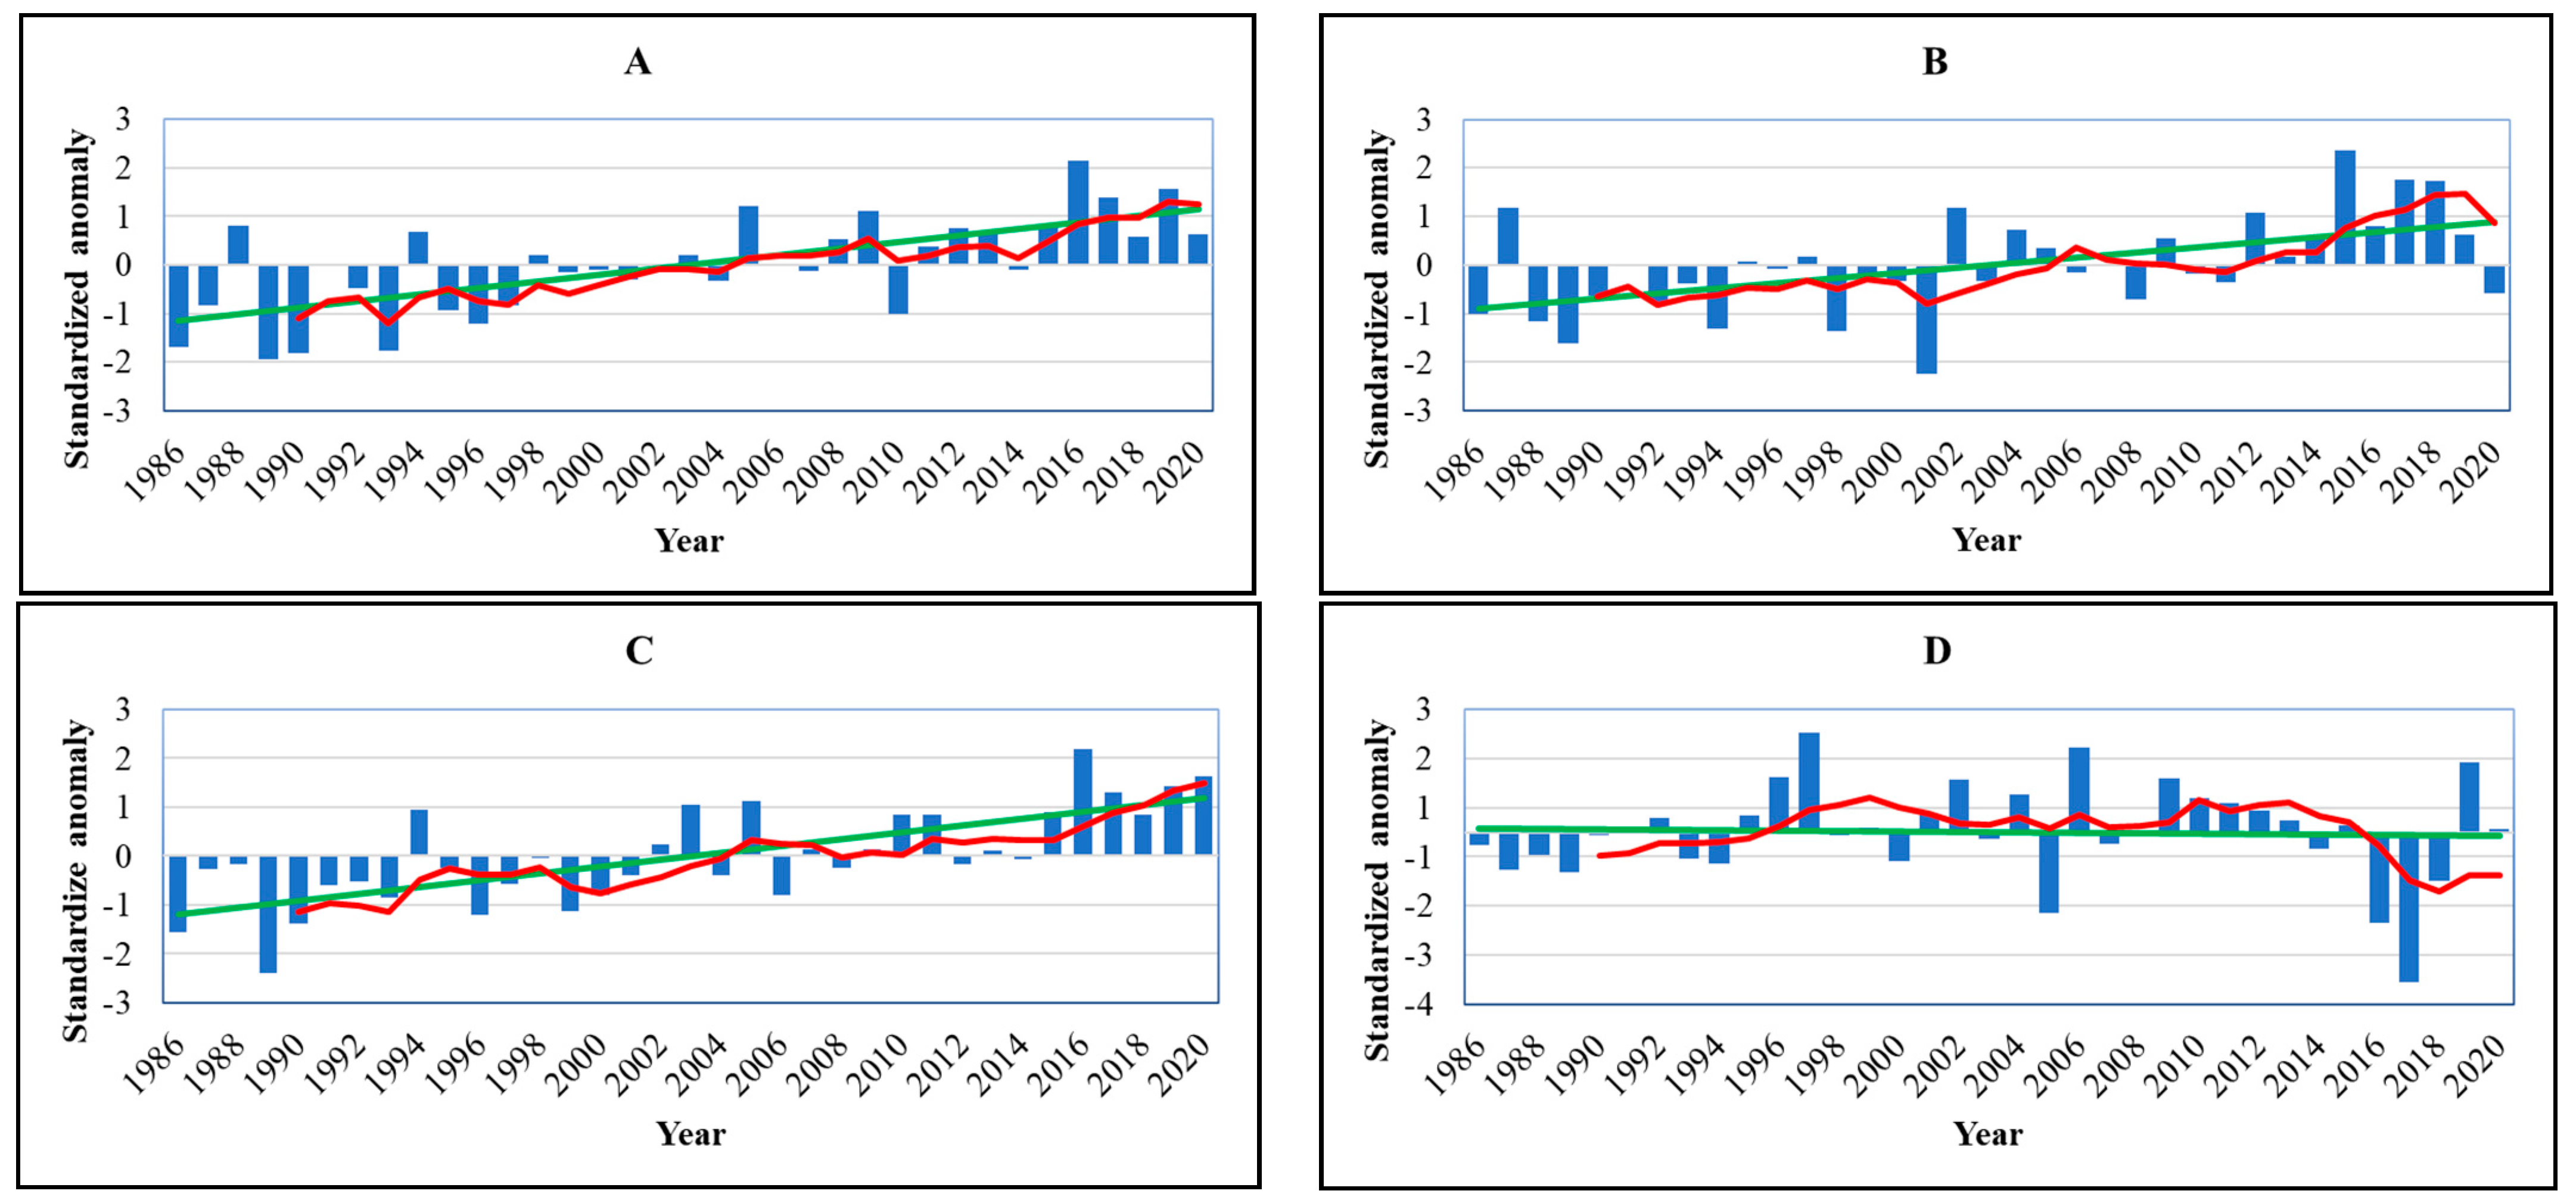
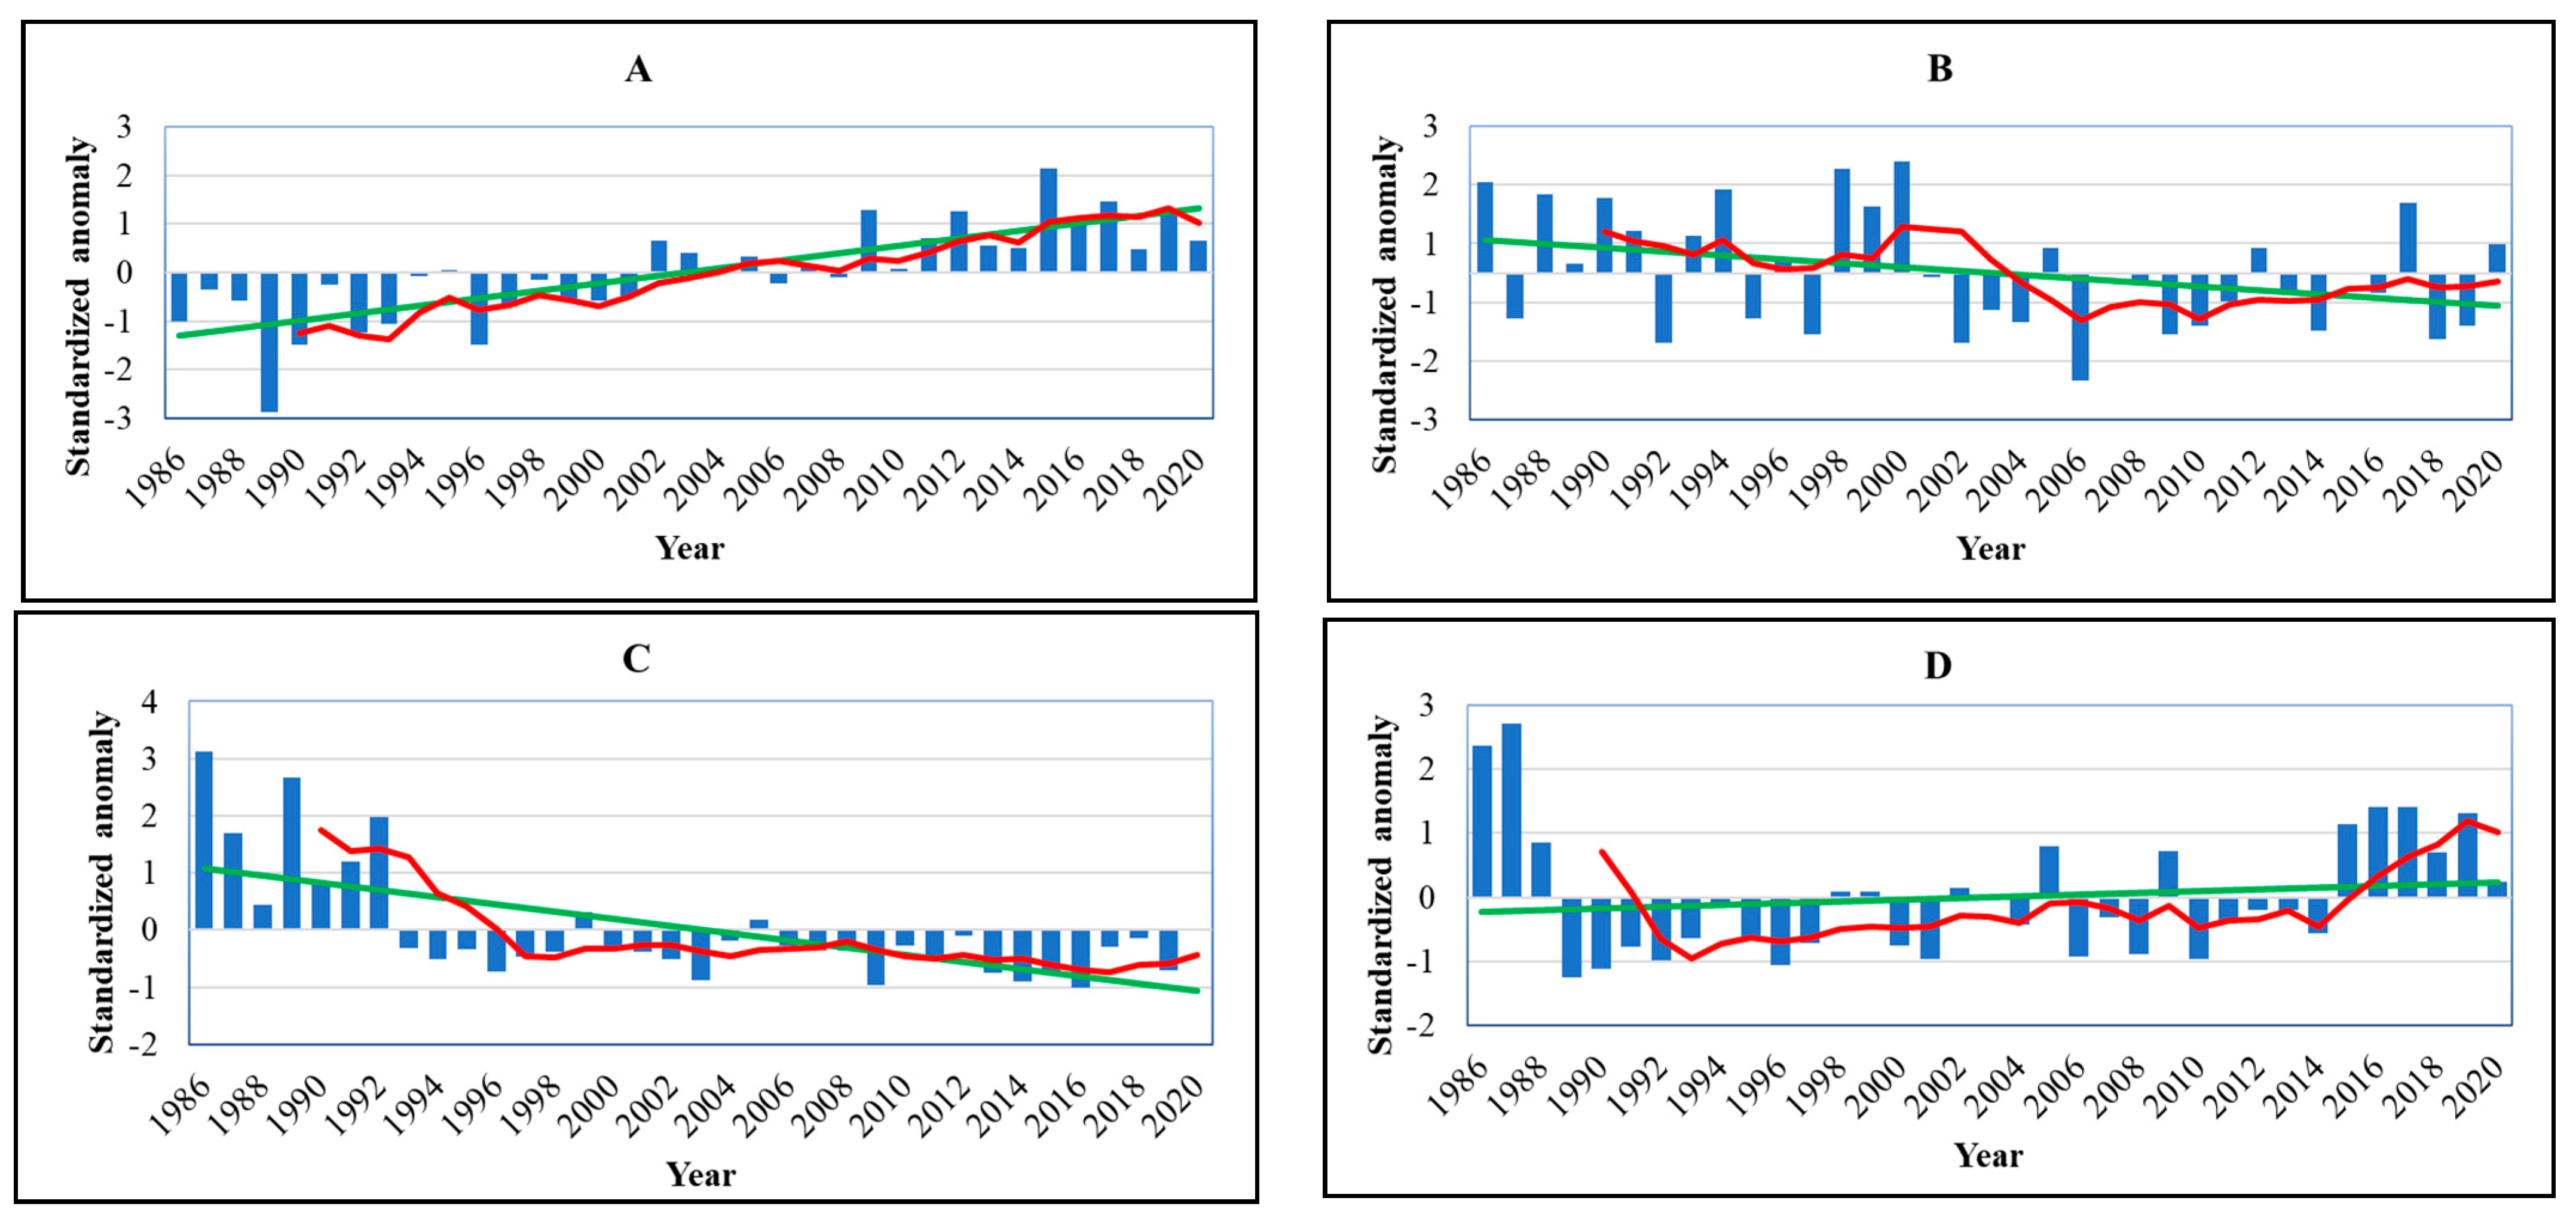
The country-wide trends of the considered extreme rainfall indices also depicted an increasing trends in over a great number of years (1986–2020), although decreasing trends are observed in some of the years (Figure 4A–D, Figure 5A–D and Figure 6A,B). This result is aligned with the findings of previous research undertaken in Ethiopia. For example, [35] found that there was an increasing trend in most extreme rainfall indices except CWD over the Upper Blue Nile basin of Ethiopia over the period 1980–2019. Ref. [24] also stated that most extreme rainfall indices showed an increasing trend except for SDII over the Jemma sub-basin over the period 1981–2014. The authors of [24] reported that the trend of PRCPTOT, R95p, R99p, and Rx5day indices exhibited an upward trend. Particularly, Rx5day showed a higher spatial coherence with 88% of climate stations having an upward trend compared to 12% with a downward trend. Another finding [54] reported that extreme rainfall indices showed an increasing trend in Ethiopia due to global warming over the period 1980–2010. The authors of [54] stated that Rx1day, Rx5day, SDII, and CDD at the Kombolcha climate station and Rx1day, Rx5day, and SDII at the Jimma climate station displayed an increasing trend. On the other hand, Rx1day, Rx5day, CWD, R10, R20, R99p, and PRCPTOT showed a downward trend at Addis Ababa climate station.

3.2. Trends in Extreme Rainfall Indices within Agro-Ecological Zones

The trends of extreme rainfall indices across the five AEZs of Ethiopia are presented in Table 5. In the hot arid AEZ, most extreme rainfall indices (PRCPTOT, R10, R20, R95p, Rx1day, Rx5day, and SDII) exhibited a decreasing trend, but none of these indices indicated a significant trend. CDD and R99p showed a non-significant increasing trend, whereas CWD depicted no trend during the study periods. At warm semi-arid AEZ, 70% and 30% of the stations in CDD exhibited increasing and decreasing trends, respectively. In addition, 60% and 40% of stations showed decreasing and increasing trends for extreme rainfall indices, such as CWD, R99p, Rx1day, and SDII, respectively. In this AEZ, 10% of the stations showed a significant downward trend in the Rx1day indices. On the other hand, 60% of the stations in warm semi-arid AEZ showed an upward trend in PRCPTOT, and R10 extreme rainfall indices. The result also indicated that 50% of the stations exhibited an increasing trend, while the other 50% of the climate stations displayed a declining trend in R95p and Rx5day extreme rainfall indices.
In a cool sub-humid AEZ, which encompasses 25 climate stations, 68%, 68%, 64%, 68%, 76%, 68%, and 60% of the climate stations showed an increasing trend in CDD, PRCPTOT, R95p, R99p, Rx1day, Rx5day, and SDII, respectively. There was a significant (α < 0.01) positive trend in CDD, CWD, PRCPTOT, R20, R95p, Rx5day, and SDII extreme rainfall indices for 8%, 4%, 4%, 4%, 8%, 4%, and 16% of the stations, respectively (Table 5). Meanwhile, 52% and 48% of climate stations showed decreasing and increasing trends in CWD over the cool sub-humid AEZ, respectively.
In the cool and humid AEZ, all stations showed an upward trend in CDD with 30% of stations showing significant increasing trends (Table 5). Additionally, 80%, 60%, 70%, 70%, and 60% of the climate stations illustrated an upward trend in CWD, PRCPTOT, R10, R99p, and Rx5day, respectively. On the other hand, in the cool and moist AEZ, there was an increase in all extreme rainfall indices, but most extremes rainfall indices demonstrated insignificant positive trends, except PRCPTOT and Rx1day (Table 5).
The CDD extreme rainfall indices were shown an increasing trend across all AEZs. The findings of the present study also indicated that there was an increasing trend in CDD and a decreasing trend in CWD indices over warm semi-arid and cool sub-humid AEZs of Ethiopia. Aligned with this finding, a study conducted in the Gurage zone in different AEZs also showed mixed trends for CDD and CWD [55], which is an increasing trend in CDD and decreasing trend in CWD over warm semi-arid AEZ. PRCPTOT showed a positive trend in all AEZs except for the hot arid AEZ, with the highest magnitude (15.25 mm/year) exhibited in the cool sub-humid AEZ. Nevertheless, a study conducted in tropical highlands at Choke Mountain reported a decreasing trend in PRCPTOT over warm semi-arid and cool sub-humid AEZs [56].

3.3. Trends in Extreme Temperature Indices at Station Levels

The trends of extreme temperature indices in Ethiopia at station levels are presented in Table 6 and Table 7 and Figure 7 and Figure 8. Regarding the monthly maximum value of daily maximum temperature (TXx) indices, 94.6% of the climate stations indicated an increasing trend, but 5.4% of climate stations displayed a decreasing trend (Table 6 and Table 7). From the total stations, 37.8% and 18.9% of the stations were exhibited a significant increasing trend at α < 0.01 and α < 0.05, respectively. The highest magnitude (0.16 °C/year) of the positive trend was registered at the Gewane climate station (Supplementary Materials Table S2). Stations in the northern, central, southern, eastern, and western parts of the study area showed an increasing trend in TXx (Figure 7A). Two stations (Debre Tabor in the northern and Asebe Teferi in the eastern parts) showed an insignificant decreasing trend in TXx.
Similarly, the monthly minimum value of daily maximum temperature (TXn) in 81.1% of climate stations showed a positive trend, and 18.9% of climate stations exhibited a negative trend (Table 7). Out of the total stations, 35.1% of the climate stations indicated a significant trend in TXn. This result is similar to a study in the upper Blue Nile basin [35], which found an increasing trend in TXx (88.5%) and TXn (69.2%) intensity temperature indices. Additionally, as reported by [57], extreme temperature indices showed an increasing trend. TXn indices shown a downward trend in the east, northwest, and southern part of the study area (Figure 7B). The monthly minimum of daily maximum temperature (TXn) indices showed the highest spatial coherence (Figure 7B).
About 75.7% of the monthly maximum value of daily minimum temperature (TNx) showed an increasing trend (Table 7). The trends in the monthly minimum value of daily minimum temperature (TNn) vary between stations, showing decreasing and increasing trends. There were 59.4% of stations with an increasing trend and 40.6% with a decreasing trend (Table 7). Hawassa station showed the highest (0.09 °C/year) magnitude of increasing trend, while Moyale and Debre Tabor climate stations displayed the highest magnitude of a negative trend (Supplementary Materials Table S2). The monthly maximum value of daily minimum temperature (TNx) showed the highest spatial coherence (Figure 7C). In contrast, the monthly minimum value of daily minimum temperature (TNn) observed less spatial coherence (Figure 7D).
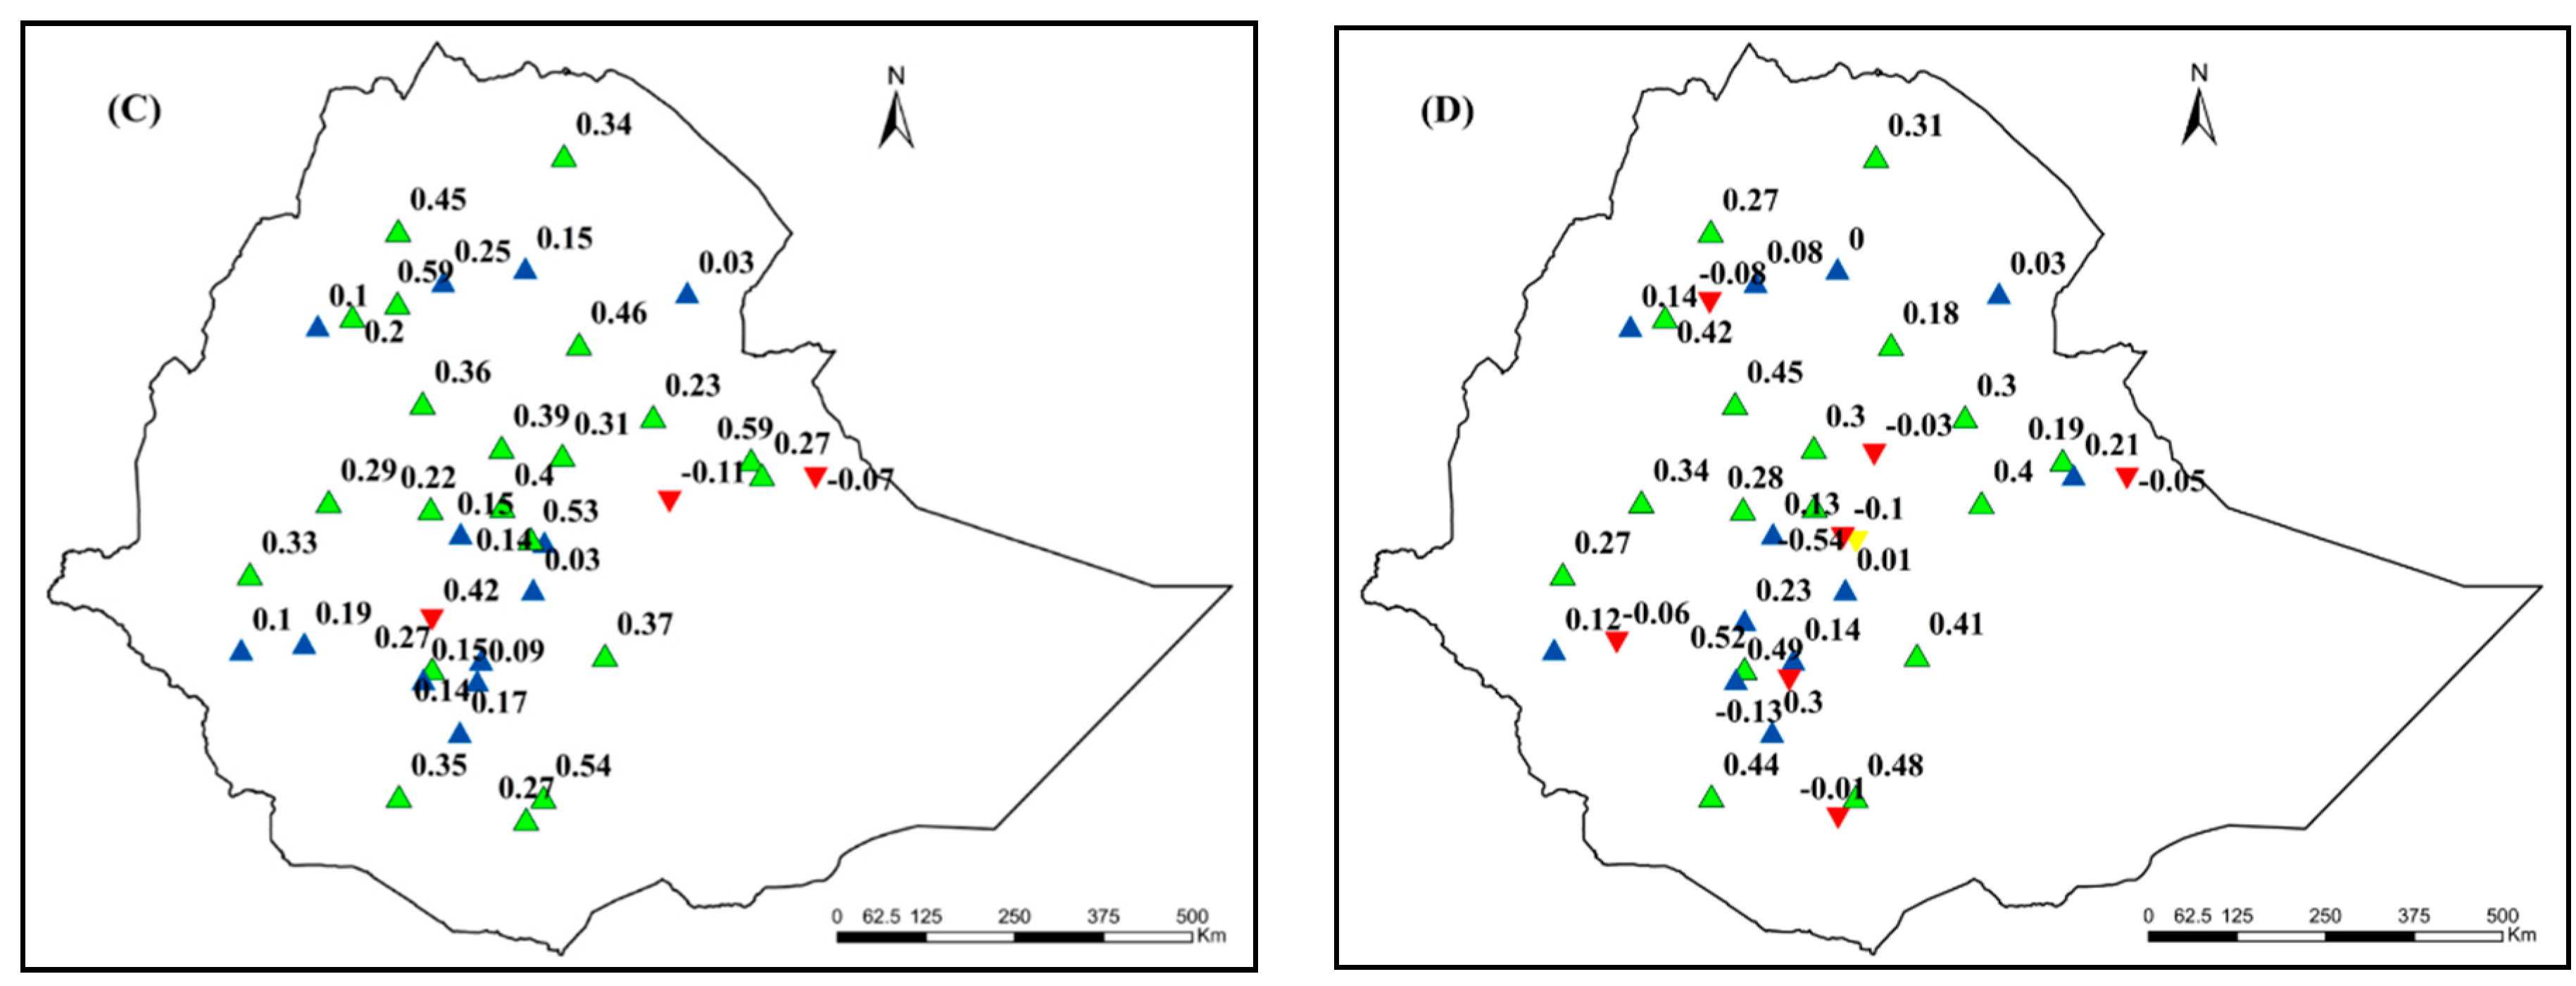
In contrast, 94.6% and 72.9% of the climate stations experienced negative trends on cool days (TX10p) and cool nights (TN10p), respectively. Of these, 75.6% and 5.4% of the climate stations showed a significant decreasing trend in TX10p at α < 0.01 and α < 0.05, respectively (Table 7). On the other hand, TN10p extreme indices were significantly decreased in 43.2% and 8.3% of the climate stations at α < 0.01 and α < 0.05, respectively (Table 7). Asebe Teferi and Asela were the only climate stations that showed an upward trend in TX10p (Table 6). Regarding warm days (TX90p) and warm nights (TN90p), the majority of the climate stations in Ethiopia showed an increasing trend (Table 6 and Table 7). TN90p extreme indices demonstrated a highly significant positive trend in 48.6% of the stations. This is a sign of warming in the study area. The highest and lowest magnitude of TN90p trends were recorded at Boditi and Adama stations (0.52 and −0.54 days/year, respectively) (Supplementary Materials Table S2). On the other hand, the highest magnitude (0.59 days/year) of the increasing trend in TX90p was recorded at Bahir Dar and Dire Dawa stations. Asebe Teferi (−0.11 days/year) and Jigjiga (−0.07 days/year) stations recorded the lowest magnitudes of the declining trend in TX90p (Supplementary Materials Table S2). The increase in warm day frequency has a negative impact on crop yield production [58].
In general, an increasing trend in warm days (TX90p) and warm nights (TN90p) and a decreasing trend in cool days (TX10p) and cool nights (TN10p) in most climate stations were observed. Aligned with the findings of this study, [24] reported the increasing trend of warm temperature extreme indices (TN90p and TX90p) and a downward trend of cold temperature extreme indices (TN10p and TX10p) in the Jemma sub-basin of the upper Blue Nile basin. On the other hand, a study [59] in the Greater Horn of Africa region illustrated that warmest day, warmest night, coldest day, and coldest night frequency temperature indices showed an increasing trend by 0.11 °C/year, 0.33 °C/year, 0.10 °C/year, and 0.32 °C/year, respectively. A decreasing trend in TX10p and TN10p (Figure 8A,B) and an increasing trend in TX90p and TN90p were observed in most parts of the country (Figure 8C,D).
With regard to frost days’ (FD0) extreme temperature indices, 72.9% of stations showed no trend throughout the period of analysis. Only Bahir Dar and Yirgachefe climate stations exhibited an upward trend whereas Dangila, Debre Birhan, Haramaya, Jigjiga, Mekele, and Tulu Bolo climate stations showed a decreasing trend. The lowest amount (−0.19 days/year) of FD0 was recorded at Debre Birhan station (Supplementary Materials Table S2). Similar to the finding obtained in this study, [24] stated that Debre Birhan climate station showed a decreasing trend in frost days.
The cold spell duration indicator (CSDI) and warm spell duration indicator (WSDI) experienced decreasing and increasing trends in the majority of the climate stations, respectively. For example, 67.6% of the climate stations in CSDI displayed a decreasing trend, and 29.7% showed an increasing trend. CSDI showed an increasing trend in the eastern part of Ethiopia and a decreasing trend in the central part (Table 6). The result obtained in the present study are in agreement with [60], who found that the eastern parts of Ethiopia illustrated an upward trend in CSDI. Conversely, 83.8% of climate stations in WSDI showed a positive trend, and the remaining 16.2% of climate stations showed a negative trend. Asebe Teferi, Assela, Bonga, Debre Birhan, and Tulu Bolo climate stations exhibited a decreasing trend for both CSDI and WSDI (Table 6).
Regarding tropical nights (TR20), 48.6% and 13.5% of the total number of climate stations illustrated an increasing and decreasing trend, respectively. TR20 did not show any trends in 37.9% of all temperature stations. At Hosanna and Negele climate stations, significant (α < 0.01) decreasing and increasing trends, respectively, were observed in TR20. However, a previous study undertaken over Ethiopia displayed an increasing trend in TR20 [54].
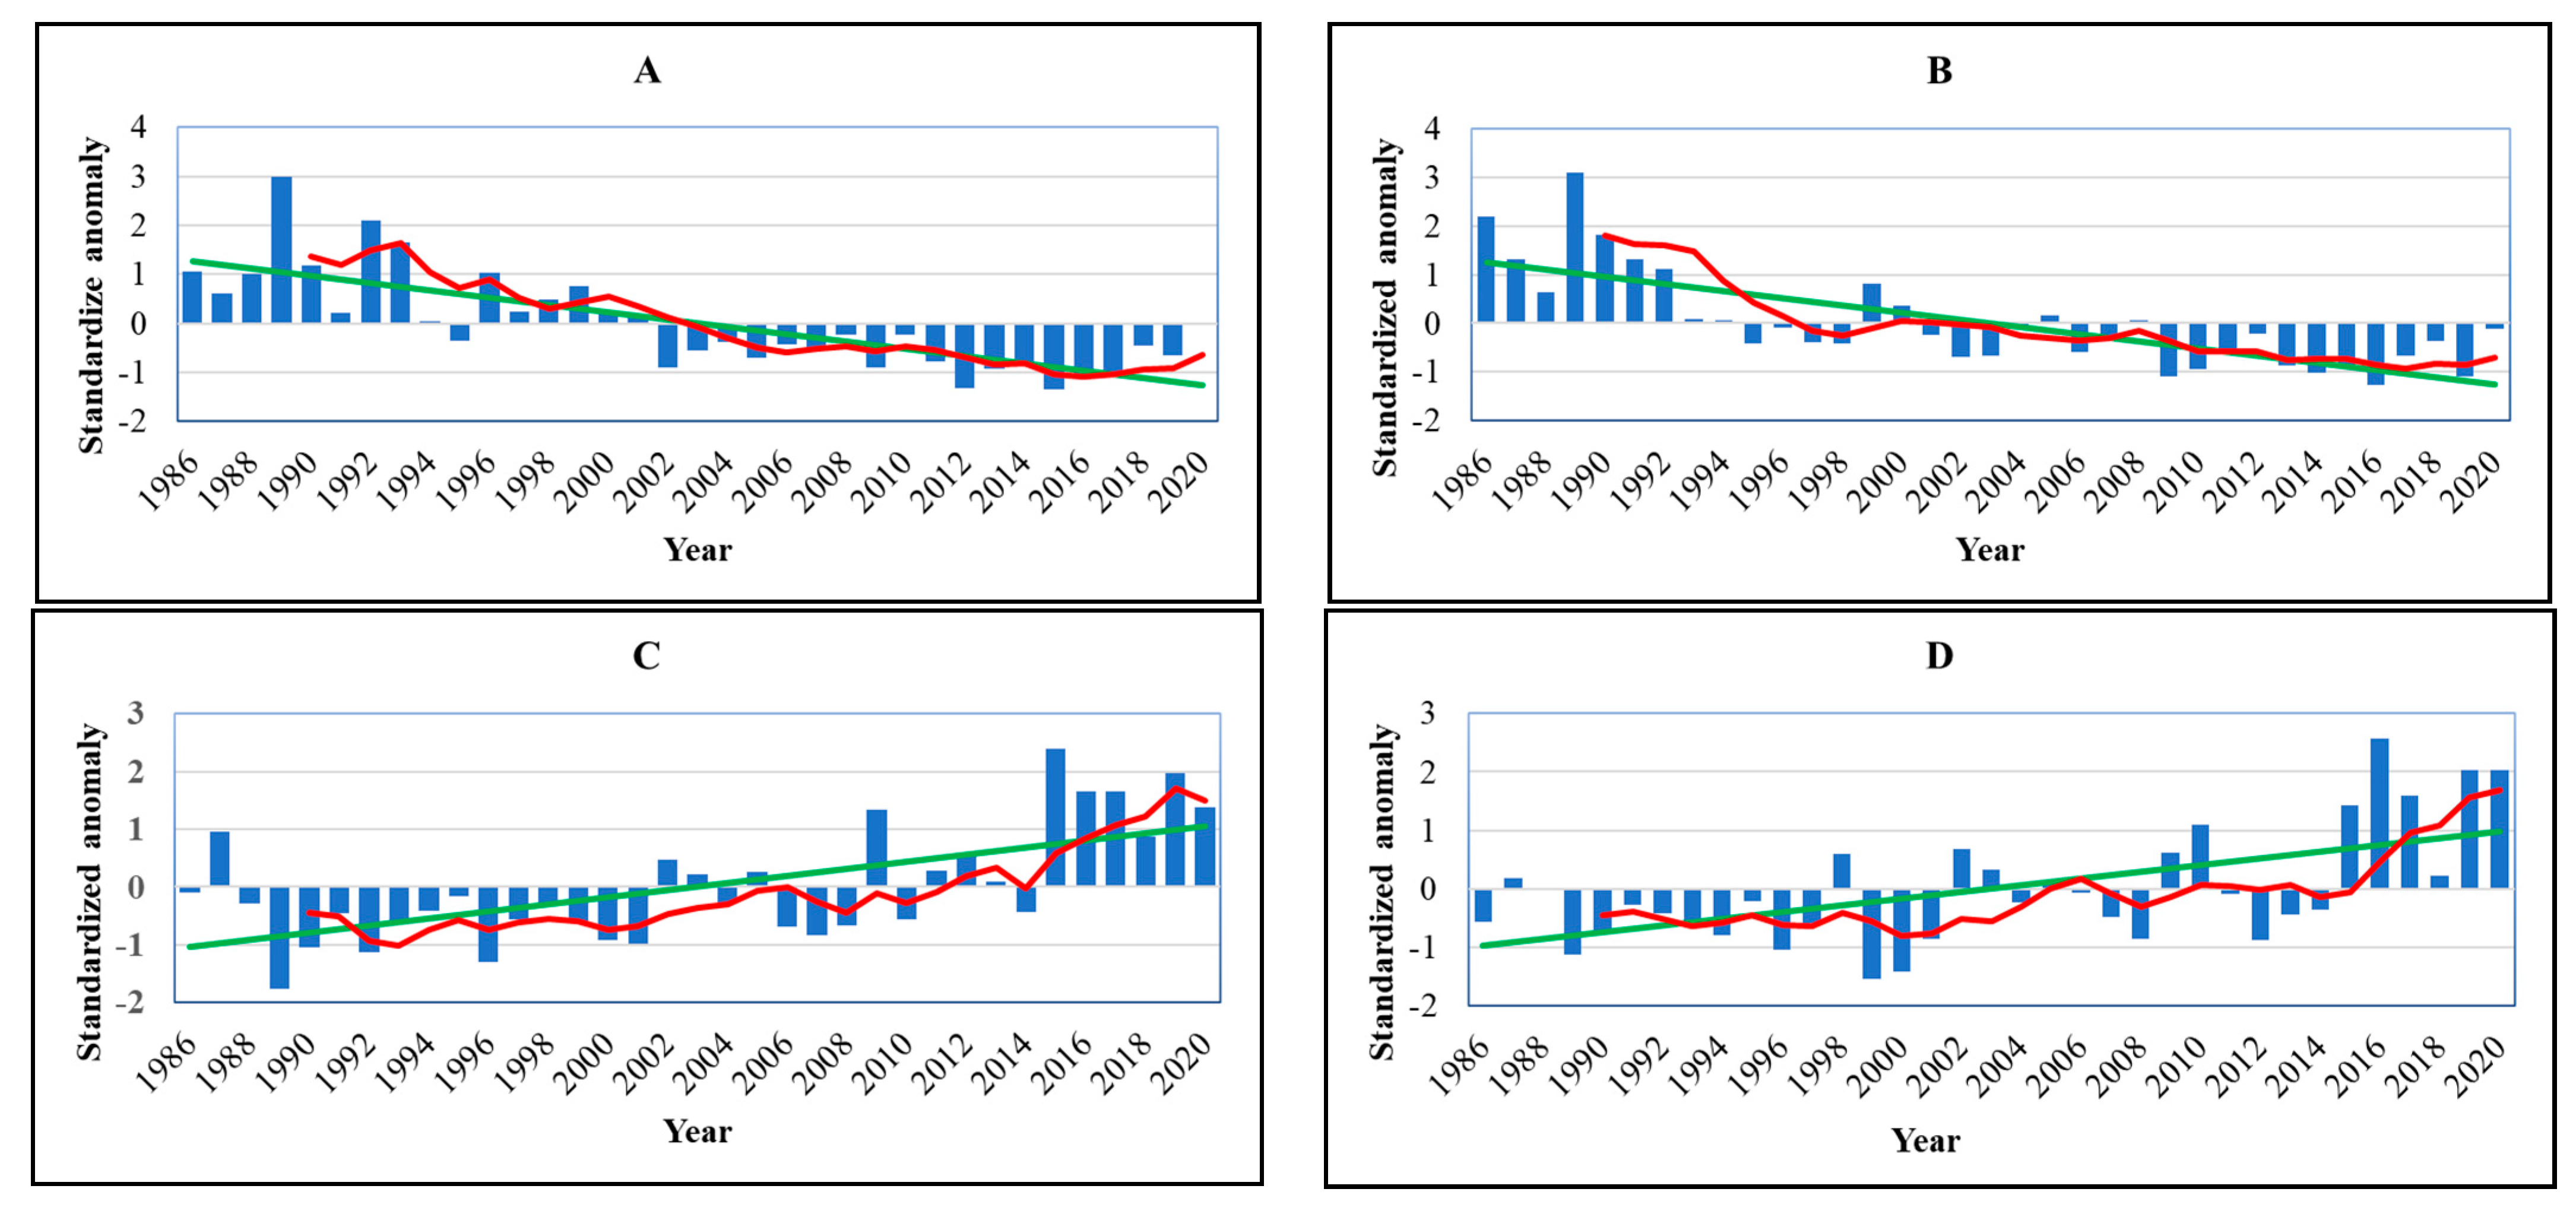
In general, most warm temperature indices detected an increasing trend (TXx, TNx, TX90p, TN90p, WSDI, and SU25) in the majority of the stations. On the other hand, cold temperature extreme indices showed a decreasing trend in the greater number of stations from 1986 to 2020 periods (TX10p, TN10p, and CSDI) (Table 6 and Table 7). This is in line with previous studies that indicated an increase in warm extremes and a decrease in cold extremes in the eco-environment [43]. The mean country-wide trends of extreme temperature indices also showed that the standardized anomaly series of most warm extreme temperature indices exhibit a warming trend, but cold temperature indices (CSDI, TN10p, and TX10p) illustrated a decreasing trend in many of the years (1986–2020) (Figure 9, Figure 10 and Figure 11). The degree of change was more immense in cold extreme temperature indices (TN10p and CSDI) (Figure 10 B and Figure 11C) compared to warm temperature indices (TXx, TNx, TX90p, and SU25) ( Figure 9A,C, Figure 10C and Figure 11A). Similarly, Ref. [24] found that the extent of change was higher in cold extreme temperature indices than in warm extreme temperature indices in the Jemma sub-basin of the upper Blue Nile basin.

3.4. Trends in Temperature Extremes within Agro-Ecological Zones

The trends of extreme temperature indices in the five AEZs of Ethiopia are presented in Table 8. In the hot arid AEZ, warm temperature indices (TXx, TX90p, TN10p, TN90p, CSDI, WSDI, and SU25) showed an increasing trend. In contrast, cold temperature indices such as TNn, TNx, TX10p, and TR20 exhibited a negative trend. In this AEZ, a significant (α < 0.01) increasing trend was observed in TXx, TXn, and WSDI, while a significant decreasing trend (α < 0.01) was observed in TX10p. In the hot arid AEZ, no trend was observed in the frost day’s (FD0) extreme temperature indices.
In the warm semi-arid AEZ, most extreme temperature indices (e.g., TXx, TXn, TNx, TNn, TX90p, TN90p, WSDI, SU25, and TR20) displayed an increasing trend in most stations. A statistically highly significant increasing trend were observed in most extreme temperature indices. On the other hand, TX10p, TN10p, and CSDI illustrated a negative trend. It was observed that all stations displayed a declining trend in TX10p extreme temperature indices. Similar to this result, [61] stated that TX10p extreme temperature indices showed a decreasing trend over warm semi-arid and cool sub-humid AEZ. The authors of [61] also reported that TX90p exhibited an increasing trend in warm semi-arid, cool, and humid AEZs. The highest (0.16 °C/year) and the lowest (−0.01 °C/year) magnitude of trends in the hottest day (TXx) were recorded in the warm semi-arid and cool sub-humid AEZs (Supplementary Materials Table S2). Regarding TXn, the warm semi-arid and cool sub-humid AEZs showed the highest (0.15 °C/year at Gewane station) and the lowest (−0.05 °C/year at Asela station) magnitude of trends, respectively. Tropical night (TR20) extreme temperature indices showed a decreasing trend in hot arid AEZ, but an increasing trend was observed in warm semi-arid AEZ. In the warm semi-arid AEZ, a highly significant decreasing trend in cool days (TX10p) was observed at most stations. Comparable to the hot arid AEZ, frost days (FD0) did not exhibit any trend in the warm semi-arid AEZ.
Similar to the warm semi-arid AEZ, most extreme temperature indices showed an increasing trend in the cool sub-humid AEZ. On the other hand, TX10p, TN10p, and CSDI illustrated a negative trend in this AEZ. Unlike hot arid and warm semi-arid AEZs, a mixed trend was observed on frost days in cool sub-humid AEZ. Similar to the warm semi-arid AEZ, the cold spell duration indicator showed a decreasing trend in most climate stations, whereas warm spell duration showed an increasing trend in most climate stations over the cool sub-humid AEZ. The highest (0.1 °C/year) and lowest (−0.09 °C/year) magnitude of trends for the coldest night (TNn) was recorded in the cool sub-humid and cool and humid AEZs, respectively. The highest magnitudes of trends in TX90p (0.59 °C/year) were found at the Bahir Dar and Dire Dawa climate stations, which are found in cool sub-humid and warm semi-arid AEZs, respectively. The majority of extreme temperature indices showed positive trends in the cool and humid, cool and sub-humid, and warm semi-arid AEZs, but the extreme temperature indices, such as TX10p, TN10P, and CSDI, revealed a declining trend in these AEZs.
In the cool and moist AEZ, TNx, TX10p, TN10p, CSDI, TN90p, and FD0 showed decreasing trends, while the rest of the extreme temperature indices showed an increasing trends (Table 8). With the exception of the cool and moist AEZ, the four AEZs had an increasing warm spell duration indicator (WSDI) index. The warm semi-arid, cool sub-humid, cool and humid, and cool and moist AEZs showed a decreasing tendency in terms of the cold spell duration indicator (CSDI), but the hot arid AEZ showed an increasing trend. This result is supported by [55], which reported that the warm spell duration indicator showed an increasing trend over warm semi-arid, cool sub-humid, as well as cool and humid AEZs. On the other hand, the cold spell duration indicators decreased in hot arid, as well as cool and humid AEZs.
Cool day (TX10p) and warm day (TX90p) extreme temperature indices showed decreasing and increasing trends in all AEZs (Table 8). Most extreme temperature indices showed an increasing trend, except the hot arid AEZ. TX10p showed a significant decreasing trend in the five AEZs, but TX90p depicted a significant decreasing trend (α < 0.01) only in the cool and humid AEZ. FD0 extreme temperature indices showed mixed trends in the cool and humid AEZs, as well as in the cool and sub-humid AEZ, while no trend was observed in the remaining AEZs. Cool day (TX10p) extreme temperature indices showed a statistically (α < 0.01) highly significant decreasing trend in the five AEZs.

4. Conclusions

This study analyzed the trends of 10 rainfall and 13 temperature extreme indices in Ethiopia, both at the station and AEZ levels, using 47 rainfall and 37 temperature stations. The result revealed that the greater number of extreme rainfall indices showed an upward trend in most stations. For example, an increasing trend in 76.7% of the climate stations was observed in consecutive dry days (CDD). About 57.5% of the total stations in very heavy rainfall days (R20) and number of heavy rainfall days (R10) also depicted an increasing trend. Moreover, consecutive wet days (CWD) displayed an increasing trend at 53.2% of the climate stations, but illustrated a declining trend in 44.7% of the stations. The increasing trend of consecutive dry days is a sign of enhanced dryness and a high risk of seasonal droughts. It enhances evaporation from water bodies as well as transpiration from the plant, which reduces surface water and dries out soils and vegetation. The observing increasing trends in the number of very heavy rainfall days (R20) and the number of heavy rainfall days (R10) suggests increased flood, crop damages, landslide, and soil erosion in Ethiopia. With reference to AEZs, most of the considered extreme rainfall indices showed an increasing trend in cool and sub-humid, cool and humid, and cool and moist AEZs. In contrast, in hot arid AEZ, the majority of the studied extreme rainfall indices exhibited a declining trend. The trends of the considered extreme rainfall indices in the warm semi-arid AEZ illustrated equal proportions of increasing and decreasing trends.
Concerning extreme temperature indices, increasing trends in majority of the climate stations were observed in TXx, TXn, TNx, TNn, TX90p, TN90p, WSDI, and SU25. However, TX10p, TN10p, CSDI, FD0, and TR20 exhibited declining trends in most of the stations. The increasing trend of warm temperature extreme indices (TN90p and TX90p) and a downward trend of cold temperature extreme indices (TN10p and TX10p) in most of the climate stations revealed overall warming and dryness trends in the country. Regarding AEZs, the finding revealed a warming trend in all AEZs except in the hot arid AEZ. This warming trend will increase water losses through evaporation and transpiration and hence reduce the availability of soil water content for crop production, as well as surface and groundwater. In general, the observed trends in rainfall and temperature extremes will have tremendous direct and indirect impacts on agriculture, water resources, health, and other sectors in the country. Thus, identifying and implementing climate change adaptation strategies is imperative for coping with the negative impacts of climate extremes in Ethiopia. This study suggests further research on identifying the exposure, sensitivity, adaptive capacity, and vulnerability of the different sectors, as well as community groups, toward the observed climate extremes.

Supplementary Materials

The following supporting information can be downloaded at: https://www.mdpi.com/article/10.3390/atmos14030483/s1, Table S1: The magnitudes of trends in extreme rainfall indices across different stations in Ethiopia (value of Sen’s slope); Table S2: The magnitudes of trends in extreme temperature indices across different stations in Ethiopia (value of Sen’s slope).

Author Contributions

Conceptualization, G.B.W., T.G., A.W.W., Y.T.D., M.T.T., A.H., B.Z., D.A.B., E.A., J.A.M., A.B., A.S. and R.S.; methodology, G.B.W., T.G., A.W.W., Y.T.D., M.T.T., A.H., B.Z., D.A.B., E.A., J.A.M., A.B., A.S. and R.S.; software, G.B.W., T.G. and J.A.M.; investigation, T.G.; data curation, T.G.; writing—original draft preparation, G.B.W., T.G., M.T.T., D.A.B., J.A.M. and T.M.L.; writing—review and editing, G.B.W., T.G., A.W.W., Y.T.D., M.T.T., A.H., B.Z., D.A.B., E.A., J.A.M., T.M.L., A.B., A.S. and R.S.; visualization, G.B.W. and T.G.; supervision, T.G. All authors have read and agreed to the published version of the manuscript.

Funding

This research received no external funding.

Institutional Review Board Statement

Not applicable.

Informed Consent Statement

Not applicable.

Data Availability Statement

The rainfall and temperature data obtained from the National Meteorology Agency (NMA) is for self-use only, and hence the data will not be shared.

Acknowledgments

The authors greatly acknowledge the National Meteorology Agency (NMA) for providing rainfall and temperature data for the study. The authors are also very much grateful for the editor of the journal and the three anonymous reviewers for their constructive comments.

Conflicts of Interest

The authors declare no conflict of interest.

References

  1. IPCC. Climate Change 2021: The Physical Science Basis. In The Physical Science Basis. Contribution of Working Group I to the Sixth Assessment Report of the Intergovernmental Panel on Climate Change; Masson-Delmotte, V., Zhai, P., Pirani, A., Connors, S.L., Péan, C., Berger, S., Caud, N., Chen, Y., Goldfarb, L., Gomis, M.I., et al., Eds.; Cambridge University Press: Cambridge, UK, 2021; in press. [Google Scholar]
  2. Smith, M.D. The ecological role of climate extremes: Current understanding and future prospects. J. Ecol. 2011, 99, 651–655. [Google Scholar] [CrossRef]
  3. IPCC. Summary for Policymakers. In Managing the Risks of Extreme Events and Disasters to Advance Climate Change Adaptation; Field, C.B., Barros, V., Stocker, T.F., Qin, D., Dokken, D.J., Ebi, K.L., Mastrandrea, M.D., Mach, K.J., Plattner, G.-K., Allen, S.K., et al., Eds.; A Special Report of Working Groups I and II of the Intergovernmental Panel on Climate Change; Cambridge University Press: Cambridge, UK; New York, NY, USA, 2012; pp. 3–21. [Google Scholar]
  4. Power, S.B.; Delage, F.P. Setting and smashing extreme temperature records over the coming century. Nature Climate Change 2019, 9, 529–534. [Google Scholar] [CrossRef]
  5. Okwala, T.; Shrestha, S.; Ghimire, S.; Mohanasundaram, S.; Datta, A. Assessment of climate change impacts on water balance and hydrological extremes in Bang Pakong-Prachin Buri river basin, Thailand. Environ. Res. 2020, 186, 109544. [Google Scholar] [CrossRef] [PubMed]
  6. Hansen, J.; Ruedy, R.; Sato, M.; Lo, K. Global surface temperature change. Rev. Geophys. 2010, 48. [Google Scholar] [CrossRef] [Green Version]
  7. IPCC. Climate Change 2013: The Physical Science Basis. In Contribution of Working Group I to the Fifth Assessment Report of the Intergovernmental Panel on Climate Change; Stocker, T.F., Qin, D., Plattner, G.-K., Tignor, M., Allen, S.K., Boschung, J., Nauels, A., Xia, Y., Bex, V., Midgley, P.M., Eds.; Cambridge University Press: Cambridge, UK; New York, NY, USA, 2013; p. 1535. [Google Scholar]
  8. IPCC. Climate Change 2014: Synthesis Report. In Contribution of Working Groups I, II and III to the Fifth Assessment Report of the Intergovernmental Panel on Climate Change; Core Writing Team, Pachauri, R.K., Meyer, L.A., Eds.; IPCC: Geneva, Switzerland, 2014; p. 151. [Google Scholar]
  9. Donat, M.G.; Lowry, A.L.; Alexander, L.V.; O’Gorman, P.A.; Maher, N. More extreme precipitation in the world’s dry and wet regions. Nat. Clim. Change 2016, 6, 508–513. [Google Scholar] [CrossRef]
  10. Bao, W.; Yue, J.; Rao, Y. A deep learning framework for financial time series using stacked autoencoders and long-short term memory. PLoS ONE 2017, 12, e0180944. [Google Scholar] [CrossRef] [Green Version]
  11. Xie, B.; Brewer, M.B.; Hayes, B.K.; McDonald, R.I.; Newell, B.R. Predicting climate change risk perception and willingness to act. J. Environ. Psychol. 2019, 65, 101331. [Google Scholar] [CrossRef]
  12. Wang, W.; Zhang, Y.; Tang, Q. Impact assessment of climate change and human activities on streamflow signatures in the Yellow River Basin using the Budyko hypothesis and derived differential equation. J. Hydrol. 2020, 591, 125460. [Google Scholar] [CrossRef]
  13. Meehl, G.A.; Zwiers, F.; Evans, J.; Knutson, T.; Mearns, L.; Whetton, P. Trends in extreme weather and climate events: Issues related to modeling extremes in projections of future climate change. Bull. Am. Meteorol. Soc. 2000, 81, 427–436. [Google Scholar] [CrossRef]
  14. Sun, Q.; Miao, C.; Hanel, M.; Borthwick, A.G.; Duan, Q.; Ji, D.; Li, H. Global heat stress on health, wildfires, and agricultural crops under different levels of climate warming. Environment international 2019, 128, 125–136. [Google Scholar] [CrossRef]
  15. Wu, T.; Lu, Y.; Fang, Y.; Xin, X.; Li, L.; Li, W.; Jie, W.; Zhang, J.; Liu, Y.; Zhang, L. The Beijing Climate Center climate system model (BCC-CSM): The main progress from CMIP5 to CMIP6. Geosci. Model Dev. 2019, 12, 1573–1600. [Google Scholar] [CrossRef] [Green Version]
  16. Schneider, S.; Sarukhan, J.; Adejuwon, J.; Azar, C.; Baethgen, W.; Hope, C.; Moss, R.; Leary, N.; Richels, R.; Van Ypersele, J. Overview of impacts, adaptation, and vulnerability to climate change. Clim. Change 2001, 75–103. [Google Scholar]
  17. Mengistu, K.; Alemu, K.; Destaw, B. Prevalence of malnutrition and associated factors among children aged 6–59 months at Hidabu Abote District, North Shewa, Oromia Regional State. J. Nutr. Disord. Ther. 2013, 1, 2161–2509. [Google Scholar] [CrossRef]
  18. Dile, Y.T.; Tekleab, S.; Ayana, E.K.; Gebrehiwot, S.G.; Worqlul, A.W.; Bayabil, H.K.; Yimam, Y.T.; Tilahun, S.A.; Daggupati, P.; Karlberg, L. Advances in water resources research in the Upper Blue Nile basin and the way forward: A review. J. Hydrol. 2018, 560, 407–423. [Google Scholar] [CrossRef]
  19. Jothimani, M.; Abebe, A.; Dawit, Z. Mapping of soil erosion-prone sub-watersheds through drainage morphometric analysis and weighted sum approach: A case study of the Kulfo River basin, Rift valley, Arba Minch, Southern Ethiopia. Model. Earth Syst. Environ. 2020, 6, 2377–2389. [Google Scholar] [CrossRef]
  20. Yilma, A.D.; Awulachew, S.B. Characterization and Atlas of the Blue Nile Basin and its Sub basins. In Proceedings of the Intermediate Results Dissemination Workshop held at the International Livestock Research Institute (ILRI), Addis Ababa, Ethiopia, 5–6 February 2009. [Google Scholar]
  21. Taye, M.T.; Willems, P. Temporal variability of hydroclimatic extremes in the Blue Nile basin. Water Resour. Res. 2012, 48. [Google Scholar] [CrossRef]
  22. Mohammed, J.A.; Yimam, Z.A. Spatiotemporal variability and trend analysis of rainfall in Beshilo sub-basin, Upper Blue Nile (Abbay) Basin of Ethiopia. Arab. J. Geosci. 2022, 15, 1387. [Google Scholar] [CrossRef]
  23. Mengistu, D.; Bewket, W.; Lal, R. Recent spatiotemporal temperature and rainfall variability and trends over the Upper Blue Nile River Basin, Ethiopia. Int. J. Climatol. 2014, 34, 2278–2292. [Google Scholar] [CrossRef]
  24. Worku, G.; Teferi, E.; Bantider, A.; Dile, Y. Observed changes in extremes of daily rainfall and temperature in Jemma sub-basin, Upper Blue Nile Basin. Ethiopia. Theor. Appl. Climatol. 2019, 135, 839–854. [Google Scholar] [CrossRef]
  25. Worqlul, A.W.; Dile, Y.T.; Ayana, E.K.; Jeong, J.; Adem, A.A.; Gerik, T. Impact of Climate Change on Streamflow Hydrology in Headwater Catchments of the Upper Blue Nile Basin, Ethiopia. Water 2018, 10, 120, Erratum in Water 2018, 10, 761. [Google Scholar] [CrossRef] [Green Version]
  26. Degefu, M.A.; Bewket, W. Variability and trends in rainfall amount and extreme event indices in the Omo-Ghibe River Basin, Ethiopia. Reg. Environ. Change 2014, 14, 799–810. [Google Scholar] [CrossRef]
  27. Gummadi, S.; Rao, K.; Seid, J.; Legesse, G.; Kadiyala, M.; Takele, R.; Amede, T.; Whitbread, A. Spatio-temporal variability and trends of precipitation and extreme rainfall events in Ethiopia in 1980–2010. Theor. Appl. Climatol. 2018, 134, 1315–1328. [Google Scholar] [CrossRef] [Green Version]
  28. Mohammed, Y.; Yimer, F.; Tadesse, M.; Tesfaye, K. Variability and trends of rainfall extreme events in north east highlands of Ethiopia. Int. J. Hydrol. 2018, 2, 594–605. [Google Scholar] [CrossRef]
  29. Weldegerima, T.M.; Zeleke, T.T.; Birhanu, B.S.; Zaitchik, B.F.; Fetene, Z.A. Analysis of rainfall trends and its relationship with SST signals in the Lake Tana Basin, Ethiopia. Adv. Meteorol. 2018, 2018. [Google Scholar] [CrossRef] [Green Version]
  30. Dawit, M.; Halefom, A.; Teshome, A.; Sisay, E.; Shewayirga, B.; Dananto, M. Changes and variability of precipitation and temperature in the Guna Tana watershed, Upper Blue Nile Basin, Ethiopia. Model. Earth Syst. Environ. 2019, 5, 1395–1404. [Google Scholar] [CrossRef]
  31. Gedefaw, M.; Yan, D.; Wang, H.; Qin, T.; Wang, K. Analysis of the recent trends of two climate parameters over two eco-regions of Ethiopia. Water 2019, 11, 161. [Google Scholar] [CrossRef] [Green Version]
  32. Abegaz, W.B.; Abera, E.A. Temperature and rainfall trends in north eastern Ethiopia. J. Clim. Weather. Forecast. 2020, 8, 262. [Google Scholar] [CrossRef]
  33. Ademe, D.; Ziatchik, B.F.; Tesfaye, K.; Simane, B.; Alemayehu, G.; Adgo, E. Climate trends and variability at adaptation scale: Patterns and perceptions in an agricultural region of the Ethiopian Highlands. Weather. Clim. Extrem. 2020, 29, 100263. [Google Scholar] [CrossRef]
  34. Geremew, G.M.; Mini, S.; Abegaz, A. Spatiotemporal variability and trends in rainfall extremes in Enebsie Sar Midir district, northwest Ethiopia. Model. Earth Syst. Environ. 2020, 6, 1177–1187. [Google Scholar] [CrossRef]
  35. Mohammed, J.A.; Gashaw, T.; Tefera, G.W.; Dile, Y.T.; Worqlul, A.W.; Addisu, S. Changes in observed rainfall and temperature extremes in the Upper Blue Nile Basin of Ethiopia. Weather. Clim. Extrem. 2022, 37, 100468. [Google Scholar] [CrossRef]
  36. Donat, M.; Alexander, L.V.; Yang, H.; Durre, I.; Vose, R.; Dunn, R.J.; Willett, K.M.; Aguilar, E.; Brunet, M.; Caesar, J. Updated analyses of temperature and precipitation extreme indices since the beginning of the twentieth century: The HadEX2 dataset. J. Geophys. Res. Atmos. 2013, 118, 2098–2118. [Google Scholar] [CrossRef] [Green Version]
  37. Nashwan, M.S.; Shahid, S.; Wang, X. Uncertainty in estimated trends using gridded rainfall data: A case study of Bangladesh. Water 2019, 11, 349. [Google Scholar] [CrossRef] [Green Version]
  38. Karlsson, J. Scoping Study of Water Resource Management in the Textile Industry in Ethiopia; SIWI Paper 23; SIWI: Stockholm, Sweden, 2015. [Google Scholar]
  39. NMA. Climate Change National Adaptation Programme of Action (Napa) of Ethiopia; National Meteorological Services Agency, Ministry of Water Resources, Federal Democratic Republic of Ethiopia: Addis Ababa, Ethiopia, 2007. [Google Scholar]
  40. NMSA. Federal Democratic Republic of Ethiopia Ministry of Water Resources National Meteorological Services Agency, Initial National Communication of Ethiopia to the United Nations Framework Convention on Climate Change (UNFCCC); NMSA: Addis Ababa, Ethiopia, 2001. [Google Scholar]
  41. MoA. Minister of Agriculture. Agro-Ecological Zones of Ethiopia. Natural Resources Management and Regulatory Department. With Support of German Agency for Technical Cooperation (GTZ); MoA: Addis Ababa, Ethiopia, 1998. [Google Scholar]
  42. Haylock, M.R.; Peterson, T.C.; Alves, L.M.; Ambrizzi, T.; Anunciação, Y.; Baez, J.; Barros, V.; Berlato, M.; Bidegain, M.; Coronel, G. Trends in total and extreme South American rainfall in 1960–2000 and links with sea surface temperature. J. Clim. 2006, 19, 1490–1512. [Google Scholar] [CrossRef]
  43. Mekasha, A.; Tesfaye, K.; Duncan, A.J. Trends in daily observed temperature and precipitation extremes over three Ethiopian eco-environments. Int. J. Climatol. 2014, 34, 1990–1999. [Google Scholar] [CrossRef]
  44. Albert, M.G.T.K.; Zwiers, F.W.; Zhang, X. Guidelines on Analysis of Extremes in a Changing Climate in Support of Informed Decisions for Adaptation; Climate Data and Monitoring WCDMP-No.72; World Meteorological Organization (WMO): Geneva, Switzerland, 2009.
  45. Van Buuren, S.; Groothuis-Oudshoorn, K.; Robitzsch, A.; Vink, G.; Doove, L.; Jolani, S.; Schouten, R.; Gaffert, P.; Meinfelder, F.; Gray, B. Mice: Multivariate Imputation by Chained Equations. 2017. Available online: https://cran.r-project.org/ (accessed on 7 April 2022).
  46. Zhang, X.; Yang, F. RClimDex (1.0) user manual. Clim. Res. Branch Environ. Can. 2004, 22. [Google Scholar]
  47. Zhang, D.D.; Lee, H.F.; Wang, C.; Li, B.; Pei, Q.; Zhang, J.; An, Y. The causality analysis of climate change and large-scale human crisis. Proc. Natl. Acad. Sci. USA 2011, 108, 17296–17301. [Google Scholar] [CrossRef] [Green Version]
  48. Skansi, M.; Brunet, M.; Sigró, J.; Aguilar, E.; Groening, J.A.A.; Bentancur, O.J.; Geier, Y.R.C.; Amaya, R.L.C.; Jácome, H.; Ramos, A.M. Warming and wetting signals emerging from analysis of changes in climate extreme indices over South America. Glob. Planet. Chang. 2013, 100, 295–307. [Google Scholar] [CrossRef]
  49. Mann, H.B. Nonparametric tests against trend. Econom. J. Econom. Soc. 1945, 13, 245–259. [Google Scholar] [CrossRef]
  50. Sen, P.K. Estimates of the regression coefficient based on Kendall’s tau. J. Am. Stat. Assoc. 1968, 63, 1379–1389. [Google Scholar] [CrossRef]
  51. Kebede, G.; Bewket, W. Variations in rainfall and extreme event indices in the wettest part of Ethiopia. SINET Ethiop. J. Sci. 2009, 32, 129–140. [Google Scholar]
  52. Gari, A.; Getnet, M.; Nigatu, L. Observed and future climate variability, trend, and extremes in central highlands of Ethiopia: A case study at Arsi Robe, Asasa, Debre Zeit and Kulumsa Areas. Environ. Pollut. Clim. Change 2018, 2, 10–4172. [Google Scholar] [CrossRef]
  53. Berhane, A.; Hadgu, G.; Worku, W.; Abrha, B. Trends in extreme temperature and rainfall indices in the semi-arid areas of Western Tigray, Ethiopia. Environ. Syst. Res. 2020, 9, 3. [Google Scholar] [CrossRef] [Green Version]
  54. Teshome, A.; Zhang, J. Increase of extreme drought over Ethiopia under climate warming. Adv. Meteorol. 2019, 2019. [Google Scholar] [CrossRef] [Green Version]
  55. Dendir, Z.; Birhanu, B.S. Analysis of Observed Trends in Daily Temperature and Precipitation Extremes in Different Agroecologies of Gurage Zone, Southern Ethiopia. Adv. Meteorol. 2022, 2022. [Google Scholar] [CrossRef]
  56. Birhan, D.A.; Zaitchik, B.F.; Fantaye, K.T.; Birhanu, B.S.; Damot, G.A.; Tsegaye, E.A. Observed and projected trends in climate extremes in a tropical highland region: An agroecosystem perspective. Int. J. Climatol. 2022, 42, 2493–2513. [Google Scholar] [CrossRef]
  57. Mekasha, M.T. Evaluation of Extreme Rainfall and Temperature Variability (in Upper Blue Nile, Ethiopia). Addis Ababa University: Addis Ababa, Ethiopia, 2011. [Google Scholar]
  58. Vogel, E.; Donat, M.G.; Alexander, L.V.; Meinshausen, M.; Ray, D.K.; Karoly, D.; Meinshausen, N.; Frieler, K. The effects of climate extremes on global agricultural yields. Environ. Res. Lett. 2019, 14, 054010. [Google Scholar] [CrossRef]
  59. Omondi, P.A.O.; Awange, J.L.; Forootan, E.; Ogallo, L.A.; Barakiza, R.; Girmaw, G.B.; Fesseha, I.; Kululetera, V.; Kilembe, C.; Mbati, M.M. Changes in temperature and precipitation extremes over the Greater Horn of Africa region from 1961 to 2010. Int. J. Climatol. 2014, 34, 1262–1277. [Google Scholar] [CrossRef]
  60. Gebrechorkos, S.H.; Hülsmann, S.; Bernhofer, C. Changes in temperature and precipitation extremes in Ethiopia, Kenya, and Tanzania. Int. J. Climatol. 2019, 39, 18–30. [Google Scholar] [CrossRef] [Green Version]
  61. Esayas, B.; Simane, B.; Teferi, E.; Ongoma, V.; Tefera, N. Trends in extreme climate events over three agroecological zones of southern Ethiopia. Adv. Meteorol. 2018, 2018. [Google Scholar] [CrossRef]
Figure 1. Location of the study area from Africa and its agro-ecological zones.
Atmosphere 14 00483 g001
Figure 2. Spatial distributions of trends of the extreme rainfall indices over Ethiopia for the long-term period between 1986 and 2020: (A) PRCPTOT, (B) Rx1day, (C) Rx5day, (D) SDII, (E) R10, and (F) R20. Note: Filled blue upright and filled red inverted triangles indicate increasing and decreasing trends, respectively, while circles filled in black indicate no trend. Significantly increasing and decreasing trends are symbolized by filled green upright triangles and filled yellow inverted triangles, respectively. Insignificant trends are represented by filled upright and inverted triangles.
Atmosphere 14 00483 g002
Figure 3. Spatial distributions of trends of the extreme rainfall indices over Ethiopia for the long-term period between 1986 and 2020: (A) CDD, (B) CWD, (C) R95p, and (D) R99p. Note: Filled blue upright and filled red inverted triangles indicate increasing and decreasing trends, respectively, while circles filled in black indicate no trend. Significantly increasing and decreasing trends are symbolized by filled green upright triangles and filled yellow inverted triangles, respectively. Insignificant trends are represented by filled upright and inverted triangles.
Atmosphere 14 00483 g003
Figure 4. Mean country-wide extreme rainfall indices in the period between 1986 and 2020: (A) PRCPTOT, (B) Rx1day, (C) Rx5day, and (D) SDII. Note: The straight green line is the linear trend for the variables while the red curved line is the five-year moving average.
Atmosphere 14 00483 g004
Figure 5. Mean country-wide extreme rainfall indices between 1986 and 2020 periods: (A) R10, (B) R20, (C) R95p, and (D) R99p. Note: The straight green line is the linear trend for the variables while the red curved line is the five-year moving average.
Atmosphere 14 00483 g005
Figure 6. Time series diagram of the mean country-wide extreme rainfall indices in the period between 1986 and 2020: (A) CDD, (B) CWD. Note: The straight green line is the linear trend for the variables while the red curved line is the five-year moving average.
Atmosphere 14 00483 g006
Figure 7. Spatial distributions of trends of the extreme temperature indices over Ethiopia for the long-term period between 1986 and 2020: (A) TXx, (B) TXn, (C) TNx, and (D) TNn. Note: Filled blue upright and filled red inverted triangles indicate increasing and decreasing trends, respectively, while circles filled in black indicate no trend. Significantly increasing and decreasing trends are symbolized by filled green upright triangles and filled yellow inverted triangles, respectively. Insignificant trends are represented by filled upright and inverted triangles.
Atmosphere 14 00483 g007
Figure 8. Spatial distributions of trends of the extreme temperature indices over Ethiopia for the long-term period between 1986 and 2020: (A) TX10p, (B) TN10p, (C) TX90p, and (D) TN90p. Note: Filled blue upright and filled red inverted triangle indicate increasing and decreasing trends, respectively, while circle black filled indicates no trend. Significantly increasing and decreasing trends are symbolized by a filled green upright triangle and a filled yellow inverted triangle, respectively. Insignificant trends are represented by filled upright and inverted triangles.
Atmosphere 14 00483 g008aAtmosphere 14 00483 g008b
Figure 9. Time series diagram of the mean country-wide extreme temperature indices in the period between 1986 and 2020: (A) TXx, (B) TXn, (C) TNx, and (D) TNn. Note: The straight green line is the linear trend for the variables, while the red curved line is the five-year moving average.
Atmosphere 14 00483 g009
Figure 10. The mean country-wide extreme temperature indices in the period between 1986 and 2020: (A) TX10p, (B) TN10p, (C) TX90p, and (D) TN90p. Note: The straight green line is the linear trend for the variables, while the red curved line is the five-year moving average.
Atmosphere 14 00483 g010
Figure 11. Time series diagram of the mean country-wide extreme temperature indices in the time period between 1986 and 2020: (A) SU25, (B) FD0, (C) CSDI, and (D) WSDI. Note: The straight green line is the linear trend for the variables, while the red curved line is the five-year moving average.
Atmosphere 14 00483 g011
Table 1. Descriptions of the studied meteorological stations.
No.StationsGeographic CoordinatesElevation (m a.s.l)Traditional AEZsPeriod of RecordMissing Data (%)
Longitude (°)Latitude (°)RainfallTmaxTmin
1Abomsa39.838.471630Cool and humid1986–202017.90--
2Adama39.288.561648Cool sub-humid1986–20201.612.718.46
3Addis Ababa38.759.022386Cool and humid1986–20200.771.051.00
4Ambo37.848.992068Cool sub-humid1986–202020.4822.7220.56
5Arba minch37.566.061220Warm semi-arid1986–20203.58--
6Asebe Teferi40.879.071796Cool sub-humid1986–202016.5117.3817.76
7Asela39.147.962420Cool and humid1986–20206.849.6010.16
8Asgori38.338.791979Cool sub-humid1986–202024.8--
9Asosa34.5510.051541Cool sub-humid1986–202024.27--
10Bahir Dar37.4211.601770Cool sub-humid1986–20208.578.978.43
11Boditi37.866.962043Cool sub-humid1986–20202.412.632.42
12Bonga36.247.281599Cool sub-humid1986–20207.078.199.07
13Butajira38.388.122074Cool sub-humid1986–202016.32--
14Dangila36.8511.432116Cool sub-humid1986–20208.7111.1110.36
15Debre Birhan39.519.673206Cool and moist1986–20206.591.682.03
16Debre Markos37.7410.332446Cool and humid1986–20203.665.415.44
17Debre Tabor38.0011.872612Cool and humid1986–202014.8616.5116.43
18Degehabur43.568.231070Warm semi-arid1986–202013.51--
19Dilla38.316.381515Cool sub-humid1986–202010.73--
20Dire Dawa41.909.611045Warm semi-arid1986–202010.3911.0010.57
21Dubity41.0911.73381Hot arid1986–202013.0615.4417.21
22Fiche38.749.772798Cool and humid1986–20203.575.254.90
23Gewane40.6610.16618Warm semi-arid1986–2020-18.4819.17
24Gimbi35.849.201844Cool sub humid1986–202012.35--
25Gonder37.4312.521973Cool sub-humid1986–20205.088.3413.51
26Gore35.558.162024Cool sub-humid1986–20202.528.035.55
27Haramaya42.049.422025Cool sub-humid1986–202017.9718.4819.91
28Hawassa38.487.071694Cool sub-humid1986–20200.530.410.45
29Hosanna37.867.572306Cool and humid1986–20202.0215.9013.82
30Jijiga42.729.371557Cool sub-humid1986–202017.3119.7423.33
31Jimma36.827.671710Cool sub-humid1986–20201.28--
32Kombolcha39.7211.081857Cool sub-humid1986–20203.013.364.01
33Konso37.445.341431Warm semi-arid1986–20204.8714.1014.36
34Lalibela39.0412.042487Cool and humid1986–202021.8323.1721.86
35Mekele39.5313.472221Cool and humid1986–202013.5717.4615.61
36Metema36.4112.77790Warm semi-arid1986–202022.36--
37Mizan Teferi35.587.001444Warm semi-arid1986–202024.24--
38Mojo39.118.611763Cool sub-humid1986–202017.6618.5122.76
39Moyale39.055.051166Warm semi-arid1986–20206.4514.4014.26
40Negele39.275.331439Warm semi-arid1986–20208.4710.838.66
41Nekemte36.559.082119Cool sub-humid1986–202014.4221.0318.27
42Pawe36.4111.311119Warm semi-arid1986–20207.8622.522.32
43Robe40.057.132480Cool and humid1986–20204.082.931.60
44Teppi35.447.201208Warm semi-arid1986–20207.757.897.60
45Tulu bolo38.228.672100Cool sub-humid1986–202011.0421.6121.91
46Wolaita37.756.821854Cool sub-humid1986–20200.595.365.17
47Yirgachefe38.216.151856Cool sub-humid1986–20202.252.273.99
48Yirgalem38.436.801786Cool sub-humid1986–202018.3019.9720.42
Table 2. The selected rainfall and temperature extreme indices for the study.
Indices Index NameDefinition of the IndexUnit
Rainfall indices
PRCPTOTAnnual total wet day rainfallAnnual total PRCP in wet days (RR ≥ 1 mm)mm
R99pRainfall on extremely wet daysAnnual total PRCP when RR > 99th percentilemm
R95pRainfall on very wet daysAnnual total PRCP when RR > 95th percentile mm
R20Number of very heavy precipitation days Annual count of days when PRCP ≥ 20 mmDays
R10Number of heavy precipitation daysAnnual count of days when PRCP ≥ 10 mm Days
CWDConsecutive wet daysMaximum number of consecutive days with RR ≥ 1 mmDays
CDDConsecutive dry daysMaximum number of consecutive days with RR < 1 mmDays
SDIISimple daily intensity indexAnnual total precipitation divided by the number of wet days (defined as PRCP ≥ 1.0 mm) in the year mm/day
Rx5dayHighest rainfall amount in a five-day periodMonthly maximum consecutive five-day precipitationmm
Rx1dayHighest rainfall amount in a one-day periodMonthly maximum one-day precipitationmm
Temperature indices
TXxMax Tmax/warmest dayMaximum value of daily maximum temperature°C
TXnMin Tmax/coldest dayMinimum value of daily maximum temperature°C
TNxMax Tmin/warmest nightMaximum value of daily minimum temperature°C
TNnMin Tmin/coldest nightMinimum value of daily minimum temperature°C
TN10pCool nightsPercentage of days when TN < 10th percentileDays
TN90pWarm nightsPercentage of days when TN > 90th percentileDays
TX10pCool daysPercentage of days when TX < 10th percentileDays
TX90pWarm daysPercentage of days when TX > 90th percentileDays
TR20Tropical nightsAnnual count when TN (daily minimum) > 20 °CDays
FD0Frost daysAnnual count when TN (daily minimum) < 0 °CDays
SU25Summer daysAnnual count when TX (daily maximum) > 25 °CDays
WSDIWarm spell duration indicatorAnnual count of days with at least six consecutive days when TX > 90th percentileDays
CSDI Cold spell duration indicator Annual count of days with at least six consecutive days when TN < 10th percentile Days
Table 3. The trends of extreme rainfall indices at different stations of Ethiopia.
No.Stations CDDCWDPRCPTOTR10R20R95pR99pRx1dayRx5daySDII
1Abomsa0.11−1.20−0.030.57−1.46−0.201.060.18−0.610.00
2Adama0.061.871.12−0.471.031.320.930.851.48−0.54
3Addis Ababa0.540.430.140.770.16−0.94−0.77−0.72−0.33−0.11
4Ambo1.072.27+−0.91−0.54−1.37−0.88−0.86−0.67−0.17−0.83
5Arba minch1.540.541.450.802.12+1.901.470.271.97+1.85
6Asebe Teferi0.360.570.26−0.14−1.08−1.17−0.54−1.43−1.04−1.88
7Asela0.401.71−0.45−1.08−0.600.970.35−1.920.00−1.45
8Asgori−1.52−3.03 *0.65−1.41−0.14−0.64−1.020.75−0.67−1.71
9Asosa−0.071.662.33+1.691.711.050.660.041.420.55
10Bahir Dar0.24−0.852.22+2.24+1.92+2.46 *0.931.621.791.98+
11Boditi0.30−0.84−0.45−0.23−0.690.84−0.260.540.091.21
12Bonga0.95−0.873.47 *3.24 *2.43 *2.36+1.861.732.71 *3.65 *
13Butajira−0.55−1.70−1.31−1.18−0.61−2.73 *−1.57−2.33+−3.25 *−1.26
14Dangila0.550.541.621.771.440.990.840.171.111.55
15Debre Birhan1.791.502.39+1.781.600.481.401.99+0.822.05
16Debre Markos1.610.23+0.651.27−0.55−1.110.16−0.260.740.57
17Debre Tabor1.860.341.762.21+1.200.971.761.191.731.14
18Degehabur−0.01−0.68−0.031.230.20−1.55−1.03−1.39−1.56−0.54
19Dilla2.23+0.240.620.442.04+1.761.611.241.831.81
20Dire Dawa0.63−1.12−0.85−1.46−0.79−0.67−0.79−0.97−1.92−0.68
21Dubity0.620.00−0.94−0.23−1.75−0.751.18−0.24−0.94−0.71
22Fiche1.19−0.472.05+1.201.002.30+2.02+1.392.61 *1.95+
23Gimbi−1.350.491.25−0.23−1.150.910.530.80−0.26−1.95+
24Gonder−0.04−1.781.531.081.571.560.961.071.591.69
25Gore1.140.060.17−0.63−0.46−0.230.730.820.13−0.98
26Haramaya1.93+0.160.001.001.661.420.390.430.533.02 *
27Hawassa0.60−0.490.810.941.190.78−0.19−0.80−1.481.15
28Hosanna0.750.460.170.261.061.360.340.010.101.05
29Jijiga3.61 *−0.32−0.82−0.77−0.84−1.36−1.37−1.32−0.54−0.84
30Jimma0.920.091.700.402.02+2.07+1.231.752.34+1.61
31Kombolcha0.95−0.62−0.64−1.25−0.83−0.060.500.360.360.68
32Konso2.69*0.170.710.410.520.43−0.240.000.68−0.37
33Lalibela2.40+0.29−0.57−1.89−0.86−0.85−0.54−0.430.23−1.92+
34Mekele2.05+0.24−1.33−1.94−1.69−1.01−0.93−0.98−0.31−1.35
35Metema1.700.870.23−0.600.50−0.510.50−0.100.91−0.31
36Mizan Teferi−0.21−0.43−0.770.80−0.73−2.98−3.02−2.67 *−2.22+−0.77
37Mojo−1.31−1.581.681.412.171.861.611.880.233.0 *
38Moyale1.51−0.330.620.001.061.490.190.270.230.87
39Negele1.360.69−0.78−1.70−1.03−1.42−0.93−1.25−1.35−1.90
40Nekemte0.67−0.290.98−0.070.510.981.231.280.75−0.14
41Pawe0.68−0.730.710.310.941.28−1.33−2.16+−0.601.21
42Robe2.84 *0.861.931.621.392.58 *1.761.482.00+1.61
43Teppi−0.41−0.290.680.730.140.280.010.331.180.63
44Tulu bolo−0.211.110.00−0.20−0.71−0.061.421.020.34−0.43
45Wolaita0.00−0.221.991.612.241.761.951.722.06+2.38+
46Yirgachefe1.81−0.591.731.652.31+2.53+0.921.412.14+3.27 *
47Yirgalem3.20*2.59 *−0.710.01−1.12−2.27+−2.50 *−2.94 *−1.081.39
* and + are significant trends at α 0.01 and α 0.05, respectively.
Table 4. A summary of trend results for extreme rainfall indices in Ethiopia.
CDDCWDPRCPTOTR10R20R95pR99pRx1dayRx5daySDII
%↑76.753.263.857.557.553.263.859.661.753.2
%↓21.244.73240.442.546.836.238.336.244.7
%NT2.12.14.22.10002.12.12.1
%↑*8.52.12.12.12.14.2004.28.5
%↓*02.10002.12.14.22.10
%↑+8.54.28.54.210.68.52.12.110.66.3
%↓+000002.104.22.14.2
%SG17.38.610.66.512.7174.210.619.519.5
%↑ = Percent of stations with an increasing trend, %↓= Percent of stations with a decreasing trend, %NT = Percent of stations with no trend, %↑* = Percent of stations with a significant increasing trend at α 0.01, %↓*= Percent of stations with a significantly decreasing trend at α 0.01, %↑+ = Percent of stations with a significant increasing trend at α 0.05, %↓+ = Percent of stations with a significant decreasing trend at α 0.05.%, and %Sg = Percent of significance.
Table 5. The trends of extreme rainfall indices in different AEZs of Ethiopia.
CDDCWDPRCPTOTR10R20R95pR99pRx1dayRx5daySDII
Hot arid%↑10000000100000
%↓001001001001000100100100
%NT010000000000
%↑*0000000000
%↓*0000000000
%↑+0000000000
%↓+0000000000
Warm semi-arid%↑70406060705040405040
%↓30604030305060605060
%NT00010000000
%↑*10000000000
%↓*00000001000
%↑+000010000100
%↓+000000010100
Cool sub-humid%↑68486852566468766860
%↓28522448443632243240
%NT4080000000
%↑*84404800416
%↓*0404044440
%↑+848416800128
%↓+0000040404
Cool and humid%↑100806070505070506050
%↓0204030505030503040
%NT000000001010
%↑*1000001000100
%↓*0000000000
%↑+20010100101001010
%↓+00000000010
Cool and moist%↑100100100100100100100100100100
%↓0000000000
%NT0000000000
%↑*0000000000
%↓*0000000000
%↑+00100000010000
%↓+0000000000
%↑ = Percent of stations with an increasing trend, %↓= Percent of stations with a decreasing trend, %NT = Percent of stations with no trend, %↑* = Percent of stations with a significant increasing trend at α 0.01, %↓*= Percent of stations with a significantly decreasing trend at α 0.01, %↑+ = Percent of stations with the significant increasing trend at α 0.05, and %↓+ = Percent of stations with the significant decreasing trend at α 0.05.
Table 6. Results of the trend analysis of extreme temperature indices in Ethiopia.
No.Stations TXxTXnTNxTNnTX10pTX90pTN10pTN90pCSDIWSDISU25FD0TR20
1Adama1.282.26+3.59 *−3.43 *−2.98 *1.160.00−3.89 *0.00−0.932.73 *0.002.04
2Addis Ababa3.64 *0.260.840.26−4.35 *4.15 *−2.53 *3.47 *−0.503.16 *4.36 *0.000.00
3Ambo3.14 *2.74 *2.19+2.47 *−4.06 *2.34+−4.32 *3.78 *−0.940.853.17 *0.000.00
4Asebe Teferi−0.541.073.26 *2.71 *0.65−0.84−4.06 *4.15 *−3.22 *−2.04+−1.210.001.25
5Asela0.04−2.46 *0.001.440.920.140.110.11−0.43−0.25−0.240.000.00
6Bahir Dar2.94 *0.23−0.21−2.65 *−3.18 *5.28 *3.07 *−0.800.131.504.461.140.00
7Boditi3.88 *−1.124.82 *1.23−3.32 *3.62 *−2.10 *6.23 *−2.84 *1.593.150.001.63
8Bonga2.29+−1.501.11−2.19+−1.181.53−0.67−0.50−1.62−1.220.340.351.44
9Dangila1.45−0.961.230.83−3.24 *2.36+−4.09 *3.76 *−2.42+0.472.59*−0.230.00
10Debre Birhan0.910.80−0.070.57−4.63 *3.89 *−1.79−0.34−0.45−0.650.24−0.740.00
11Debre Markos2.11+1.911.800.16−3.49 *3.72 *−4.63 *5.25 *−2.17+0.872.33+0.000.00
12Debre Tabor−0.471.751.17−3.58 *−4.18 *1.790.610.980.120.482.67 *0.000.00
13Dire Dawa4.40 *1.822.05+−0.70−4.60 *5.95 *−0.142.36+0.162.31+1.96+0.001.01
14Dubity2.86 *3.38 *−0.57−1.70−3.74 *0.370.540.371.473.24 *1.780.00−1.51
15Fiche0.851.482.38+−3.50 *−4.03 *3.27 *−1.283.24 *−0.880.900.470.000.00
16Gewane4.32 *2.49 *2.92 *1.84−3.91 *4.14 *−1.762.54 *−2.26+1.832.02+0.002.56
17Gonder2.17+1.602.07+0.26−4.23 *4.64 *−3.75 *3.21 *−2.31+2.48 *4.32 *0.000.44
18Gore2.21+1.262.15+1.69−3.21 *3.95 *−2.81 *2.20+−1.460.733.45 *0.000.15
19Haramaya1.742.14+3.45 *0.83−4.03 *3.95 *−2.023.29 *0.370.654.93 *−0.701.04
20Hawassa2.50 *2.20+2.22+3.33 *−4.18 *1.29−6.06 *1.29−3.45 *0.604.39 *0.002.09+
21Hosanna2.17+2.06+−0.37−0.30−4.80 *4.67 *−2.37+2.32+0.073.09 *4.22 *0.00−2.4 *
22Jijiga0.77−0.260.88−0.73−0.74−0.940.06−0.610.070.520.55 *−0.440.20
23Kombolcha2.43+2.57 *1.14−2.29+−5.28 *4.80 *1.243.01 *2.702.07+5.91 *0.001.48
24Konso3.73 *2.00+1.691.74−4.77 *3.81 *−2.40+3.59 *−1.273.35 *4.45 *0.002.72
25Lalibela0.471.69−0.630.84−2.98 *1.56−3.21 *0.06−1.341.272.47 *0.00−1.34
26Mekele2.82 *2.90 *3.62 *−0.44−3.28 *3.37 *−1.023.88 *−1.681.714.12 *−2.230.00
27Mojo2.68 *0.67−0.83−2.21+−4.26 *4.90 *2.61 *−1.02−0.020.61+3.77 *0.000.00
28Moyale1.211.39−1.54−1.81−1.082.371.35−0.142.67 *1.112.170.000.50
29Negele3.42 *2.53 *3.74 *2.49 *−5.25 *4.97 *−3.79 *4.70 *−3.48 *2.76 *5.33 *0.003.86 *
30Nekemte2.35+1.542.55 *1.14−3.41 *3.04 *−3.95 *3.93 *−2.47 *0.632.10+0.000.00
31Pawe0.65−0.600.731.33−2.39+1.02−3.83 *1.24−1.491.532.40+0.000.78
32Robe2.58 *0.282.42+1.49−3.83 *4.05 *−4.29 *4.06 *−2.13+2.62 *3.30 *−2.2+0.00
33Teppi1.021.440.56−0.75−2.73 *1.31−1.99+1.020.061.320.830.00−0.98
34Tulu bolo2.49 *0.102.17+−0.70−1.321.05−0.681.54−2.15+−0.541.42−0.040.00
35Wolaita1.001.421.802.18+−2.60 *1.48−4.46 *4.74 *−1.540.632.20+0.001.85
36Yirgachefe1.60−0.591.861.27−1.93+1.65−3.49 *2.67 *−0.680.812.66 *0.360.45
37Yirgalem1.033.25 *−1.790.66−1.870.940.26−1.190.640.312.67 *0.00−0.35
* and + are significant trend at α 0.01 and α 0.05, respectively.
Table 7. Summary of trend results for extreme temperature indices in Ethiopia.
TXxTXnTNxTNnTX10pTX90pTN10pTN90pCSDIWSDISU25FD0TR20
%↑94.681.175.759.45.494.624.478.429.783.894.68.248.6
%↓5.418.921.640.694.65.472.921.667.616.25.418.913.5
%NT002.70002.702.70072.937.9
%↑*37.818.921.610.8051.35.448.62.718.954.102.7
%↓*02.7010.875.6043.22.713.50002.7
%↑+18.913.521.62.705.408.108.116.202.7
%↓+0008.15.408.1016.22.702.70
%SG56.735.143.232.48156.856.859.432.429.770.32.78.1
%↑ = Percent of stations with an increasing trend, %↓= Percent of stations with a decreasing trend, %NT = Percent of stations there is no trend, %↑* = Percent of stations with a significant increasing trend at α 0.01, %↓*= Percent of stations with a significantly decreasing trend at α 0.01, %↑+ = Percent of stations with the significant increasing trend at α 0.05, %↓+ = Percent of stations with the significant decreasing trend at α 0.05%, and %Sg = Percent of significance.
Table 8. The trends of extreme temperature indices in different AEZs of Ethiopia.
TXxTXnTNxTNnTX10pTX90pTN10pTN90pCSDIWSDISU25FD0TR20
Hot arid%↑100 00010010010010010010000
%↓001001001000000000100
%NT000000000001000
%↑*1001000000000100000
%↓*000010000000000
%↑+0000000000000
%↓+0000000000000
Warm semi-arid%↑10085.885.857.1010014.285.542.8100100085.8
%↓014.214.242.9100085.814.257.200014.2
%NT0000.000000001000
%↑*57.128.528.51.0057.1042.814.228.528.5014.2
%↓*0000.071.4028.5014.20000
%↑+014.214.20.0014.2014.2014.257.100
%↓+0000.014.2028.5014.20000
Cool sub-humid%↑94.773.684.2635.389.426.468.426.478.994.715.863.2
%↓5.326.315.736.894.710.568.431.568.421.15.221.15.2
%NT0000005.205.20063.131.6
%↑*31.515.726.315.7042252.65.25.268.400
%↓*00010.568.40105.2210000
%↑+26.315.726.35.2010.505.2010.510.505.2
%↓+00015.75.305.2015.75.2000
Cool and humid%↑88.988.966.755.611.110022.210022.288.988.900
%↓11.111.122.244.488.9077.8077.811.111.122.222.2
%NT0011.10000000077.877.8
%↑*33.311.111.1000055.5033.366.600
%↓*011.1022.288.966.644.40000011.1
%↑+22.211.122.2000011.10011.100
%↓+00000011.1022.20011.10
Cool and moist %↑10010001000100000010000
%↓001000100010010010010001000
%NT000000000000100
%↑*000001000000000
%↓*000010000000000
%↑+0000000000000
%↓+0000000000000
%↑ = Percent of stations with an increasing trend, %↓= Percent of stations with a decreasing trend, %NT = Percent of stations there is no trend, %↑* = Percent of stations with a significant increasing trend at α 0.01, %↓*= Percent of stations with a significantly decreasing trend at α 0.01, %↑+ = Percent of stations with the significant increasing trend at α 0.05, and %↓+ = Percent of stations with the significant decreasing trend at α 0.05.
Disclaimer/Publisher’s Note: The statements, opinions and data contained in all publications are solely those of the individual author(s) and contributor(s) and not of MDPI and/or the editor(s). MDPI and/or the editor(s) disclaim responsibility for any injury to people or property resulting from any ideas, methods, instructions or products referred to in the content.

