Impact of PM2.5 and PM10 Emissions on Changes of Their Concentration Levels in Lithuania: A Case Study
Abstract
1. Introduction
2. Material and Methods
2.1. Emissions Inventory of Local Emission Sources
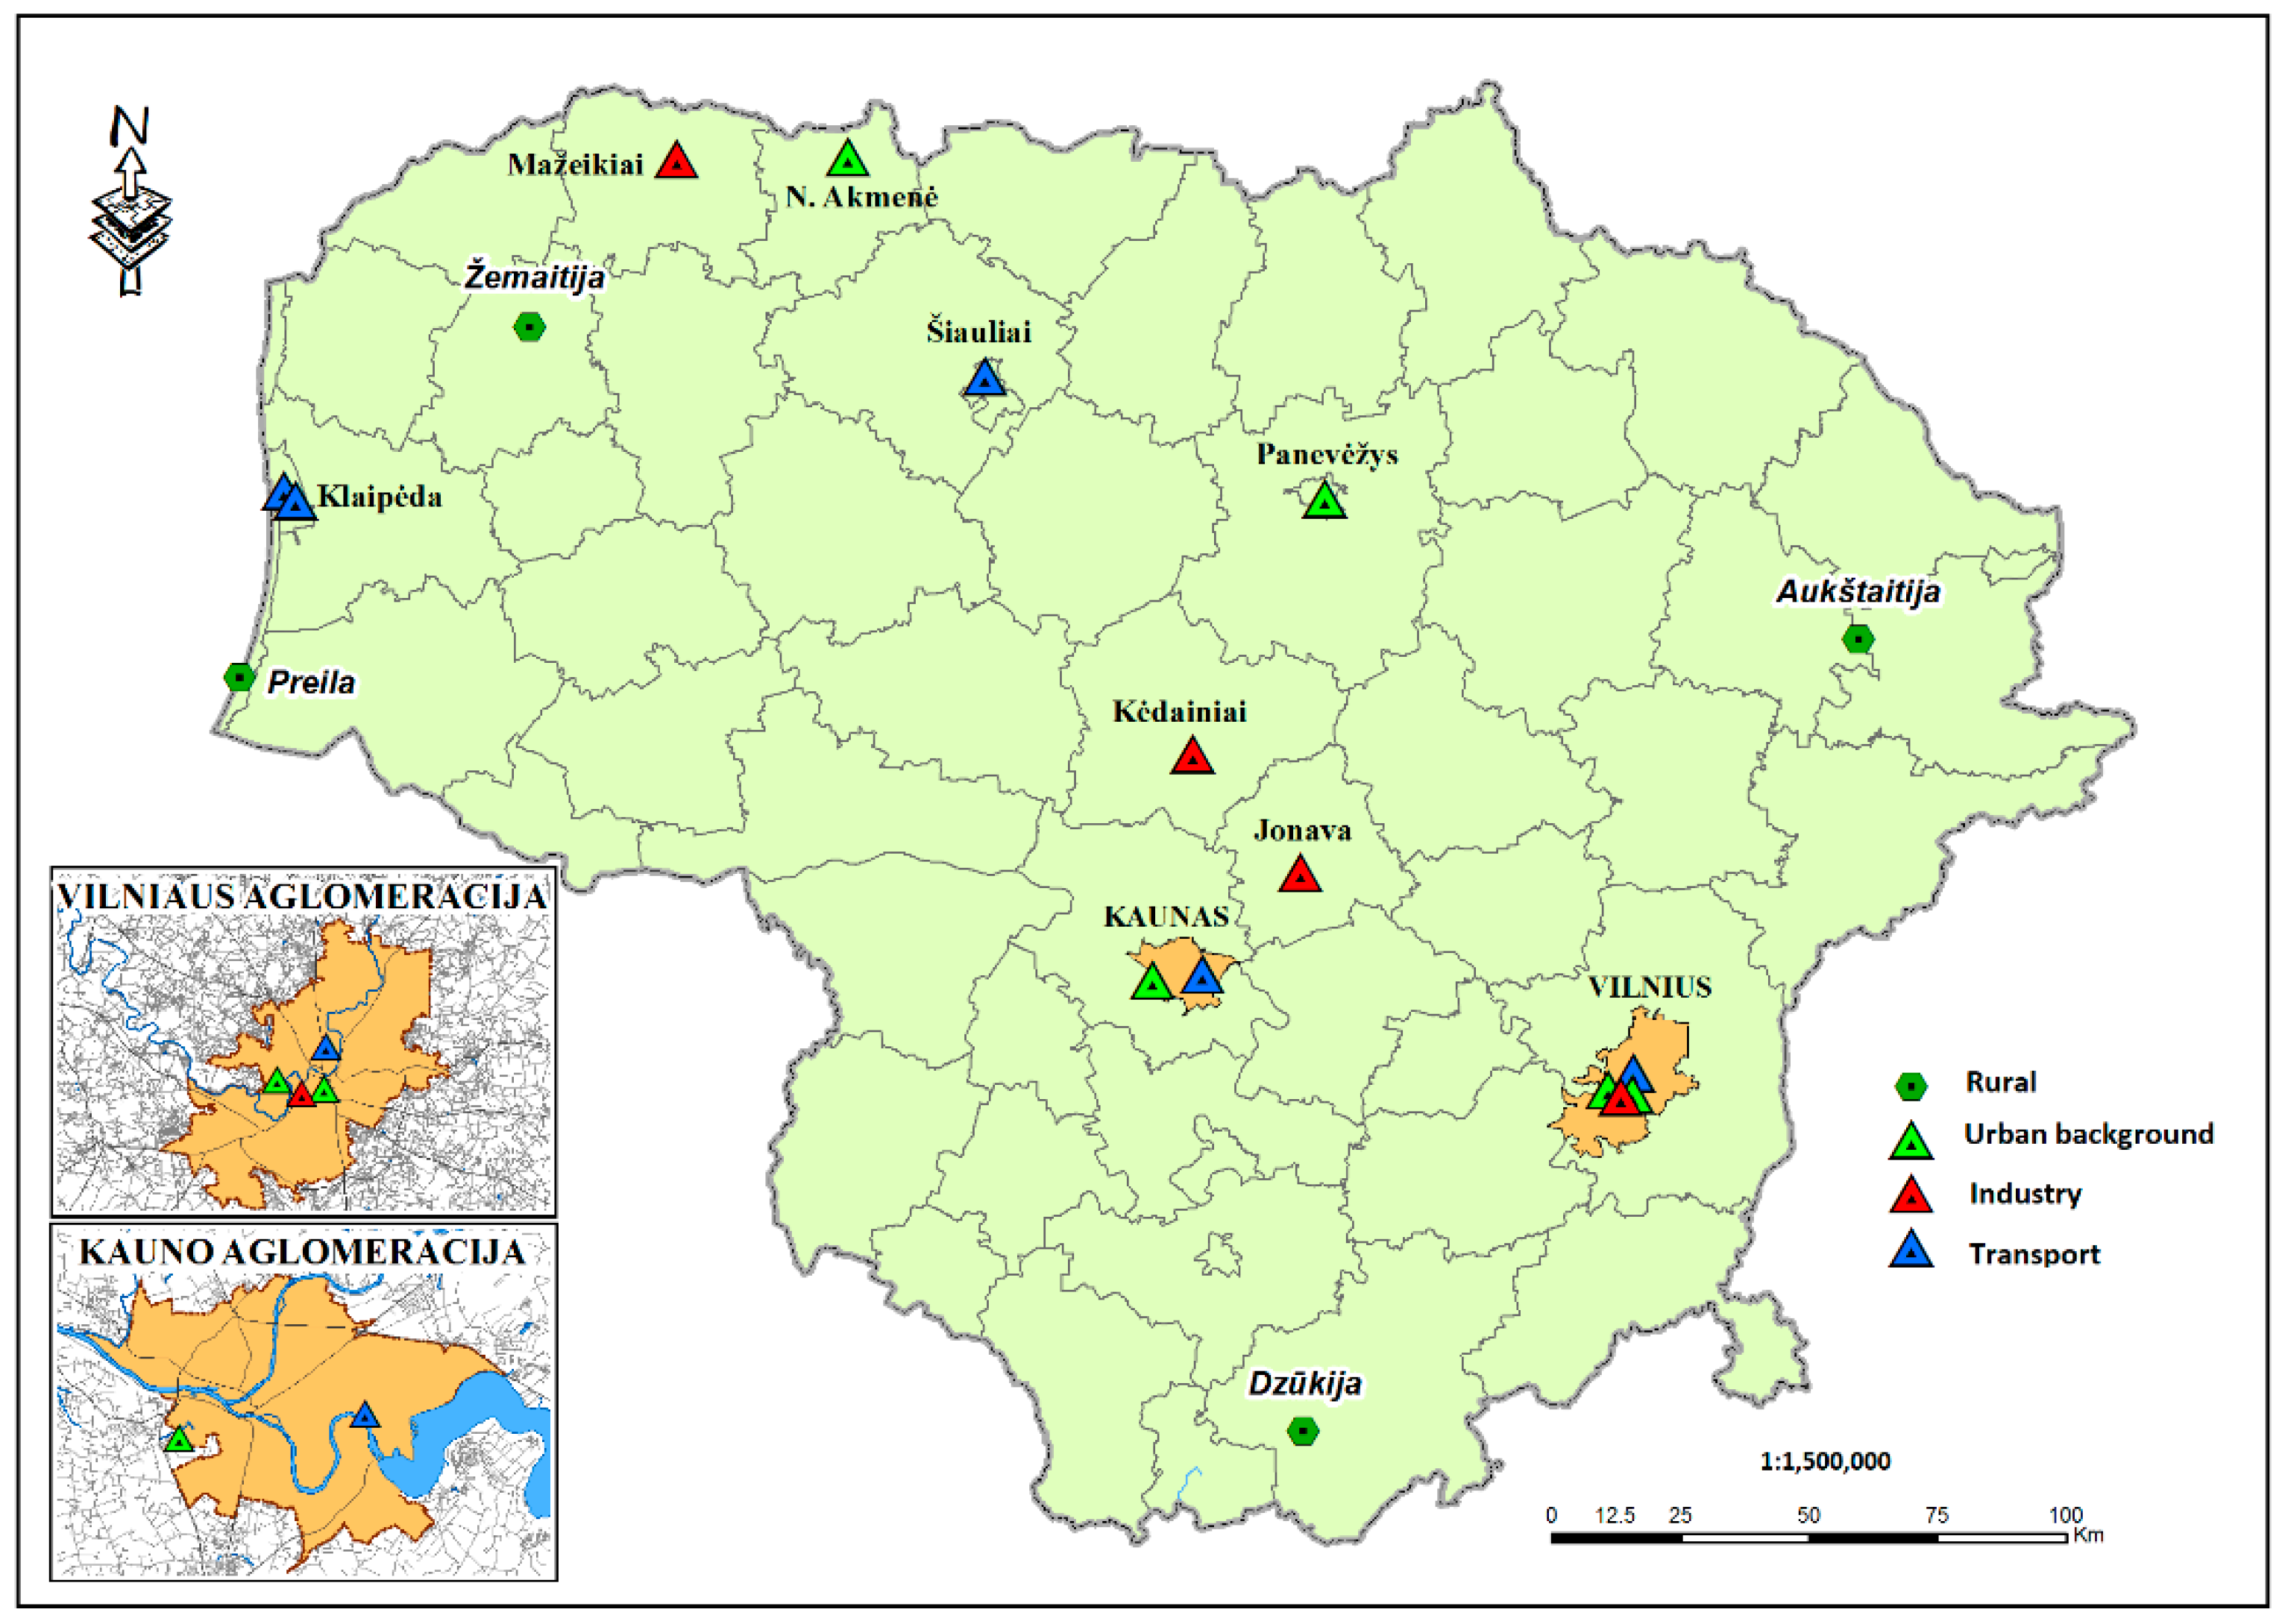
2.2. Ambient Air Quality Data
3. Results
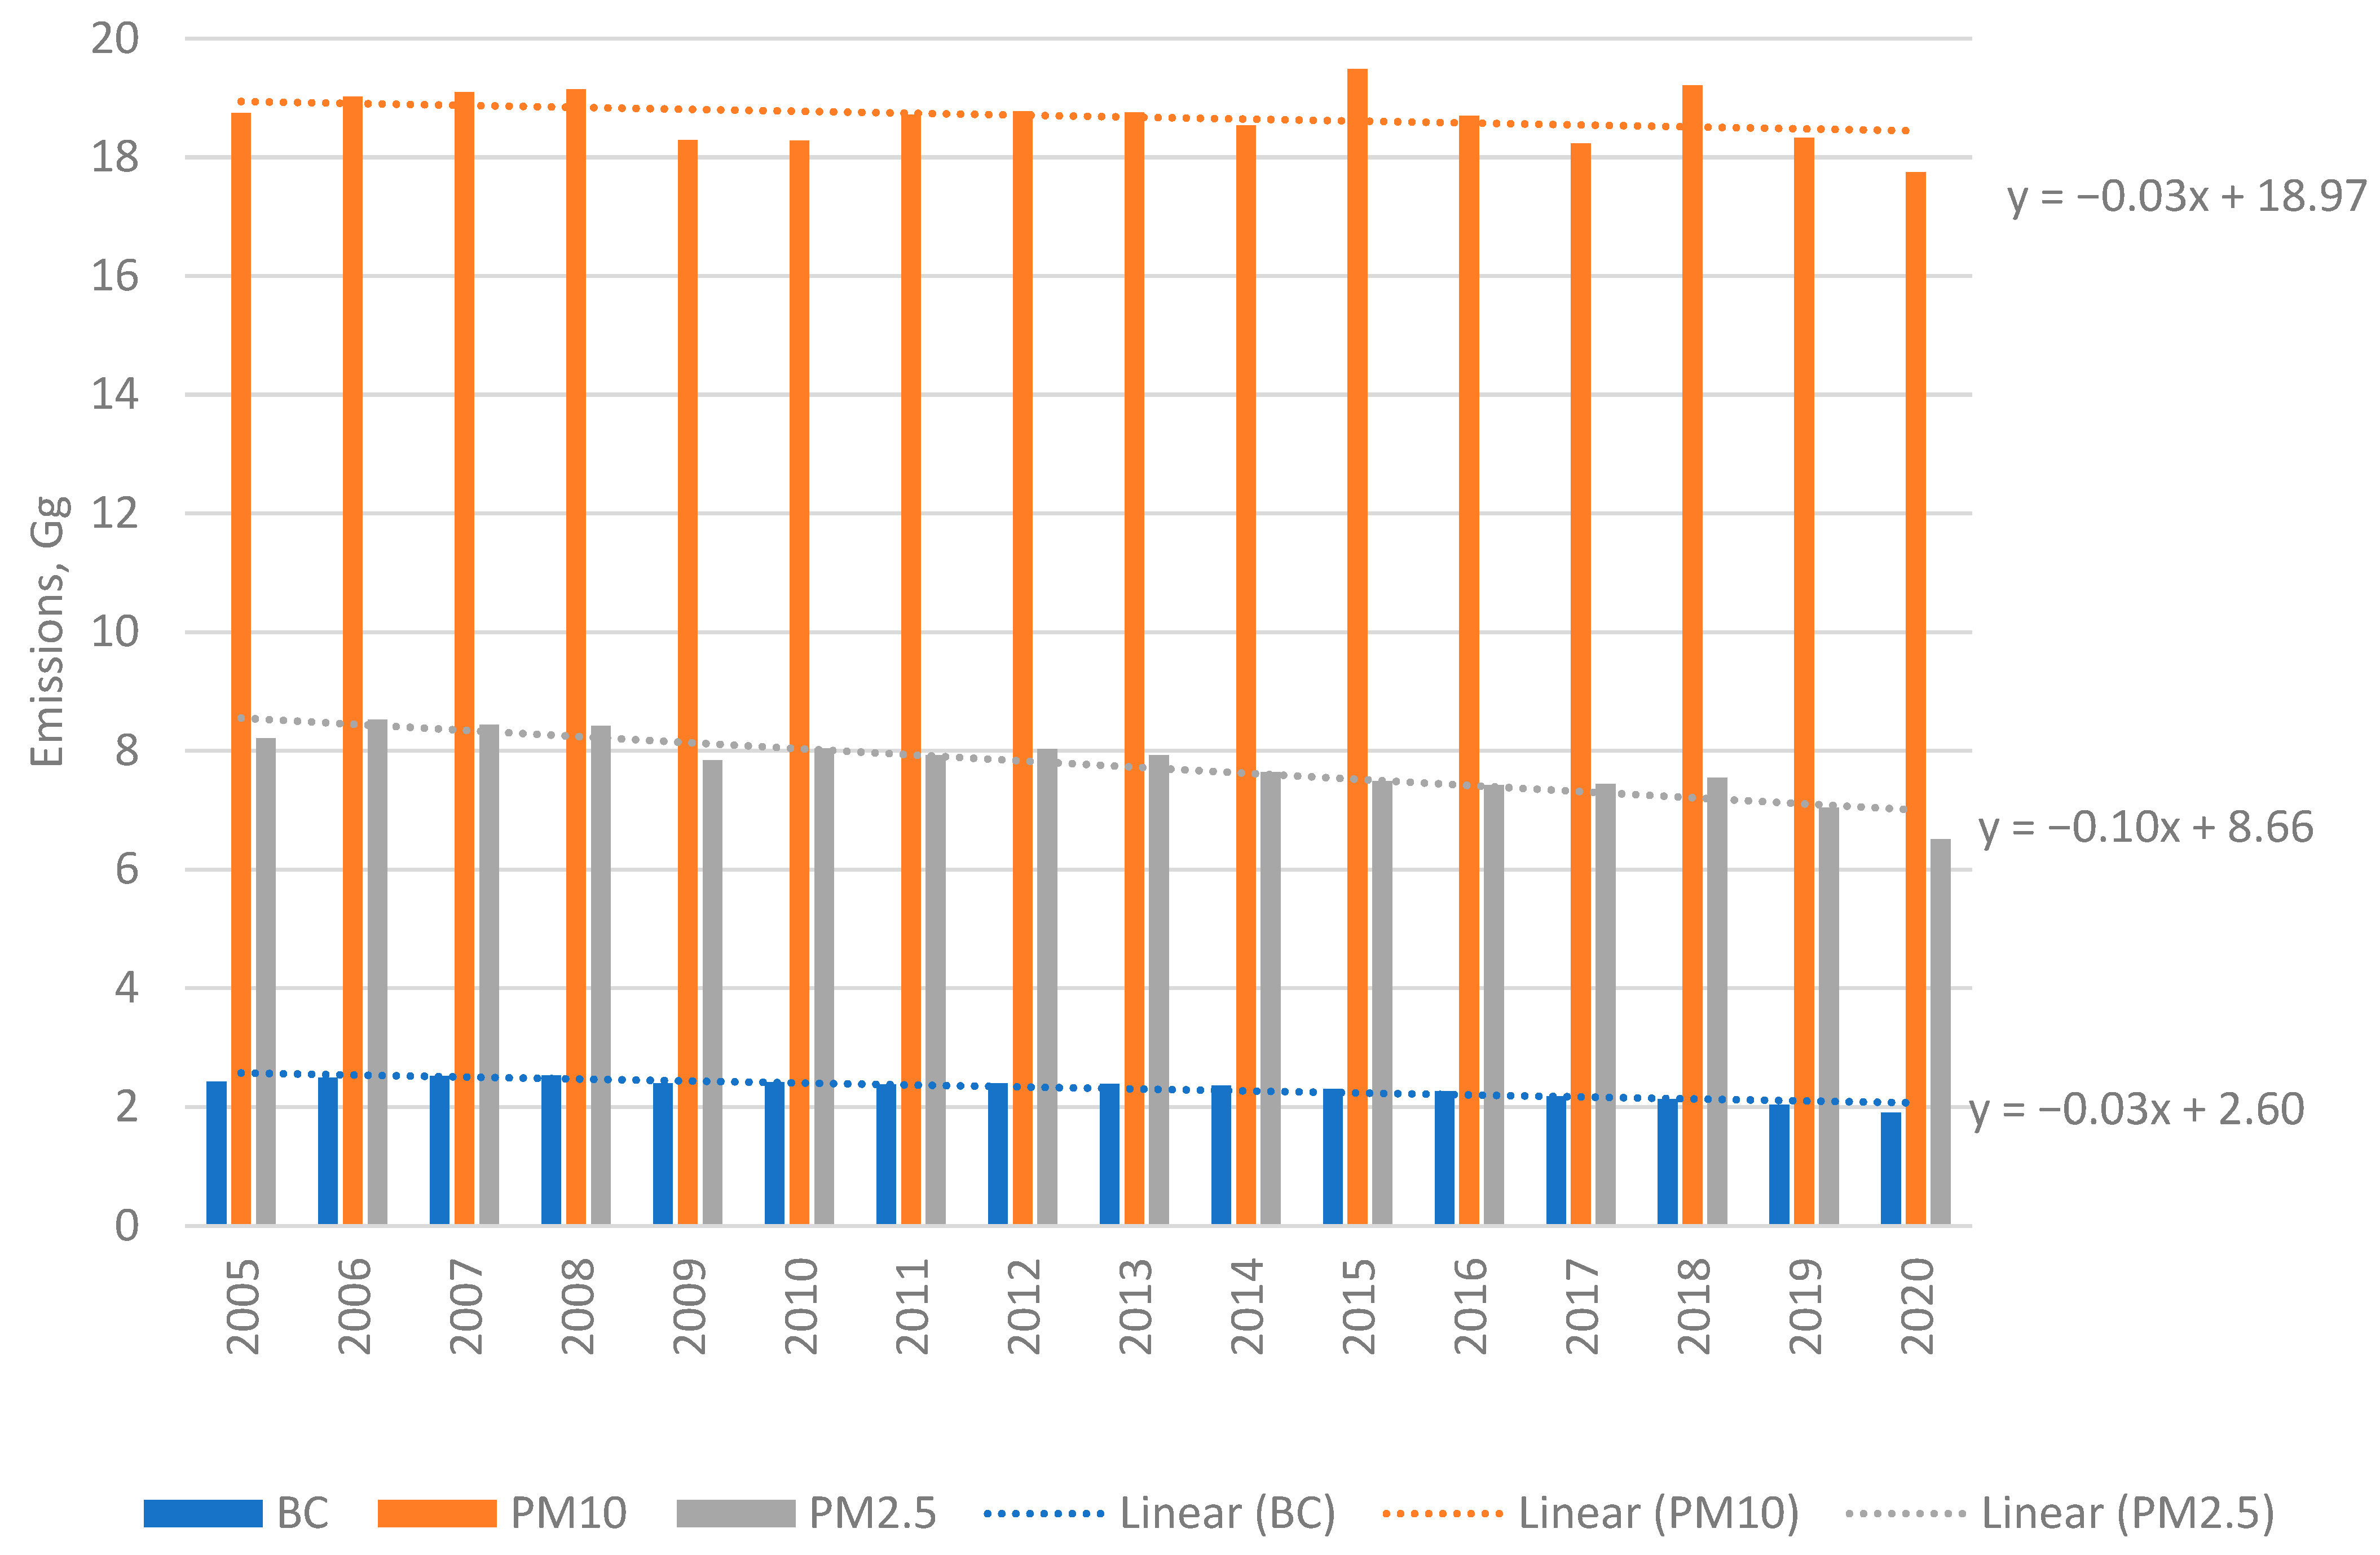
3.1. Description and Interpretation of Emission Trends
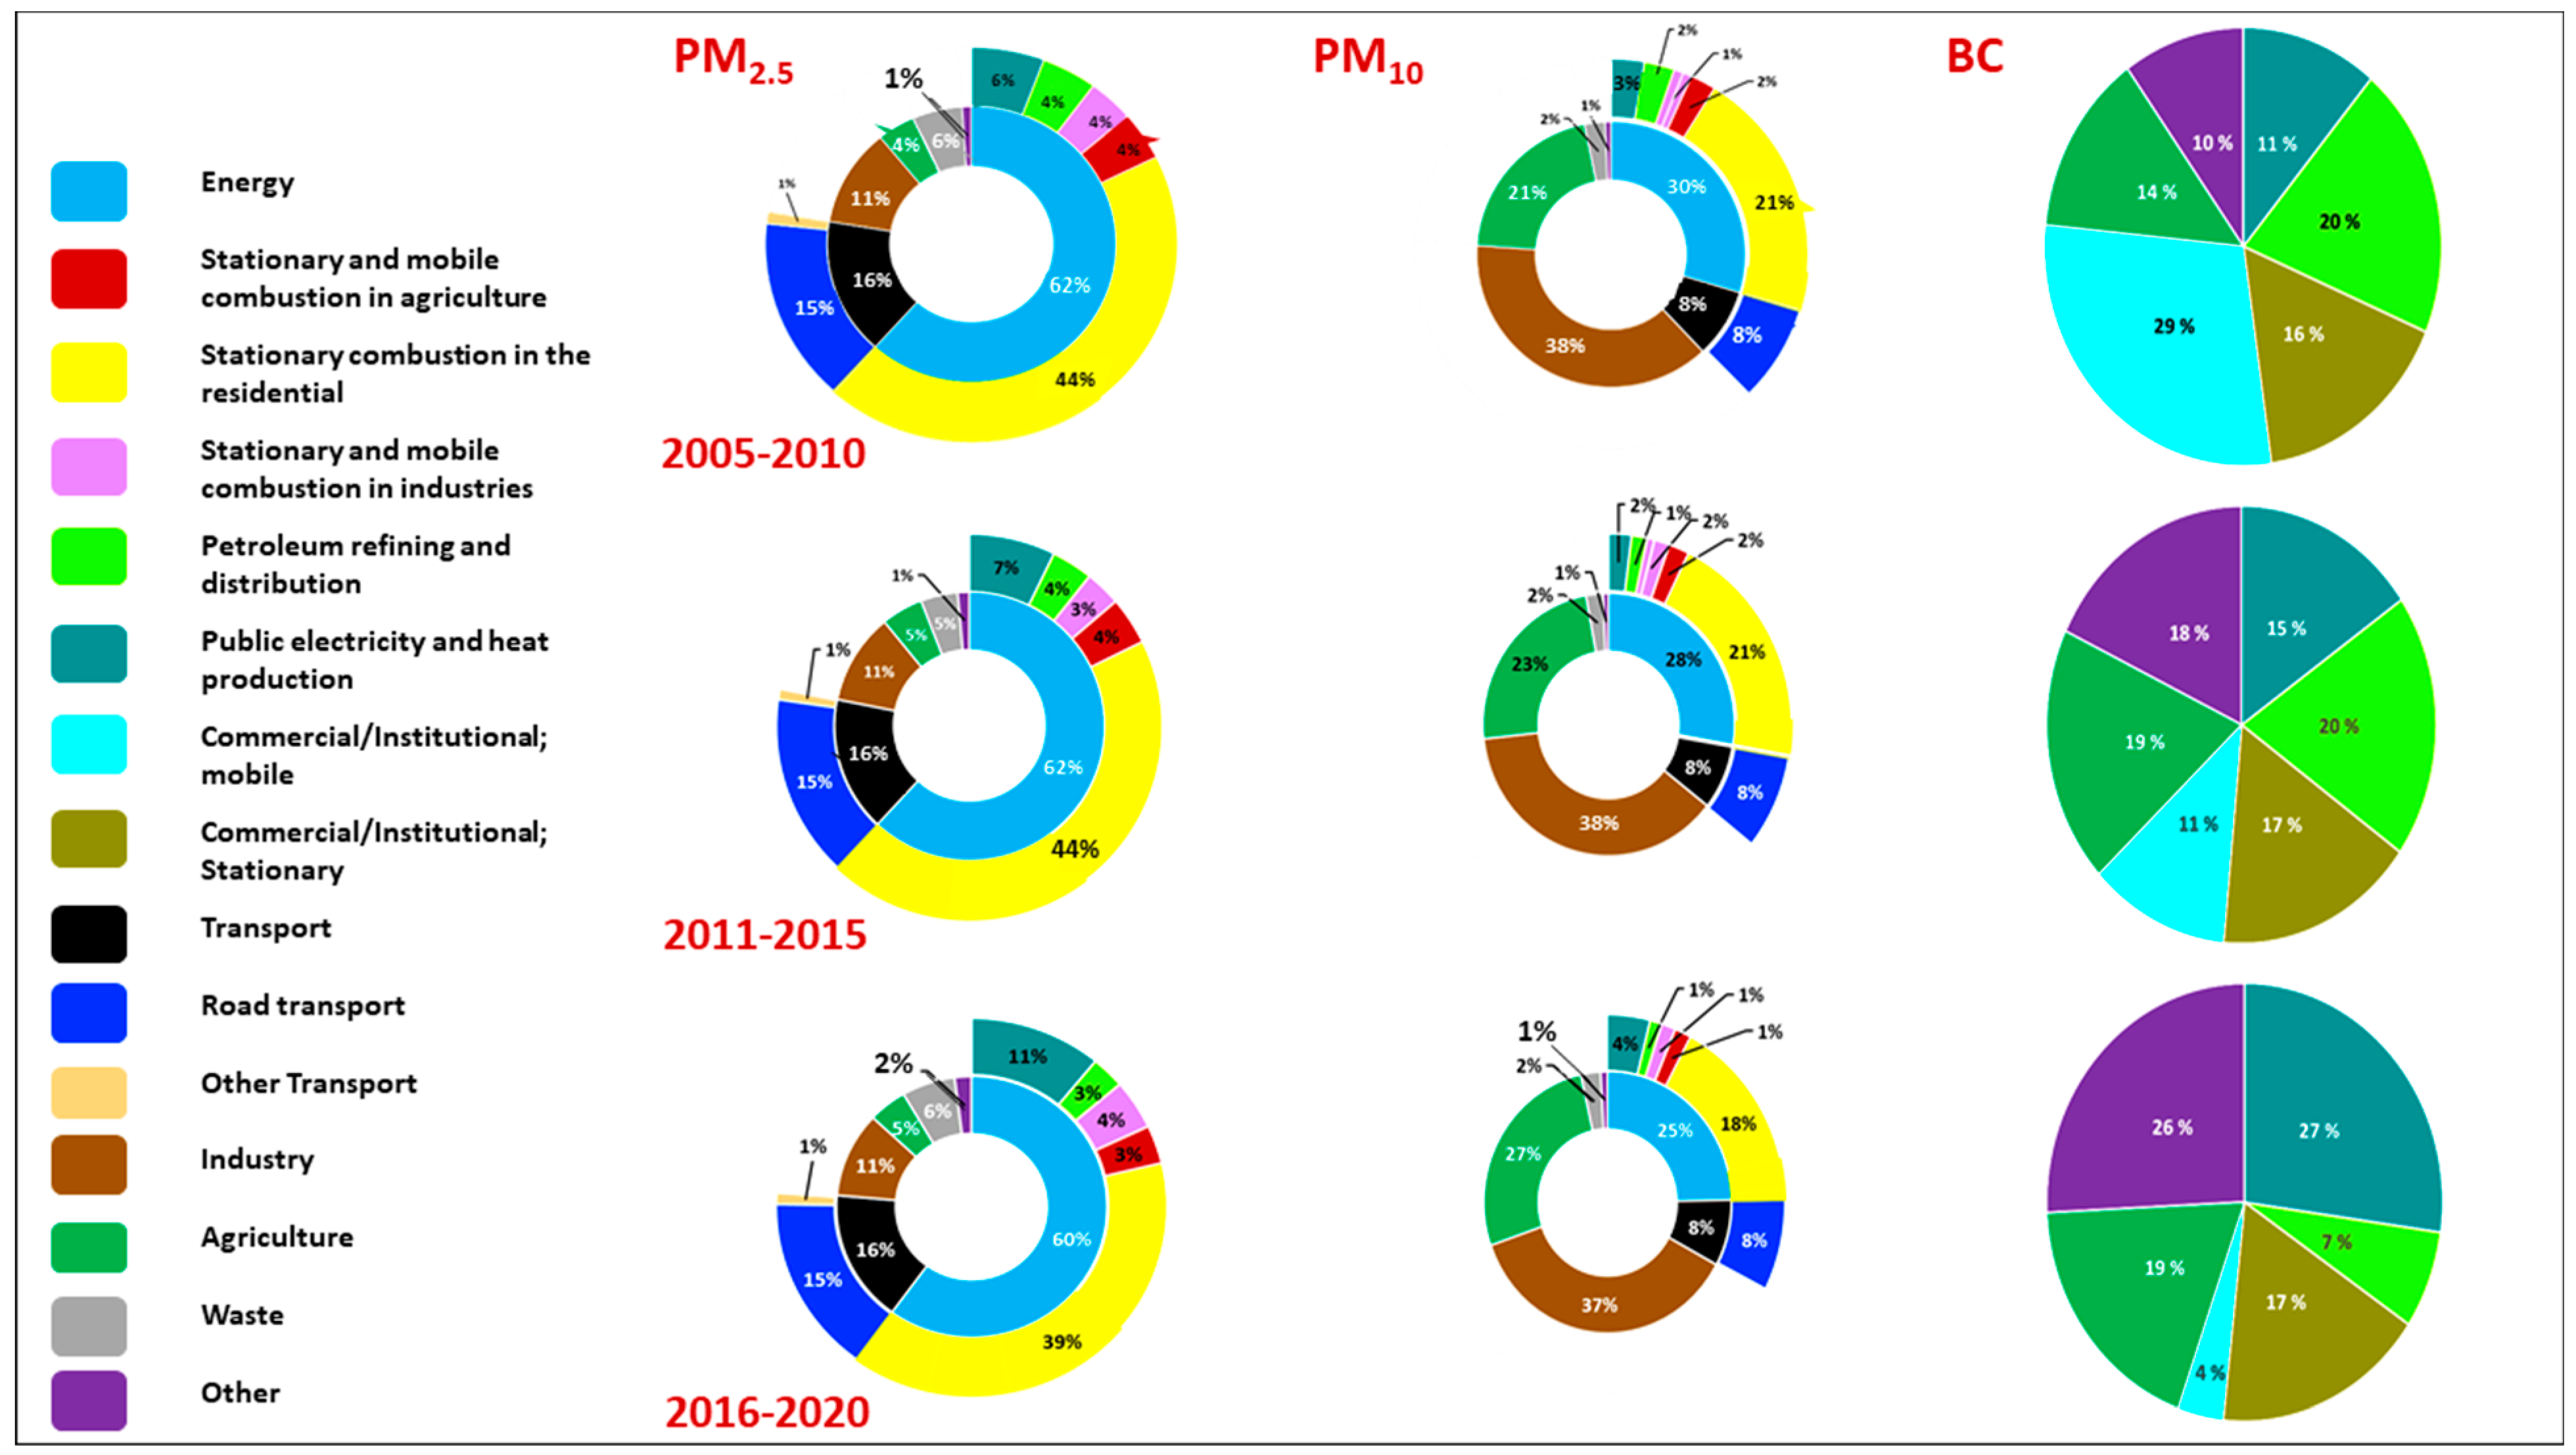
3.2. Description and Interpretation of Emission Trends by Sector
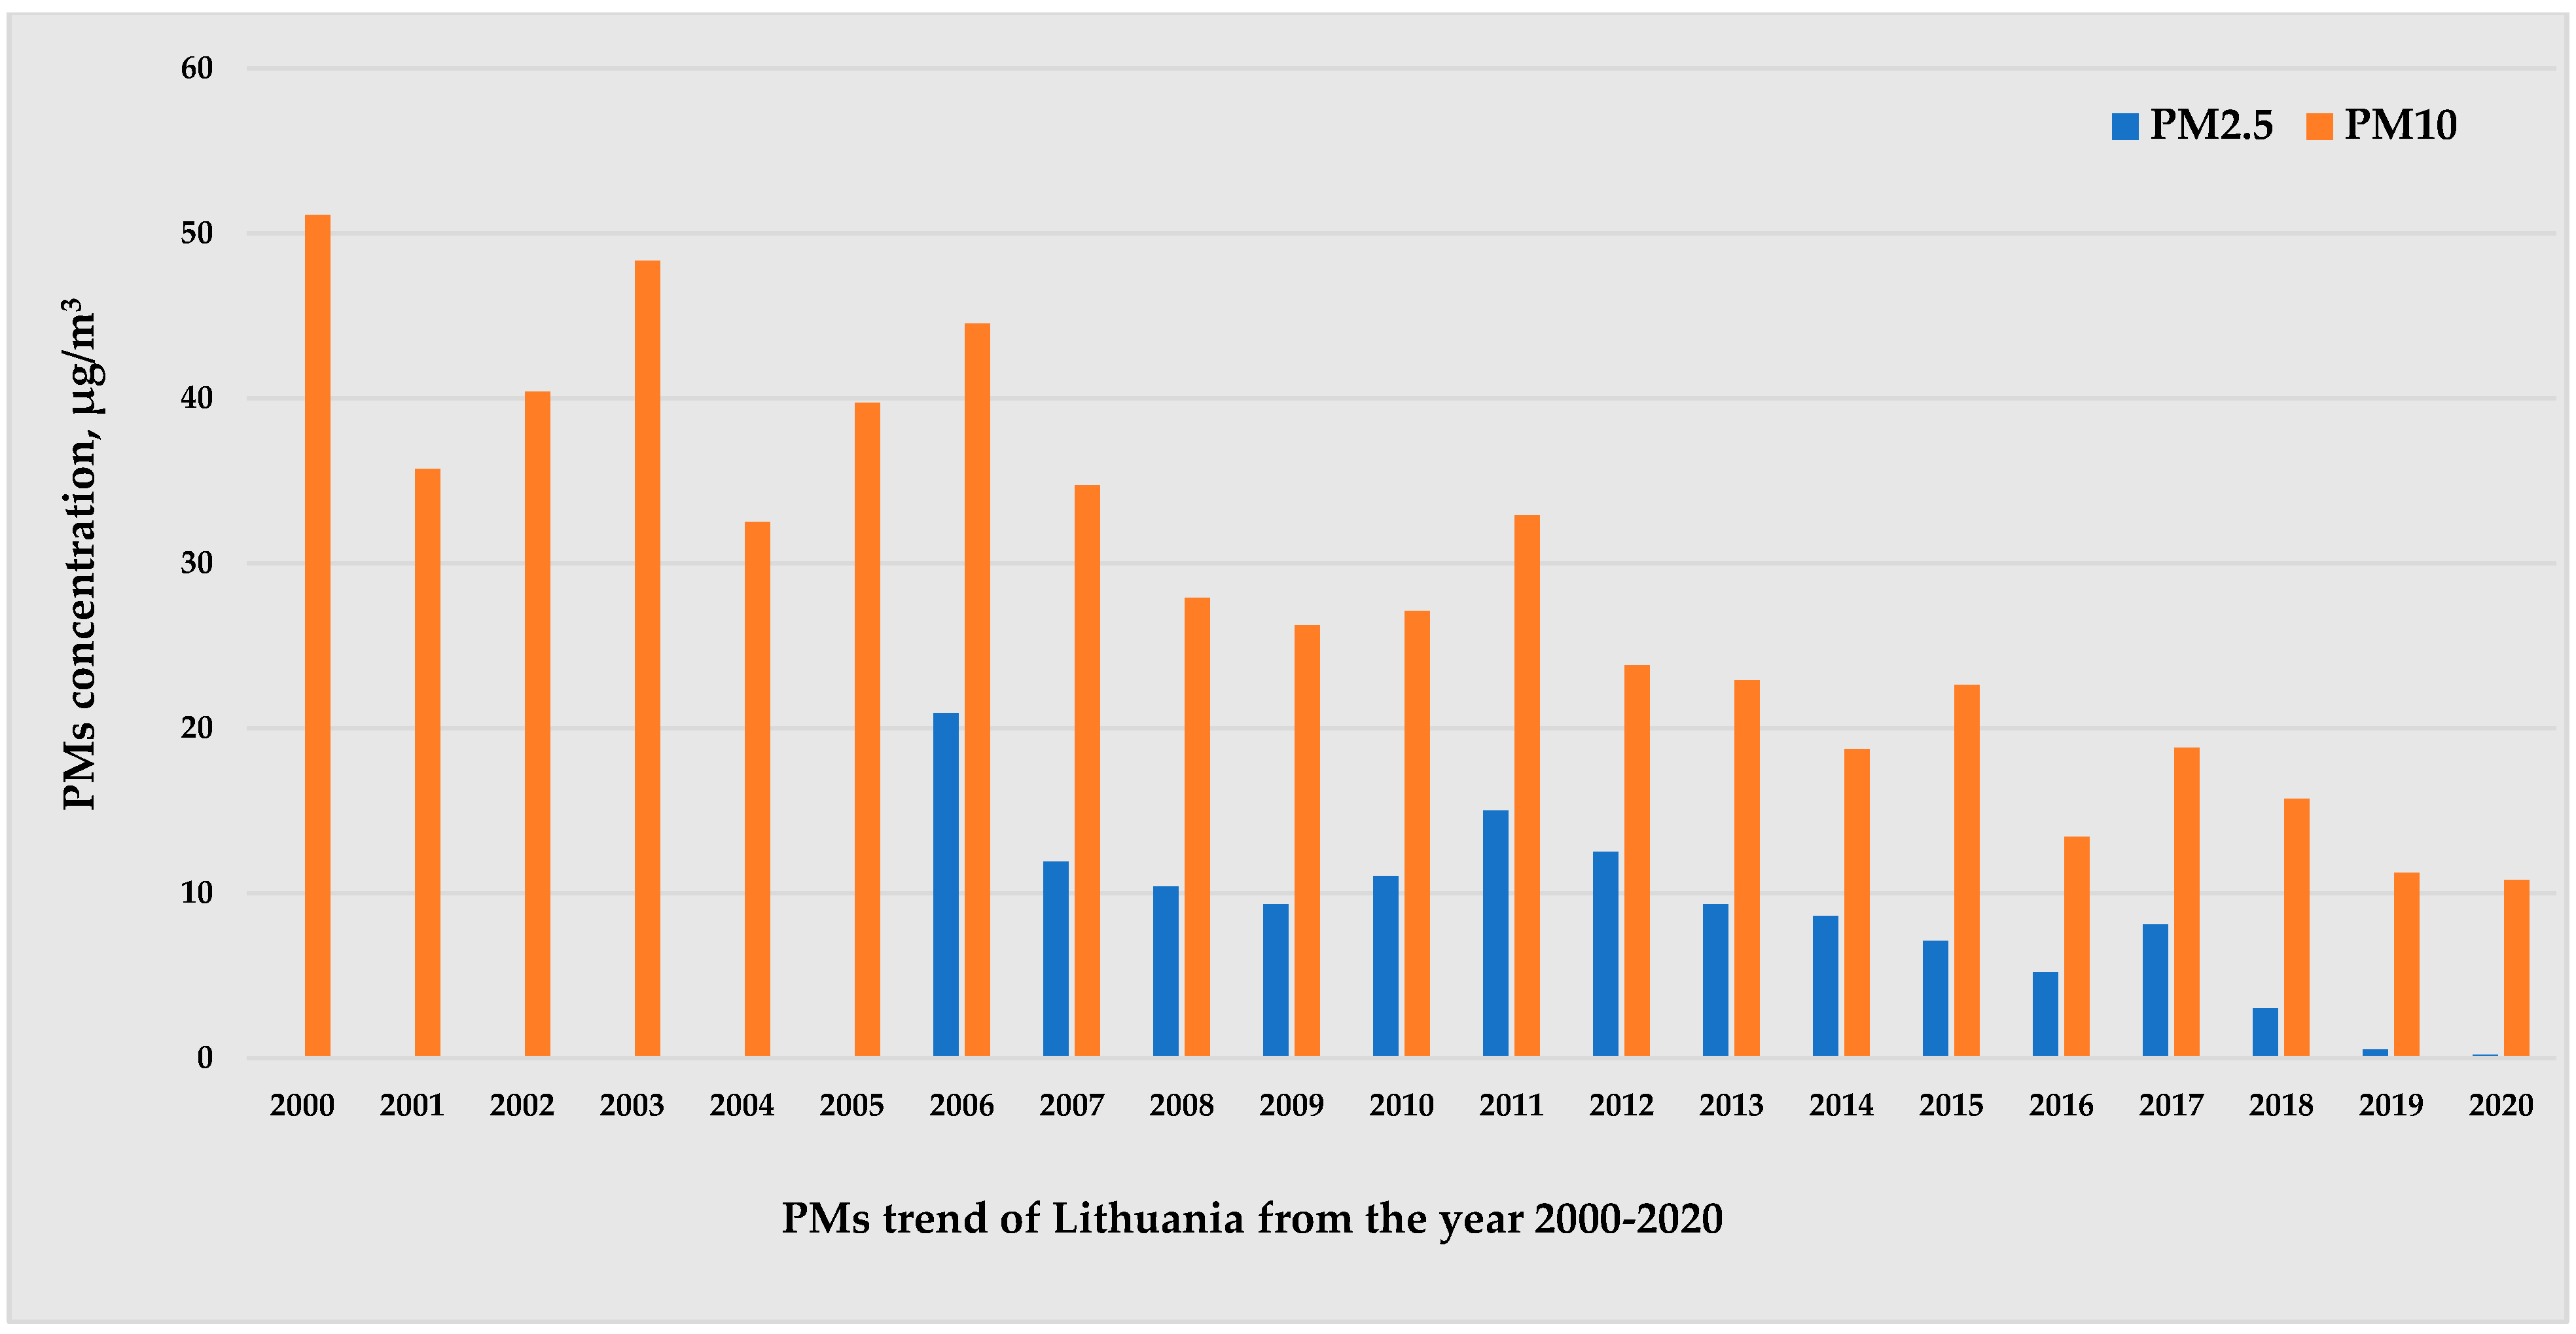
3.3. Changes in Concentrations over Time
4. Conclusions
Supplementary Materials
Author Contributions
Funding
Institutional Review Board Statement
Informed Consent Statement
Data Availability Statement
Acknowledgments
Conflicts of Interest
References
- Garrido-Perez, J.M.; García-Herrera, R.; Ordóñez, C. Assessing the value of air stagnation indices to reproduce PM10 variability in Europe. Atmos. Res. 2021, 248, 105258. [Google Scholar] [CrossRef]
- Lee, J.M.; Lee, T.H.; Kim, S.; Song, M.; Bae, S. Association between long-term exposure to particulate matter and childhood cancer: A retrospective cohort study. Environ. Res. 2022, 205, 112418. [Google Scholar] [CrossRef] [PubMed]
- Chen, S.; Zhang, R.; Mao, R.; Zhang, Y.; Chen, Y.; Ji, Z.; Gong, Y.; Guan, Y. Sources, characteristics and climate impact of light-absorbing aerosols over the Tibetan Plateau. Earth-Sci. Rev. 2022, 232, 104111. [Google Scholar] [CrossRef]
- Harrison, R.M. Airborne particulate matter. Philos. Trans. A Math. Phys. Eng. Sci. 2020, 378, 20190319. [Google Scholar] [CrossRef]
- Santiago, J.L.; Rivas, E.; Gamarra, A.R.; Vivanco, M.G.; Buccolieri, R.; Martilli, A.; Lechon, Y.; Martin, F. Estimates of population exposure to atmospheric pollution and health-related externalities in a real city: The impact of spatial resolution on the accuracy of results. Sci. Total Environ. 2022, 819, 152062. [Google Scholar] [CrossRef]
- Popovicheva, O.; Ivanov, A.; Vojtisek, M. Functional Factors of Biomass Burning Contribution to Spring Aerosol Composition in a Megacity: Combined FTIR-PCA Analyses. Atmosphere 2020, 11, 319. [Google Scholar] [CrossRef]
- Kwon, H.S.; Ryu, M.H.; Carlsten, C. Ultrafine particles: Unique physicochemical properties relevant to health and disease. Exp. Mol. Med. 2020, 52, 318–328. [Google Scholar] [CrossRef]
- Jonidi Jafari, A.; Charkhloo, E.; Pasalari, H. Urban air pollution control policies and strategies: A systematic review. J. Environ. Health. Sci. Eng. 2021, 19, 1911–1940. [Google Scholar] [CrossRef]
- Triantafyllopoulos, G.; Dimaratos, A.; Ntziachristos, L.; Bernard, Y.; Dornoff, J.; Samaras, Z. A study on the CO2 and NOx emissions performance of Euro 6 diesel vehicles under various chassis dynamometer and on-road conditions including latest regulatory provisions. Sci. Total Environ. 2019, 666, 337–346. [Google Scholar] [CrossRef]
- Brewer, T.L. Black carbon emissions and regulatory policies in transportation. Energy Policy 2019, 129, 1047–1055. [Google Scholar] [CrossRef]
- Grigoratos, T.; Fontaras, G.; Giechaskiel, B.; Zacharof, N. Real world emissions performance of heavy-duty Euro VI diesel vehicles. Atmos. Environ. 2019, 201, 348–359. [Google Scholar] [CrossRef]
- Lurkin, V.; Hambuckers, J.; Van Woensel, T. Urban low emissions zones: A behavioral operations management perspective. Transp. Res. Part A Policy Pract. 2021, 144, 222–240. [Google Scholar] [CrossRef]
- Trojanowski, R.; Fthenakis, V. Nanoparticle emissions from residential wood combustion: A critical literature review, characterization, and recommendations. Renew. Sustain. Energy Rev. 2019, 103, 515–528. [Google Scholar] [CrossRef]
- Sicard, P.; Agathokleous, E.; De Marco, A.; Paoletti, E.; Calatayud, V. Urban population exposure to air pollution in Europe over the last decades. Environ. Sci. Eur. 2021, 33, 28. [Google Scholar] [CrossRef] [PubMed]
- Torkayesh, A.E.; Alizadeh, R.; Soltanisehat, L.; Torkayesh, S.E.; Lund, P.D. A comparative assessment of air quality across European countries using an integrated decision support model. Socio-Econ. Plan. Sci. 2022, 81, 101198. [Google Scholar] [CrossRef]
- Bernard, Y.; Dallman, T.; Lee, K.; Rintanen, I.; Tietge, U. Evaluation of Real-World Vehicle Emissions in Brussels; ICCT: Morgantown, WV, USA, 2021. [Google Scholar]
- Robotto, A.; Barbero, S.; Bracco, P.; Cremonini, R.; Ravina, M.; Brizio, E. Improving Air Quality Standards in Europe: Comparative Analysis of Regional Differences, with a Focus on Northern Italy. Atmosphere 2022, 13, 642. [Google Scholar] [CrossRef]
- Groot Zwaaftink, C.D.; Aas, W.; Eckhardt, S.; Evangeliou, N.; Hamer, P.; Johnsrud, M.; Kylling, A.; Platt, S.M.; Stebel, K.; Uggerud, H.; et al. What caused a record high PM10 episode in northern Europe in October 2020? Atmos. Chem. Phys. 2022, 22, 3789–3810. [Google Scholar] [CrossRef]
- Pisoni, E.; Thunis, P.; De Meij, A.; Bessagnet, B. Assessing the Impact of Local Policies on PM2.5 Concentration Levels: Application to 10 European Cities. Sustainability 2022, 14, 6384. [Google Scholar] [CrossRef]
- Thén, W.; Salma, I. Particle Number Concentration: A Case Study for Air Quality Monitoring. Atmosphere 2022, 13, 570. [Google Scholar] [CrossRef]
- Alikhani Faradonbeh, M.; Mardani, G.; Raeisi Shahraki, H. Longitudinal Trends of the Annual Exposure to PM2. 5 Particles in European Countries. Scientifica 2021, 2021. [Google Scholar] [CrossRef]
- Stafoggia, M.; Oftedal, B.; Chen, J.; Rodopoulou, S.; Renzi, M.; Atkinson, R.W.; Bauwelinck, M.; Klompmaker, J.O.; Mehta, A.; Vienneau, D.; et al. Long-term exposure to low ambient air pollution concentrations and mortality among 28 million people: Results from seven large European cohorts within the ELAPSE project. Lancet Planet. Health 2022, 6, e9–e18. [Google Scholar] [CrossRef]




| PM10 Standard | Protection Objective | Averaging Period | Value | Max Number of Exceedances | Date to Be Achieved (by and Maintained Thereafter) |
|---|---|---|---|---|---|
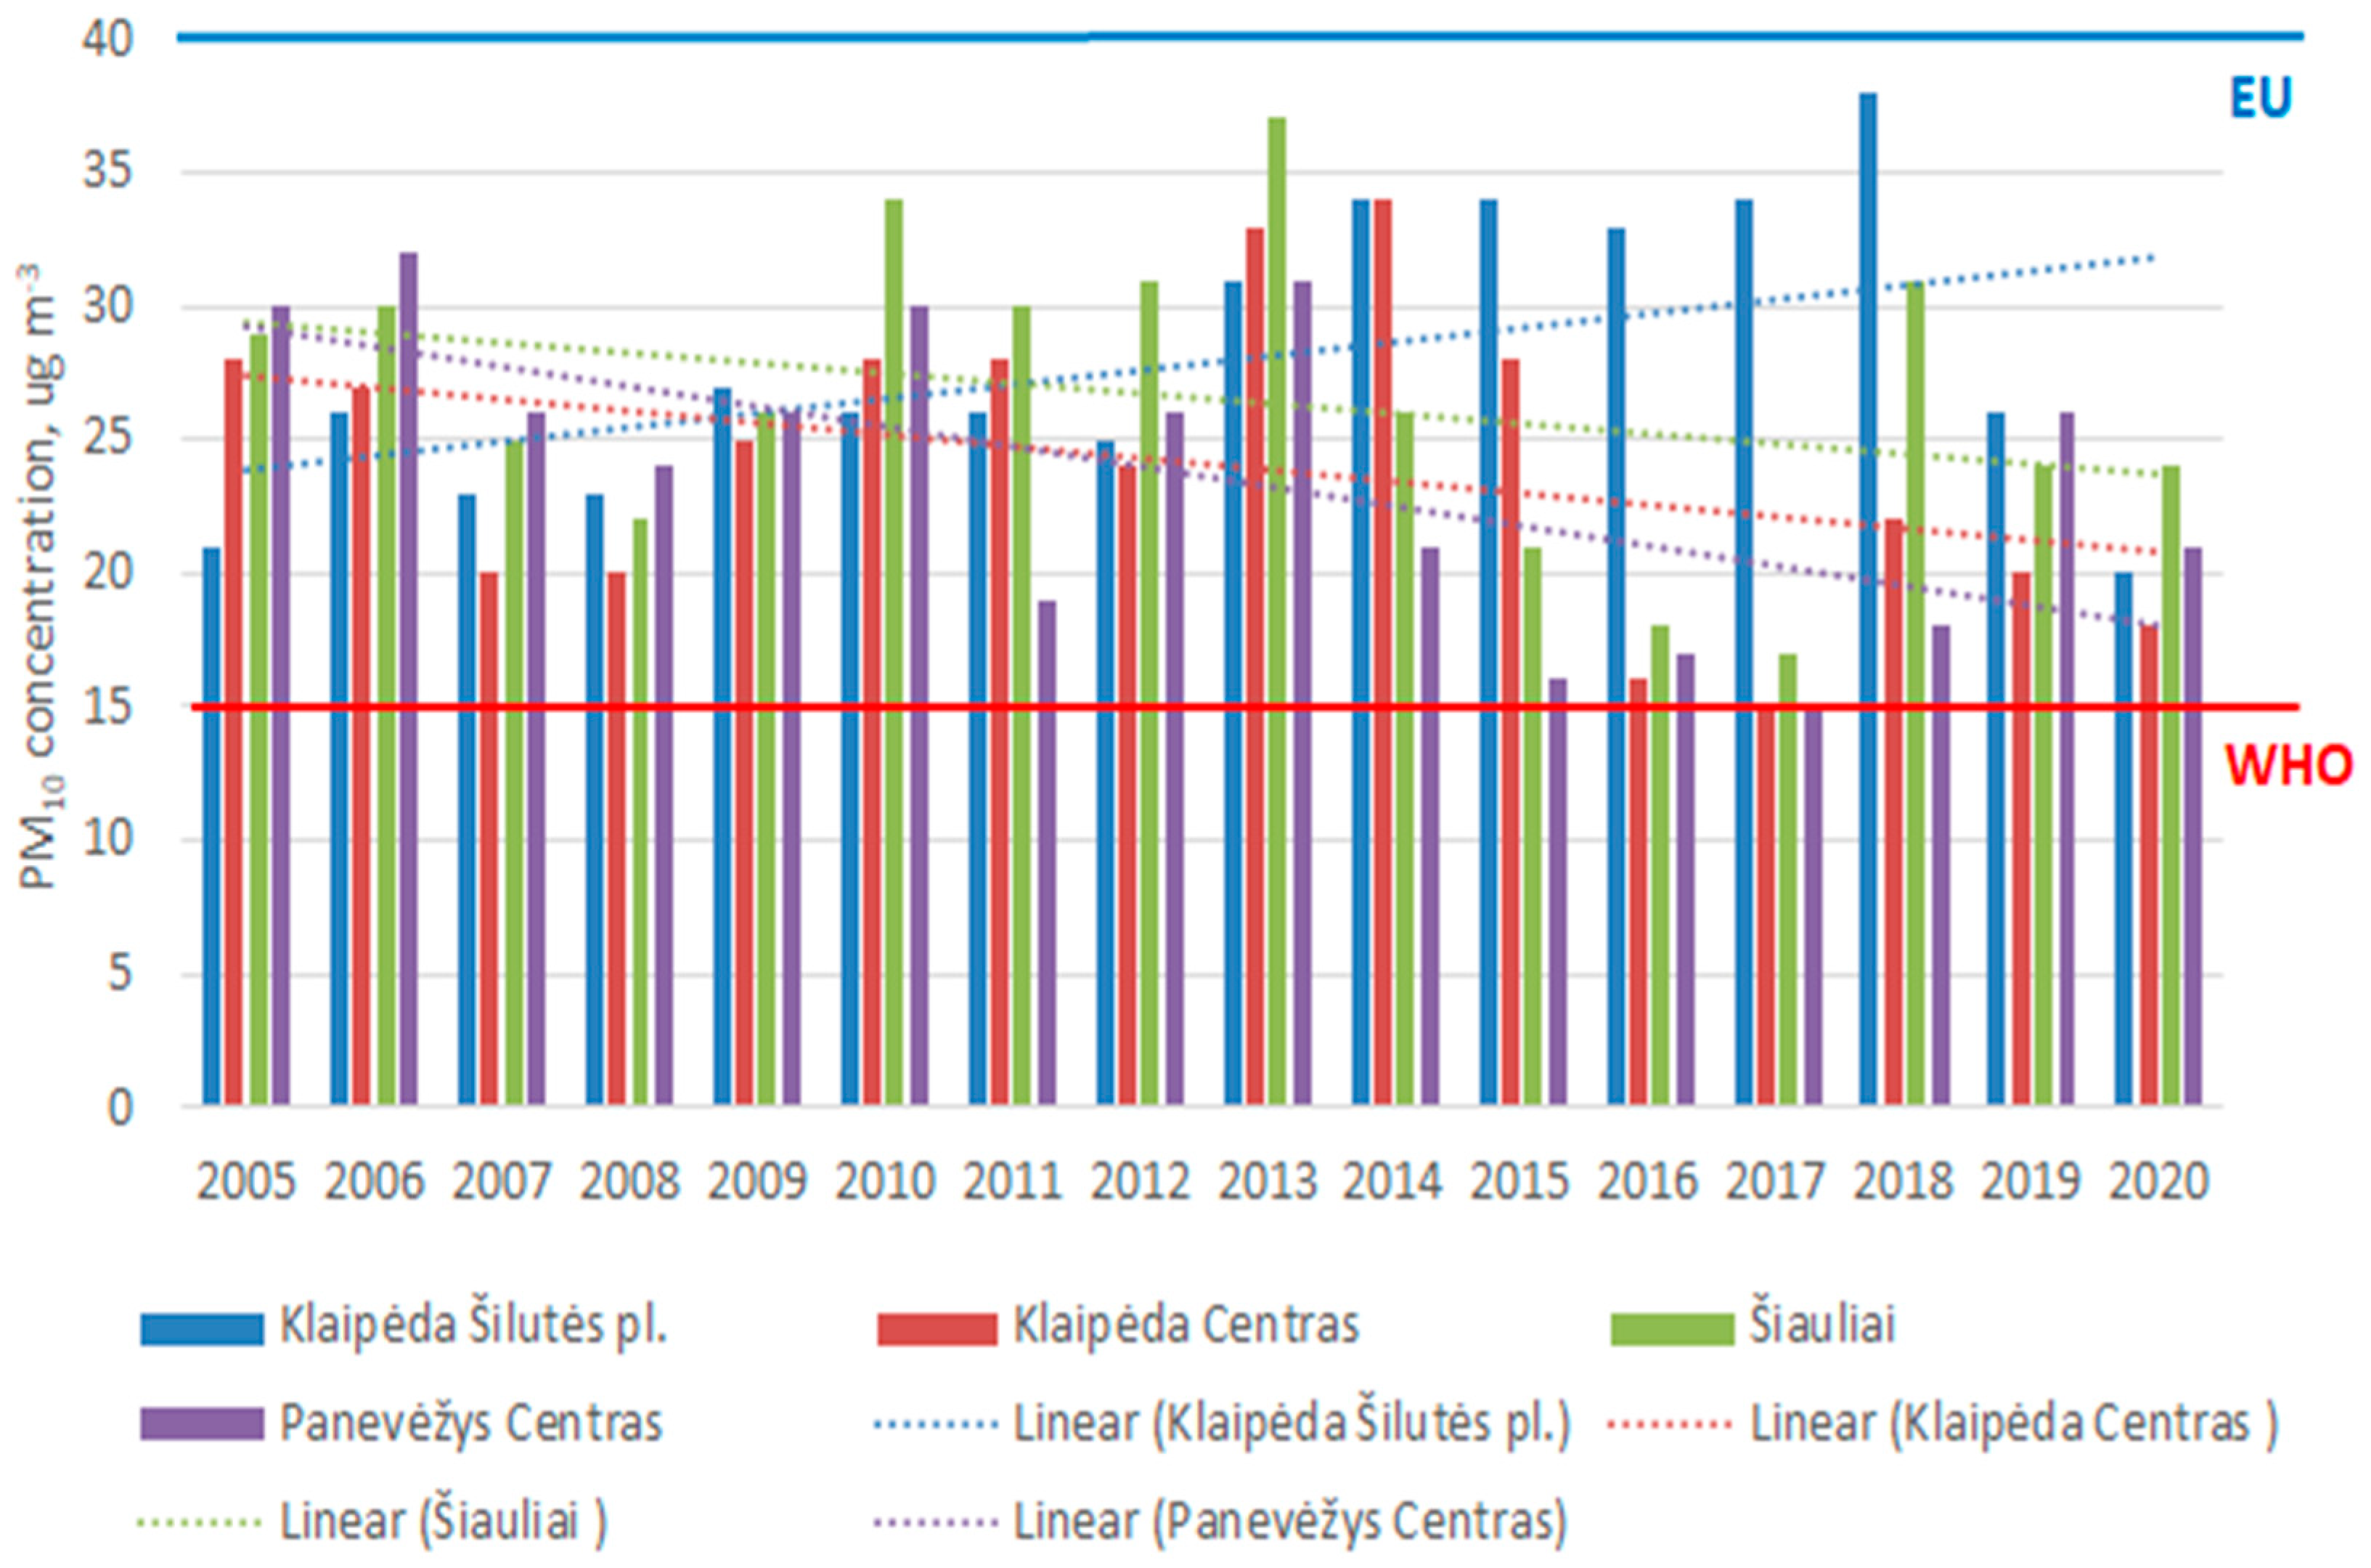
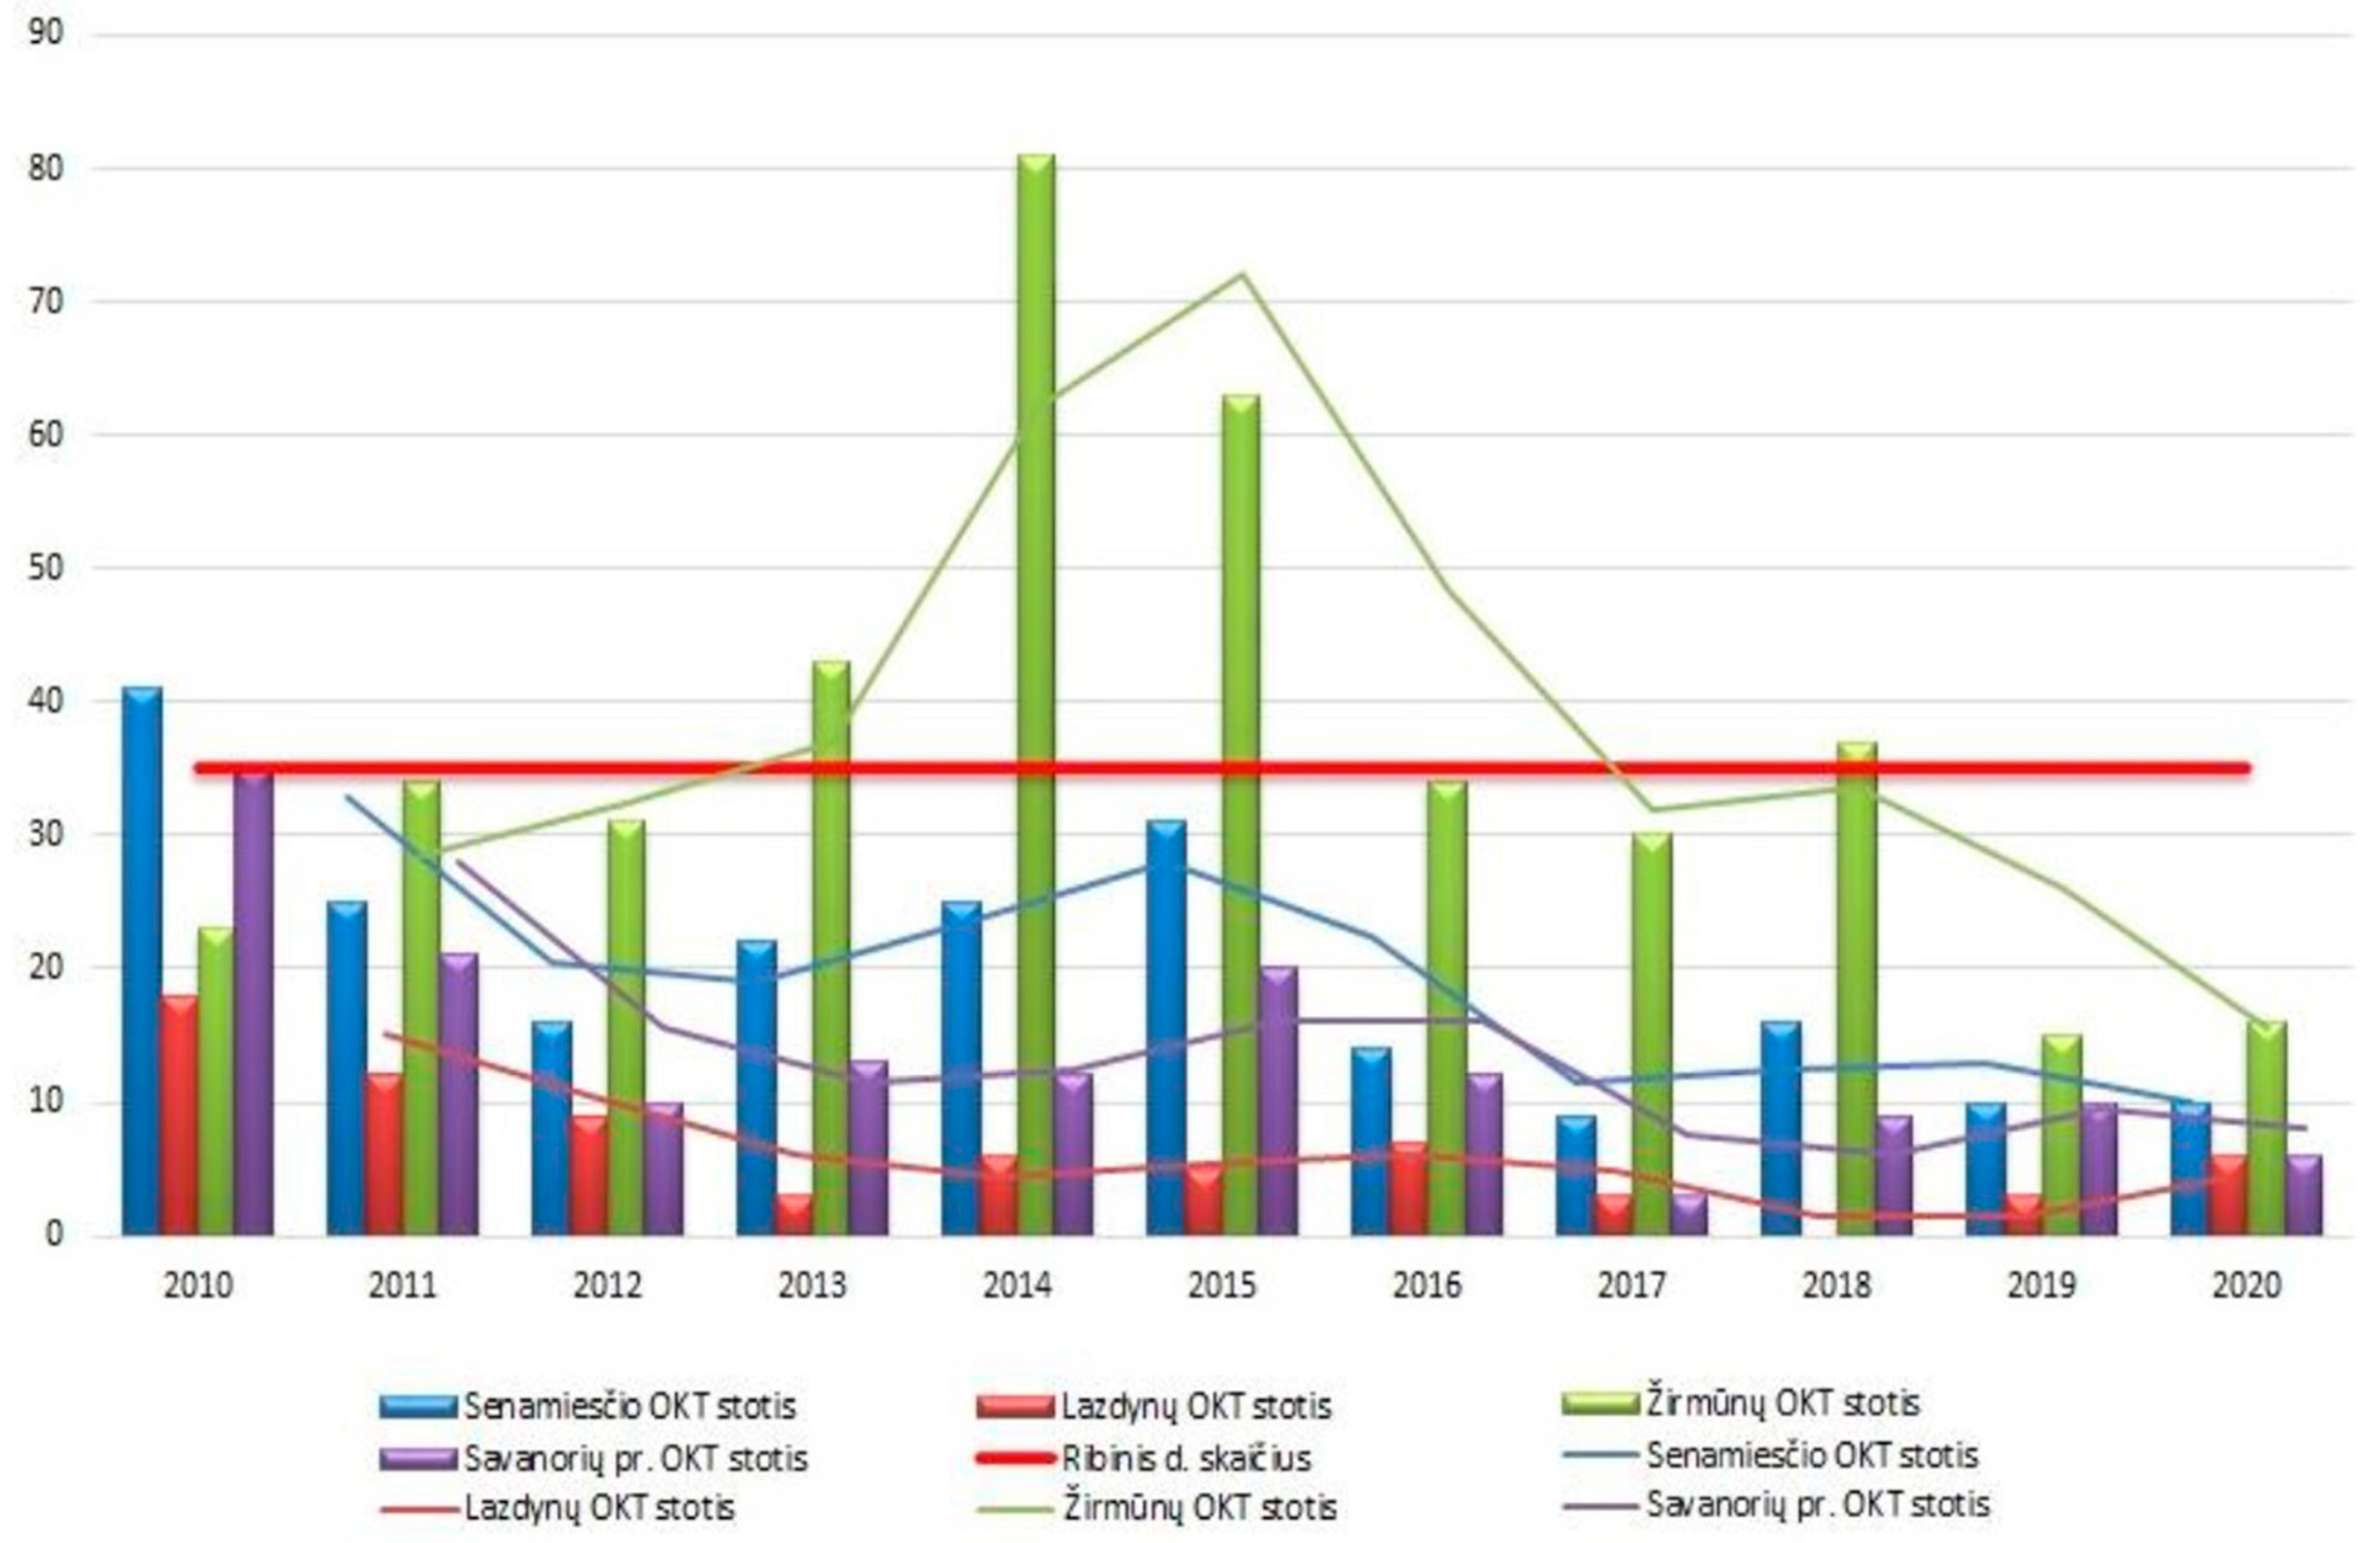
| EU limit value | human health | 1 day | 50 µg/m3 | 35 | 1 January 2005 |
| WHO limit value | 1 day | 45 µg/m3 | |||
| EU limit value | human health | 1 year | 40 µg/m3 | 1 January 2005 | |
| WHO limit value | 1 year | 15 µg/m3 | |||
| PM2.5 Standard | Protection Objective | Averaging Period | Value | Max Number of Exceedances | Date to Be Achieved (by and Maintained Thereafter) |
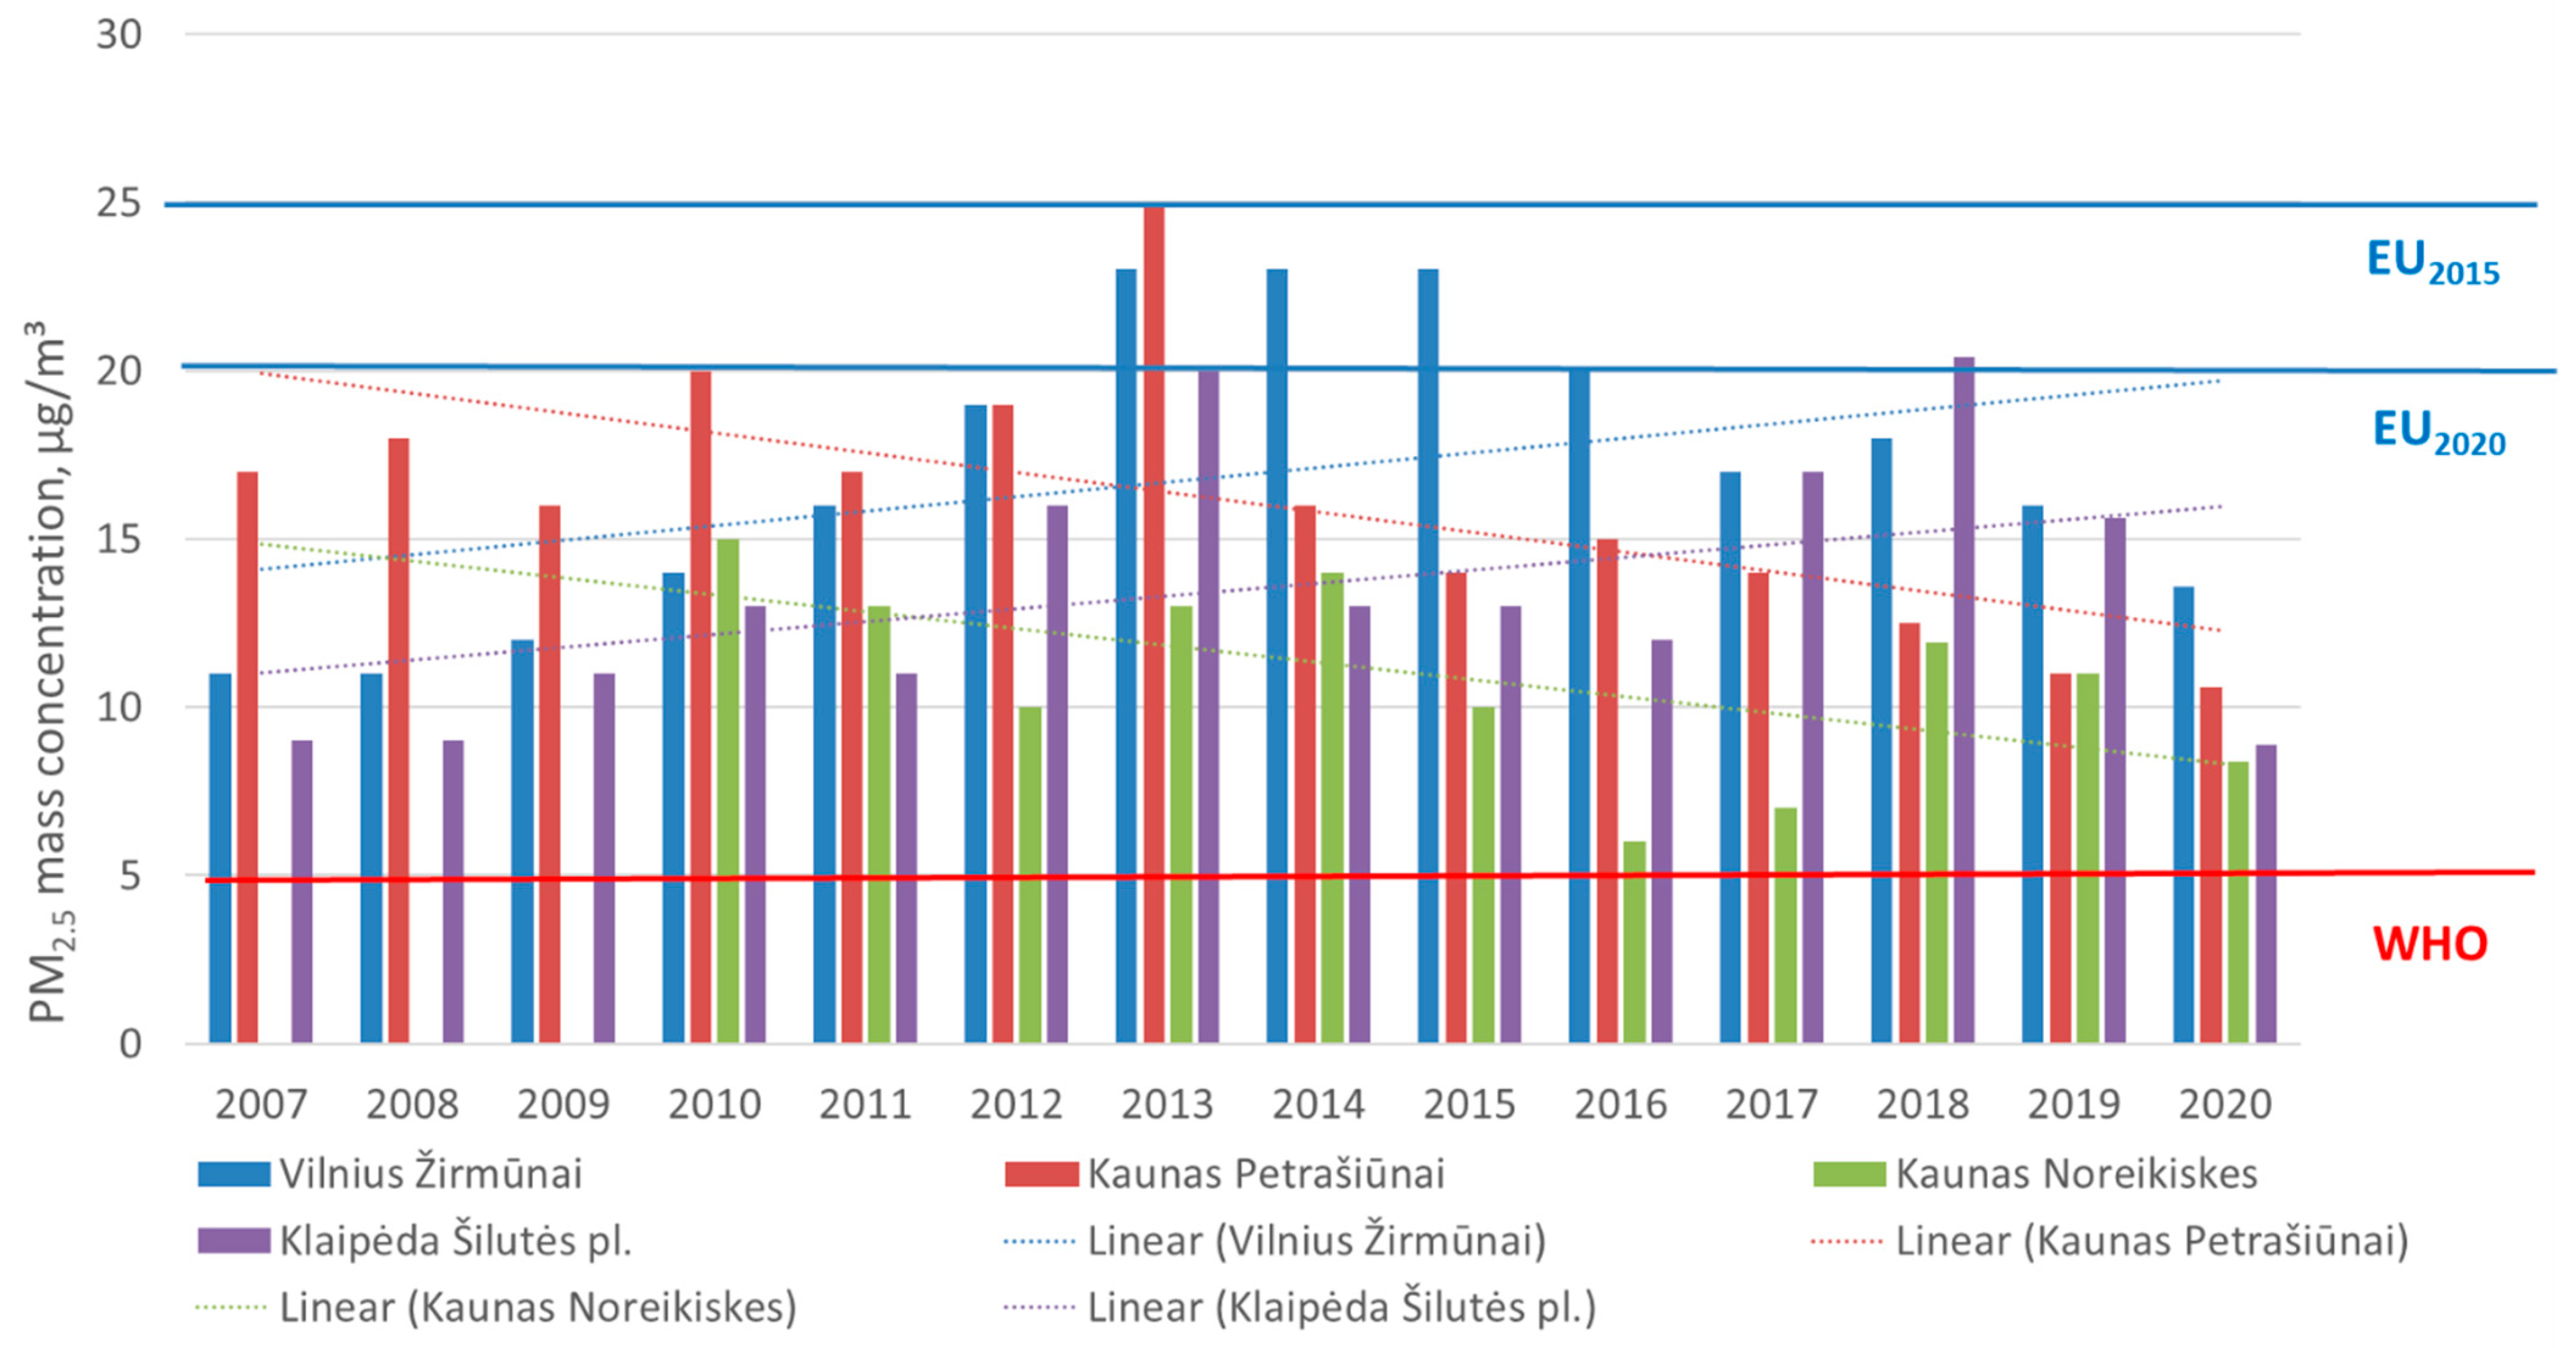
| EU target | human health | 1 year | 25 µg/m3 20 µg/m3 | 1 January 2015 1 January 2020 | |
| Exposure Reduction | The target of a 20% reduction in concentrations at urban background. | Between 2010 and 2020 | |||
| WHO limit value | 1 year | 5 µg/m3 | |||
| WHO limit value | 1 day | 15 µg/m3 |
| PM2.5 | Activity Sector | Share from National Total, % | |||||||||||||||
|---|---|---|---|---|---|---|---|---|---|---|---|---|---|---|---|---|---|
| 2005 | 2006 | 2007 | 2008 | 2009 | 2010 | 2011 | 2012 | 2013 | 2014 | 2015 | 2016 | 2017 | 2018 | 2019 | 2020 | ||
| Energy sector | Public electricity and heat production | 5.9 | 5.7 | 5.7 | 5.1 | 6.1 | 6.0 | 5.3 | 6.6 | 6.2 | 7.7 | 10.1 | 10.2 | 11.2 | 10.4 | 9.8 | 10.2 |
| Petroleum refining and distribution | 4.7 | 4.5 | 3.9 | 5.5 | 4.1 | 3.6 | 2.3 | 2.7 | 2.1 | 1.7 | 2.7 | 2.6 | 2.0 | 1.9 | 1.3 | 0.7 | |
| Stationary and mobile combustion in manufacturing industries and construction | 3.8 | 3.7 | 3.7 | 3.1 | 2.6 | 2.8 | 3.1 | 3.3 | 2.9 | 3.0 | 2.9 | 3.1 | 3.2 | 3.1 | 3.2 | 3.7 | |
| Stationary combustion in the residential | 41.7 | 42.6 | 41.8 | 43.5 | 46.6 | 46.9 | 46.8 | 46.1 | 45.6 | 43.1 | 40.1 | 40.7 | 40.8 | 40.5 | 40.0 | 39.7 | |
| Stationary and mobile combustion in agriculture, services and etc. | 4.4 | 4.9 | 4.3 | 3.8 | 4.3 | 4.2 | 4.8 | 4.1 | 4.1 | 4.0 | 3.4 | 3.6 | 3.5 | 3.6 | 3.4 | 3.1 | |
| Sum | 60.5 | 61.4 | 59.3 | 61.0 | 63.8 | 63.5 | 62.2 | 62.7 | 60.9 | 59.5 | 59.1 | 60.2 | 60.7 | 59.5 | 57.8 | 57.3 | |
| Transport sector | Road transport | 14.6 | 14.3 | 16.8 | 16.2 | 13.8 | 14.3 | 14.3 | 13.9 | 15.1 | 16.5 | 16.6 | 16.4 | 15.5 | 14.9 | 15.8 | 14.7 |
| Other transport | 1.1 | 1.0 | 1.1 | 1.1 | 0.9 | 1.0 | 1.0 | 0.9 | 0.8 | 0.9 | 0.9 | 0.9 | 0.9 | 1.0 | 1.0 | 1.0 | |
| Sum | 15.7 | 15.4 | 17.8 | 17.3 | 14.7 | 15.3 | 15.3 | 14.8 | 15.9 | 17.5 | 17.4 | 17.3 | 16.4 | 15.9 | 16.8 | 15.7 | |
| Industry | 12.8 | 12.7 | 12.2 | 11.3 | 10.1 | 9.9 | 11.0 | 10.9 | 11.6 | 10.6 | 11.4 | 10.2 | 9.6 | 10.8 | 10.8 | 11.5 | |
| Agriculture | 4.4 | 4.2 | 4.2 | 4.1 | 4.6 | 4.5 | 4.7 | 4.8 | 4.8 | 5.2 | 5.3 | 5.5 | 5.3 | 5.2 | 5.7 | 6.2 | |
| Waste | 5.7 | 5.7 | 5.4 | 5.2 | 5.6 | 5.5 | 5.4 | 5.5 | 5.3 | 5.8 | 5.4 | 5.4 | 6.1 | 6.7 | 6.7 | 6.9 | |
| Other | 0.8 | 0.8 | 1.0 | 1.1 | 1.3 | 1.3 | 1.5 | 1.4 | 1.3 | 1.5 | 1.3 | 1.5 | 1.9 | 1.9 | 2.3 | 2.4 | |
| Total | 100 | 100 | 100 | 100 | 100 | 100 | 100 | 100 | 100 | 100 | 100 | 100 | 100 | 100 | 100 | 100 | |
| PM10 | Activity Sector | Share from National Total, % | |||||||||||||||
|---|---|---|---|---|---|---|---|---|---|---|---|---|---|---|---|---|---|
| 2005 | 2006 | 2007 | 2008 | 2009 | 2010 | 2011 | 2012 | 2013 | 2014 | 2015 | 2016 | 2017 | 2018 | 2019 | 2020 | ||
| Energy sector | Public electricity and heat production | 2.8 | 2.8 | 2.7 | 2.4 | 2.8 | 2.8 | 2.3 | 3.0 | 2.7 | 2.7 | 4.0 | 4.2 | 4.7 | 4.2 | 3.9 | 3.8 |
| Petroleum refining and distribution | 2.7 | 2.6 | 2.3 | 3.1 | 2.3 | 2.0 | 1.2 | 1.5 | 1.2 | 1.2 | 1.3 | 1.3 | 1.1 | 0.9 | 0.7 | 0.3 | |
| Stationary and mobile combustion in manufacturing industries and construction | 1.7 | 1.8 | 1.7 | 1.3 | 1.3 | 1.3 | 1.5 | 1.4 | 1.3 | 1.2 | 1.2 | 1.3 | 1.4 | 1.3 | 1.4 | 1.4 | |
| Stationary combustion in the residential | 19.8 | 20.7 | 20.0 | 20.7 | 21.6 | 22.3 | 21.3 | 21.2 | 20.7 | 20.7 | 16.6 | 17.4 | 17.9 | 17.1 | 16.5 | 15.7 | |
| Stationary and mobile combustion in agriculture, services and etc. | 2.0 | 2.3 | 2.0 | 1.8 | 2.0 | 2.0 | 2.2 | 1.9 | 1.8 | 1.8 | 1.4 | 1.5 | 1.5 | 1.5 | 1.4 | 1.2 | |
| Sum | 29.1 | 30.2 | 28.7 | 29.3 | 30.0 | 30.3 | 28.5 | 29.0 | 27.7 | 27.7 | 24.5 | 25.7 | 26.6 | 25.0 | 23.9 | 22.4 | |
| Transport sector | Road transport | 7.6 | 7.7 | 8.9 | 8.7 | 7.2 | 7.6 | 7.4 | 7.3 | 7.6 | 7.6 | 7.8 | 8.1 | 8.1 | 7.6 | 8.0 | 7.3 |
| Other transport | 0.5 | 0.5 | 0.5 | 0.5 | 0.4 | 0.4 | 0.4 | 0.4 | 0.4 | 0.4 | 0.4 | 0.4 | 0.4 | 0.4 | 0.4 | 0.4 | |
| sum | 8.1 | 8.2 | 9.4 | 9.2 | 7.6 | 8.1 | 7.8 | 7.7 | 8.0 | 8.0 | 8.2 | 8.5 | 8.5 | 8.0 | 8.4 | 7.7 | |
| Industry | 39.7 | 38.6 | 38.8 | 38.4 | 37.1 | 36.2 | 38.1 | 36.6 | 37.2 | 37.2 | 39.4 | 36.2 | 35.4 | 38.2 | 36.5 | 37.6 | |
| Agriculture | 20.0 | 19.8 | 19.9 | 20.0 | 22.2 | 22.1 | 22.4 | 23.4 | 24.0 | 24.0 | 25.1 | 26.6 | 26.0 | 25.1 | 27.7 | 28.7 | |
| Waste | 2.6 | 2.6 | 2.5 | 2.4 | 2.5 | 2.5 | 2.4 | 2.4 | 2.4 | 2.4 | 2.2 | 2.2 | 2.6 | 2.7 | 2.7 | 2.7 | |
| Other | 0.6 | 0.6 | 0.7 | 0.8 | 0.6 | 0.8 | 0.7 | 0.8 | 0.7 | 0.8 | 0.6 | 0.8 | 1.0 | 0.9 | 0.8 | 1.0 | |
| Total | 100 | 100 | 100 | 100 | 100 | 100 | 100 | 100 | 100 | 100 | 100 | 100 | 100 | 100 | 100 | 100 | |
| Site | Trend (μg/m3 per Year) | Trend (% per Year) | SD (μg/m3 per Year) |
|---|---|---|---|
| Klaipėda Šilutės pl. | 0.53 | −0.3 | 5.36 |
| Šiauliai | −0.38 | −1.1 | 5.57 |
| Klaipėda Centras | −0.44 | −2.4 | 5.70 |
| Panevėžys Centras | −0.74 | −1.1 | 5.61 |
| Vilnius Senamiestis | 0.38 | 0 | 3.52 |
| Vilnius Lazdynai | −0.06 | 0.9 | 3.61 |
| Vilnius Žirmūnai | 0.14 (0.43) | −1.2 (1.7) | 4.75 (4.43) |
| Vilnius Savanorių pr. | −0.58 | −3.8 | 4.00 |
Publisher’s Note: MDPI stays neutral with regard to jurisdictional claims in published maps and institutional affiliations. |
© 2022 by the authors. Licensee MDPI, Basel, Switzerland. This article is an open access article distributed under the terms and conditions of the Creative Commons Attribution (CC BY) license (https://creativecommons.org/licenses/by/4.0/).
Share and Cite
Byčenkienė, S.; Khan, A.; Bimbaitė, V. Impact of PM2.5 and PM10 Emissions on Changes of Their Concentration Levels in Lithuania: A Case Study. Atmosphere 2022, 13, 1793. https://doi.org/10.3390/atmos13111793
Byčenkienė S, Khan A, Bimbaitė V. Impact of PM2.5 and PM10 Emissions on Changes of Their Concentration Levels in Lithuania: A Case Study. Atmosphere. 2022; 13(11):1793. https://doi.org/10.3390/atmos13111793
Chicago/Turabian StyleByčenkienė, Steigvilė, Abdullah Khan, and Vilma Bimbaitė. 2022. "Impact of PM2.5 and PM10 Emissions on Changes of Their Concentration Levels in Lithuania: A Case Study" Atmosphere 13, no. 11: 1793. https://doi.org/10.3390/atmos13111793
APA StyleByčenkienė, S., Khan, A., & Bimbaitė, V. (2022). Impact of PM2.5 and PM10 Emissions on Changes of Their Concentration Levels in Lithuania: A Case Study. Atmosphere, 13(11), 1793. https://doi.org/10.3390/atmos13111793


