Article

Impacts of Tibetan Plateau Spring Snowmelt on Spring and Summer Precipitation in Northwest China

1
Key Laboratory of Climate Resources Development and Disaster Prevention and Reduction of Gansu Province/College of Atmospheric Sciences, Lanzhou University, No. 222 Tianshui South Road, Chengguan District, Lanzhou 730000, China
2
Key Laboratory of Arid Climatic Change and Reducing Disaster of Gansu Province/Key Laboratory of Arid Climatic Change and Disaster Reduction, Institute of Arid Meteorology, China Meteorological Administration, No. 2070 Donggang East Road, Chengguan District, Lanzhou 730020, China
*
Author to whom correspondence should be addressed.
Atmosphere 2023, 14(3), 466; https://doi.org/10.3390/atmos14030466
Submission received: 17 January 2023 / Revised: 17 February 2023 / Accepted: 23 February 2023 / Published: 27 February 2023
(This article belongs to the Special Issue Extreme Climate in Arid and Semi-arid Regions)

Abstract

:
Snow on the Tibetan Plateau (TP) is an important signal for the prediction of East Asian climate. In this study, the relationship between the TP spring snowmelt and spring and summer precipitation in Northwest China (NWC) was investigated, along with the possible mechanisms linked to the impacts of snowmelt on precipitation. The results showed that the TP spring snowmelt had significant impacts on spring and summer precipitation in NWC. For example, when there was a large spring snowmelt in the central- eastern TP, the spring and summer precipitation in the Hexi Corridor and southeast NWC was excessive, especially in summer; when there was a large spring snowmelt in the northern TP, the spring and summer precipitation was deficient across the whole of NWC, while a large spring snowmelt in the western TP led to deficient spring and summer precipitation in eastern NWC but excessive precipitation in western NWC. The possible mechanisms for this included the fact that more spring snowmelt over the TP led to higher soil moisture contents, which further resulted in weakened subtropical westerly and enhanced ridge over Xinjiang. By changing the TP thermal forcing, these anomalous atmospheric circulation conditions transported water vapor into NWC, thus creating excessive summer precipitation in that region.

1. Introduction

As an important part of the cryosphere, snow plays an important role in local and remote climate due to its albedo and hydrological effects. The high albedo of snow reduces surface net radiation and changes surface diabatic heating. Additionally, due to the low conductivity of snow, variations in snow change the heat exchange between the land surface and the atmosphere. Snowmelt also impacts surface hydrological processes by increasing soil moisture [1,2,3,4,5]. The influence of winter–spring snow on summer monsoon rainfall is mainly due to the albedo effects of snow cover [3,5,6,7] and the persistence of soil moisture anomalies induced by snowmelt [7,8,9].
The average altitude of the Tibetan Plateau (TP) is about 4000 m, meaning that it is in the middle of the troposphere and is a huge heating source for the atmosphere [10]. Snow covers the TP for most of the year, establishing in autumn and persisting until the subsequent spring or even summer [11,12,13]. A number of studies have investigated the impacts of snow cover and snow depth over the TP on the weather and climate in the surrounding regions, especially the East Asian monsoon region. It has also been demonstrated that the TP winter–spring snow anomaly plays an important role in weather and climate by changing atmospheric circulation and that it is one of the key factors in the prediction of summer precipitation in eastern China [14,15,16,17,18,19,20,21,22,23,24]. Moreover, TP spring snow can modulate the subsequent sea surface temperature anomalies [25]. Investigating the climate effects of TP snow anomalies is beneficial for deep understanding the thermal forcing of TP.
Previous studies have generally focused on anomalous variations in winter–spring snow cover/depth over the whole TP and their effects on the climate. Snow cover/depth anomalies can persist for a long time [26,27]. Due to the variations of surface radiation budget, the impacts of snow cover/depth and snowmelt in different seasons should be distinguishable. In spring, the evolution of atmospheric circulation patterns occurs, which is influenced by surface diabatic heating. Due to the heterogeneity of the underlying surface, changes of snow cover/depth can induce the spatiotemporal anomalies of surface diabatic heating. Furthermore, Mu and Zhou [26] found that winter snow cover mainly consisted of the accumulation of autumn snow cover and that fresh winter snow was only about 1/3 of fresh autumn snow. Therefore, it is necessary to analyze changes in snow cover/depth over different seasons, i.e., snow accumulation and snowmelt.
Many studies have analyzed the impacts of TP winter–spring snow cover/depth anomalies on summer precipitation in East Asia, but less attention has been paid to precipitation in Northwest China (NWC), which is located on the north side of the TP. Few studies have indicated the thermal effect of the TP is one of the causes for the interannual variations in precipitation and the changes between dry and wet years in NWC, the winter–spring snow depth over the TP has a weak negative correlation with rainfall from May to September in the arid area of NWC and has the most significant impact on spring precipitation in the northeastern TP and western Hexi in NWC [28,29,30]; however, the corresponding mechanisms have not been adequately clarified.
In recent years, the climate in NWC has undergone a transition from warm and dry to warm and wet and precipitation levels have increased continuously [31,32,33,34,35,36,37,38]. Nevertheless, the mechanism of precipitation increase is still unclear [36]. Thus, has there been a relationship between climate variability in NWC and TP spring snowmelt anomalies in recent years? What are the mechanisms behind this relationship? These issues were addressed in this study by investigating the relationship between spring snowmelt in the TP and spring–summer precipitation in NWC over the past 40 years.
The remainder of this paper is organized as follows. Section 2 describes the datasets and methods used in this study. The characteristics of the spatiotemporal distribution of the TP spring snowmelt are analyzed in Section 3. Section 4 examines the relationship between TP spring snowmelt and spring and summer precipitation in NWC over the past 40 years using the singular value decomposition (SVD) method. In Section 5, the possible mechanisms linked to the impact of TP spring snowmelt on spring and summer precipitation in NWC are explored. The conclusions and discussion are provided in the Section 6.

2. Data and Methodology

The daily snow depth dataset for the period from 1 January 1979 to 31 December 2019 with a horizontal resolution of 0.25° × 0.25° was obtained from the National Tibetan Plateau/Third Pole Environment Data Center (https://data.tpdc.ac.cn/zh-hans/, accessed on 11 April 2022). The snow data were derived from SMMR (1979–1987), SSM/I (1987–2007) and SSMI/S (2008–2019) passive microwave brightness temperature data. By simultaneously interpreting the brightness temperature of different sensors, the consistency of the brightness temperature data was improved. Based on the Chang algorithm, the snow depth inversion was carried out for China’s modified algorithm [39].
In this paper, the NWC precipitation data were from 149 ground observation stations and were collected from 1979 to 2019. We also used temperature and precipitation datasets with a horizontal resolution of 0.5° × 0.5° from CRU (https://lr1.uea.ac.uk/cru/data/, accessed on 20 June 2022) to analyze the influence of the TP snowmelt. The soil moisture dataset was obtained from EAR5 data from the European Center for Medium-Range Weather Forecasting (ECMWF) and was used to analyze the impacts of snow depth and snowmelt on soil moisture in different soil layers. The spatial resolution of the soil moisture data was 0.25° × 0.25° and the different soil layers were 0–7 cm, 7–28 cm, 28–100 cm and 100–289 cm in depth.
Generally, autumn and winter are the accumulation period for TP snow, while spring and summer are the melting period. Due to the unavailable of snow water equivalent dataset over TP, we used the snow depth as the proxy. To quantify the spatiotemporal variations in snow from winter to spring, the seasonal snow depth change index was calculated according to the formula presented by Mu and Zhou [26]:
I F S D x , y , t s = S D x , y , t m S D x , y , t m 3
where I F S D x , y , t s is the snow depth change index of a grid point ( x , y ) in one season ( t s ), S D x , y , t m is the snow depth of the grid point ( x , y ) in the month at the end of the season ( t m ) and S D x , y , t m is the snow depth of the grid point ( x , y ) in the month at the end of the previous season ( t m 3 ). When I F S D x , y , t s > 0, it means that the seasonal snow depth is increasing (which is called the snow accumulation period); whereas when I F S D x , y , t s < 0 indicates that the seasonal snow is melting (which is called the snowmelt).
Singular value decomposition (SVD) is a statistical method for analyzing the relationship between two meteorological element fields, which provides several pairs of typical time synchronized and time paired spatial distributions in the two element fields [40]. In this study, we used the SVD method to analyze the relationship between TP spring snowmelt and the subsequent summer precipitation in NWC. The empirical orthogonal function expansion (EOF) was also used to reveal the main spatial distribution modes of snow depth and snowmelt over the TP.

3. Characteristics of Spatiotemporal Variations in TP Spring Snowmelt

Figure 1 shows the seasonal variations in snow depth, snow accumulation and snowmelt over the TP from autumn to the subsequent summer. Generally, I F S D x , y , t s > 0 occurs in autumn and winter, while I F S D x , y , t s < 0 refers to the snowmelt in spring and summer. For comparison, the snowmelt in spring and summer was the absolute value of I F S D . It can be seen that the TP snow depth was largest in winter, followed by spring, while it was smallest in summer. The snow accumulation was largest in autumn and the snowmelt was largest in spring and autumn, followed by winter and summer. Except for winter snow depth, which was obviously larger than the winter snow accumulation, the snow depth was smaller than the snow accumulation in autumn and the snowmelt in spring and summer. This implied that snow accumulation mainly occurred during autumn and was relatively small during winter; whereas the snowmelt mainly occurred during spring, during which the albedo and hydrological effects were the most obvious.
Although winter and spring were the seasons with the largest snow depth, autumn was the season with abundant snow accumulation and spring was the season with largest snowmelt. It can be seen from Figure 1 that the spring snowmelt was the most significant as it not only modified the surface albedo but also distinctly influenced soil moisture variability; thus, the hydrological effects of snow were the most distinct when the snowmelt occurred in spring. In this study, we mainly investigated the spatiotemporal variations of spring snowmelt over the TP, as well as exploring the impacts of TP spring snowmelt on subsequent seasonal precipitation in NWC.
Spring snowmelt can greatly influence surface hydrological processes, such as runoff and soil moisture. Anomalies in spring soil moisture can persist for several weeks or months and affect summer atmospheric circulation conditions and precipitation [7,8,9,10]. To understand the hydrological effects of snow cover anomalies, it is necessary to further investigate abnormal changes in the TP spring snowmelt.
Spring is a transition period, during which the temperature rises and snow on the TP begins to melt. Snowmelt is jointly affected by many factors, such as early winter snow, temperature and spring snowfall. Therefore, any changes in the TP spring snowmelt are more complex than those in the TP spring snow depth. In contrast to the spatial distribution of the TP spring snow depth [41,42,43], the high value areas of spring snow depth and spring snowmelt, which are mainly located in the mountainous regions of the TP, and the standard deviations of snow depth and snowmelt over the TP are consistent. Significant increases in the TP spring snowmelt can also occur in those regions. Additionally, the eastern TP is a key region with obvious variations in snow depth and snowmelt in spring. As for the mountainous regions on the western edge of the TP, snow depth is large but the snowmelt is small, which could be related to the relatively low temperatures and strong snow drifts that are not conducive to snowmelt at high altitudes.
In order to analyze the spatiotemporal distribution characteristics of the interannual variations in TP snowmelt, the spring snowmelt was decomposed using EOF. Comparing the EOF results of spring snow depth, the first 10 modes of the TP spring snowmelt accounted for 66.4% of the total variance (while the first 10 modes of the TP spring snow depth accounted for 74.9% of the total variance), indicating that the rate of the spring snowmelt was slower than that of snow depth, which reflected the great difference in the spatial distribution of the TP spring snowmelt. The first two modes passed the North test [44]. Figure 2 shows the spatial distributions of the first and second EOF modes of the spring snowmelt and snow depth over the TP. Generally, the EOF1 mode reflected the mean state and EOF2 reflected the local characteristics of anomalies. The EOF1 spring snowmelt mode was negative over the main body of the TP, except for the intersection zone between the northeast slope of the TP and the Loess Plateau, reflecting the consistent change characteristics of the spring snowmelt over the main body of the TP. Meanwhile, the EOF2 mode was positive in the eastern TP and negative in the western TP, reflecting east–west reverse variations in the spring snowmelt.
The EOF1 spring snow depth mode was positive in the central and western regions of the TP and negative in the eastern region. The high value area was located in the hinterland of the TP. The mode showed a northeast–southwest reverse distribution, which was bounded by about 95° E. The EOF2 spring snow depth mode was positive in most areas, except for the central, western and northern edges of the TP, reflecting obvious local characteristics. Therefore, the EOF results for the TP spring snowmelt were different from those for the spring snow depth. The reason for this could be that the TP temperature rose in spring, so the snow melted faster and there was more snowmelt in areas of low altitude or high temperature; meanwhile, in high-altitude mountainous areas, the snow did not melt as easily due to the influence of the terrain and low temperature, so the snowmelt was small and the snow depth was large.
Figure 3 shows the principal components corresponding to the first and second eigenvectors of the TP spring snowmelt and snow depth. The principal component (PC1) time series showed a significant decreasing trend (p < 0.05) from 1979 to 2019, while PC2 had no obvious linear trends. There were differences between the PC1 and PC2 interannual fluctuations, especially before the 1990s, when the two-mode time coefficient was opposite. This also showed that the first and second modes of the spring snowmelt corresponded to different spatial anomalies and that the interannual variability in the two characteristics was significant. The correlation coefficient between PC1 and I F S D was 0.835, that between PC2 and I F S D was −0.400, that between PC1 and SD was 0.612 and that between PC2 and SD was −0.365.

4. Influence of the TP Spring Snowmelt on Precipitation in NWC

4.1. Relationship between the TP Spring Snowmelt and Spring Precipitation in NWC

To investigate the relationship between the TP spring snowmelt and spring precipitation in NWC, the TP spring snowmelt and the spring and summer precipitation in NWC were statistically analyzed using the SVD method. We found that the cumulative contribution rate of the first three SVD modes of the TP spring snowmelt and spring precipitation in NWC reached 51.25% (Table 1) and that the correlation coefficients were all above 0.66 (p < 0.01; α0.01 = 0.402). Thus, the first three modes were analyzed to reveal the impact of the TP spring snowmelt on spring precipitation in NWC.
Figure 4 shows the typical spatial patterns of the heterogeneous correlation (which is the correlation between the time coefficients of two fields at every grid point) of the first three SVD modes between the TP spring snowmelt and spring precipitation in NWC. The first mode of the TP spring snowmelt field (left field) was positive at the northeastern and southern edges of the TP, while it was negative in all other areas. The high value area was located in the hinterland of the central western TP, which is a key area affecting spring precipitation in NWC. The corresponding spring precipitation field (right field) showed that the main areas were all positive, except for the eastern area of Qinghai Province, and that the high value areas were located in eastern NWC and northern Xinjiang. The correlation coefficient of the first mode was 0.66, indicating that there was a negative correlation between the spring snowmelt and spring precipitation in NWC. When there was a smaller spring snowmelt in the hinterland of the central eastern plateau, southern Qinghai and western Sichuan, there was more spring precipitation in eastern NWC and northern Xinjiang and vice versa. The second mode of the spring snowmelt field showed that all areas were positive, except for some negative regions in Shigatse and northern Qinghai. The corresponding spring precipitation field showed that Qinghai, southern Gansu, central and western Inner Mongolia and southern Xinjiang were negative, while Ningxia, most of Shaanxi and northern Xinjiang were positive. This indicated that a larger spring snowmelt in most areas of the TP corresponded to less spring precipitation in Qinghai and central and western Inner Mongolia. The third mode of the spring snowmelt field was positive in the western and southern TP and negative in the eastern part of the TP. The corresponding spring precipitation field was negative in eastern NWC and positive in the west. This showed that when there was a larger spring snowmelt in the western TP and a smaller spring snowmelt in the eastern TP, there was more spring precipitation in northern Xinjiang and western Gansu Province and less in eastern NWC.
The first three SVD modes reflected that spring precipitation in NWC was closely related to the TP spring snowmelt. The first three modes represented the three spatial modes of the TP spring snowmelt and corresponded to the distribution of spring precipitation in NWC. When the spring snowmelt was larger in the northern TP but smaller in the central and southern TP, there was less spring precipitation in most parts of NWC, especially in the east. Additionally, when there was a larger spring snowmelt in most areas of the TP, there was less spring precipitation in Qinghai and the central and western areas of Inner Mongolia but more in the east of NWC. Finally, when the spring snowmelt was larger in the western TP and smaller in the eastern TP, there was more spring precipitation in the western NWC and less in the east.

4.2. Relationship between the TP Spring Snowmelt and Summer Precipitation in NWC

The TP spring snowmelt not only affects spring precipitation in China, but also the subsequent summer precipitation due to the “memory” of soil moisture. Table 2 shows the cumulative contribution rate of the first three SVD modes of the TP spring snowmelt and summer rainfall in NWC, which reached 47.33%. The correlation coefficients were all above 0.66 (p < 0.01; α0.01 = 0.402).
Figure 5 shows the spatial distributions of the heterogeneous correlation coefficients of the first three SVD modes between the TP spring snowmelt and summer precipitation in NWC. The first mode indicated that there was a significant negative correlation between the TP spring snowmelt and summer precipitation in NWC. When there was a larger spring snowmelt, there was more summer precipitation in Gansu, southern Shaanxi and southern Qinghai, but less precipitation in the central and western regions of Inner Mongolia, Ningxia and northern Shaanxi, and vice versa. The second mode of the spring snowmelt field showed that the western part of the TP was negative, while the eastern part was positive and bounded by 95° E. The second mode indicated that when there was a larger spring snowmelt in the eastern TP and a smaller snowmelt in the western TP, there was more summer precipitation in most parts of NWC. The third mode showed the pattern of there being a larger spring snowmelt in the northern TP and a smaller snowmelt in the southern TP in spring, which resulted in less summer precipitation in most areas of NWC.
The influence of an abnormal distribution of spring snowmelt on summer precipitation in NWC was different from that on spring precipitation in some areas. On the whole, although there were differences in the impact of TP spring snowmelt on spring and summer precipitation in some areas, the spatial modes of the impact of TP spring snowmelt on spring and summer precipitation in NWC mainly demonstrated three patterns: a larger snowmelt in the center eastern TP; a larger snowmelt in the northern TP; and a larger snowmelt in the western TP. There were some differences in the corresponding spatial distributions of spring and summer precipitation in NWC, but there were also similarities. For example, when there was a larger spring snowmelt in the northern TP and a smaller snowmelt in the south, there was less corresponding spring precipitation in most parts of NWC (Figure 4(b1)), but with the evolution of time, in summer, there was more precipitation in some parts of NWC, i.e., Qinghai province; however, there was still less precipitation in most areas, especially Xinjiang (Figure 5(b3)). When there was a larger spring snowmelt over the whole TP, especially larger in the center eastern of TP, there was more corresponding spring precipitation in the northern Xinjiang–Hexi–Ningxia–northern Shaanxi belt (Figure 4(b2)), but the difference was not significant. Meanwhile, in summer, the increased precipitation in the belt were more significant and extended to southern Qinghai and southern Shaanxi (Figure 5(b1)). When there was a larger spring snowmelt in the western TP and a smaller snowmelt in the eastern part, there was more spring precipitation in western NWC and less in eastern NWC (Figure 4(b3)). In summer, there was still less precipitation in the west and more in the east of NWC, but the area with less precipitation narrowed to the region from Tianshan Mountain to southern Xinjiang and the area with more precipitation expanded to eastern Xinjiang, Gansu, the central and eastern regions of Inner Mongolia, Ningxia and Shaanxi (Figure 5(b2)).

4.3. Composite Analysis of Spring and Summer Precipitation Anomalies in NWC

In order to further investigate the impact of TP spring snowmelt on spring and summer precipitation in NWC, we selected years with a large spring snowmelt and years with a small spring snowmelt and analyzed any subsequent abnormal changes in precipitation in NWC. In this study, years with a snowmelt standard deviation value > 1 were defined as high snowmelt years, while those with a snowmelt standard deviation value < 1 were defined as low snowmelt years. According to these definitions, the high snowmelt years were 1998, 1986, 1983, 1980 and 1979 and the low snowmelt years were 2018, 2006, 2017 and 2013.
Figure 6 shows the differences in the spatial distributions of spring and summer precipitation in NWC between high snowmelt years and low snowmelt years. Comparing the spatial modes of spring and summer precipitation in NWC in the abnormal years of TP snowmelt, it can be seen that with about 102° N as the boundary, the changes in the spring and summer precipitation modes in the west were relatively consistent, which was mainly reflected in the positive relationship between the TP spring snowmelt and precipitation in eastern Xinjiang, western Gansu and the negative corresponding relationship in western Xinjiang, western Inner Mongolia and central eastern Gansu. It also reflects the changes in precipitation from spring to summer in NWC when there is a larger spring snowmelt over the whole TP due to the criteria of high/low snowmelt year.
However, the spring and summer precipitation modes in the east were opposite, i.e., spring precipitation demonstrated a positive–negative–positive mode from north to south, while summer precipitation showed a negative–positive–negative mode from north to south. The difference in precipitation between high snowmelt years and low snowmelt years reflected the impact of TP spring snowmelt on precipitation to the greatest extent. Our analysis showed that the impact of TP spring snowmelt on precipitation in the northwestern arid area of China (about 102° N to the west) lasted from spring to summer, while it was different in the northwestern arid and semi-arid area (about 102° N to the east) due to the area being strongly affected by summer monsoons.

5. Possible Mechanisms Linked to the Impact of TP Spring Snowmelt on Spring and Summer Precipitation in NWC

Many studies have analyzed the relationship between TP winter–spring snow depth and spring and summer precipitation in NWC and it has been found that abnormal TP winter–spring snow depths mainly have positive relationships with spring and summer precipitation in NWC, but the key areas that are affected are different in spring and summer [29,45]. Therefore, TP snow depth provides a certain indication and prediction significance for spring and summer precipitation in NWC. Soil moisture content can often signal snow anomalies because it affects regional atmospheric circulation conditions via land–atmosphere interactions, which, in turn, affect precipitation distribution patterns in spring and summer. When the winter temperature is low over the TP, the accumulated winter snow depth is larger and the reflection effect of snow becomes significant. Meanwhile, the increase in temperature in spring and the subsequent snowmelt mainly show the hydrological effects of snow. Therefore, this section mainly discusses the relationship between snowmelt and snow depth in spring so as to lay the foundations of our analysis of the impact mechanisms of TP spring snowmelt on spring and summer precipitation in NWC.
It has long been known that the TP snowmelt leads to water being stored in soil for a long time, thereby prolonging its impacts on weather and climate. This is the main mechanism of TP snow cover/depth that affects summer precipitation in China [7,43,46,47,48]. Figure 7 shows the correlations between soil moisture at depths of 0–7 cm, 7–28 cm and 28–100 cm and spring snowmelt and snow depth over the TP. It can be seen that the spring snowmelt significantly contributed to soil moisture, but the contribution gradually decreased with the increase in depth.
Soil moisture anomalies induced by a snowmelt could lead to surface diabatic heating anomalies and impact atmospheric circulation conditions [25,30]. In summer, due to the thermal forcing of the TP, the westerly winds on the south side of the TP are replaced by easterly winds. As shown in Figure 8, when there was a larger/smaller spring snowmelt over the TP, there were positive/negative anomalies in the zonal winds on the south side of the TP (south of 30° N) and negative/positive anomalies on the north side of the TP, which meant that both easterly and westerly winds on two sides of the TP became weaker/stronger.
TP thermal forcing anomalies can further impact downstream atmospheric circulation conditions. Subtropical upper-troposphere westerly jet streams are a prominent feature of atmospheric circulation conditions at midlatitudes and interactions between these subtropical westerly jet streams and East Asian monsoons notably affect the spatiotemporal patterns and seasonal evolution of precipitation in East Asia [49,50,51,52]. As shown in Figure 9, when there was a larger spring snowmelt over the TP, there were negative anomalies in the 200 hPa westerly winds over the Baikal, while there were positive anomalies over the Sea of Japan, which implied that the subtropical westerly jet streams became weaker at the exit region and their positions shifted southward. When there was a smaller spring snowmelt over the TP, the subtropical westerly winds showed the opposite anomalies.
Figure 10 shows composite anomalies in the 500 hPa circulation field. Correspondingly, a larger spring snowmelt over the TP led to positive anomalies at 500 hPa over the northwest side of the TP and negative anomalies over North China, resulting in the enhancement of the Xinjiang ridge and southern trough winds, which are important circulation systems that influence summer precipitation in NWC. Previous studies [53,54,55] have suggested that northwesterly winds after the Xinjiang ridge could transport water vapor to Hexi Corridor and cause precipitation. Thus, a larger spring snowmelt over the central eastern TP would result in more summer precipitation in middle region of NWC and less summer precipitation over its two sides.

6. Conclusions and Discussion

Snow plays important roles in climate systems due to its albedo effects and hydrological effects. In this study, the spatiotemporal variations in spring snowmelt over the TP were analyzed and the impacts of TP spring snowmelt on spring and summer precipitation in NWC were investigated. The conclusions could be summarized as follows:
  • Snow accumulation mainly occurred during autumn and snowmelt, and was larger in spring than in summer. Over the past 40 years, both the snow depth and snowmelt have shown significant decreasing trends. Additionally, large interannual variations in snowmelt occurred over the eastern TP;
  • There was a significant relationship between spring snowmelt and spring and summer precipitation in NWC. In particular, the larger the spring snowmelt over the whole TP, especially in the central eastern TP, the more spring and summer precipitation in the Hexi Corridor and southeast NWC (which was more significant in summer). Additionally, larger spring snowmelts in the northern TP resulted in less spring and summer precipitation in NWC, whereas larger spring snowmelts in the western TP led to more spring and summer rainfall in western NWC and less in eastern NWC (which was also more significant in summer);
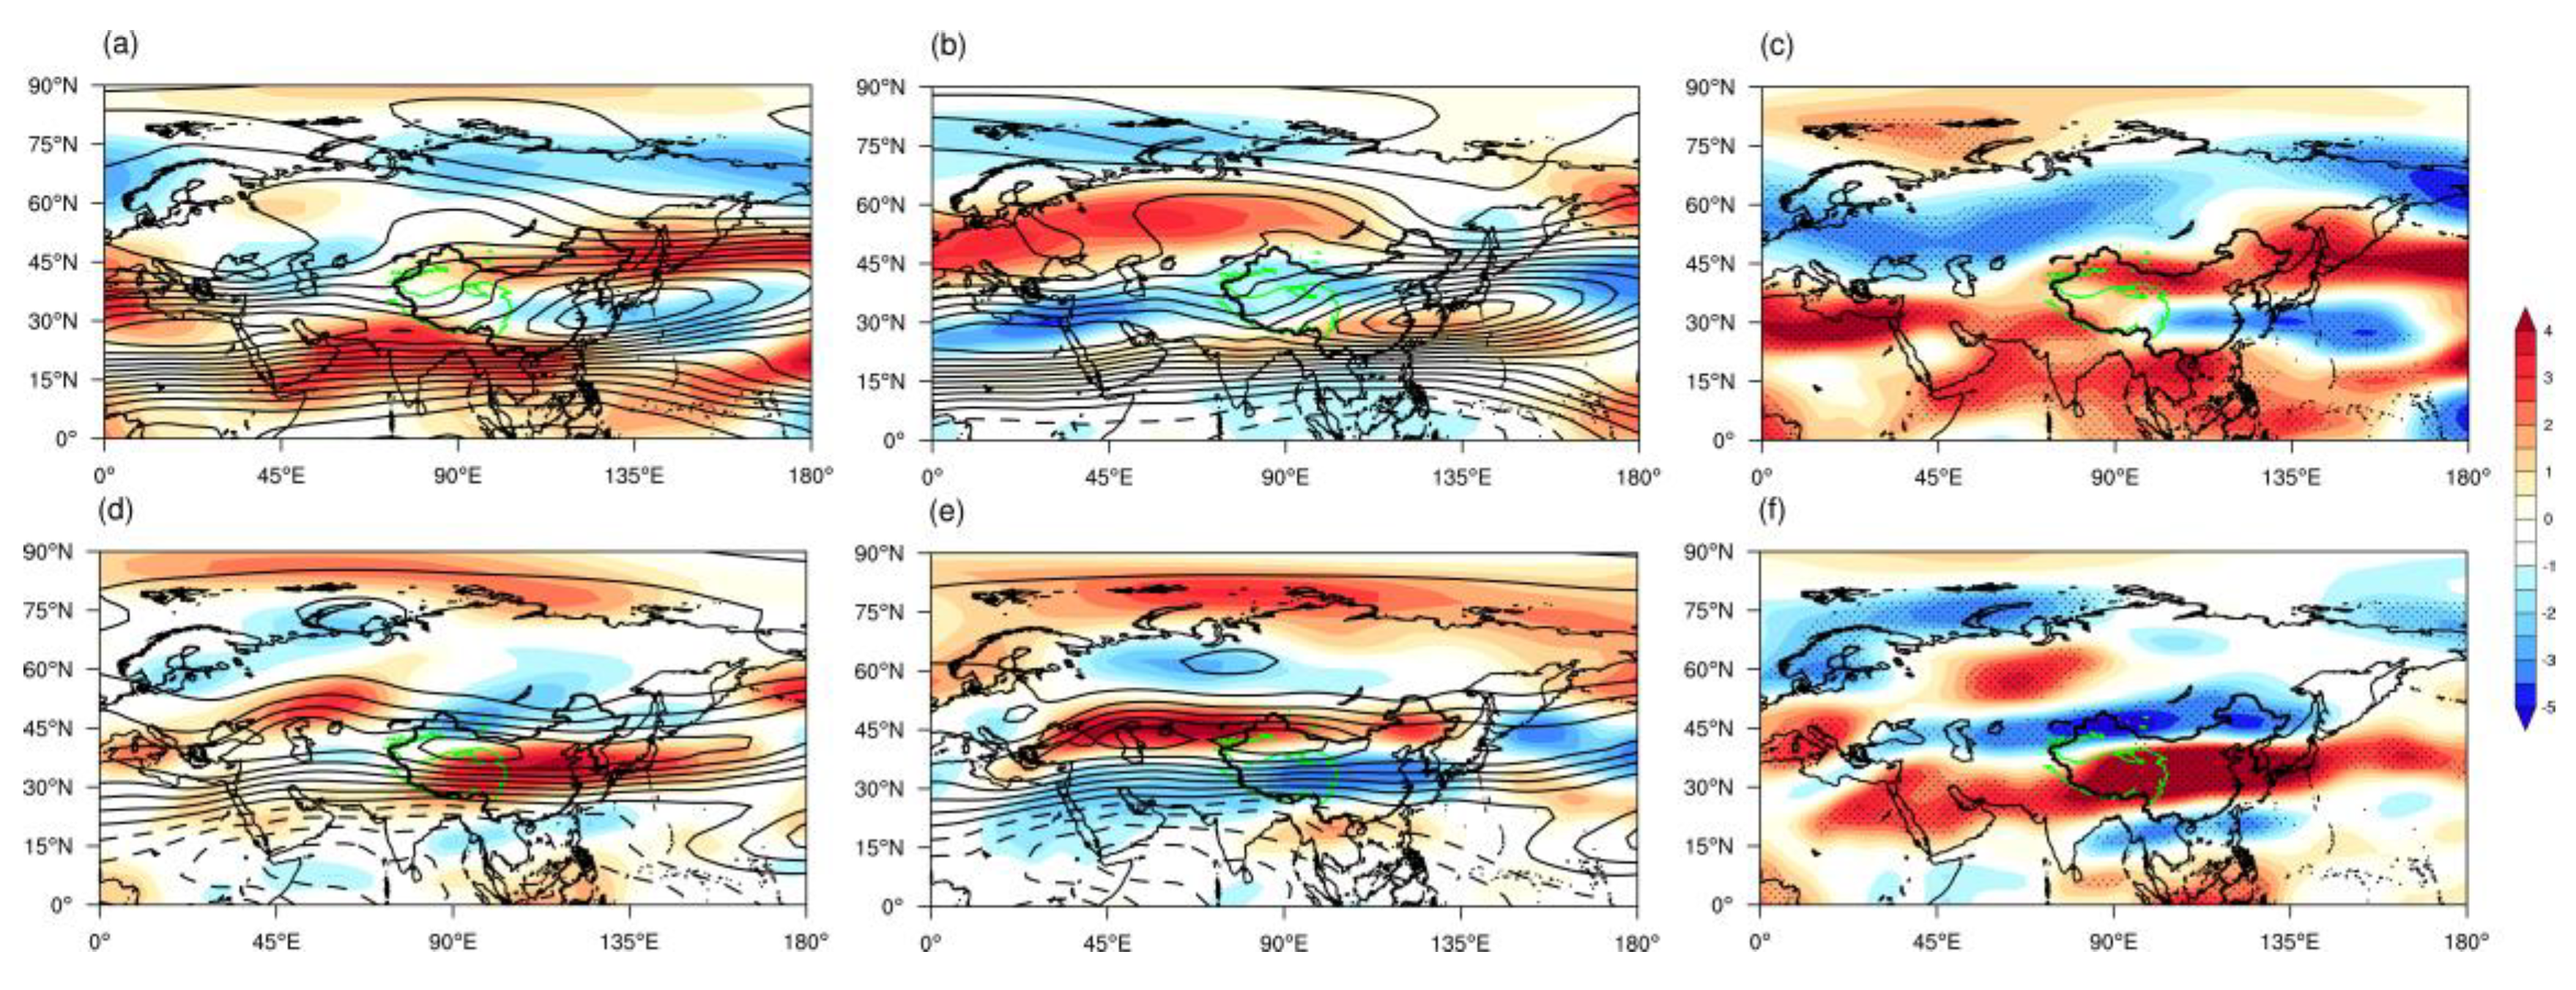
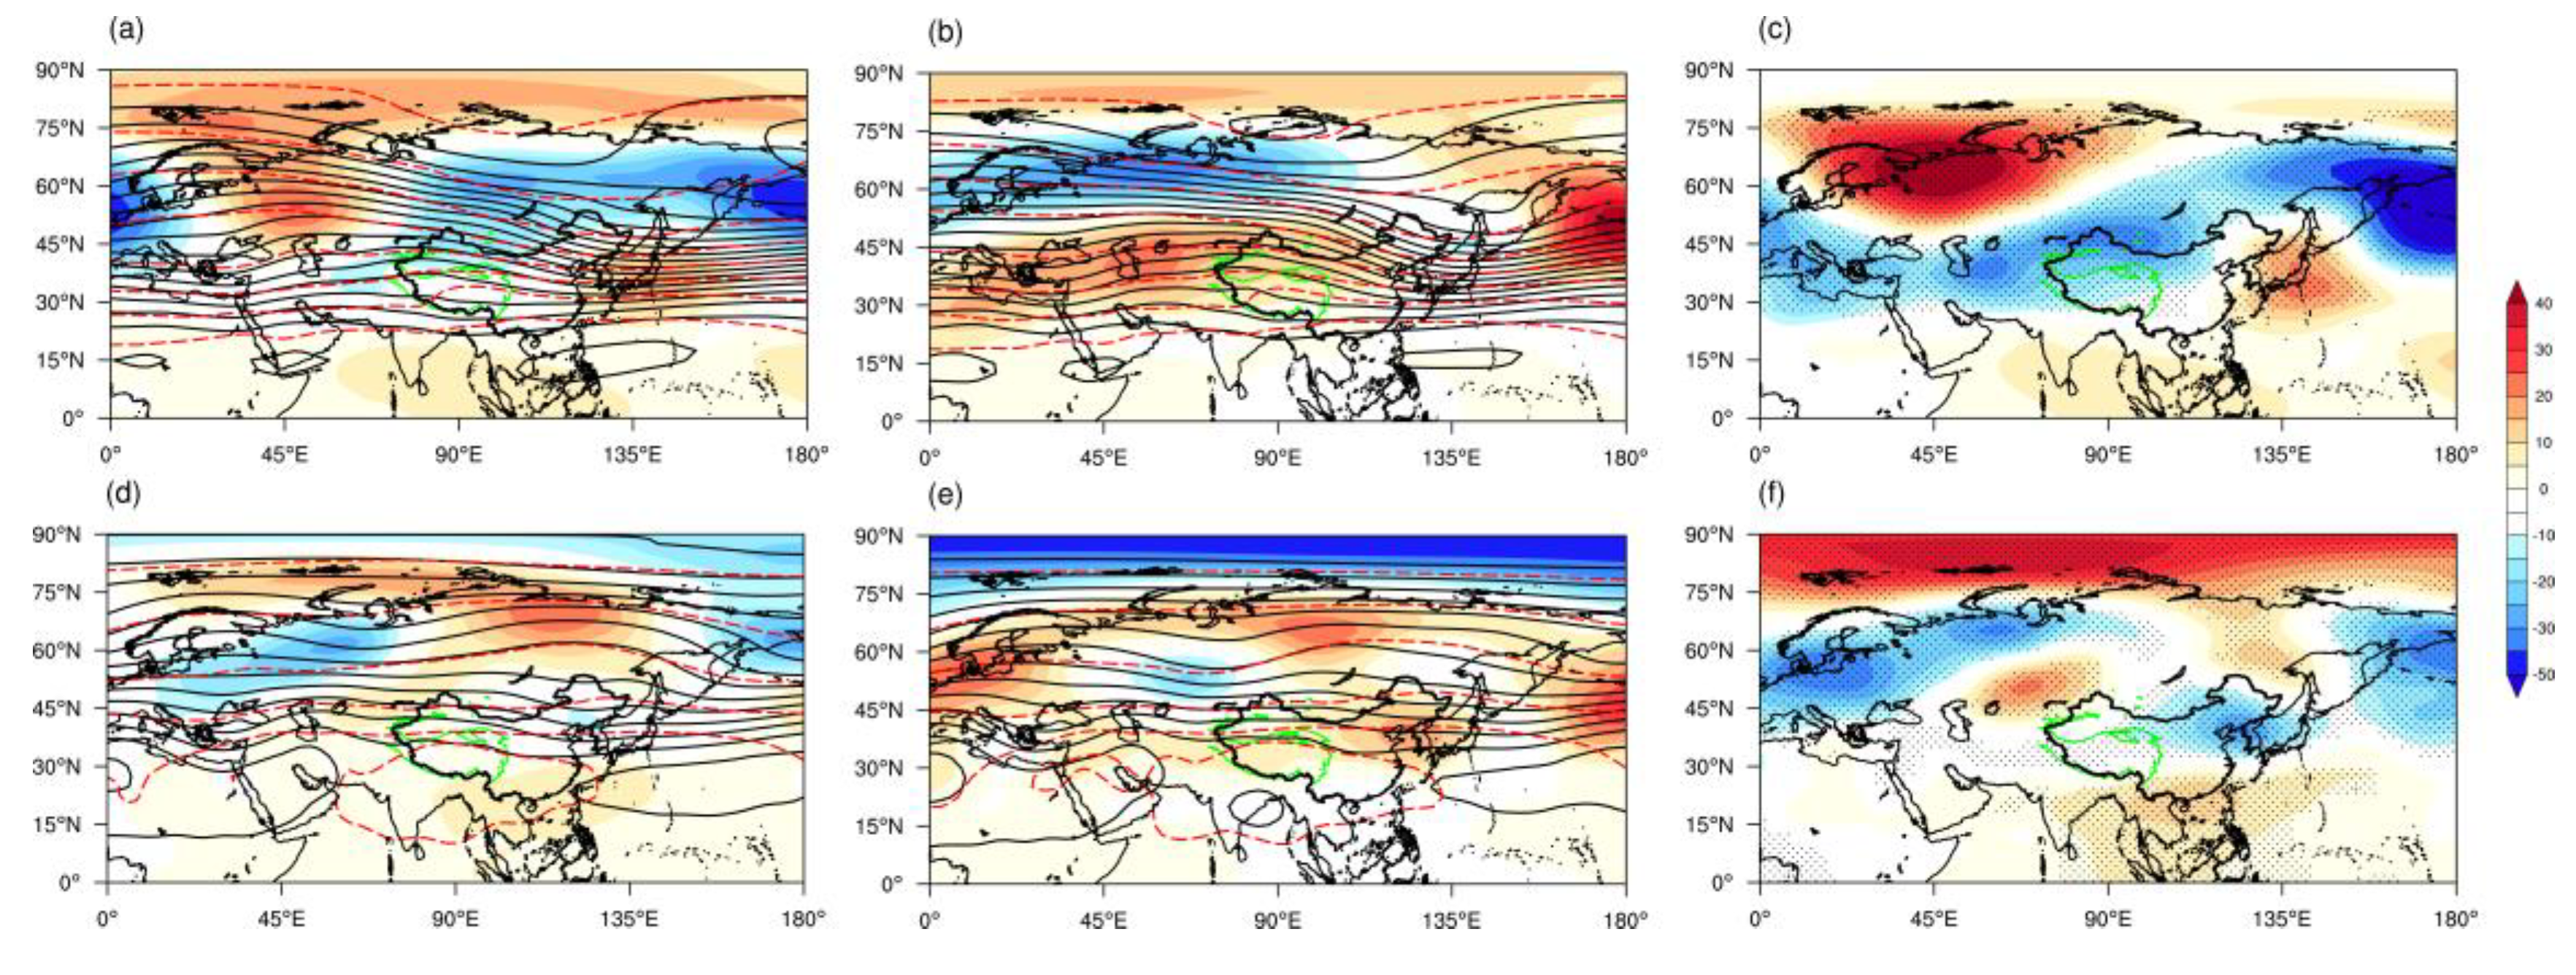
  • Spring snowmelt had a significant impact on soil moisture, and soil moisture anomalies that were related to snowmelt anomalies could persist from spring to summer, leading to anomalies in surface diabatic heating. Specifically, a large spring snowmelt over the TP could lead to weaker easterly and westerly winds at the north and south sides of the TP, respectively. Additionally, the subtropical westerly jet streams at 200hPa became weaker and their positions shifted southward. Correspondingly, the enhancement of the ridge over the Xinjiang ridge and southern trough transported water vapor to NWC, thus causing excessive summer precipitation in that region.
The roles of TP snow cover and snow depth in regional climate systems and their impacts subsequent climate are not yet fully understood. Albedo effects (snow cover fraction changes ground albedo) [5,6,11] and hydrological effects (snowmelt changes soil moisture) [21,22] are two aspects of the impact of snow anomalies on climate. Meanwhile, the persistence of snow cover/depth anomalies is mainly represented by the contribution of snowmelt to soil moisture (i.e., the hydrological effects). It is necessary to discuss the differences between the impacts of TP spring snow cover fraction, snow depth and snowmelt on precipitation in NWC because the impacts of these factors on temperature, precipitation, soil humidity, diabatic heating, etc., are different. This work provides evidence for the close relationship between variations in TP spring snowmelt and precipitation patterns in NWC; however, this does not logically mean that anomalous precipitation patterns in NWC are completely dominated by variations in TP spring snowmelt, but this relationship could be an indicator. Numerical experiments are needed to verify this relationship in future studies.

Author Contributions

Conceptualization, Z.W.; Methodology, Z.W.; Validation, F.Z. and J.Z.; Formal analysis, Z.W. and K.Y.; Investigation, Z.W., K.Y., F.Z. and X.S.; Resources, F.Z. and X.S.; Data curation, Z.W., J.Z. and X.S.; Writing—original draft, Z.W.; Writing—review & editing, K.Y., F.Z. and J.Z.; Visualization, Z.W.; Supervision, K.Y. and X.S.; Project administration, K.Y. and F.Z.; Funding acquisition, Z.W. and K.Y. All authors have read and agreed to the published version of the manuscript.

Funding

This research was supported by the Natural Science Foundation of China (41975111), the Second Tibetan Plateau Scientific Expedition and Research (STEP) program (2019QZKK0105), a project from the innovation team from the Institute of Arid Meteorology (GHSCXTD-2020-2) and the Natural Science Foundation of Gansu Province (20JR5RA120).

Institutional Review Board Statement

Not applicable.

Informed Consent Statement

Not applicable.

Data Availability Statement

The snow depth data were acquired from the National Qinghai Tibetan Plateau scientific data center (https://data.tpdc.ac.cn/zh-hans/, accessed on 11 April 2022). The precipitation and temperature data were acquired from National Meteorological Science Data Center (https://data.cma.cn/data, accessed on 12 April 2022) and the Climatic Research Unit (https://lr1.uea.ac.uk/cru/data/, accessed on 20 June 2022). The soil moisture data were acquired from the European Center for Medium-Range Weather Forecasting (ECMWF) (https://www.ecmwf.int/, accessed on 20 June 2022).

Acknowledgments

We would like to acknowledge the National Qinghai Tibetan Plateau scientific data center, the Climatic Research Unit (CRU), the National Meteorological Science Data Center and the European Center for Medium-Range Weather Forecasting (ECMWF) for providing data for this paper. We are also grateful to the reviewers and editor for their insightful comments.

Conflicts of Interest

The authors declare no conflict of interest.

References

  1. Barnett, T.P.; Dümenil, L.; Schlese, U.; Roeckner, E. The effect of Eurasian snow cover on global climate. Science 1988, 239, 504–507. [Google Scholar] [CrossRef] [PubMed]
  2. Cohen, J.; Rind, D. The effect of snow cover on the climate. J. Clim. 1991, 4, 689–706. [Google Scholar] [CrossRef]
  3. Yasunari, T.; Kitoh, A.; Tokioka, T. Local and remote responses to excessive snow mass over Eurasia appearing in the northern spring and summer climate: A study with the MRI•GCM. J. Meteorol. Soc. Jpn. 1991, 69, 473–487. [Google Scholar] [CrossRef] [Green Version]
  4. Zhang, T.J. Influence of the seasonal snow cover on the ground thermal regime: An overview. Rev. Geophys. 2005, 43, RG4002. [Google Scholar] [CrossRef]
  5. Tang, Z.; Wang, J.; Li, H.; Yan, L. Spatiotemporal changes of snow cover over the Tibetan Plateau based on cloud-removed moderate resolution imaging spectroradiometer fractional snow cover product from 2001 to 2011. J. Appl. Remote Sens. 2013, 7, 2431. [Google Scholar] [CrossRef]
  6. Zhang, S.L.; Tao, S.Y. Influences of snow cover the Tibetan Plateau on Asian summer monsoon. Chin. J. Atmos. Sci. 2001, 25, 372–390. (In Chinese) [Google Scholar] [CrossRef]
  7. Zhang, Y.S.; Li, T.; Wang, B. Decadal change of the spring snow depth over the Tibetan Plateau: The associated circulation and influence on the East Asian summer monsoon. J. Clim. 2004, 17, 2780–2793. [Google Scholar] [CrossRef]
  8. Wu, B.Y.; Yang, K.; Zhang, R.H. Eurasian snow cover variability and its association with summer rainfall in China. Adv. Atmos. Sci. 2009, 26, 31–44. [Google Scholar] [CrossRef]
  9. Qiu, J. Tibetan plateau gets wired up for monsoon prediction. Nature 2014, 514, 16–17. [Google Scholar] [CrossRef] [Green Version]
  10. Pu, Z.; Xu, L.; Salomonson, V.V. MODIS/Terra observed seasonal variations of snow cover over the Tibetan Plateau. Geophys. Res. Lett. 2007, 34, L06706. [Google Scholar] [CrossRef] [Green Version]
  11. Tang, Z.; Deng, G.; Hu, G.; Zhang, H.; Pan, H.; Sang, G. Satellite observed spatiotemporal variability of snow cover and snow phenology over High Mountain Asia from 2002 to 2021. J. Hydrol. 2022, 613, 128438. [Google Scholar] [CrossRef]
  12. Deng, G.; Tang, Z.; Hu, G.; Wang, J.; Li, J. Spatiotemporal dynamics of snowline altitude and their responses to climate change in the Tianshan Mountains, Central Asia, During 2001–2019. Sustainability 2021, 13, 3992. [Google Scholar] [CrossRef]
  13. Liu, X.; Yanai, M. Influence of Eurasian spring snow cover on Asian summer rainfall. Int. J. Climatol. 2002, 22, 1075–1089. [Google Scholar] [CrossRef]
  14. Wu, T.W.; Qian, Z.A. The relation between the Tibetan winter snow and the Asian summer monsoon and rainfall: An observational investigation. J. Clim. 2003, 16, 2038–2051. [Google Scholar] [CrossRef]
  15. Zhao, P.; Zhou, Z.J.; Liu, J.P. Variability of Tibetan spring snow and its associations with the hemispheric extratropical circulation and east Asian summer monsoon rainfall: An observational investigation. J. Clim. 2007, 20, 3942–3955. [Google Scholar] [CrossRef]
  16. Wu, R.; Kirtman, B.P. Observed relationship of spring and summer East Asian rainfall with winter and spring Eurasian snow. J. Clim. 2007, 20, 1285–1304. [Google Scholar] [CrossRef]
  17. Zhang, J.; Ma, Q.R.; Chen, H.S. Increasing warm-season precipitation in Asian drylands and response to reducing spring snow cover over the Tibetan Plateau. J. Clim. 2021, 34, 3129–3144. [Google Scholar] [CrossRef]
  18. Wu, Z.W.; Li, J.P.; Jiang, Z.H.; Ma, T.T. Modulation of the Tibetan Plateau snow cover on the ENSO teleconnections: From the East Asian summer monsoon perspective. J. Clim. 2012, 25, 2481–2489. [Google Scholar] [CrossRef]
  19. Si, D.; Ding, Y.H. Decadal change in the correlation pattern between the Tibetan Plateau winter snow and the east Asian summer precipitation during 1979–2011. J. Clim. 2013, 26, 7622–7634. [Google Scholar] [CrossRef]
  20. Zhu, Y.X.; Liu, H.W.; Ding, Y.H.; Zhang, F.Y.; Li, W. Interdecadal variation of spring snow depth over the Tibetan Plateau and its influence on summer rainfall over East China in the recent 30 years. Int. J. Climatol. 2015, 35, 3654–3660. [Google Scholar] [CrossRef]
  21. Senan, R.; Orsolini, Y.J.; Weisheimer, A.; Vitart, F.; Balsam, G.; Stockdale, T.N.; Dutra, E.; Francisco, J.; Basang, D. Impact of springtime Himalayan-Tibetan Plateau snowpack on the onset of the Indian summer monsoon in coupled seasonal forecasts. Climate. Dyn. 2016, 47, 2709–2725. [Google Scholar] [CrossRef] [Green Version]
  22. Xiao, Z.X.; Duan, A.M. Impacts of Tibetan Plateau snowcover on the interannual variability of the East Asian summer monsoon. J. Clim. 2016, 29, 8495–8514. [Google Scholar] [CrossRef]
  23. Wang, C.H.; Yang, K.; Li, Y.L.; Wu, D.; Bo, Y. Impacts of spatiotemporal anomalies of Tibetan Plateau snow cover on summer precipitation in Eastern China. J. Clim. 2017, 30, 885–903. [Google Scholar] [CrossRef]
  24. Wang, Z.; Wu, R.; Zhao, P.; Yao, S.-L.; Jia, X. Formation of snow cover anomalies over the Tibetan Plateau in cold seasons. J. Geophys. Res. Atmos. 2019, 124, 4873–4890. [Google Scholar] [CrossRef]
  25. Yuan, C.; Li, W.; Guan, Z.; Yamagata, T. Impacts of April snow cover extent over Tibetan Plateau and the central Eurasia on Indian Ocean dipole. Int. J. Climatol. 2019, 39, 1756–1767. [Google Scholar] [CrossRef]
  26. Mu, S.N.; Zhou, G.Q. Analyses of seasonal fresh snow extent over Northern Eurasia. Chimatic Environ. Res. 2009, 14, 491–508. (In Chinese) [Google Scholar] [CrossRef]
  27. Xiao, Z.; Duan, A.; Wang, Z. Atmospheric heat sinks over the western Tibetan Plateau associated with snow depth in late spring. Int. J. Climatol. 2019, 1–11. [Google Scholar] [CrossRef]
  28. Wu, T.W.; Qian, Z.A.; Li, P.J.; Song, M.H.; Ma, X.B. Some comparative analyses of precipitation over Northwest China drought area after the Qinghai-Xizang Plateau heavy-and light-snow years. Plateau Meteor. 1998, 17, 364–372. (In Chinese) [Google Scholar] [CrossRef]
  29. Wang, C.H.; Dong, A.X.; Wang, S.G.; Yang, D.B. The correlation between precipitation in Northwest China during spring and snow depth in the Tibetan Plateau. J. Glaciol. Geocryol. 2000, 22, 340–346. (In Chinese) [Google Scholar] [CrossRef]
  30. Wang, Z.L.; Li, Y.H.; Wang, J.S.; Chen, L.Y. Relationship between abnormal snow depth in winter and spring in Tibetan Plateau and spring-summer precipitation in Northwest China based on SVD analysis. J. Arid Meteor. 2015, 33, 363–370. (In Chinese) [Google Scholar] [CrossRef]
  31. Shi, Y.F.; Shen, Y.P.; Li, D.L.; Zhang, G.W.; Ding, Y.J.; Hu, R.J.; Kang, E.S. Discussion on the present climate change from warm-dry to warm-wet in Northwest China. Quat. Sci. 2003, 23, 152–164. (In Chinese) [Google Scholar] [CrossRef]
  32. Sui, Y.; Jiang, D.B.; Tian, Z.P. Latest update of the climatology and changes in the seasonal distribution of precipitation over China. Theor. Appl. Climatol. 2013, 113, 599–610. [Google Scholar] [CrossRef]
  33. Xu, D.; Li, R.L.; Wang, C.H. Characteristics of precipitation changes and relationships with water vapor transport in typical arid regions of Asia and Africa under global warming. Climatic Environ. Res. 2016, 21, 737–748. (In Chinese) [Google Scholar] [CrossRef]
  34. Li, J.M.; Wang, C.H. An evaporation correction approach and its characteristics. J. Hydrol. 2020, 21, 519–532. [Google Scholar] [CrossRef]
  35. Li, R.L.; Wang, C.H. Precipitation recycling using a new evapotranspiration estimator for Asian-African arid regions. Theor. Appl. Climatol. 2020, 140, 1–3. [Google Scholar] [CrossRef]
  36. Wang, C.H.; Zhang, S.N.; Li, K.C.; Zhang, F.M.; Yang, K. Change characteristics of precipitation in Northwest China from 1961 to 2018. Chin. J. Atmos. Sci. 2021, 45, 713–724. (In Chinese) [Google Scholar] [CrossRef]
  37. Wang, Q.; Zhai, P.M.; Qin, D.H. New perspectives on ‘warming-wetting’ trend in Xinjiang, China. Adv. Clim. Chang. Res. 2020, 11, 252–260. [Google Scholar] [CrossRef]
  38. Zhang, J.; Liu, C.; Chen, H. The modulation of Tibetan Plateau heating on the multi-scale northernmost margin activity of East Asia summer monsoon in northern China. Global. Planet. Chang. 2018, 161, 149–161. [Google Scholar] [CrossRef]
  39. Che, T.; Li, X.; Jin, R.; Armstrong, R.; Zhang, T. Snow depth derived from passive microwave remote-sensing data in China. Ann. Glaciol. 2008, 49, 145–154. [Google Scholar] [CrossRef] [Green Version]
  40. Ding, Y.G.; Jiang, Z.H. Generality of singular value decomposition in diagnostic analysis of meteorological field. Acta. Meteorol. Sin. 1996, 54, 365–372. (In Chinese) [Google Scholar] [CrossRef]
  41. Wang, C.H.; Wang, Z.L.; Cui, Y. Snow cover of China during the last 40 years: Spatial distribution and interannual variation. J. Glaciol. Geocryol. 2009, 31, 301–310. Available online: http://ir.casnw.net/handle/362004/20228 (accessed on 7 July 2020). (In Chinese).
  42. Li, X.L.; Zhang, F.M.; Wan, C.H. Comparison and analysis of snow depth over China, observed and derived from remote sensing. J. Glaciol. Geocryol. 2012, 34, 755–764. (In Chinese) [Google Scholar]
  43. Wang, T.; Li, Z.G.; LÜ, S.H.; Yao, C.; Ma, S.L. Study on the Effects of Snow Cover on Heat Transport in Land Surface Processes over Qinghai-Tibetan Plateau. Plateau Meteor. 2019, 38, 920–934. (In Chinese) [Google Scholar] [CrossRef]
  44. North, G.R.; Bell, T.L.; Cahalan, L.F.; Moeng, F.J. Sampling errors in the estimation of empirical orthogonal functions. Mon. Wea. Rev. 1982, 110, 699–706. [Google Scholar] [CrossRef]
  45. Shi, Y.F.; Shen, Y.P.; Hu, R.J. Preliminary study on signal, impact and foreground of climatic shift from warm-dry to warm-humid in Northwest China. J. Glaciol. Geocryol. 2002, 24, 219−226. (In Chinese) [Google Scholar] [CrossRef]
  46. Wang, Z.B.; Wu, R.G.; Chen, S.F.; Huang, G.; Liu, G.; Zhu, L.H. Influence of western Tibetan plateau summer snow cover on east Asian summer rainfall. J. Geophys. Res. Atmos. 2018, 123, 2371–2386. [Google Scholar] [CrossRef]
  47. Thomas, L.M. On the role of snow cover in depressing air temperature. J. Applied Meteor. Climatol. 2008, 47, 2008–2022. [Google Scholar] [CrossRef]
  48. Zhu, Y.X.; Ding, Y.H.; Xu, H.G. Decadal relationship between atmospheric heat source of winter and spring snow over Tibetan Plateau and rainfall in east China. Acta Meteor. Sin. 2008, 22, 303–316. (In Chinese) [Google Scholar] [CrossRef]
  49. Ding, Q.; Wang, B. Circumglobal teleconnection in the Northern Hemisphere summer. J. Climate. 2005, 18, 3483–3505. [Google Scholar] [CrossRef]
  50. Du, Y.; Zhang, Y.C.; Xie, Z.Q. Impacts of the zonal position of the East Asian westerly jet core on precipitation distribution during Meiyu of China. Acta Meteor. Sin. 2009, 23, 506–516. Available online: http://jmr.cmsjournal.net/en/article/id/1206?articleType=archive_en (accessed on 8 March 2020).
  51. Chen, G.; Sawada, M.; Iwasaki, T. Influence of summer monsoon diurnal cycle on moisture transport and precipitation over eastern China. J. Geophys. Res. Atmos. 2013, 118, 3163–3177. [Google Scholar] [CrossRef]
  52. Herzschuh, U. Coauthors, Position and orientation of the westerly jet determined Holocene rainfall patterns in China. Nat. Commun. 2019, 10, 2376. [Google Scholar] [CrossRef] [PubMed] [Green Version]
  53. Zhang, J.; Chen, Z.; Chen, H.; Ma, Q.; Teshome, A. North Atlantic multidecadal variability enhancing decadal extra tropical extremes in boreal late summer in the early twentyfirst century. J. Clim. 2020, 33, 6047–6064. [Google Scholar] [CrossRef] [Green Version]
  54. Chen, F.; Chen, J. A discussion on the westerly-dominated climate model in mid-latitude Asia during the modern interglacial period. Earth Sci. Front. 2012, 279–280, 86–87. [Google Scholar] [CrossRef]
  55. Bothe, O.; Fraedrich, K.; Zhu, X. Precipitation climate of Central Asia and the large-scale atmospheric circulation. Theor. Appl. Climatol. 2012, 108, 345–354. [Google Scholar] [CrossRef]
Figure 1. Annual variations in seasonal snow depth, snow accumulation and snowmelt over the TP (unit: cm).
Atmosphere 14 00466 g001
Figure 2. The spatial distributions of the eigenvectors of the first and second EOF modes of the spring snowmelt and snow depth over the TP: (a) the EOF1 spring snowmelt mode; (b) the EOF2 spring snowmelt mode; (c) the EOF1 spring snow depth mode; (d) the EOF2 spring snow depth mode.
Atmosphere 14 00466 g002
Figure 3. Principal components (PCs) of the first and second EOF modes of the spring snowmelt and snow depth over the TP.
Atmosphere 14 00466 g003
Figure 4. The spatial distributions of the correlation coefficients of the first three SVD modes of the spring snowmelt over the TP and spring precipitation in Northwest China (from 1 to 3: SVD1, SVD2 and SVD3): (a) the TP spring snowmelt field; (b) the spring precipitation field in NWC. The black spot areas passed the 95% significance test.
Atmosphere 14 00466 g004
Figure 5. The spatial distributions of the correlation coefficients of the first three SVD modes of the spring snowmelt over the TP and summer precipitation in Northwest China (from 1 to 3: SVD1, SVD2 and SVD3): (a) the TP spring snowmelt field; (b) the summer precipitation field in NWC. The black spot areas passed the 95% significance test.
Atmosphere 14 00466 g005
Figure 6. The differences in precipitation in NWC (the shadow represents the percentage of precipitation anomaly; the real (imaginary) line indicates 30% more (less) precipitation): (a) spring precipitation; (b) summer precipitation.
Atmosphere 14 00466 g006
Figure 7. The correlations between spring snowmelt and soil moisture (from left to right: soil moisture levels at depths of 0–7 cm, 7–28 cm and 28–100 cm) in the TP: (ac) the correlations between snowmelt and soil moisture; (df) the correlations between snow depth and soil moisture. The black spot areas passed the 90% significance test. Dotted line outlines the areas of the TP with an average altitude greater than 3000 m.
Atmosphere 14 00466 g007
Figure 8. The latitude–height cross-sections of composite anomalies in zonal winds (m/s), averaged over 80°–100° E, in high (left column) and low (middle column) spring snowmelt years and the differences between high and low spring snowmelt (right column): (ac) spring; (df) summer. The gray shading represents grid point values that were significant at the 90% level.
Atmosphere 14 00466 g008
Figure 9. Composite anomalies in 200 hPa zonal winds in high (left column) and low (middle column) spring snowmelt years and the differences between high and low spring snowmelt years (right column): (ac) spring; (df) summer. The markers represent grid point values that were significant at the 90% level. Green line outline the areas of the TP with an average altitude greater than 3000 m.
Atmosphere 14 00466 g009
Figure 10. Same as Figure 9 but for 500 hPa in geopotential height.
Atmosphere 14 00466 g010
Table 1. The differences in the contribution rates of the first three SVD modes between the spring snowmelt over the TP and spring precipitation in NWC.
First ModeSecond ModeThird Mode
Contribution (%)29.8513.238.17
Cumulative Contribution (%)29.8543.0851.25
Correlation Coefficient0.660.750.78
Table 2. The differences in the contribution rates of the first three SVD modes between the spring snowmelt over the TP and summer precipitation in NWC.
First ModeSecond ModeThird Mode
Contribution (%)21.0415.3410.95
Cumulative Contribution (%)21.0436.3847.33
Correlation Coefficient0.800.670.69
Disclaimer/Publisher’s Note: The statements, opinions and data contained in all publications are solely those of the individual author(s) and contributor(s) and not of MDPI and/or the editor(s). MDPI and/or the editor(s) disclaim responsibility for any injury to people or property resulting from any ideas, methods, instructions or products referred to in the content.

