Article

Fugitive Emission Characteristics of Fume and Dust from Short-Process Electric Furnace Tap Hole and Optimization of Dust Hood

School of Civil and Resource Engineering, University of Science and Technology Beijing, Beijing 100083, China
*
Author to whom correspondence should be addressed.
Atmosphere 2023, 14(12), 1829; https://doi.org/10.3390/atmos14121829
Submission received: 7 November 2023 / Revised: 5 December 2023 / Accepted: 7 December 2023 / Published: 15 December 2023
(This article belongs to the Special Issue Contributions of Emission Inventory to Air Quality)

Abstract

:
Due to the advantages of a short cycle, low investment and low energy consumption per ton of steel, short-process electric furnace steelmaking is about to welcome a golden period of rapid development in China. During the operation of the electric furnace, a large amount of smoke and dust is generated. Most studies focus on organized emissions, and the impact of unorganized emissions in workshops on the environment cannot be ignored. This paper evaluates the thermal environment in the electric furnace steelmaking workshop based on the analytic hierarchy process and obtains the influence weight of the fugitive emission location. The mass concentration of dust at each measuring point increased by 1.17 mg/m3 on average, and the concentration of unorganized emission dust near the outlet was 23.572 mg/m3. The numerical simulation calculation model is established by the CFD method, a fixed initial jet velocity is set, the initial velocity of the ladle soot plume is changed, and the inclination angle, arrangement height and dust removal air volume of the dust hood are respectively adjusted in different tapping periods. The impact of simulation on the efficiency of dust collection for different dust removal hood configurations was investigated, considering variations in inclination angle, arrangement height and dust removal airflow. The optimal structural parameters for the dust removal hood were determined to be an inclination angle of 60° and an arrangement height of 2.4 m, and an optimal dust removal airflow was determined to be 110,000 m3/h. This study provides a theoretical foundation for engineering practice.

1. Introduction

In recent years, the amount of scrap steel has continued to increase, and the rapid development of renewable energy has gradually alleviated the lack of power resources. Due to the advantages of short cycle, low investment and low energy consumption per ton of steel, short-process electric furnace steelmaking is about to usher in a golden period of rapid development in China [1,2,3,4,5]. During the operation of the electric furnace, a large amount of smoke and dust is generated, which affects the environment in the workshop. The existing workshop mainly adopts the combination of the fourth hole in the furnace and the dust-collecting hood to control flue dust [6,7], which has achieved good results. However, there is still a small amount of fume and dust fugitive emissions escaping into the air, endangering the health of front-line workers. The tapping hole of the electric furnace is the main source of unorganized emission of smoke and dust in the electric furnace workshop. Therefore, solving the problem of fugitive emission of smoke and dust from the tapping hole of the electric furnace is the focus of pollution control of short-process electric furnace steelmaking.
When the electric furnace is tapping, due to the excessive pressure in the electric furnace, a large amount of high-temperature dust-laden flue gas is sprayed outward to form a high-temperature jet. The molten steel falls and collides with the ladle wall, instantly emitting a large amount of high-temperature dust-laden flue gas, which continuously exchanges heat with the surrounding air to generate a density difference. Therefore, buoyancy is generated to make the dust-laden flue gas move upward, forming a buoyant plume [8,9,10,11,12,13]. The flue dust at the steel outlet moves under the combined action of the jet and the plume and escapes into the air. At present, semi-closed hoods and closed hoods are mostly used to control the fugitive emission of fume and dust [14], but this method cannot be used during tapping. According to the actual layout structure in the workshop, a dust removal system with a low-hanging umbrella-shaped dust hood is installed above the ladle to control the fugitive emission of smoke and dust at the tapping port. The structure of the dust hood and the dust removal air volume will directly affect the smoke and dust collection efficiency [15,16,17].
Due to the special properties of electric furnace steelmaking, it is difficult to directly conduct experimental research around the electric furnace. Therefore, the determination of the process parameters of the dust hood and the dust removal air volume mainly refers to previous design experience, which often affects the dust removal effect or causes energy waste due to unreasonable parameter design. Consequently, it is necessary to use numerical simulation methods for research. Griffiths W. et al. [18] used Fluent software to simulate the flow field of the cyclone dust collector. Comparison with the empirical model shows that the Fluent software can accurately describe the distribution characteristics of the flow field, the pressure loss and the movement trajectory of the dust. Aroussi A. et al. [19] simulated and analyzed the movement of dust particles in a single filter cartridge and compared it with the actual experimental process to prove that the movement trajectories of dust particles obtained by numerical simulation are very similar to the experimental results. Therefore, the numerical simulation method can accurately describe the flow field distribution and the movement trajectory of the particles in the dust removal process.
Regarding the electric furnace steelmaking workshop, existing research mostly focuses on organized emissions, and the impact of unorganized emissions on workers in the workshop also needs to be addressed. This paper adopts the Analytic Hierarchy Process (AHP) to quantitatively analyze the most severe unorganized emissions in the electric furnace workshop through a combination of subjective and objective methods. Through on-site testing, further verification is carried out. Finally, numerical simulation is used to propose and optimize the control of smoke and dust at the steel outlet. By setting a fixed initial jet soot velocity and changing the initial velocity of ladle plume soot, combined with the comparison of the dust hood’s control of smoke and dust during the whole tapping period, the optimal structural parameters of the dust hood and the optimal dust removal air volume are obtained. This study provides a basis for solving the problem of unorganized emissions in the electric furnace workshop and guiding engineering practice.

2. The Weight Analysis of the Influence of Fugitive Emission Location on Workshop Environment

2.1. Selection of Comprehensive Evaluation Methods

Comprehensive evaluation is when a complex system is affected by multiple factors at the same time, the system is evaluated according to multiple relevant indicators, and multiple indicators are evaluated simultaneously through some special methods and weighted according to the importance of the indicators to make the evaluation results more scientific, comprehensive and systematic; this is now widely used in practice. At present, the commonly used methods for determining comprehensive weights mainly include the scoring method [20], the comprehensive index method [21], the rank sum ratio method [22], the Topsis method [23], the analytic hierarchy process method [24] and the fuzzy analysis method [25]. The results obtained by the comprehensive evaluation methods are not exactly the same, and each method has its own scope of application. A comprehensive comparison of the above methods is shown in Table 1; the appropriate evaluation method should be selected according to the content to be evaluated.
This section evaluates the thermal environment of the workshop through the thermal comfort of the workshop workers in this environment and judges according to the subjective feelings of the workers. Therefore, the analytic hierarchy process is selected as the theoretical basis for evaluating the impact of fugitive emission processes at different locations on the environment in the electric furnace workshop, and the evaluation index system and the analytic hierarchy process model are established to convert human ideas into numbers for quantitative analysis, reduce the deviation of subjective weights and provide new ideas for analyzing such problems.

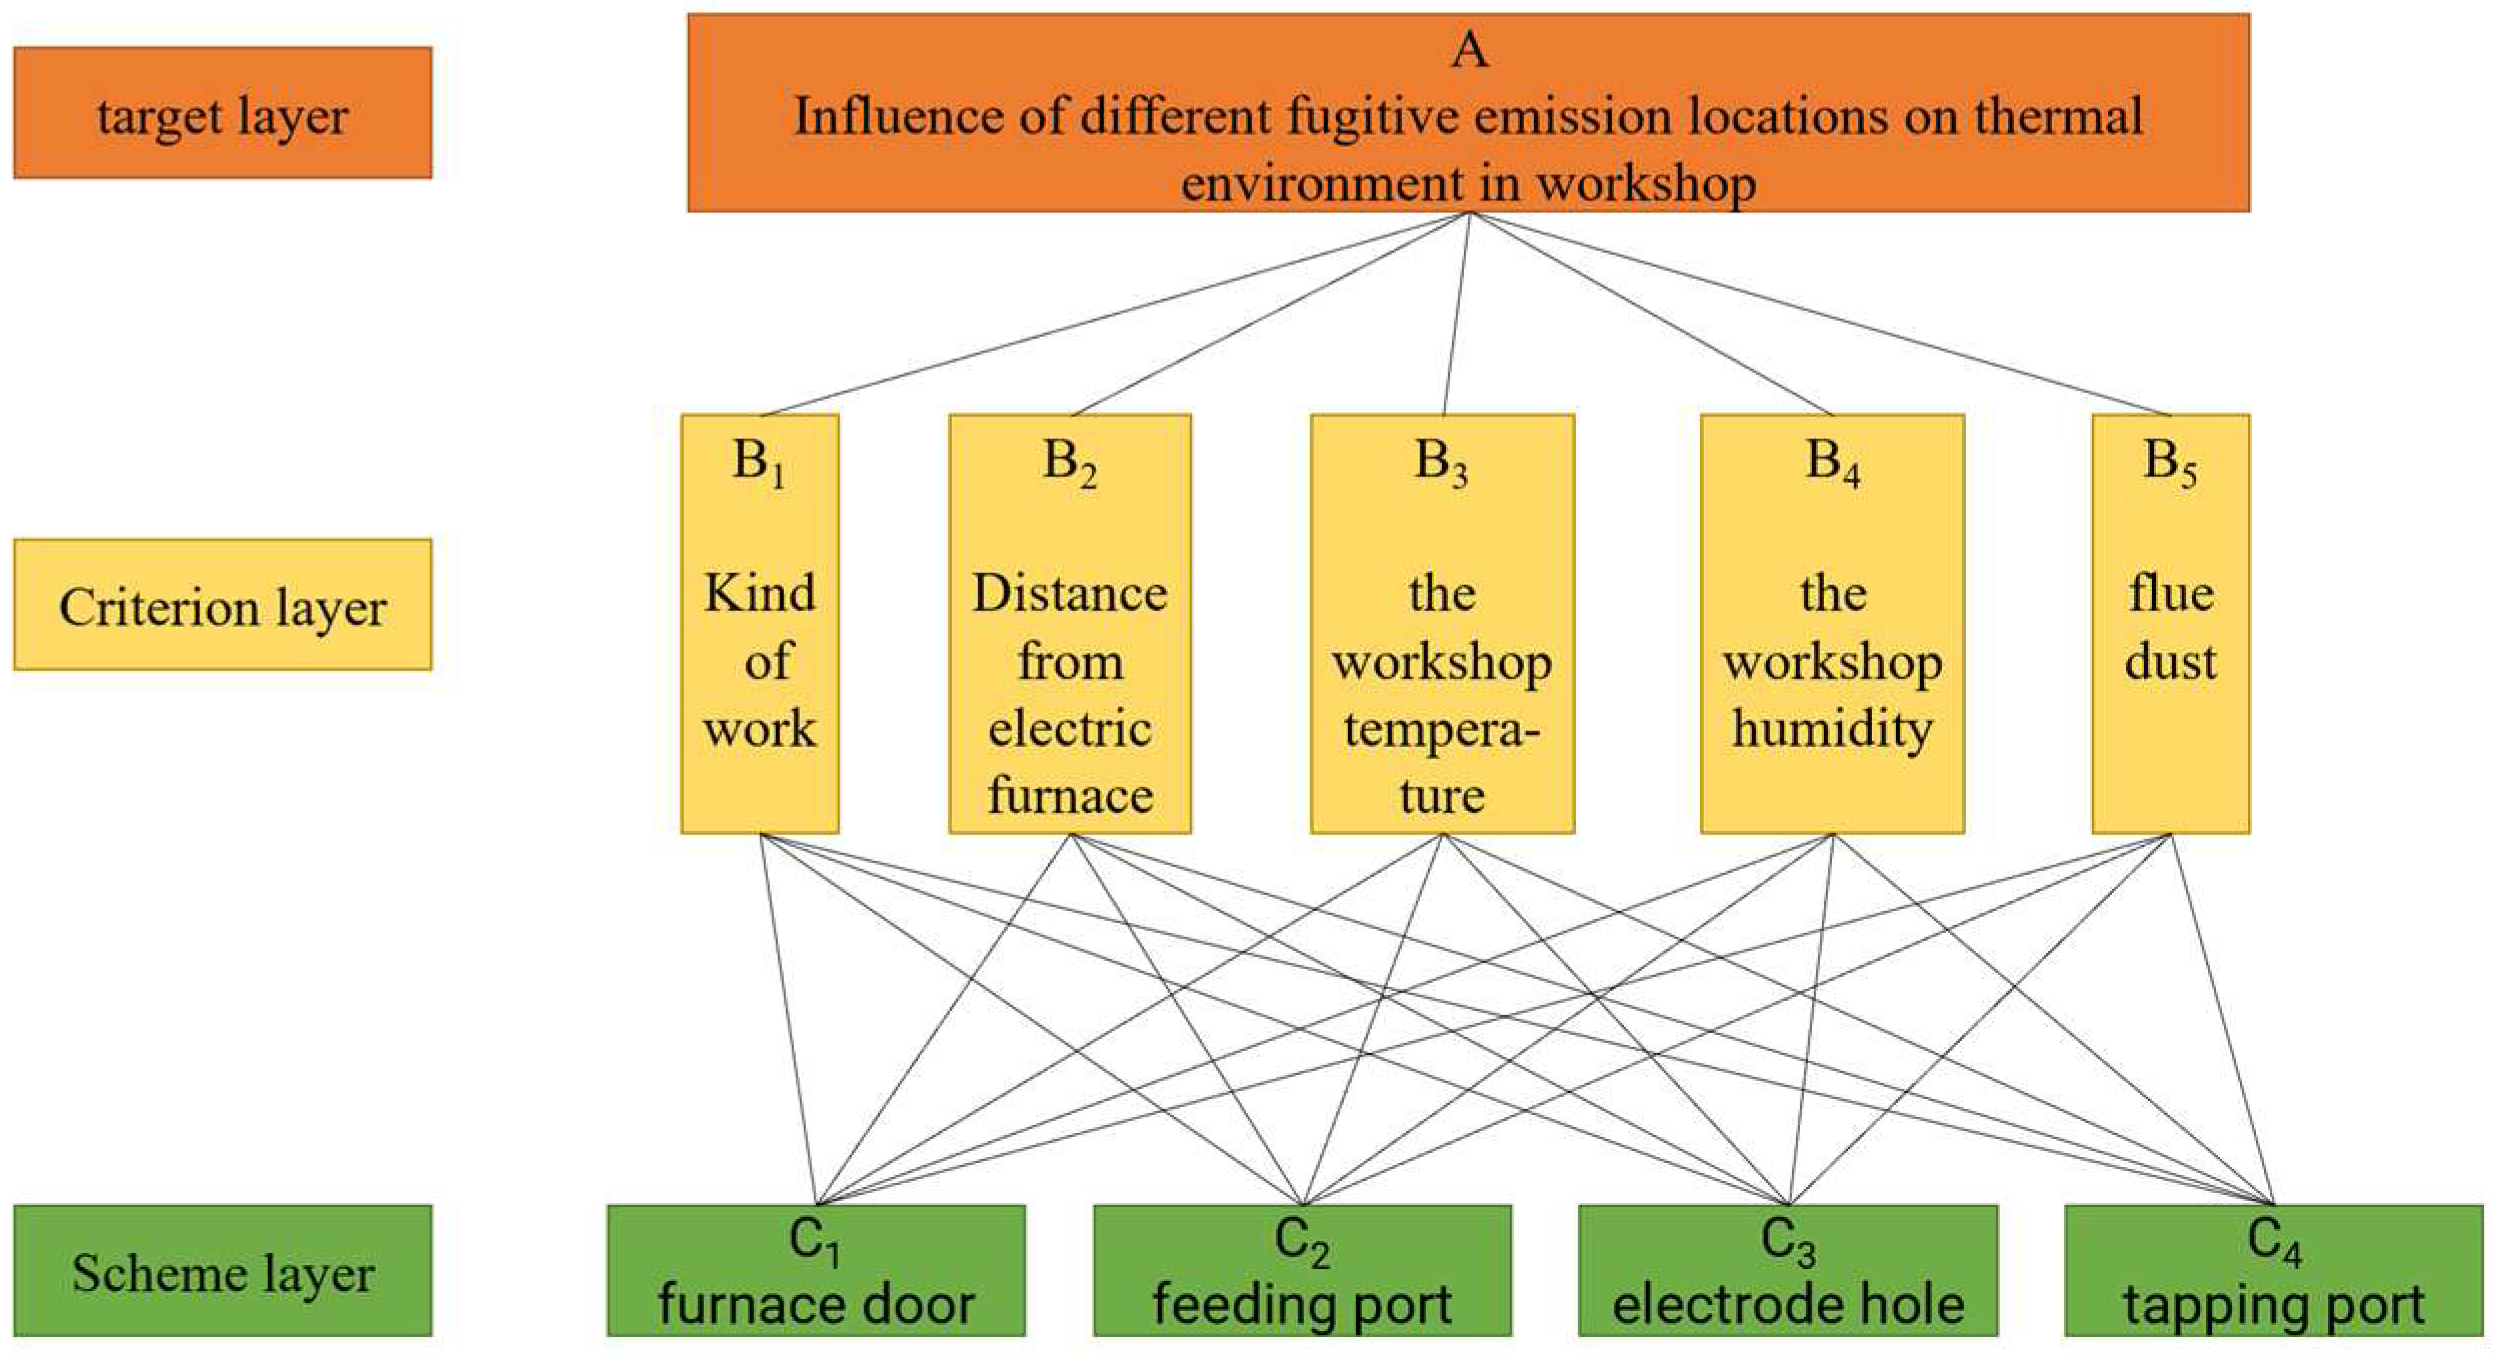
2.2. Build Analytic Hierarchy Model

The evaluation index system is constructed by using the analytic hierarchy process (AHP) for the fugitive emission location of the electric furnace that has the greatest impact on the environment in the workshop, which is divided into three layers: target layer, criterion layer and scheme layer. The target layer is the influence of different fugitive emission locations on the thermal environment in the workshop, the criterion layer is the influencing factors of the thermal environment in the electric furnace steelmaking workshop, and the scheme layer is four different fugitive emission locations. From the subjective point of view of people, thermal comfort is often used to evaluate the thermal environment in which people live, and the PMV-PPD index (Average Evaluation of Comprehensive Prediction for Judging Thermal Comfort—Comprehensive Application Index of Predicted Dissatisfaction Percentage, Predicted Mean Vote-Predicted Percentage Dissatisfied) is generally used to evaluate the thermal environment satisfaction degree in the space where people live [26]. The influencing factors of environmental thermal comfort in the electric furnace workshop are the type of work, the distance from the electric furnace, the workshop temperature, the workshop humidity and the smoke and dust in the workshop. These five influencing factors constitute the criterion layer. The four unorganized discharge positions of the furnace door, feeding port, electrode hole and electric furnace form the scheme layer. The specific hierarchical structure model is shown in Figure 1.

2.3. Hierarchical Total Ordering and Consistency Check

The total ranking of the hierarchy is to calculate the weight value of the relative importance of the target layer in the plan layer, which is carried out in sequence from the high level to the low level. Each scheme obtains the relative weight of the target layer for different influencing factors and, finally, obtains the overall optimality ranking of the scheme layer [27,28].
Firstly, the hierarchical total ranking of different fugitive emission locations is carried out, and the overall goodness comparison and consistency test are carried out. The results are shown in Table 2, and the matrix C is shown in Equation (1).
C = 0.099 0.90 0.084 0.11 0.11 0.26 0.30 0.34 0.31 0.24 0.11 0.098 0.11 0.12 0.12 0.54 0.51 0.47 0.46 0.53
The consistency ratio CR = 0.029 < 0.1, the result is reliable within the tolerance range of the degree of inconsistency, and it passes the one-time test. Therefore, the relative importance weight W(1) of each influencing factor evaluation index in the criterion layer can be multiplied by the relative weights of different positions in the scheme layer to obtain the comprehensive weight of different fugitive emission positions. The specific calculation steps are shown in Equation (2).
C × W ( 1 ) = 0.099 0.90 0.084 0.11 0.11 0.26 0.30 0.34 0.31 0.24 0.11 0.098 0.11 0.12 0.12 0.54 0.51 0.47 0.46 0.53 × 0.046 0.078 0.25 0.22 0.41 = 0.17 0.29 0.12 0.50
According to the calculated results, the comprehensive weights of the four fugitive emission positions of the furnace door, feeding port, electrode hole and tapping port of the electric furnace are 0.102, 0.285, 0.114 and 0.498, respectively. The weight of the influence of different fugitive emission locations on the thermal environment in the workshop is from largest to smallest: the tapping port, the feeding port, the electrode hole and the furnace door. Among them, the position of the feeding port and the steel outlet account for a relatively large weight, and the sum of the two weights can reach 0.783. Therefore, in the following research, the positions of the feeding port and the tapping port were selected, and the temperature, relative humidity and soot concentration at each measuring point were actually tested during feeding and tapping, respectively.

3. Field Test

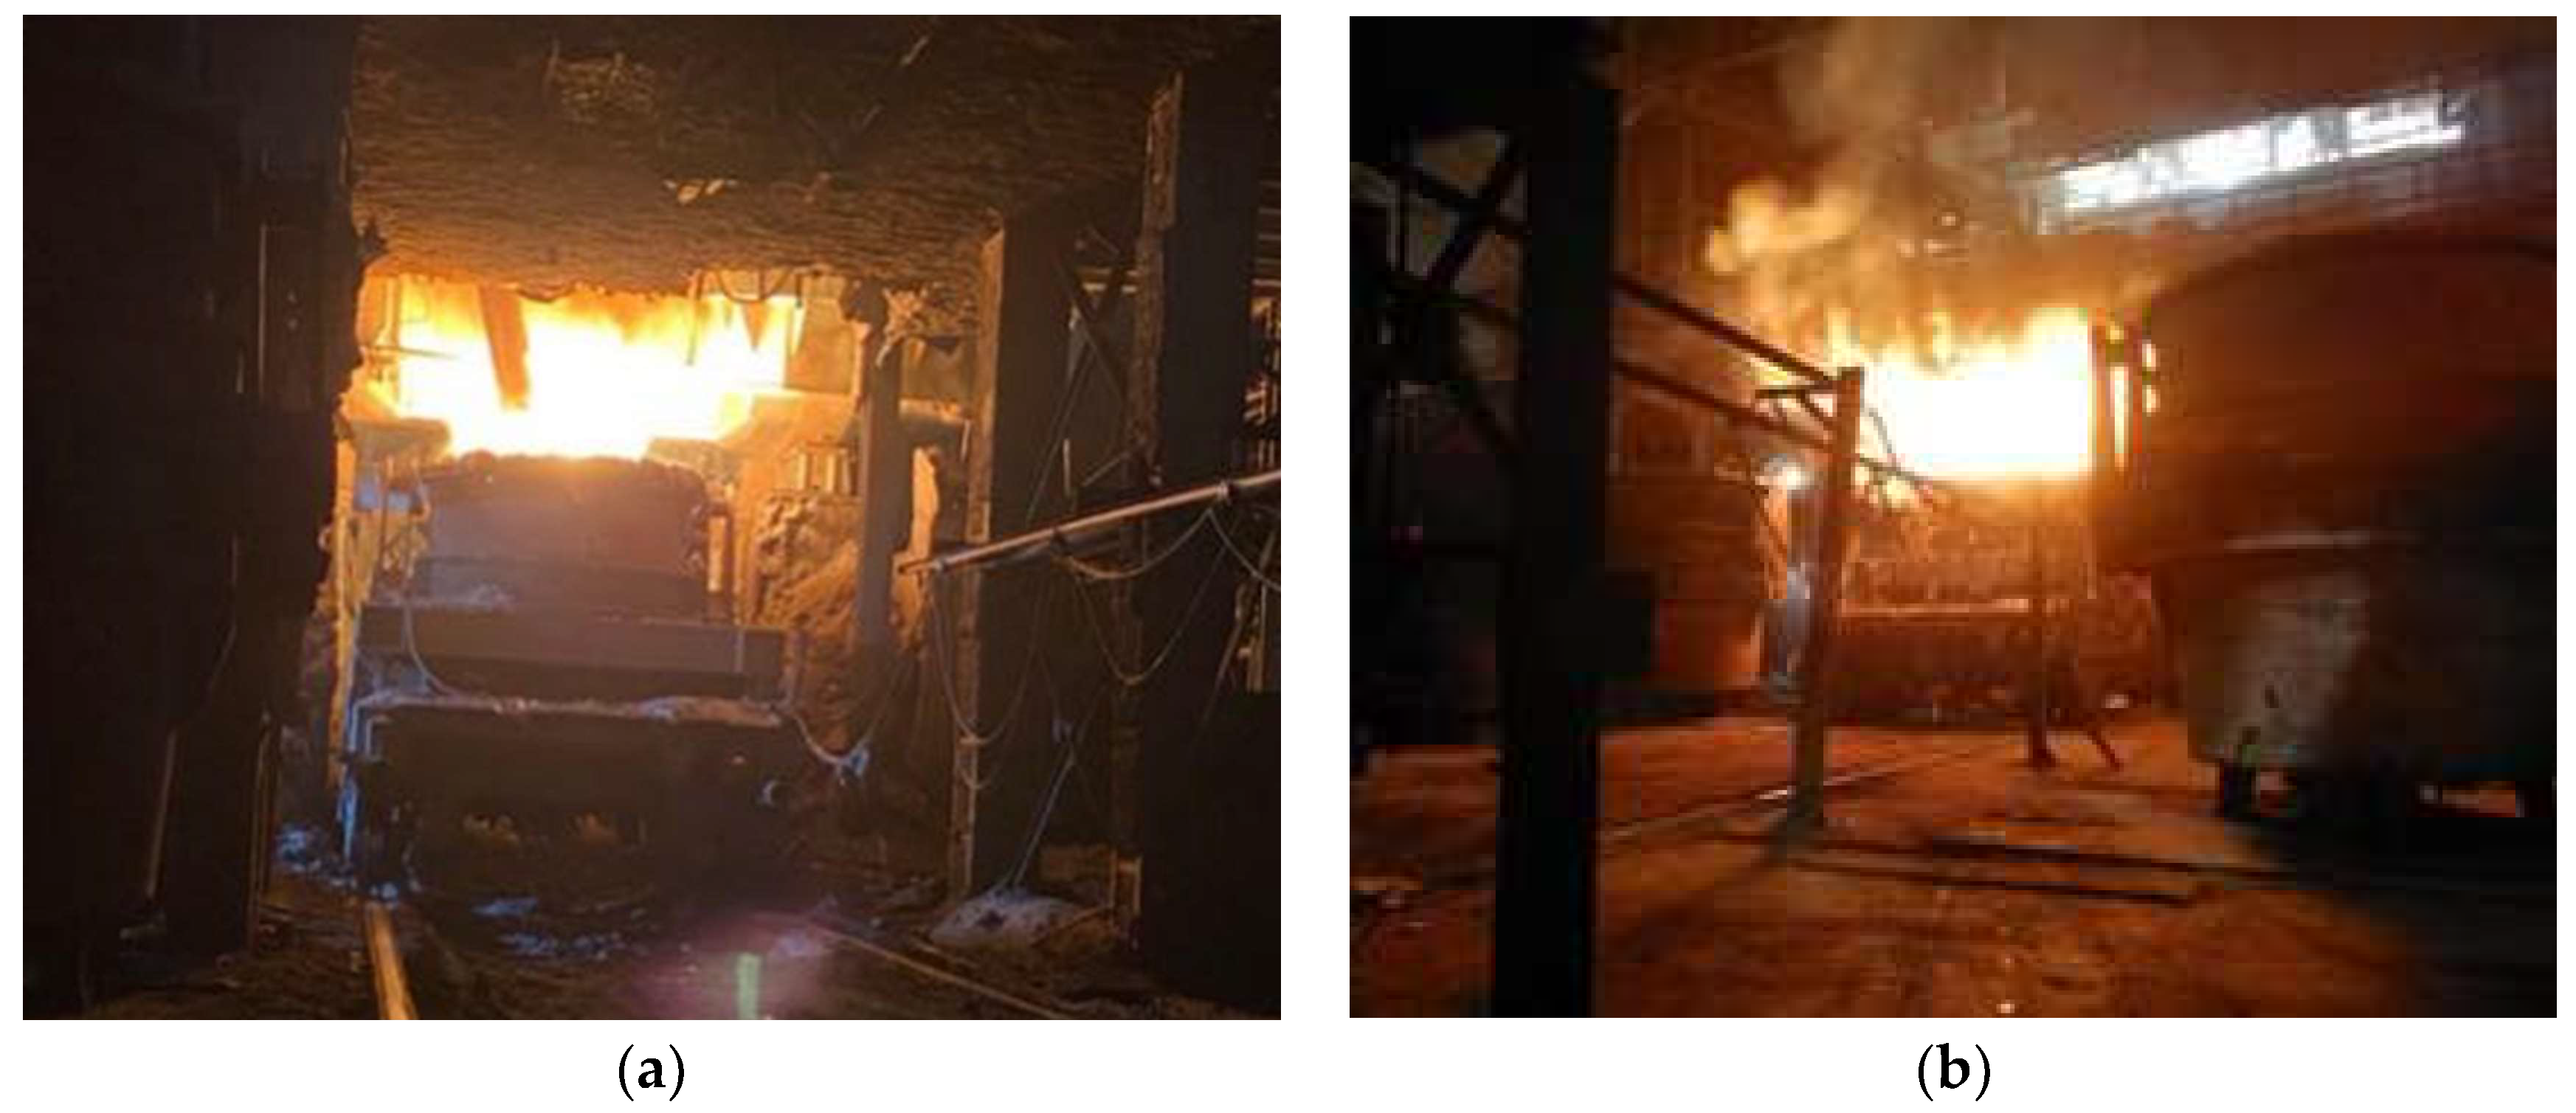
3.1. Test Workshop Status

The actual measurement location is a closed 100 t electric furnace steelmaking workshop of an iron and steel enterprise in Henan Province. The scene situation during the tapping period is shown in Figure 2. The workshop uses the fourth hole in the furnace to exhaust smoke and the roof dust hood to control the smoke and dust generated during the smelting of the electric furnace. However, during the tapping process, there is still a large amount of paroxysmal soot escaping from the area of the dust hood above the electric furnace.

3.2. Test Content and Method

The tapping hole is the main fugitive emission source of the smoke and dust in the electric furnace workshop. The test content is the change in the total suspended particulate matter concentration during the electric furnace tapping period compared with the smelting period. The filter membrane gravimetric method [29,30,31,32] was used, and the dust in the workshop was sampled and weighed using an ultra-fine glass fiber filter membrane to calculate the mass concentration of particulate matter.

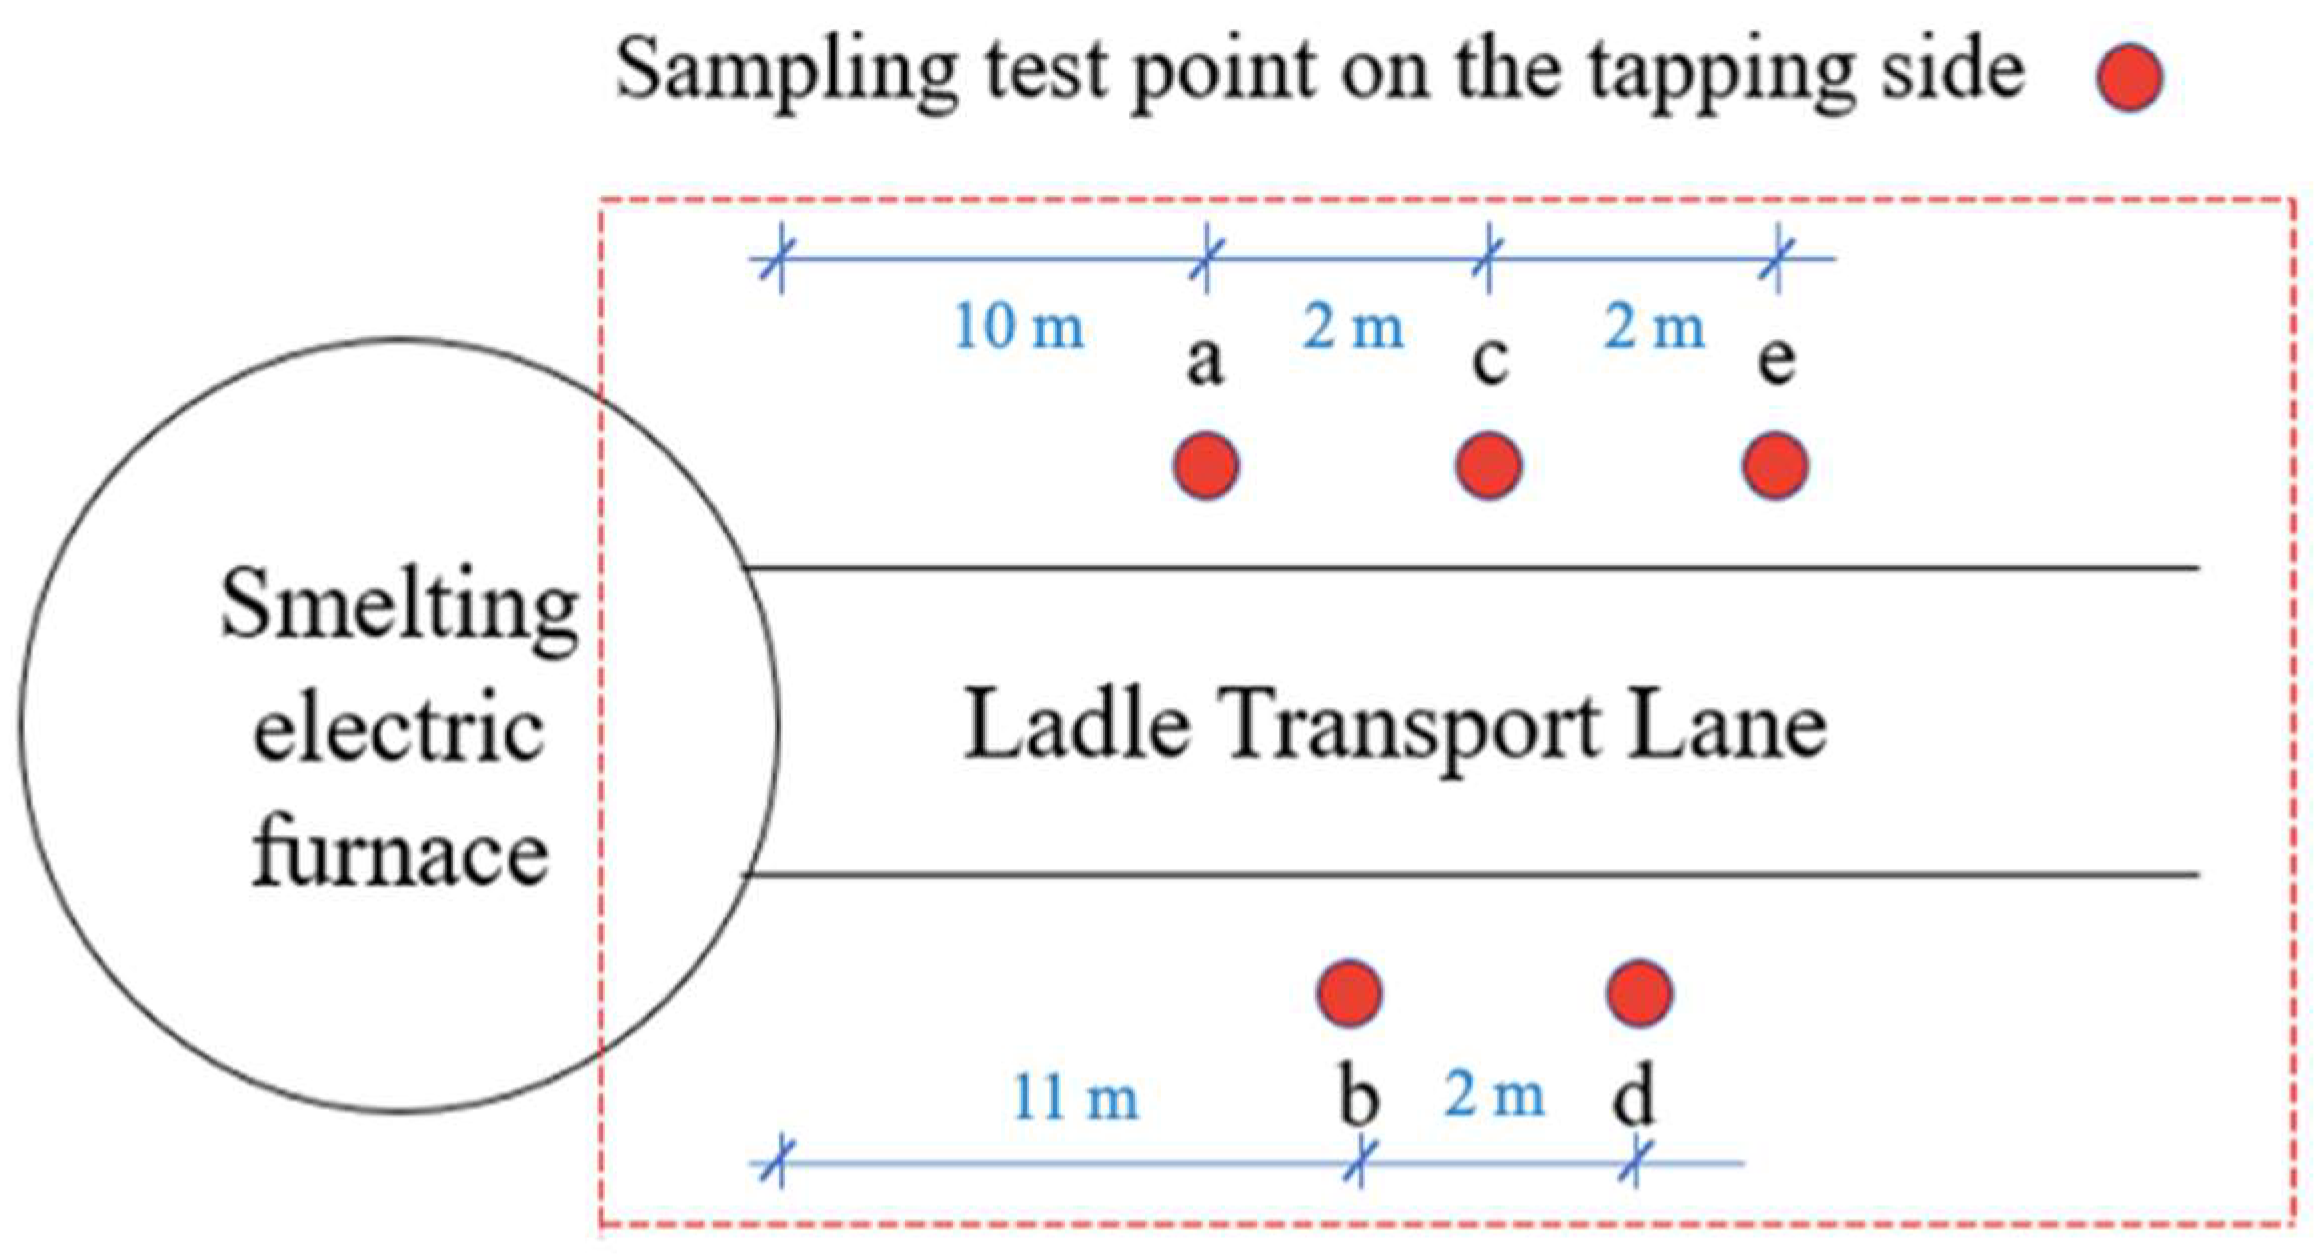
3.3. Test Time and Test Point

Due to the complex layout of the workshop, the ladle truck transportation channel is connected to the tapping side, and the measuring points can only be distributed on both sides of the channel. The test sampling point is set at 10 m from the tapping port, where the lateral distances of b, c, d, e and a are 1 m, 2 m, 3 m and 4 m, respectively, and the height of the measuring points is 1.5 m. The numbers and location of the arrangement are shown in Figure 3. The electric furnace steelmaking cycle is 45 min, including 3 min for tapping and 40 min for smelting. The sampling time of total suspended particulates is 3 min during tapping and 40 min during smelting.

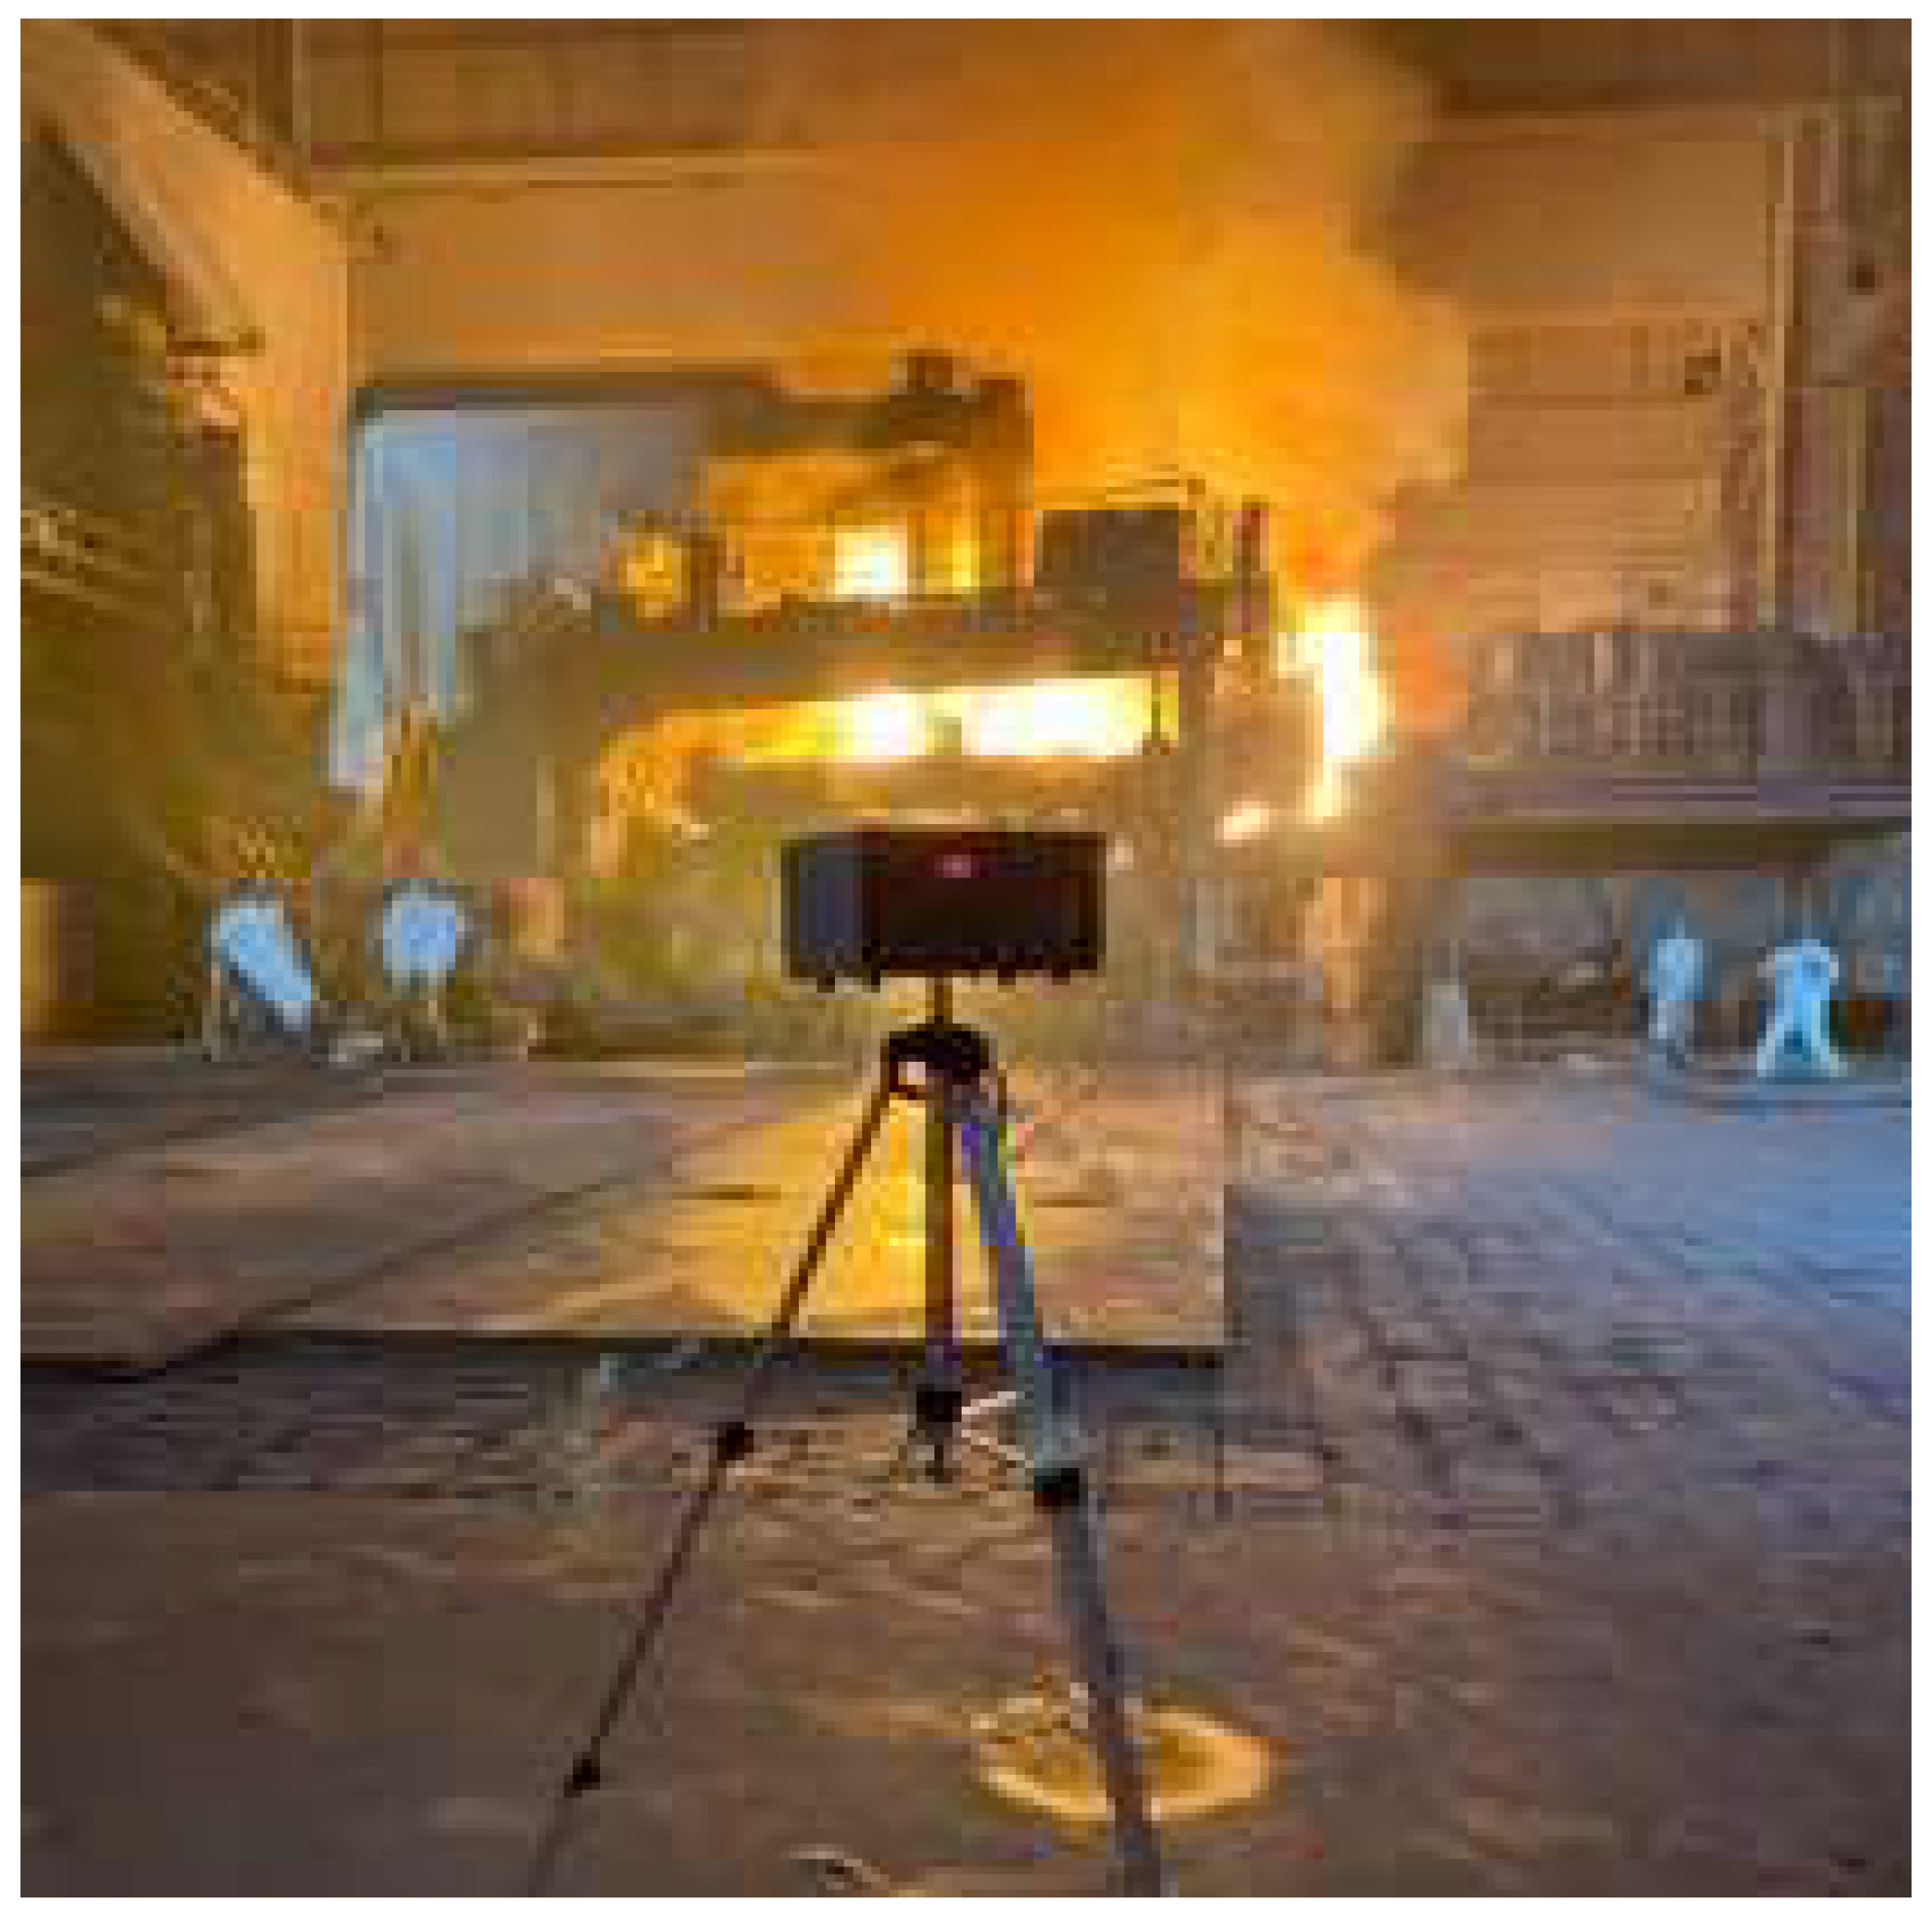
3.4. Test Instrument

The Best FC-4 dust sampler(purchased from Beijing Kean Labor Insurance New Technology Co., LTD., Beijing, China) was employed to sample and collect particulate matter in the air of the electric furnace workshop, with a precision level of 2.5. The sampling flow rate ranged from 5 to 30 L/min. As shown in Figure 4, this instrument meets the requirements of GBZ/T192.1-2007 (determination of airborne dust in workplaces according to the National Occupational Hygiene Standard of the People’s Republic of China Part 1: Total Dust Concentration) for dust sampling [33,34,35]. The sampler was placed at a height of 1.5 m, dual gas paths were enabled, and the sampling flow was 30 L/min.

3.5. Analysis of Test Results

After sampling, the filter membrane was stored in a constant temperature and humidity box with a temperature of 25 °C and a relative humidity of 40% for 24 h. After taking out and weighing, calculate the mass concentration of smoke and dust at each measuring point according to Equation (3). The dust sampler runs continuously with two gas circuits, collects two sets of samples at the same time, takes the average value of the two sets of data and obtains the mass concentration of smoke and dust at each measuring point during the electric furnace smelting and tapping, as shown in Figure 5.
q = W 2 W 1 Q L × t × 10 6
where q is the mass concentration of soot, mg/m3; W1 is the weight of the dust-measuring filter before the sample is collected, g; W2 is the weight of the dust-measuring filter after collecting the sample, g; QL is the flow rate under standard conditions set during sampling, L/min; t is the sampling time, min.
During the tapping period, the total suspended particulate matter concentration at each measuring point increased by an average of 1.17 mg/m3 compared with the normal smelting period. It shows that there is indeed smoke and dust escaping into the air through fugitive emissions at this time, and the distribution curve and distribution function of fugitive emission smoke and dust concentration changing with distance during the tapping period are obtained by fitting, as shown in Figure 6. The calculated concentration of fugitive smoke and dust near the tapping port is 23.57 mg/m3.

4. Model Establishment
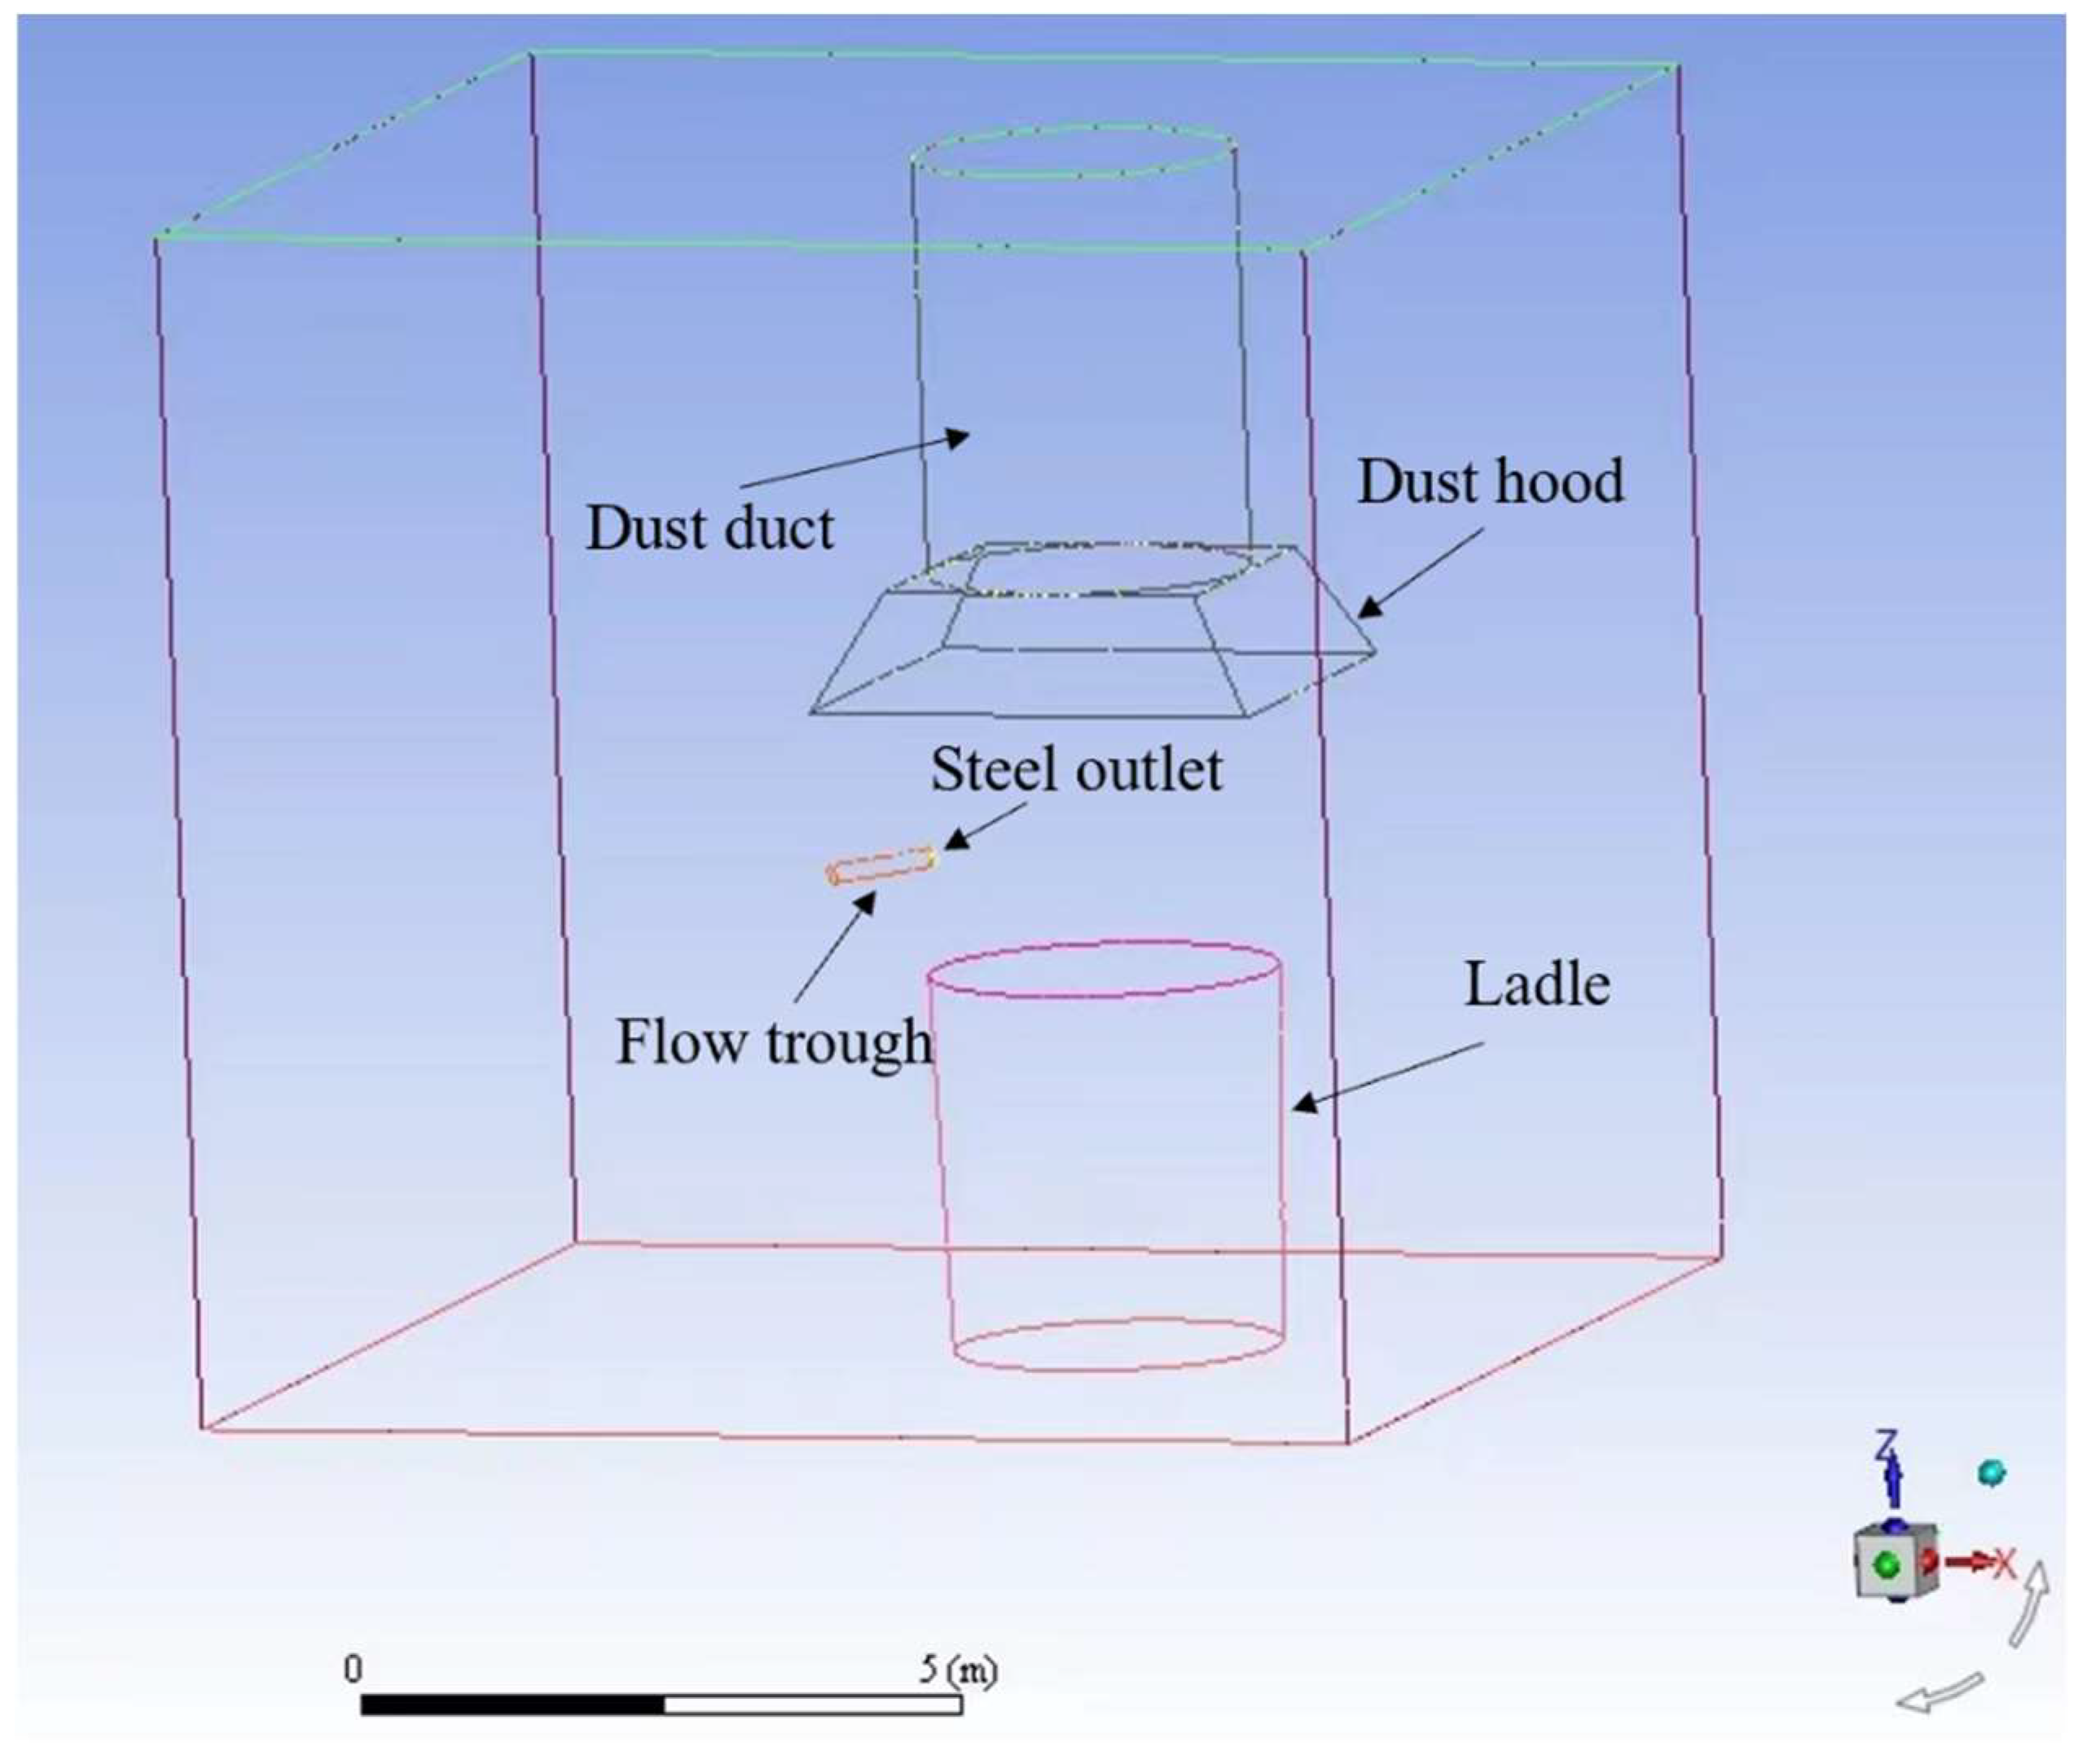
4.1. Physical Model

The Wugang electric furnace is used as the prototype for modeling. The steelmaking process in the electric furnace workshop is carried out through the tilting of a ladle for pouring steel. The molten steel flows out of the pouring spout through a steel flow trough, as shown in Figure 7. As this article mainly analyzes the flow field at the pouring spout, only the red area in Figure 7, which includes the pouring spout and ladle, is taken as the calculation domain. The other devices around the electric furnace in the workshop and the furnace front operation process are ignored to simplify the geometry model, as shown in Figure 8. The length × width × height of the computational domain is 10 m × 10 m × 10 m, the diameter of the tapping hole is 0.15 m, the projection points of the circle center on the plane where the top surface of the ladle is located is the coordinate origin, and the center of the tapping hole is 0.925 m away from the origin. The steel ladle has a length of 0.9 m, an inclination angle of 10°, a diameter of 2.916 m at the top of the ladle, a diameter of 2.728 m at the bottom, and a height of 3.15 m. The ladle is a high-temperature heat source. According to the theory of heat source diffusion under the dust hood [36,37], the size of the hood of the low-hanging dust hood should be designed to be 3.8 m long and 3.5 m wide according to Equation (4).
D = D Z + 0.8 H
D Z = 0.434 Z 0.68
where D is the width of the dust cover, m; D Z is the equivalent diameter of the dust-collecting cover, m; Z is the distance from the hypothetical point heat source to the dust cover, m; H is the distance between the upper surface of the heat source and the dust cover, m.

4.2. Mathematical Model

The Realizable k-ε model can more accurately predict the divergence ratio of the jet when simulating the circular jet. Therefore, the Realizable k-ε turbulence model is used in this paper. The soot particles ejected from the tapping port follow the movement of the high-temperature flue gas, which belongs to the gas–solid two-phase flow. The volume fraction of soot particles is less than 10%, which has little effect on the continuous phase. The gas–solid two-way coupling is not considered, and the discrete phase model (DPM) of the Euler–Lagrange method is directly used. Taking the flue gas as the continuous phase, the SIMPLE algorithm is used to calculate the smoke particles as the discrete phase, and the DPM model is used to track the particle trajectories in Lagrange coordinates [38].
For a continuous-phase fluid, its governing equations are as follows:
  • The continuity equation
ρ t + ( ρ u ) x + ( ρ v ) y + ( ρ w ) z = 0
2.
The momentum conservation equation
( ρ u ) t + d i v ( ρ u u ) = p x + τ x x x + τ x y y + τ x z z + F x
( ρ v ) t + d i v ( ρ v u ) = p y + τ x y x + τ y y y + τ y z z + F y
( ρ w ) t + d i v ( ρ w u ) = p z + τ x z x + τ y z y + τ z z z + F z
3.
The energy equation
( ρ T ) t + d i v ( ρ T u ) = d i v ( k c p g r a T ) + S T
4.
The turbulence model
( ρ k ) t + ( ρ k u i ) x i = x j [ ( μ + μ l σ k ) k x j ] + G k ρ ε
( ρ ε ) t + ( ρ ε u i ) x i = x j [ ( μ + μ l σ ε ) k x j ] + ρ C 1 E ε ρ C 2 ε 2 k + V ε
In the given equations, ρ represents density in kg/m3, t denotes time in s, and u, v and w represent the velocity components in the x, y and z directions, respectively, measured in m/s. The variable p signifies the pressure on the fluid elemental volume in pascals, and ∂τxx, ∂τxy, ∂τxz, etc., represent the components of the viscous stress τ acting on the fluid elemental volume. Fx, Fy and Fz are the body forces acting on the fluid elemental volume, cp is the specific heat capacity in kJ/(kg·K), k is the heat transfer coefficient in W/(m2·K), and ST represents the viscous dissipation term.

4.3. Boundary Conditions and Solution Settings
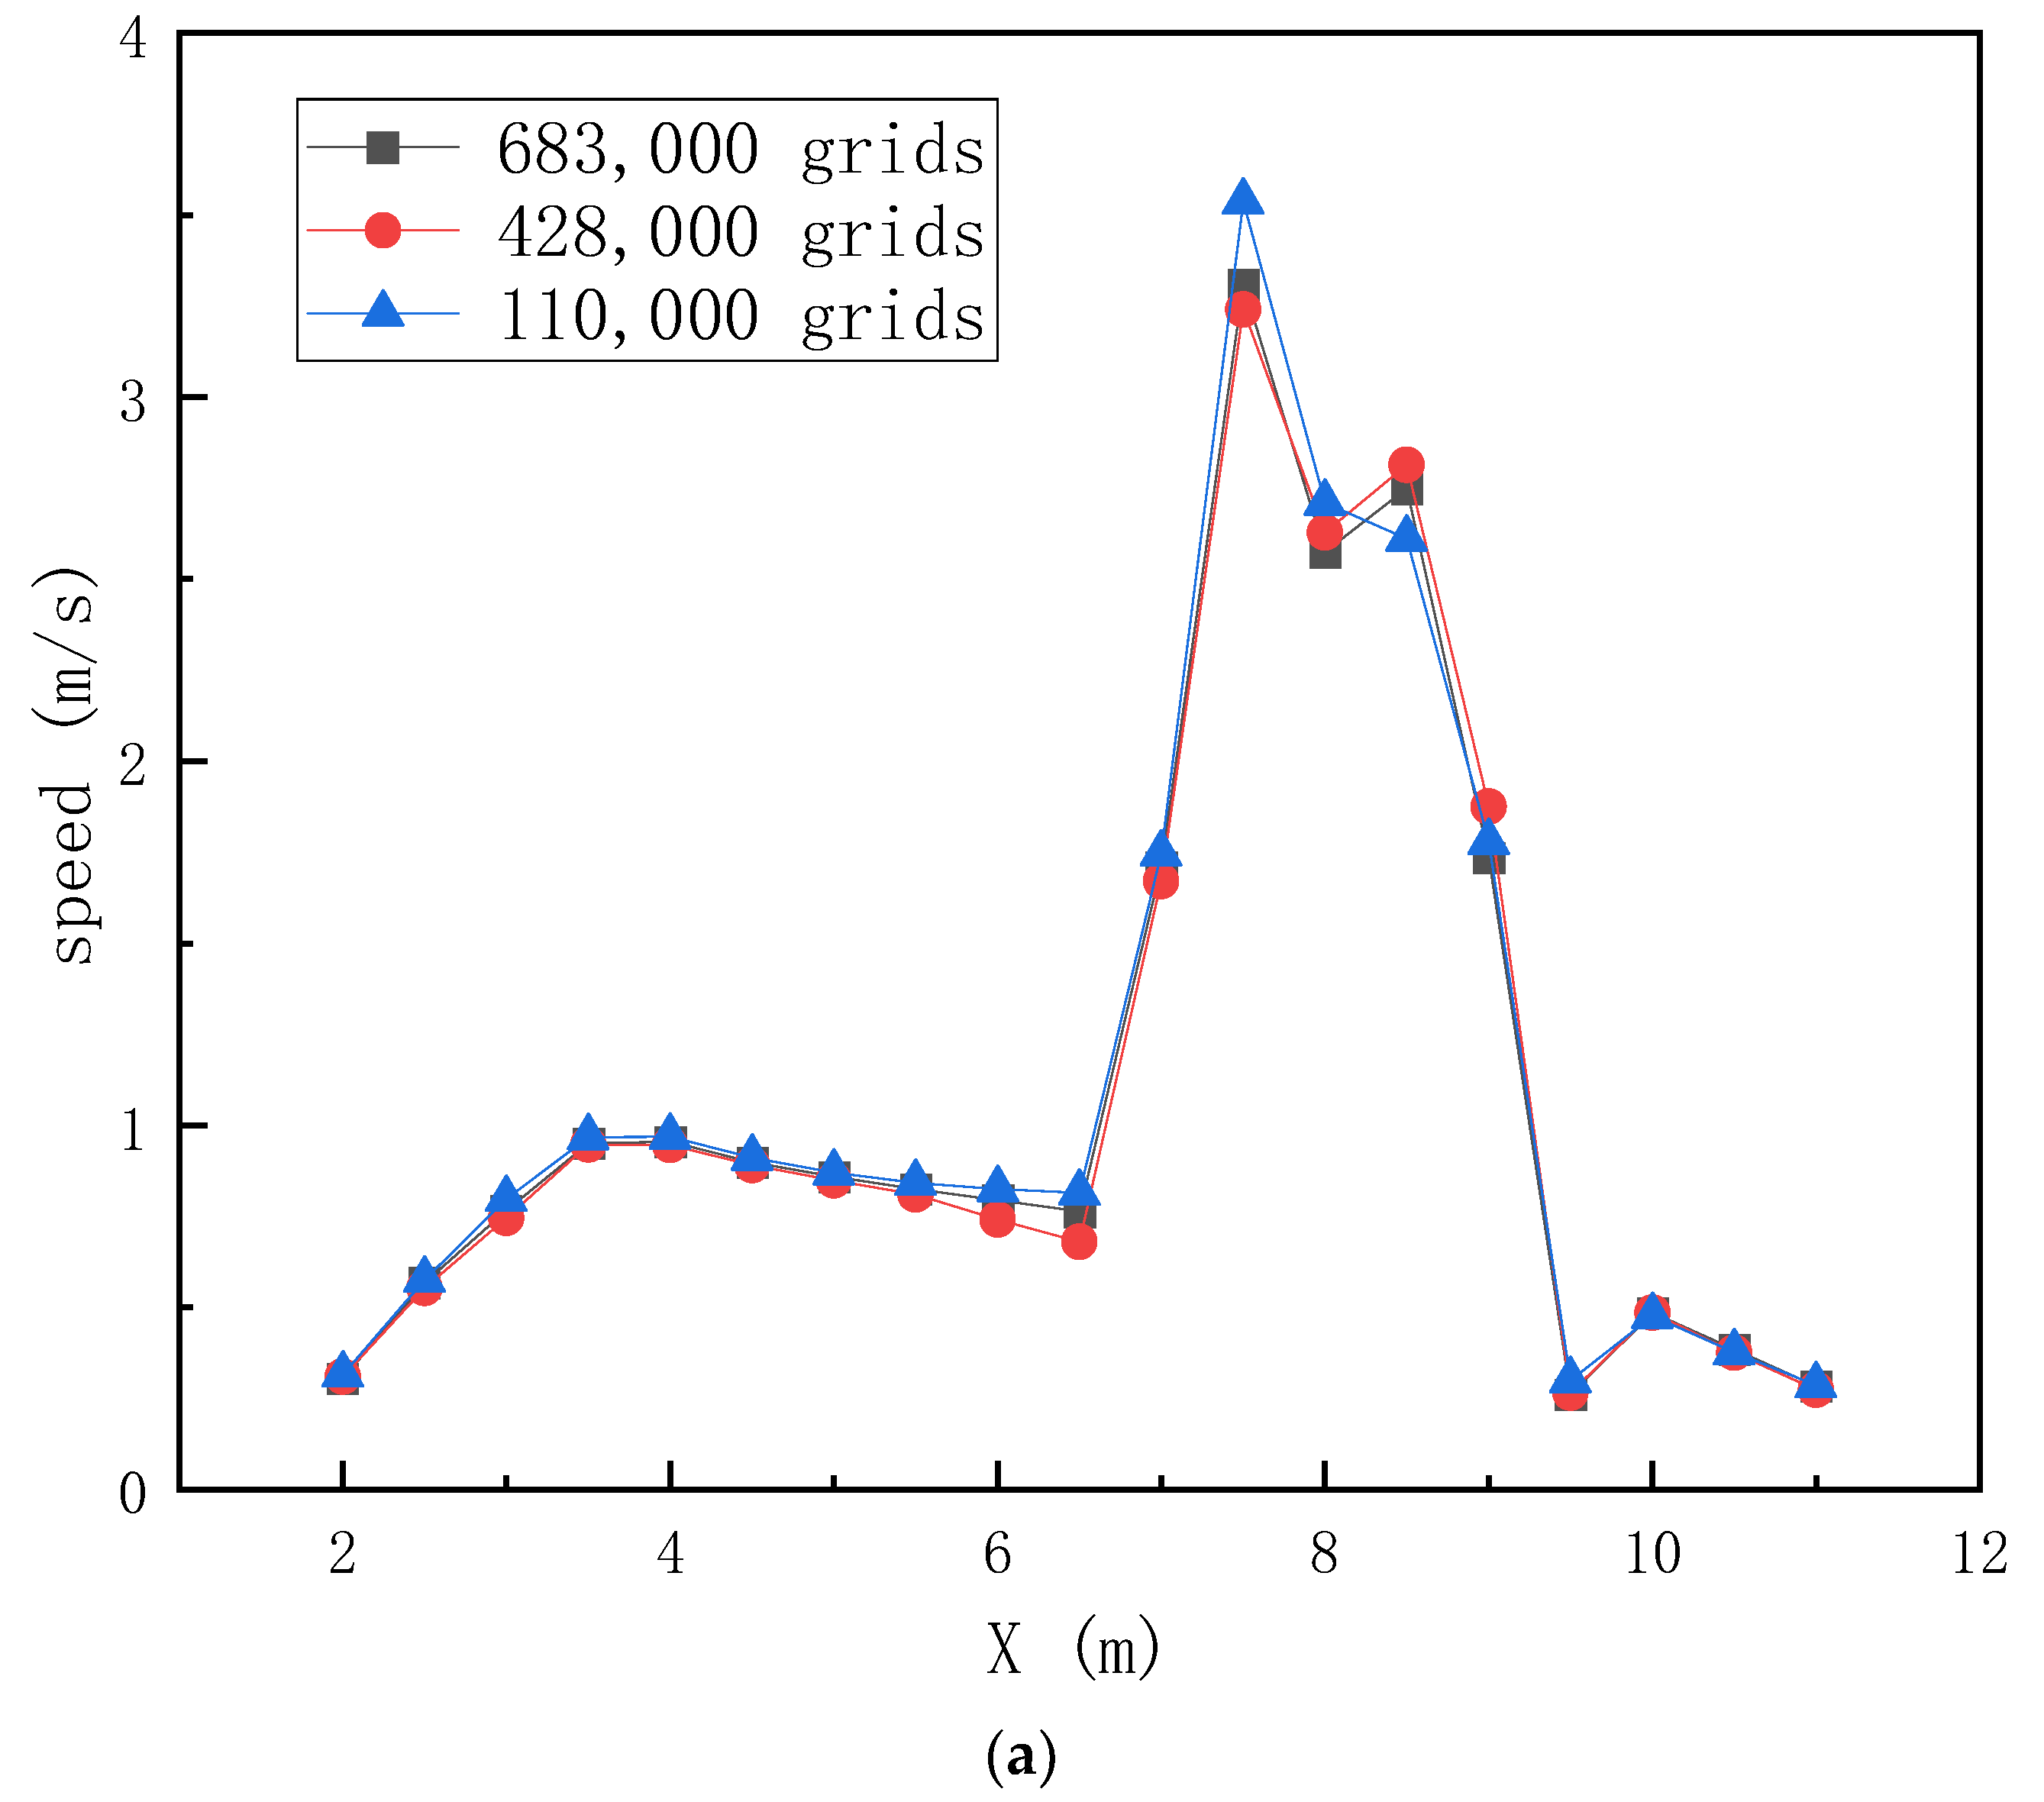
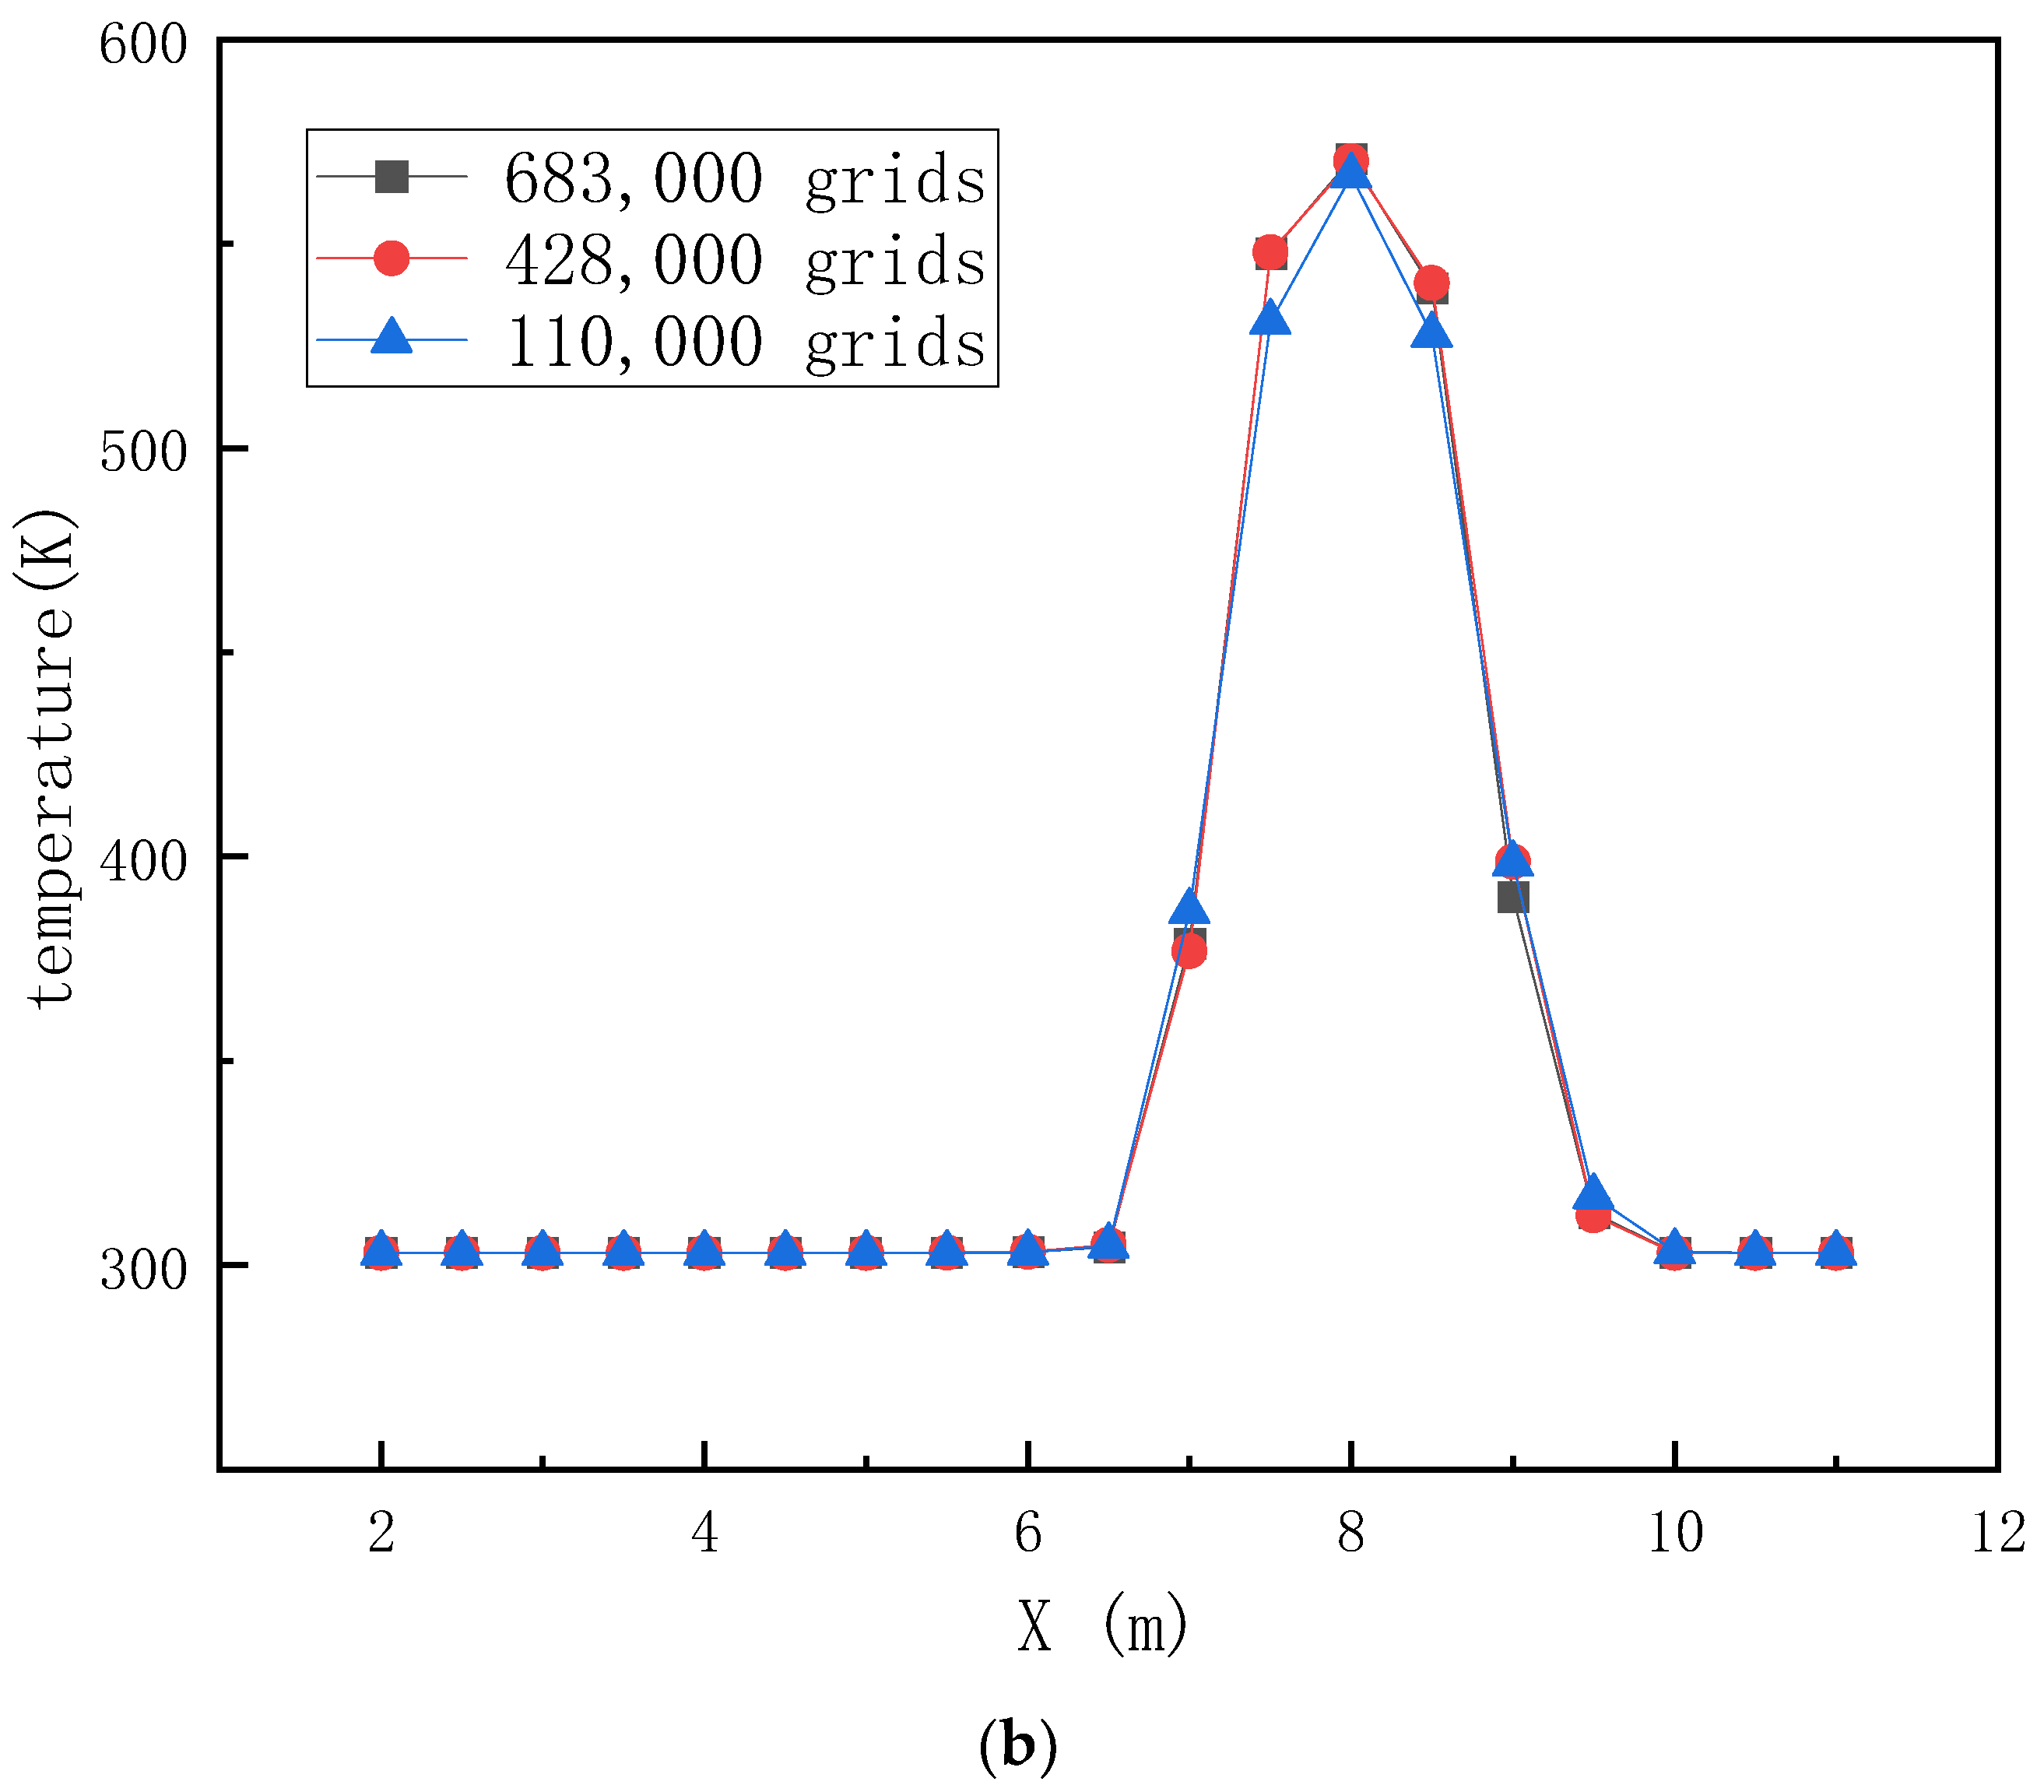
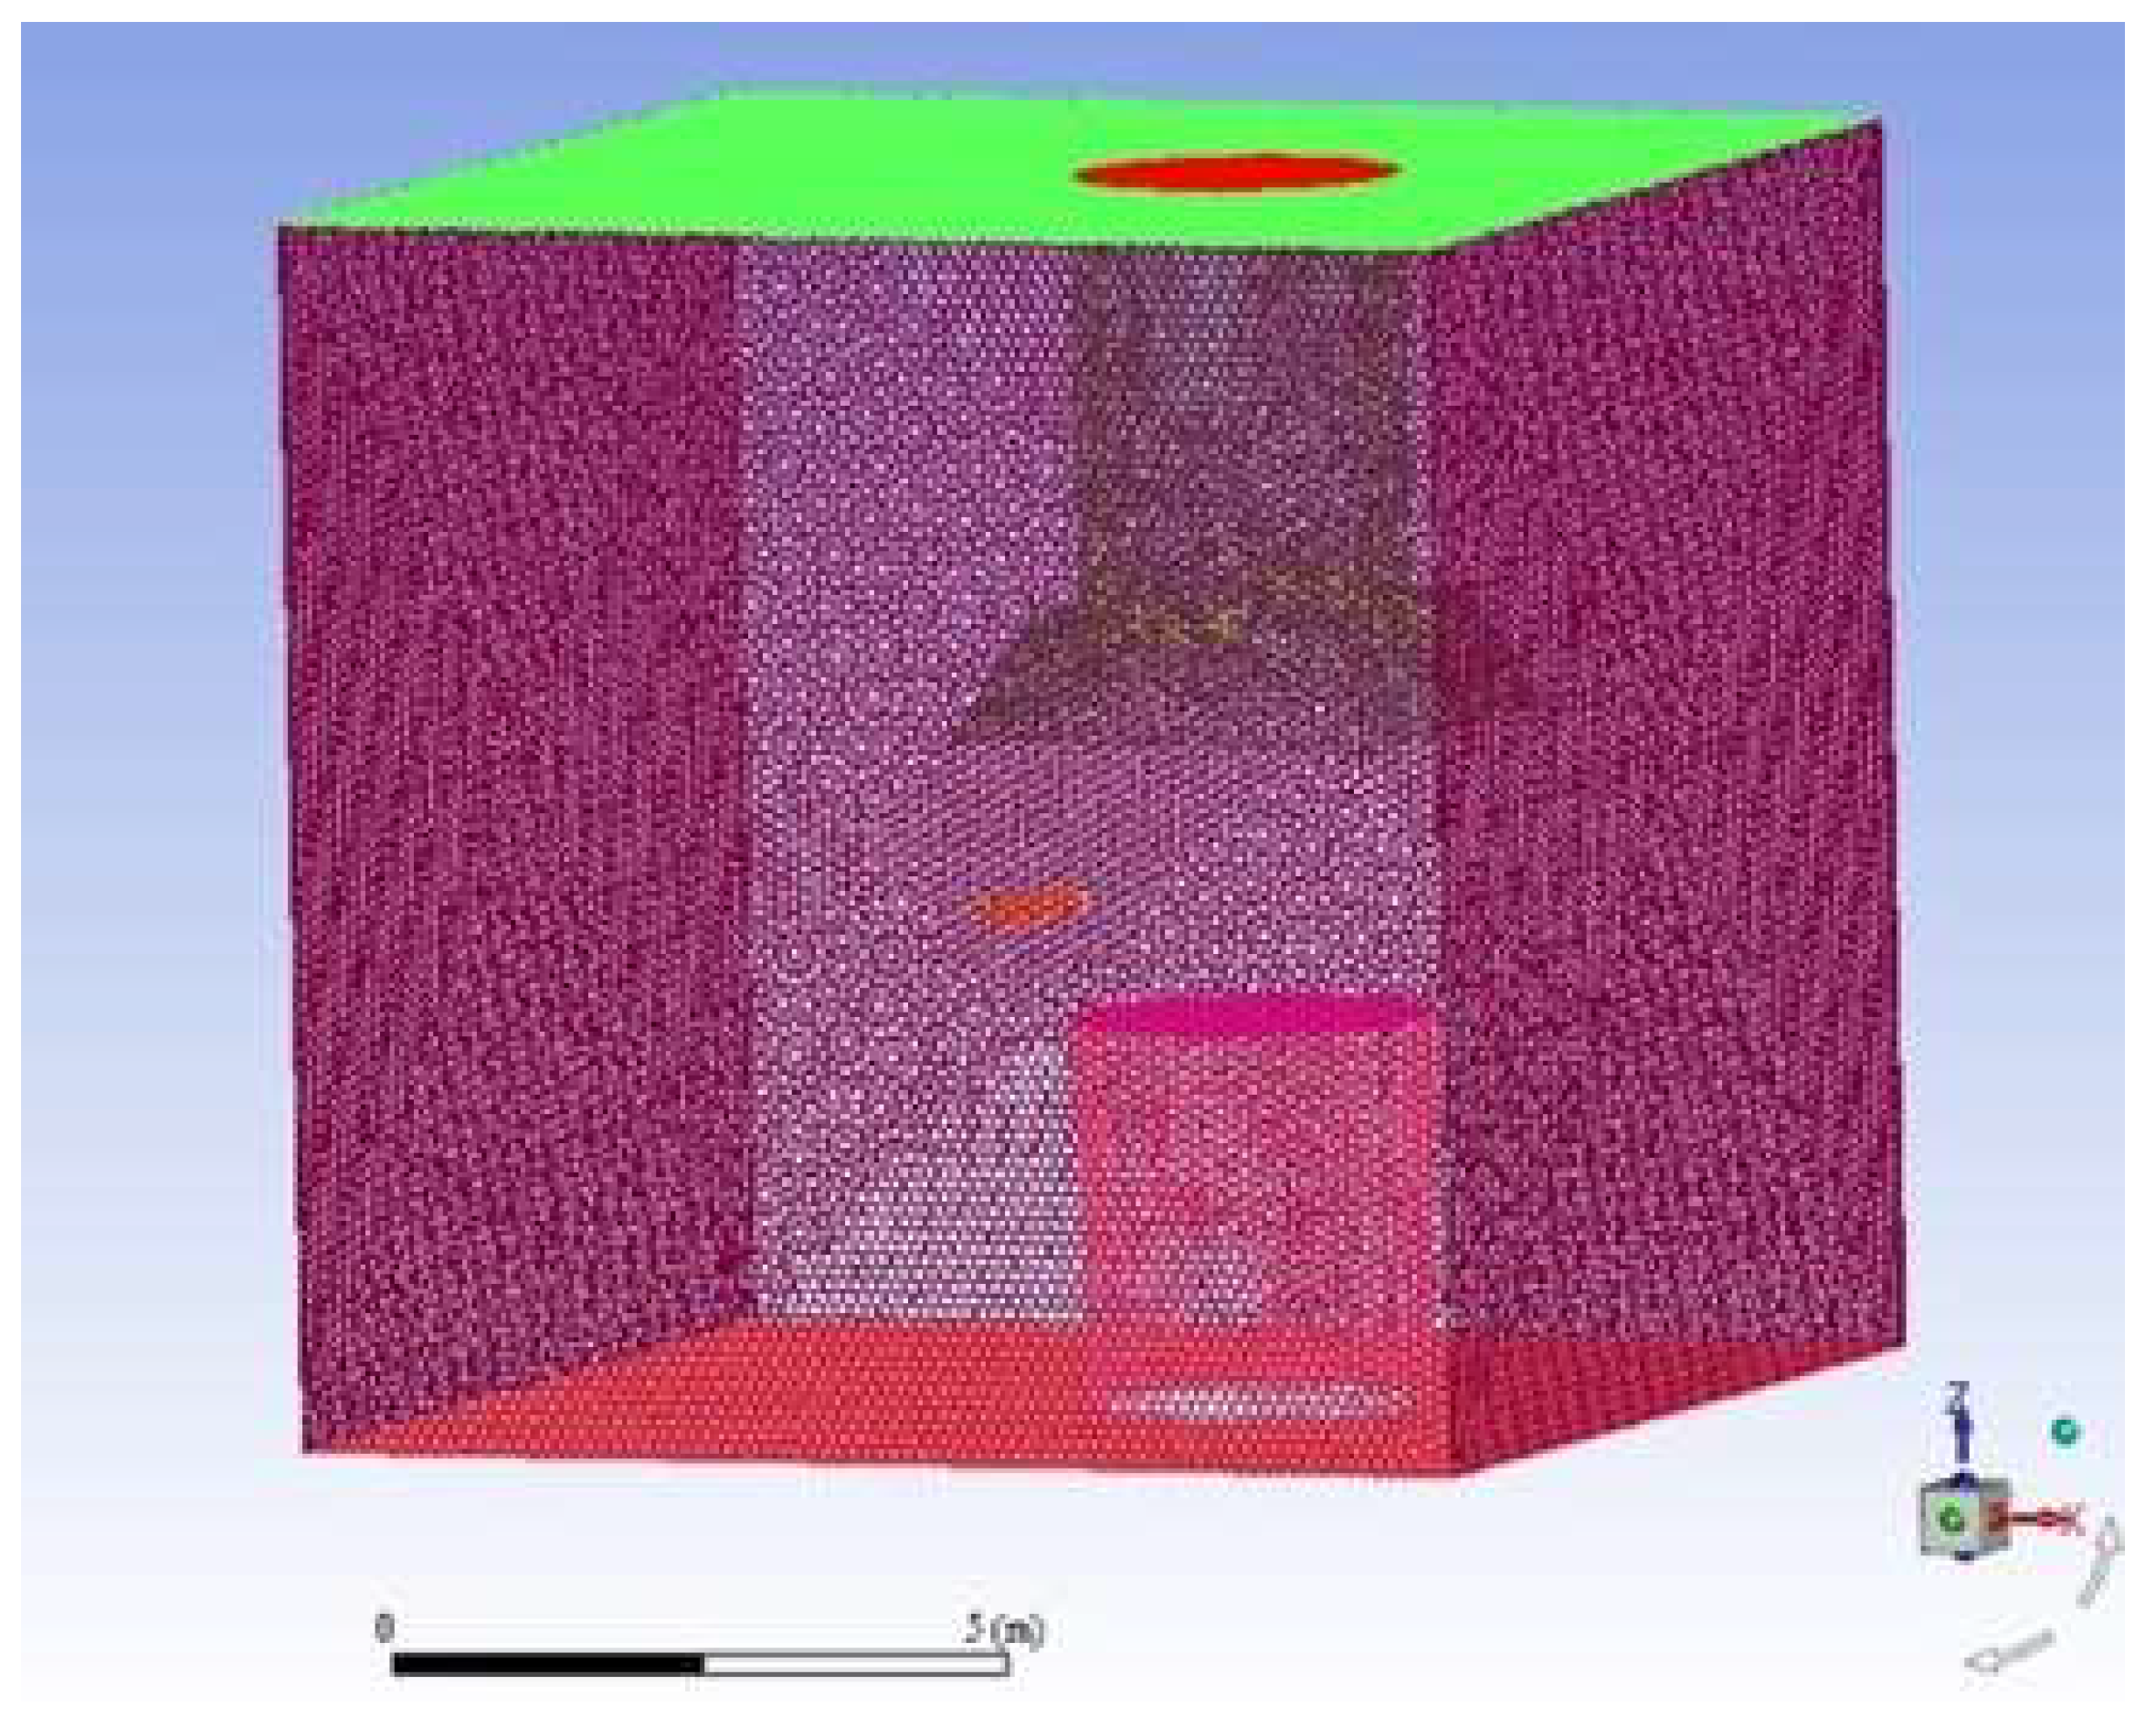
The bottom surface perpendicular to the Z axis is the workshop floor, which is defined as a wall, and the wall temperature is 303 K; The top surface perpendicular to the Z axis and the other four surfaces of the model are defined as free boundaries and defined as the pressure outlet; the steel outlet is the jet outlet, defined as the velocity inlet, Vs = 61.7 m/s. The initial temperature of the jet at the tapping port is 1673 K, the physical parameters of the dust-laden flue gas are considered to be the same as those of air and the physical parameters of the air are set by piecewise linear interpolation. The upper surface of the ladle is defined as the velocity inlet, the temperature is 573 K, the initial velocity of the ladle smoke is 0, and the initial velocity of the ladle smoke is 4.5 m/s when the tapping is stable. The initial velocity Vgb of the ladle soot is set as 0, 1.125 m/s, 2.25 m/s, 3.375 m/s and 4.5 m/s.
The finite volume method is used to discretize the partial differential equation, the Body Force Weight discretizes the pressure term, and other parameters in the discretization process use the second-order upwind style; the energy equation, the Realizable k-ε model and the DPM model are enabled, and the particle size distribution uses the Rosin–Rammler function. The minimum particle size is 0.1 μm, the maximum particle size is 90 μm, and the average particle size is 10 μm.

4.4. Grid Division

The model is meshed with an unstructured mesh [39], and the upper surface of the tap and ladle is locally refined, as shown in Figure 9. Grid independence verification was carried out, and the grid sizes were changed to obtain 110,000, 428,000 and 683,000 grids. The changes in velocity and temperature along the x-axis under different grid numbers are shown in Figure 10. The temperature and velocity at X = 6 were compared, with grid numbers 110,000, 428,00 and 683,000. The percentage differences in velocity were 6.75% and 5.06%, respectively. The percentage differences in temperature were 0.99% and 0.33%. The differences in velocity and temperature changes are small for the three different mesh numbers, which are independent of the solution process. Finally, the number of grids is 428,000 for calculation. The minimum size of the grid is 0.01 m, the maximum size is 0.12 m, and the number of model nodes is 2.383 million. The minimum grid quality is 0.44995, the maximum is 0.99947, and the average is 0.94411, which meets the quality requirements.

4.5. Analysis of Simulation Results

4.5.1. Influence of the Inclination Angle of the Hood of the Dust Hood on the Collection Efficiency

The arrangement height of the dust-collecting cover is H = 2.4 m, the dust removal air volume is Q = 28,000 m3/h, and the inclination angles of the dust-collecting cover are α = 30°, 45° and 60°, respectively. The change in dust-collecting efficiency of the dust-collecting cover under different initial velocities of plume dust in the ladle is shown in Figure 11. The influence of the dust-collecting cover with different inclination angles on dust-collecting efficiency is not obvious.
At Vgb = 1.125 m/s, the jet dust is affected by the plume dust, and the jet trajectory moves upward and bends, as shown in Figure 12, so the capture efficiency increases. When α = 60° and Vgb = 0, the particle motion trajectory is shown in Figure 13a. The jet velocity at the outlet is much larger than the suction velocity of the dust collector, and the dust-containing airflow rapidly rushes out of the control range of the dust collector, so the capture efficiency of the dust collector is 0. When Vgb = 1.125 m/s, plume dust prevents part of the jet dust from escaping outward and carries it together to move towards the dust-collecting cover, as shown in Figure 13b. Therefore, the Vgb value increases from 0 to 1.125, and the capture efficiency is significantly improved. However, the velocity of plume dust is too small relative to the jet velocity. The jet dust quickly passes through the plume dust emission area, and hits the edge of the dust-collecting cover and then dissipates outward, so the capture efficiency is only 71.6% at this time. After Vgb > 1.125 m/s, the capture efficiency did not increase but dropped sharply; this is because the dust removal air volume at this time is 28,000 m3/h, which is only slightly larger than the sum of the jet and plume flue gas volume, 27,047.05 m3/h when Vgb = 1.125 m/s, and the amount of flue gas that can be captured is limited.
In the later stages, as the Vgb increases during the tapping process, the amount of flue gas emitted from the ladle also increases. In addition, the amount of flue gas from the jet is much larger than the set dust removal air volume, so the increase in Vgb will reduce the capture efficiency.
Although the inclination angle of the hood has little effect on the capture efficiency, the early stage of tapping is very short compared with the whole tapping process, and the stable stage of tapping is longer. When Vgb = 4.5 m/s, the capture efficiency is higher when the inclination angle of the hood is 60°, so the dust catcher with the inclination angle of 60° is selected.

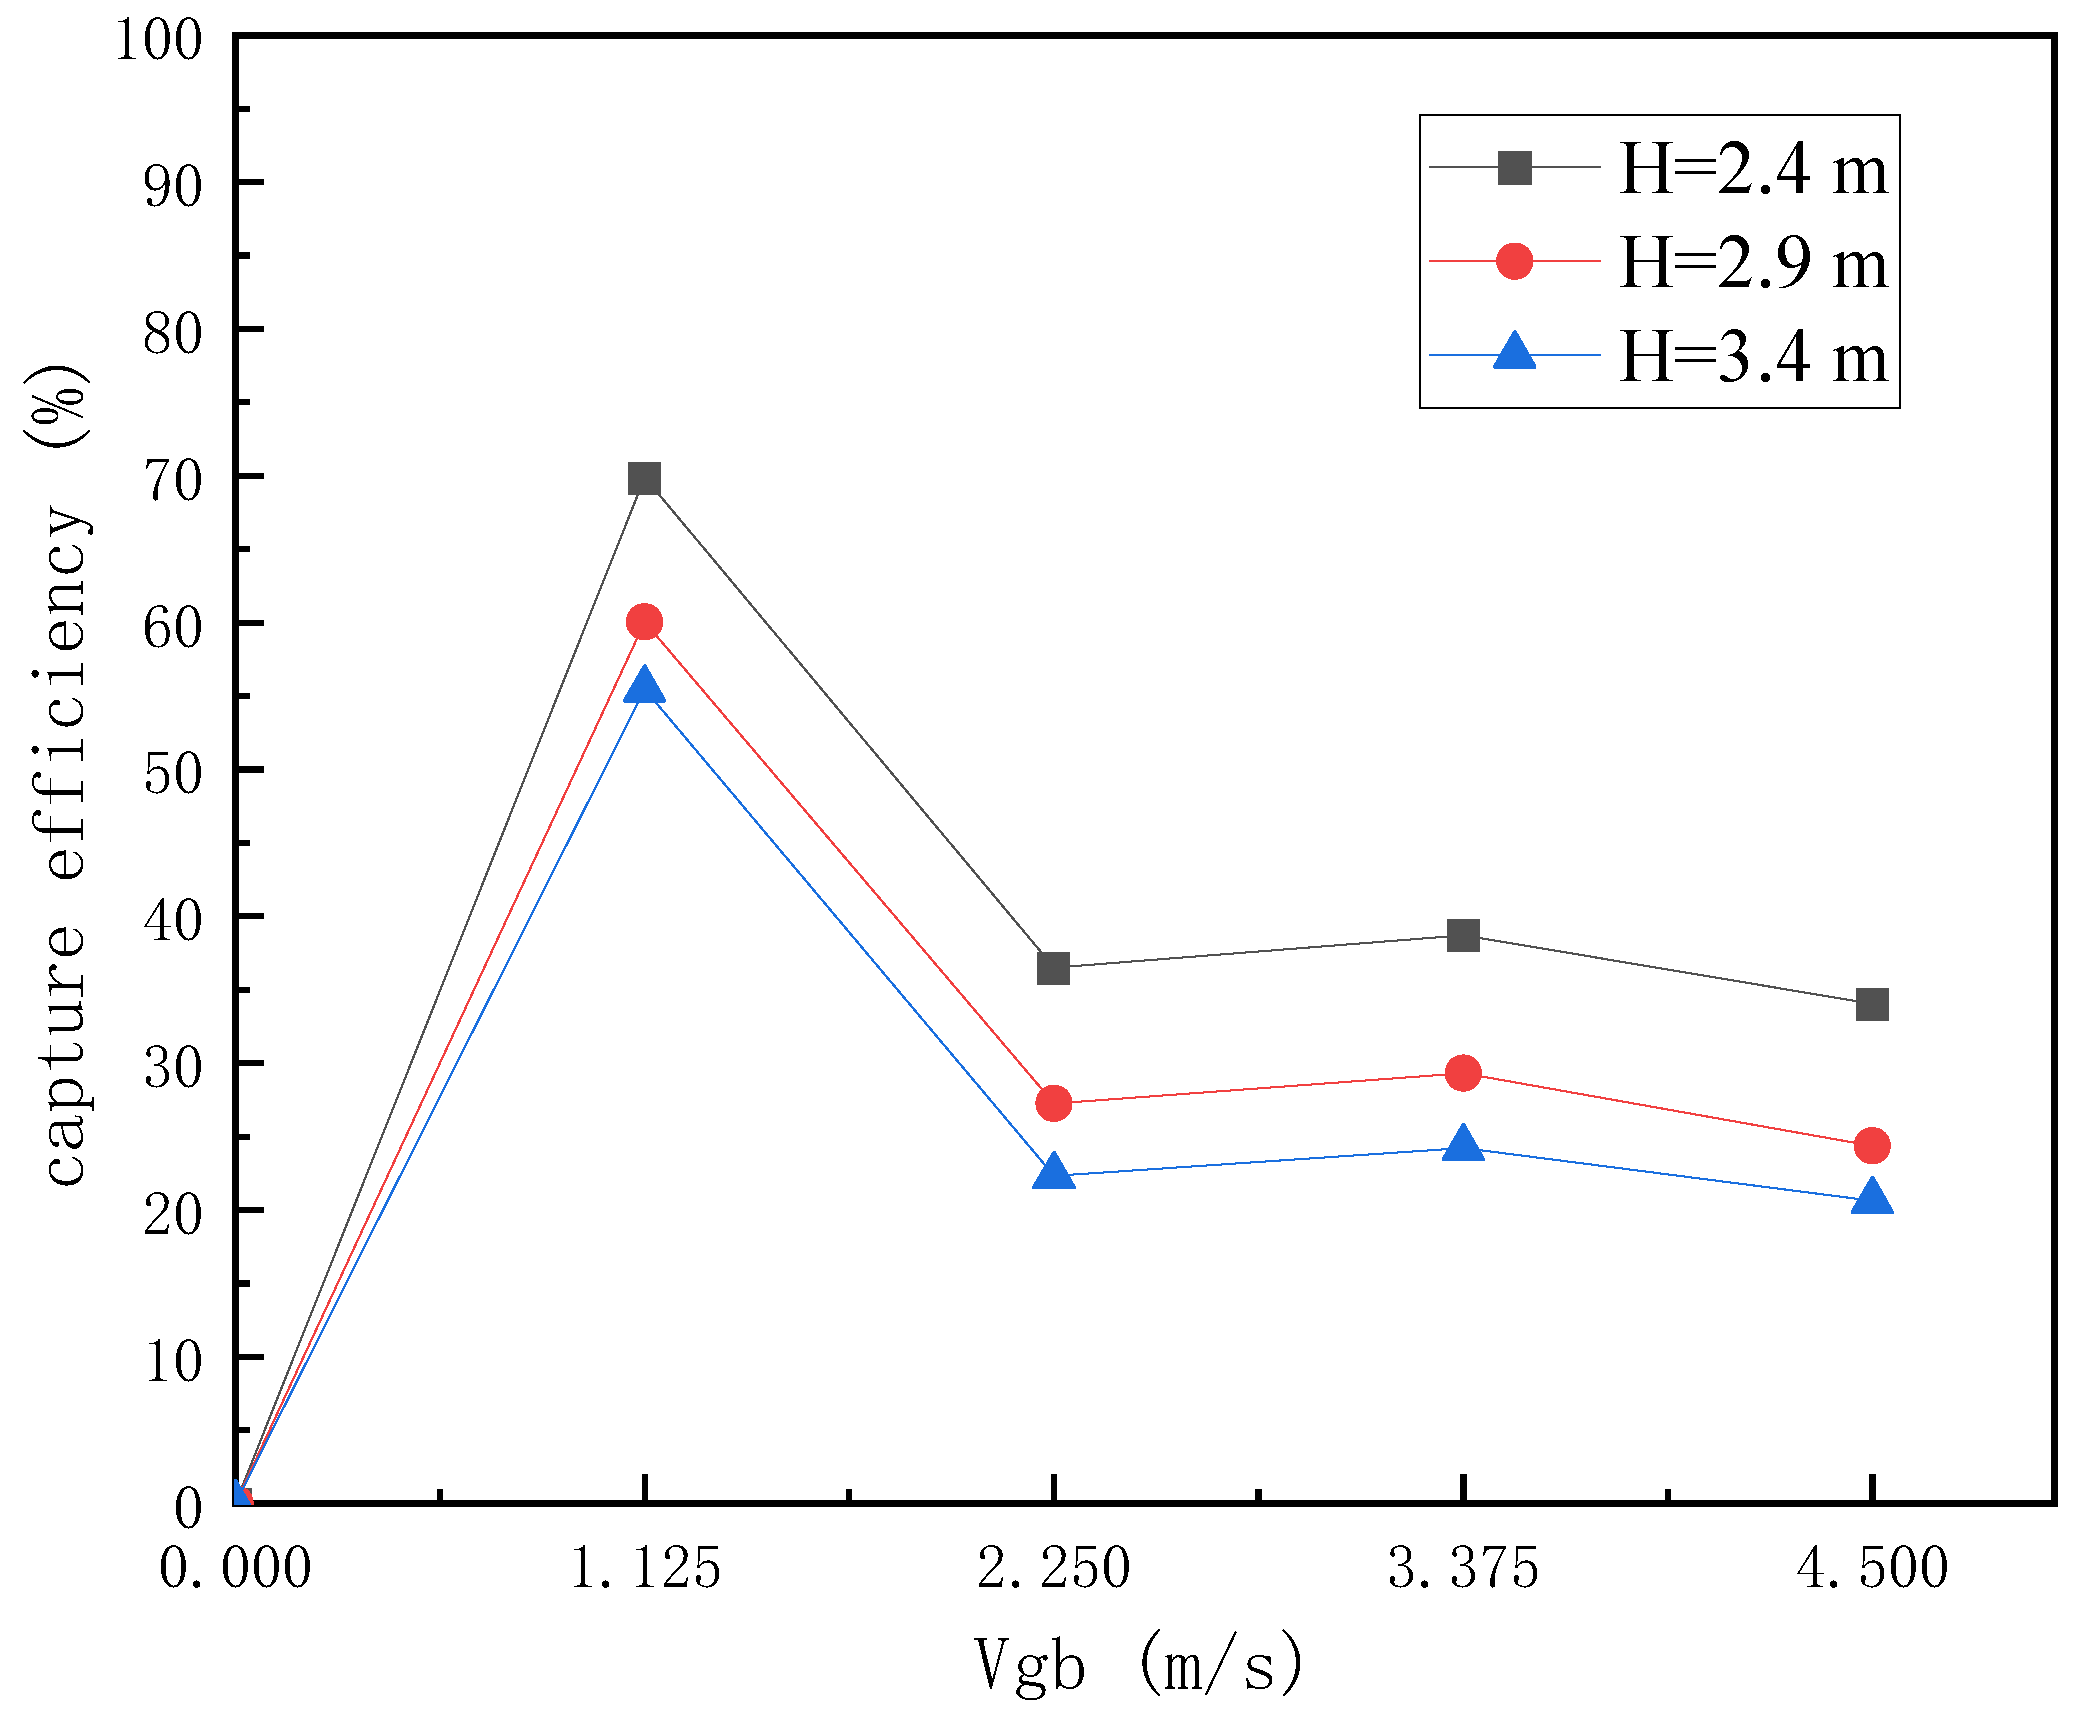
4.5.2. The Effect of Dust Hood Arrangement Height on Collection Efficiency

According to the engineering experience, the dust removal effect is better when the arrangement height of the top dust collector is 2~4 m, and the limit value of the arrangement height of the low suspended umbrella cover is calculated to be H < 3.87 m. Under the condition of α = 60° and dust removal air volume Q = 28,000 m3/h, when the arrangement height of the dust collector is H = 2.4 m, 2.9 m and 3.4 m, respectively, the collection efficiency of the dust collector under different initial dust velocities of the ladle plume is shown in Figure 14. The lower the arrangement height of the dust collector, the higher the collection efficiency. With increasing Vgb, the change rule of capture efficiency under three arrangement heights is basically the same.
When Vgb = 1.125 m/s, the velocity distribution of the y = 0 cross-section is shown in Figure 15. Jet dust bends upward and enters the control area of the dust collector. When H = 2.4 m, part of the escaping dust is blocked by the edge of the dust collector and enters the dust collector along the edge of the dust collector. When H = 3.4 m, the cover is far away from the jet position, and the dust escapes outward without reaching the edge of the cover, which reduces the collection efficiency. With increasing Vgb, the dust removal volume is not enough to inhale all the flue gas at this time, and the capture efficiency decreases at three arrangement heights.
When the dust removal air volume is fixed, on the basis of meeting the operation process before the furnace, the arrangement height of the dust collector should be as close as possible to the dust source, and the arrangement height of the dust collector in this workshop should be 2.4 m.

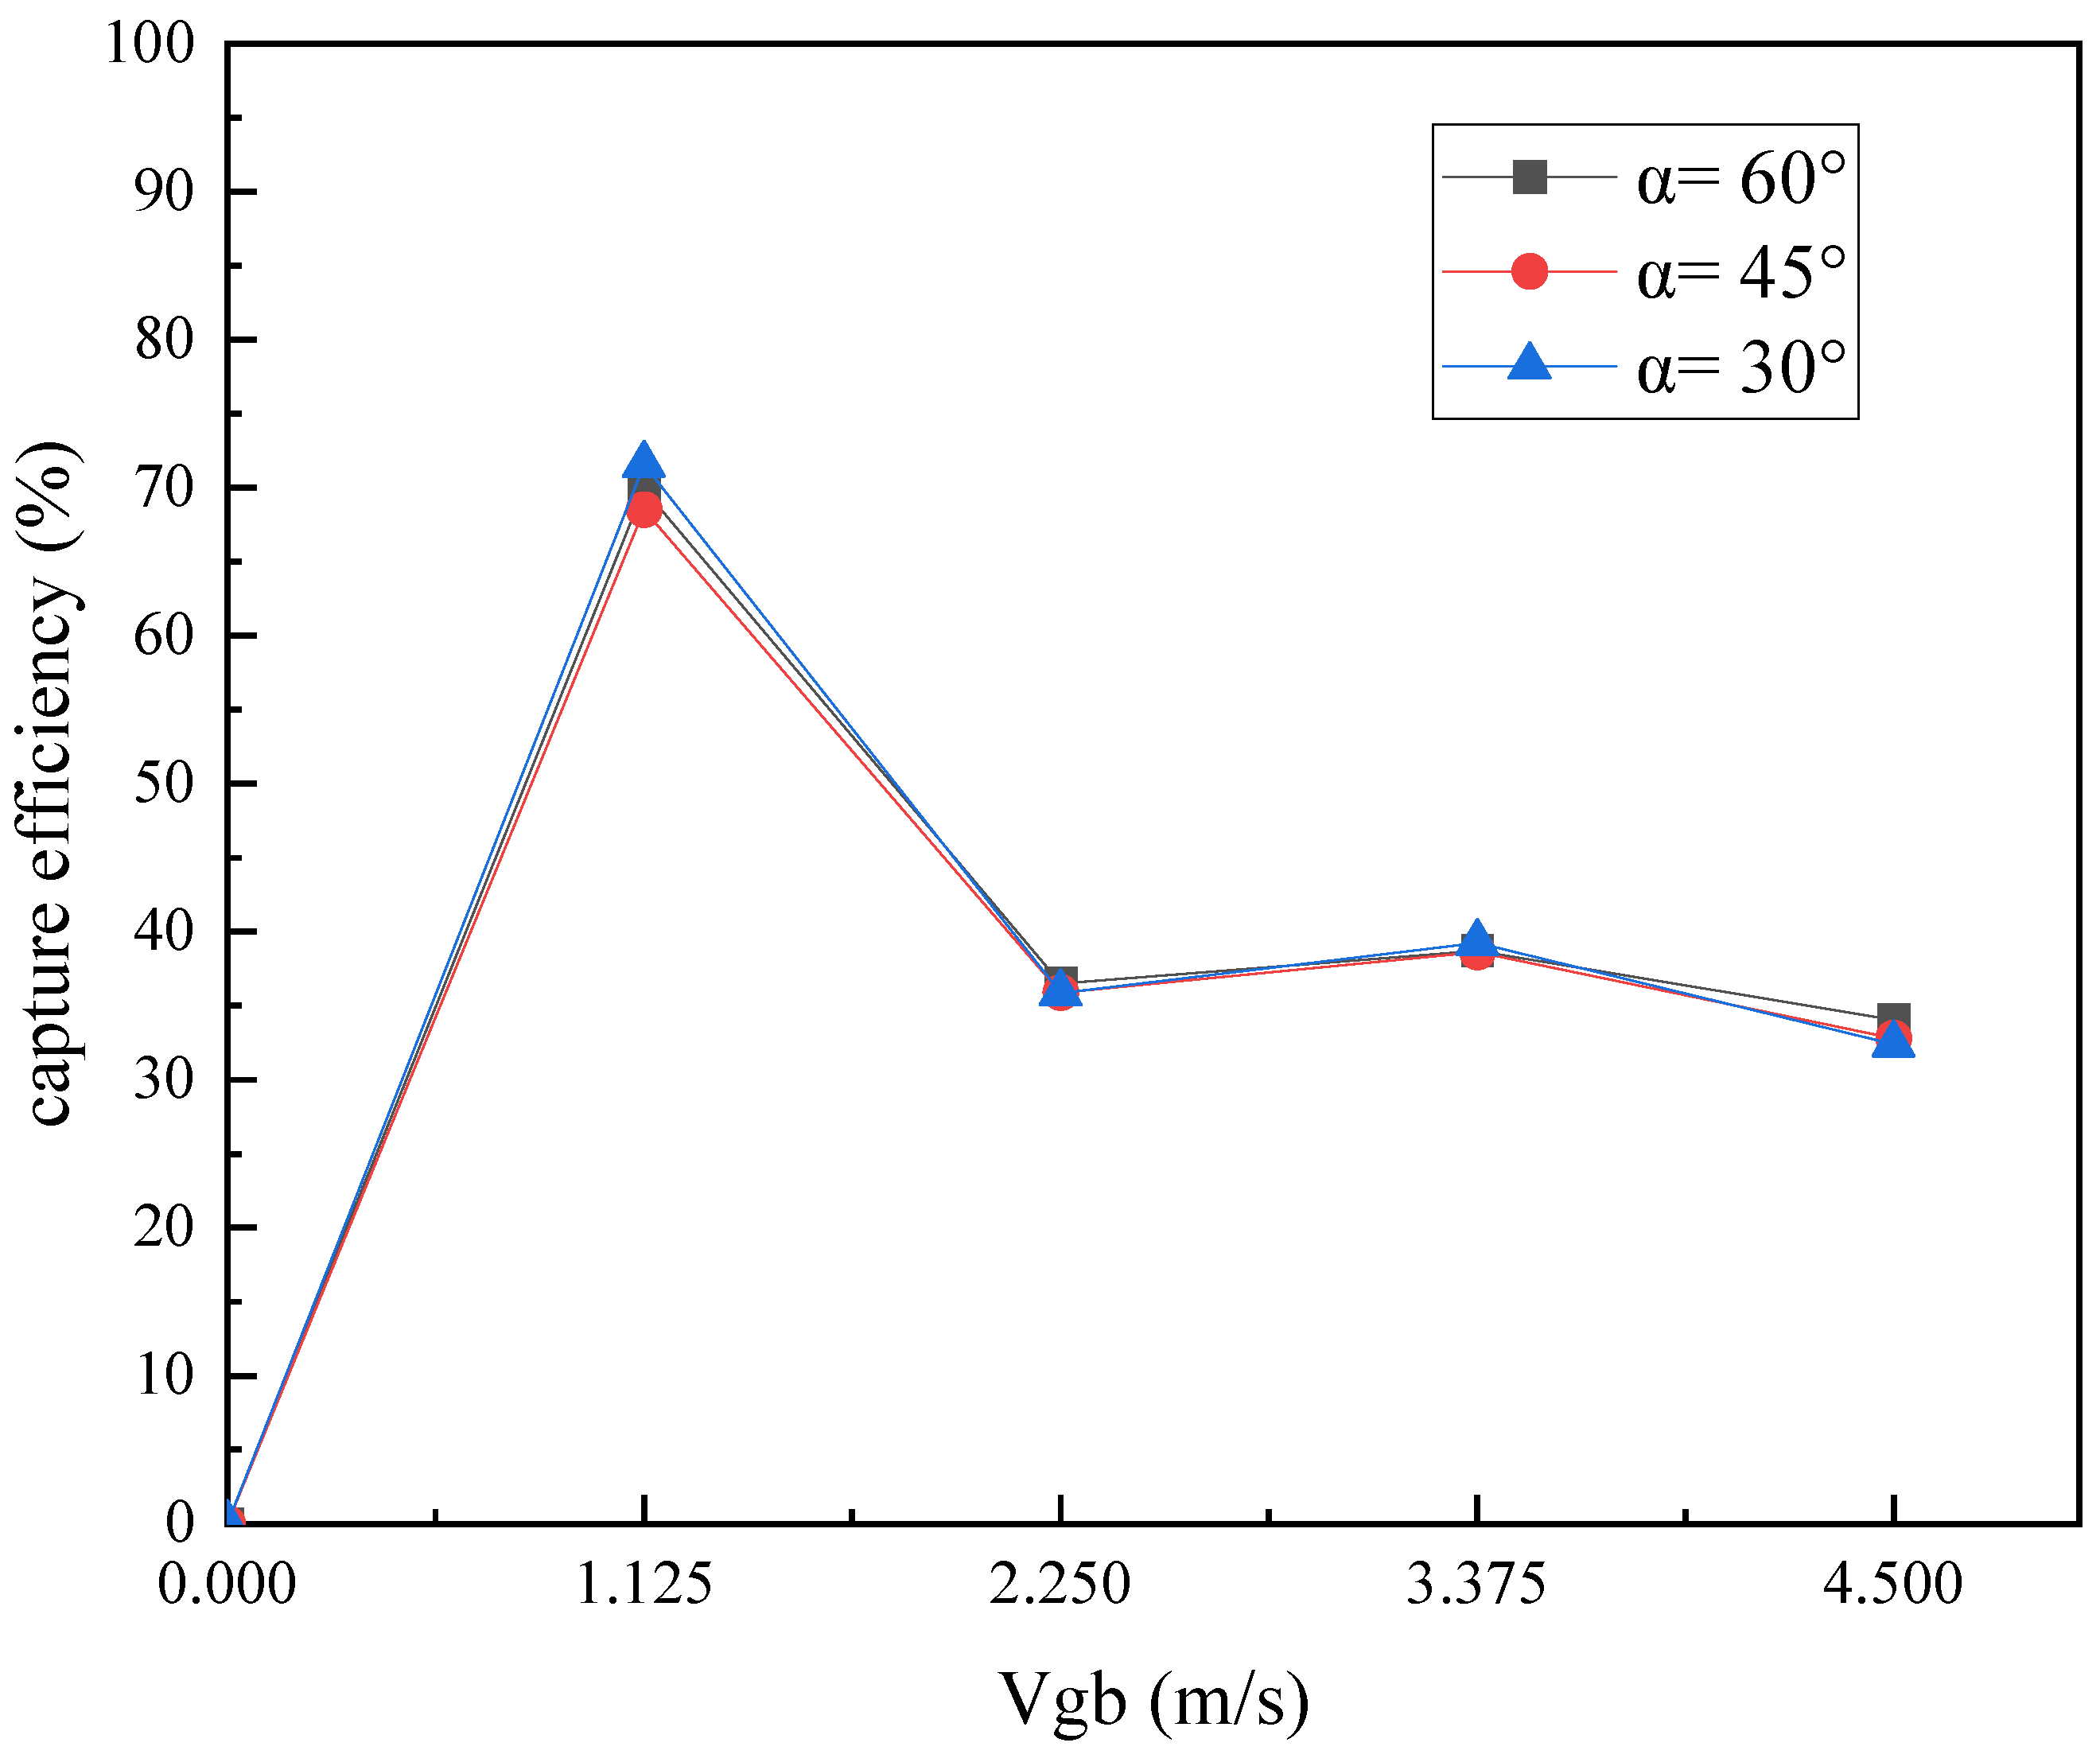
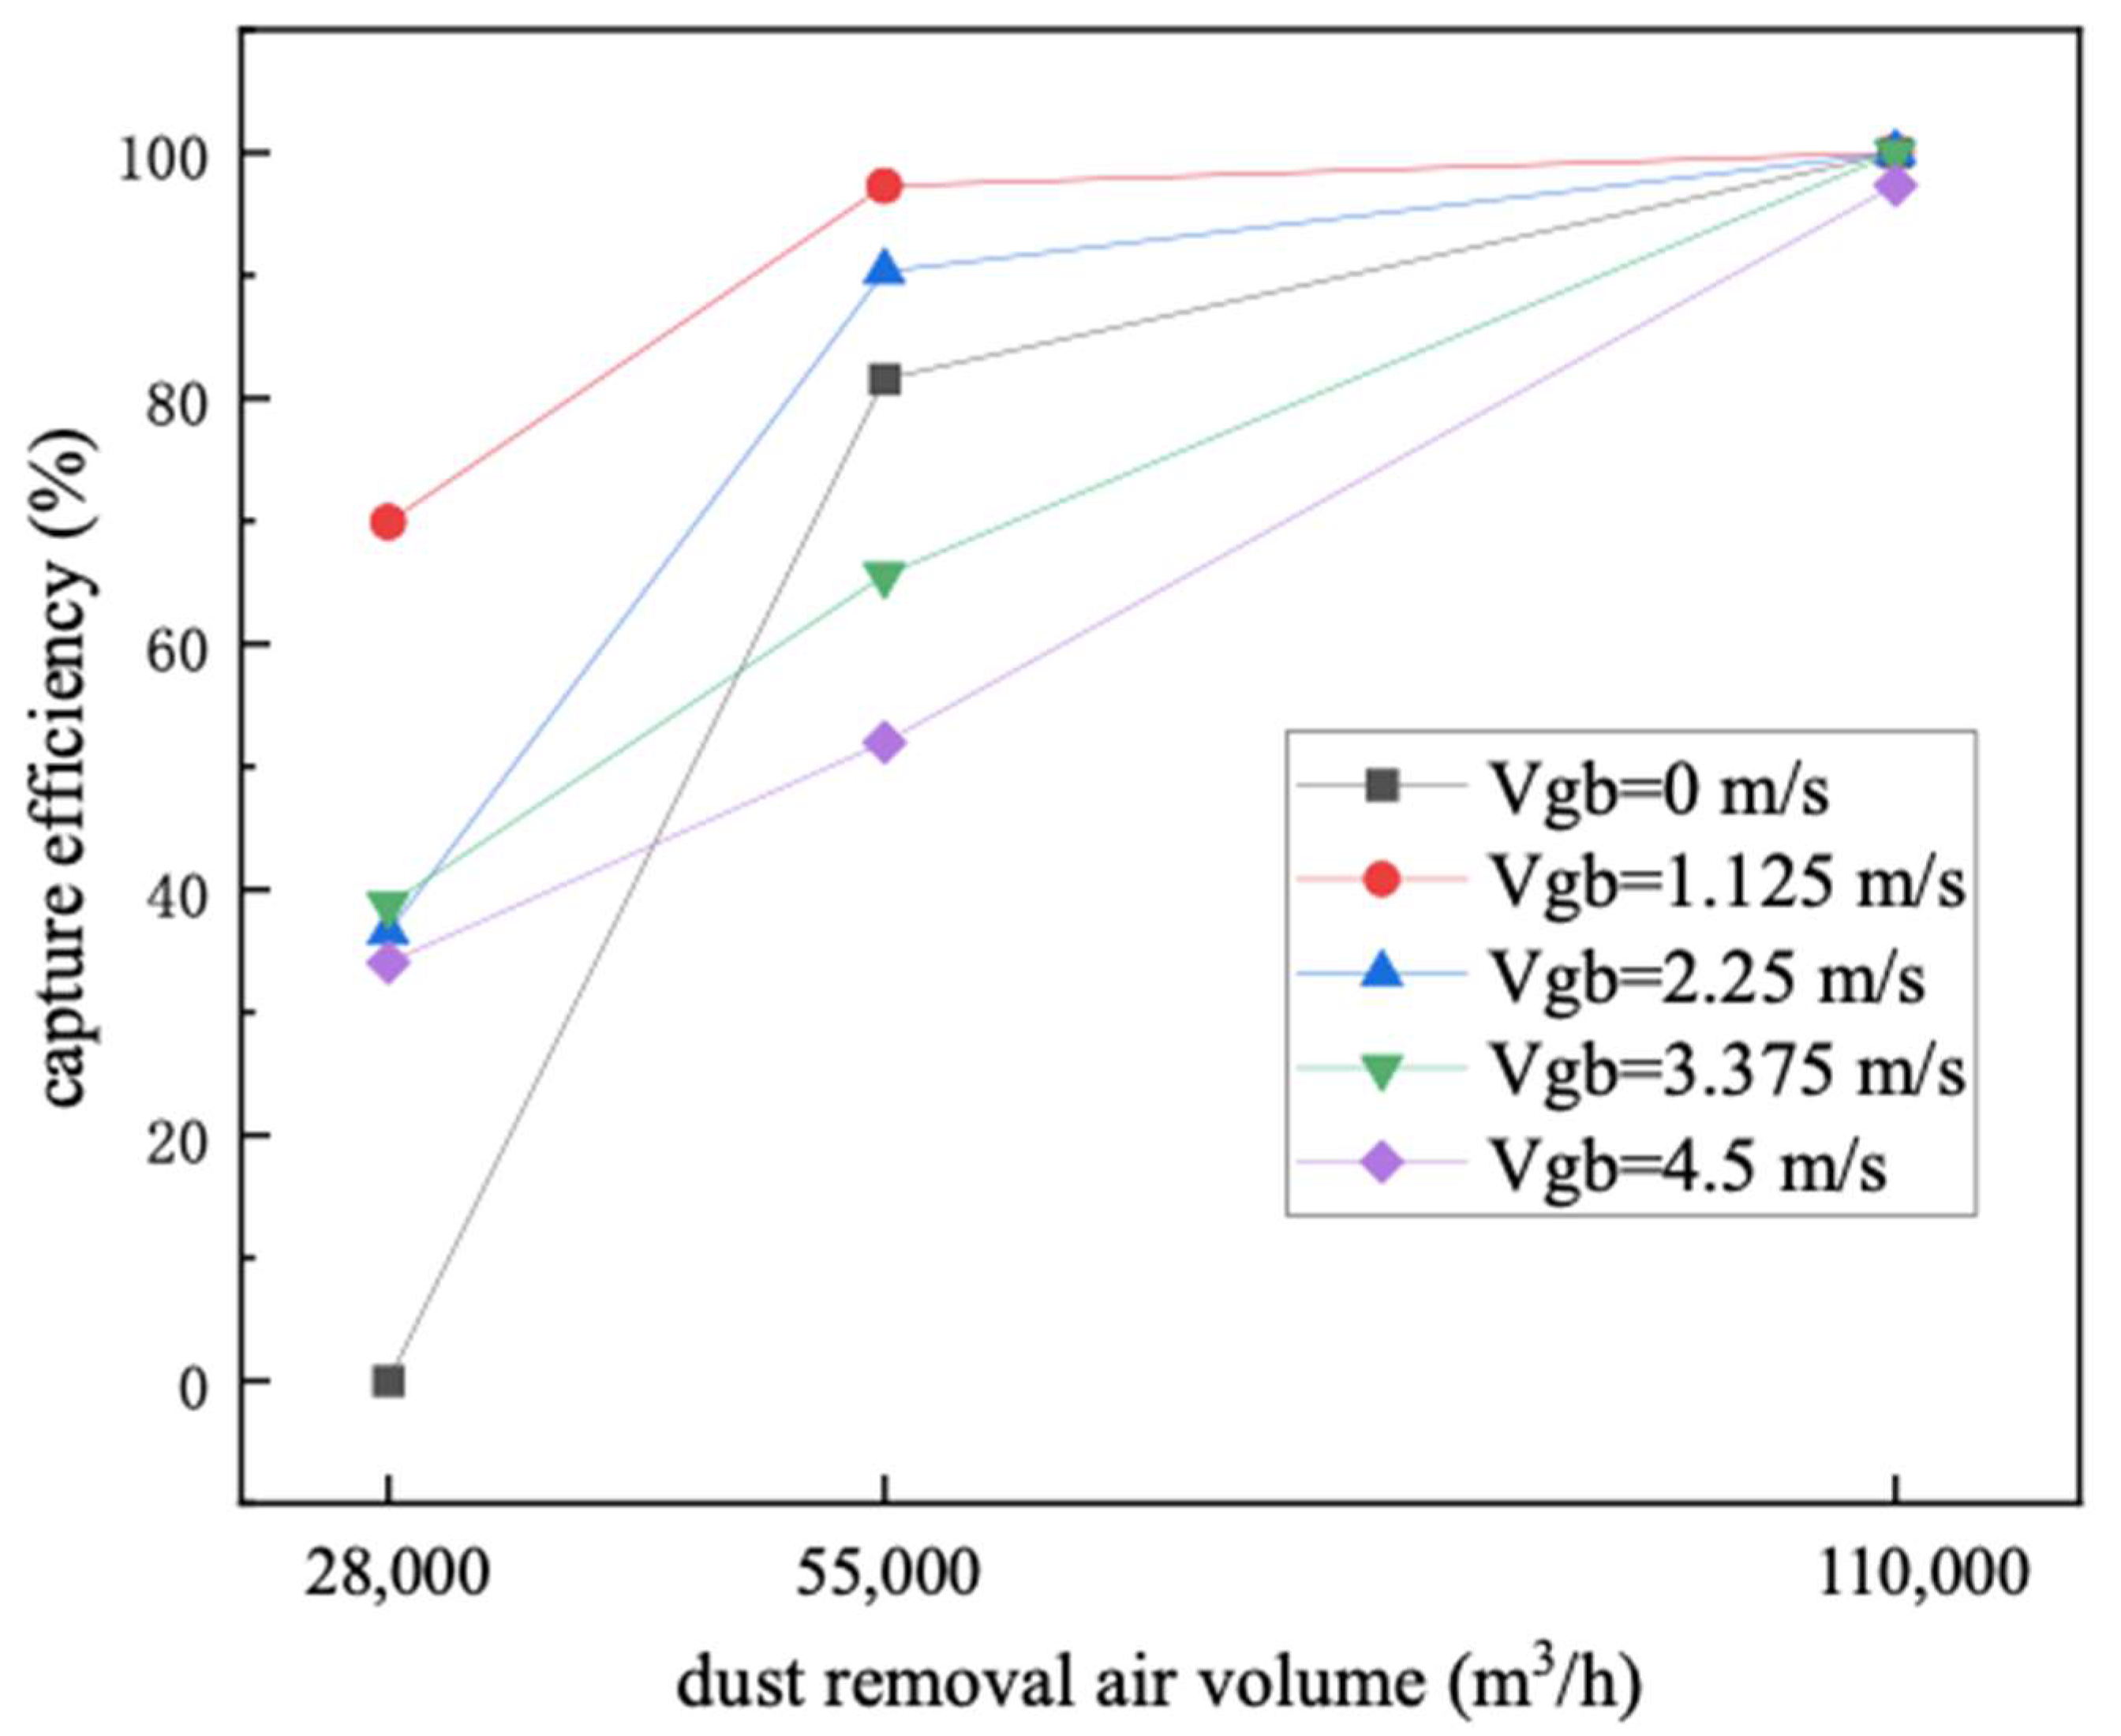
4.5.3. Effect of Dust Removal Air Volume on Capture Efficiency

When α = 60° and H = 2.4 m, and the dust removal air volume is Q = 28,000 m3/h, 55,000 m3/h, and 110,000 m3/h, the change in dust capture efficiency under different initial velocities of ladle plume dust is shown in Figure 16. When Vgb = 0, the dust removal air volume increases from 28,000 m3/h to 55,000 m3/h, and the collection efficiency increases from 0 to 81.54%, indicating that increasing the dust removal air volume will indeed improve the collection efficiency.
When Q = 11,000 m3/h and Vgb < 4.5 m/s, the collection efficiency of soot reaches 100%, and the jet soot is affected by the plume soot and the suction of the dust hood, and the trajectory shifts to the area of the dust hood. Taking Vgb = 2.25 m/s as an example, the velocity distribution cloud diagram and particle trajectory of the y = 0 section are shown in Figure 17 and Figure 18a, respectively. When Vgb = 4.5 m/s, the dust removal air volume is slightly larger than the sum of the flue gas volume generated by the outlet jet and the ladle plume, which is 108,188.21 m3/h. During the suction process, a small amount of surrounding air is entrained, and part of the flue gas carries the soot and escapes along the edge of the dust hood, as shown in Figure 18b, resulting in a collection efficiency not reaching 100%. When Q = 55,000 m3/h and Vgb > 2.25 m/s, the collection efficiency is low, the dust removal air volume is too small to completely inhale the jet and plume flue gas, and the flue dust follows the high-temperature flue gas into the dust hood and then escapes outwards, distributed on both sides of the outside of the dust hood (shown in Figure 19).
Under different conditions, the dust removal air volume reaches a certain value and then continues to increase, which will not further improve the dust removal effect. At this time, blindly increasing the dust removal air volume will increase the energy consumption of the fan, so the best dust removal air volume is 110,000 m3/h.

5. Conclusions

In this paper, aiming at the unorganized emission of smoke and dust at the outlet of an actual electric furnace steelmaking workshop, ANSYS 2021 Fluent software is used to simulate the movement of unorganized emission of smoke and dust during the tapping period under the top dust collector. The conclusions are as follows:
(1)
The comprehensive weights of the four fugitive emission positions of the furnace door, feeding port, electrode hole and tapping port of the electric furnace are 0.102, 0.285, 0.114 and 0.498, respectively. Among them, the positions of the feeding port and the steel outlet account for a relatively large weight, and the sum of the two weights can reach 0.783.
(2)
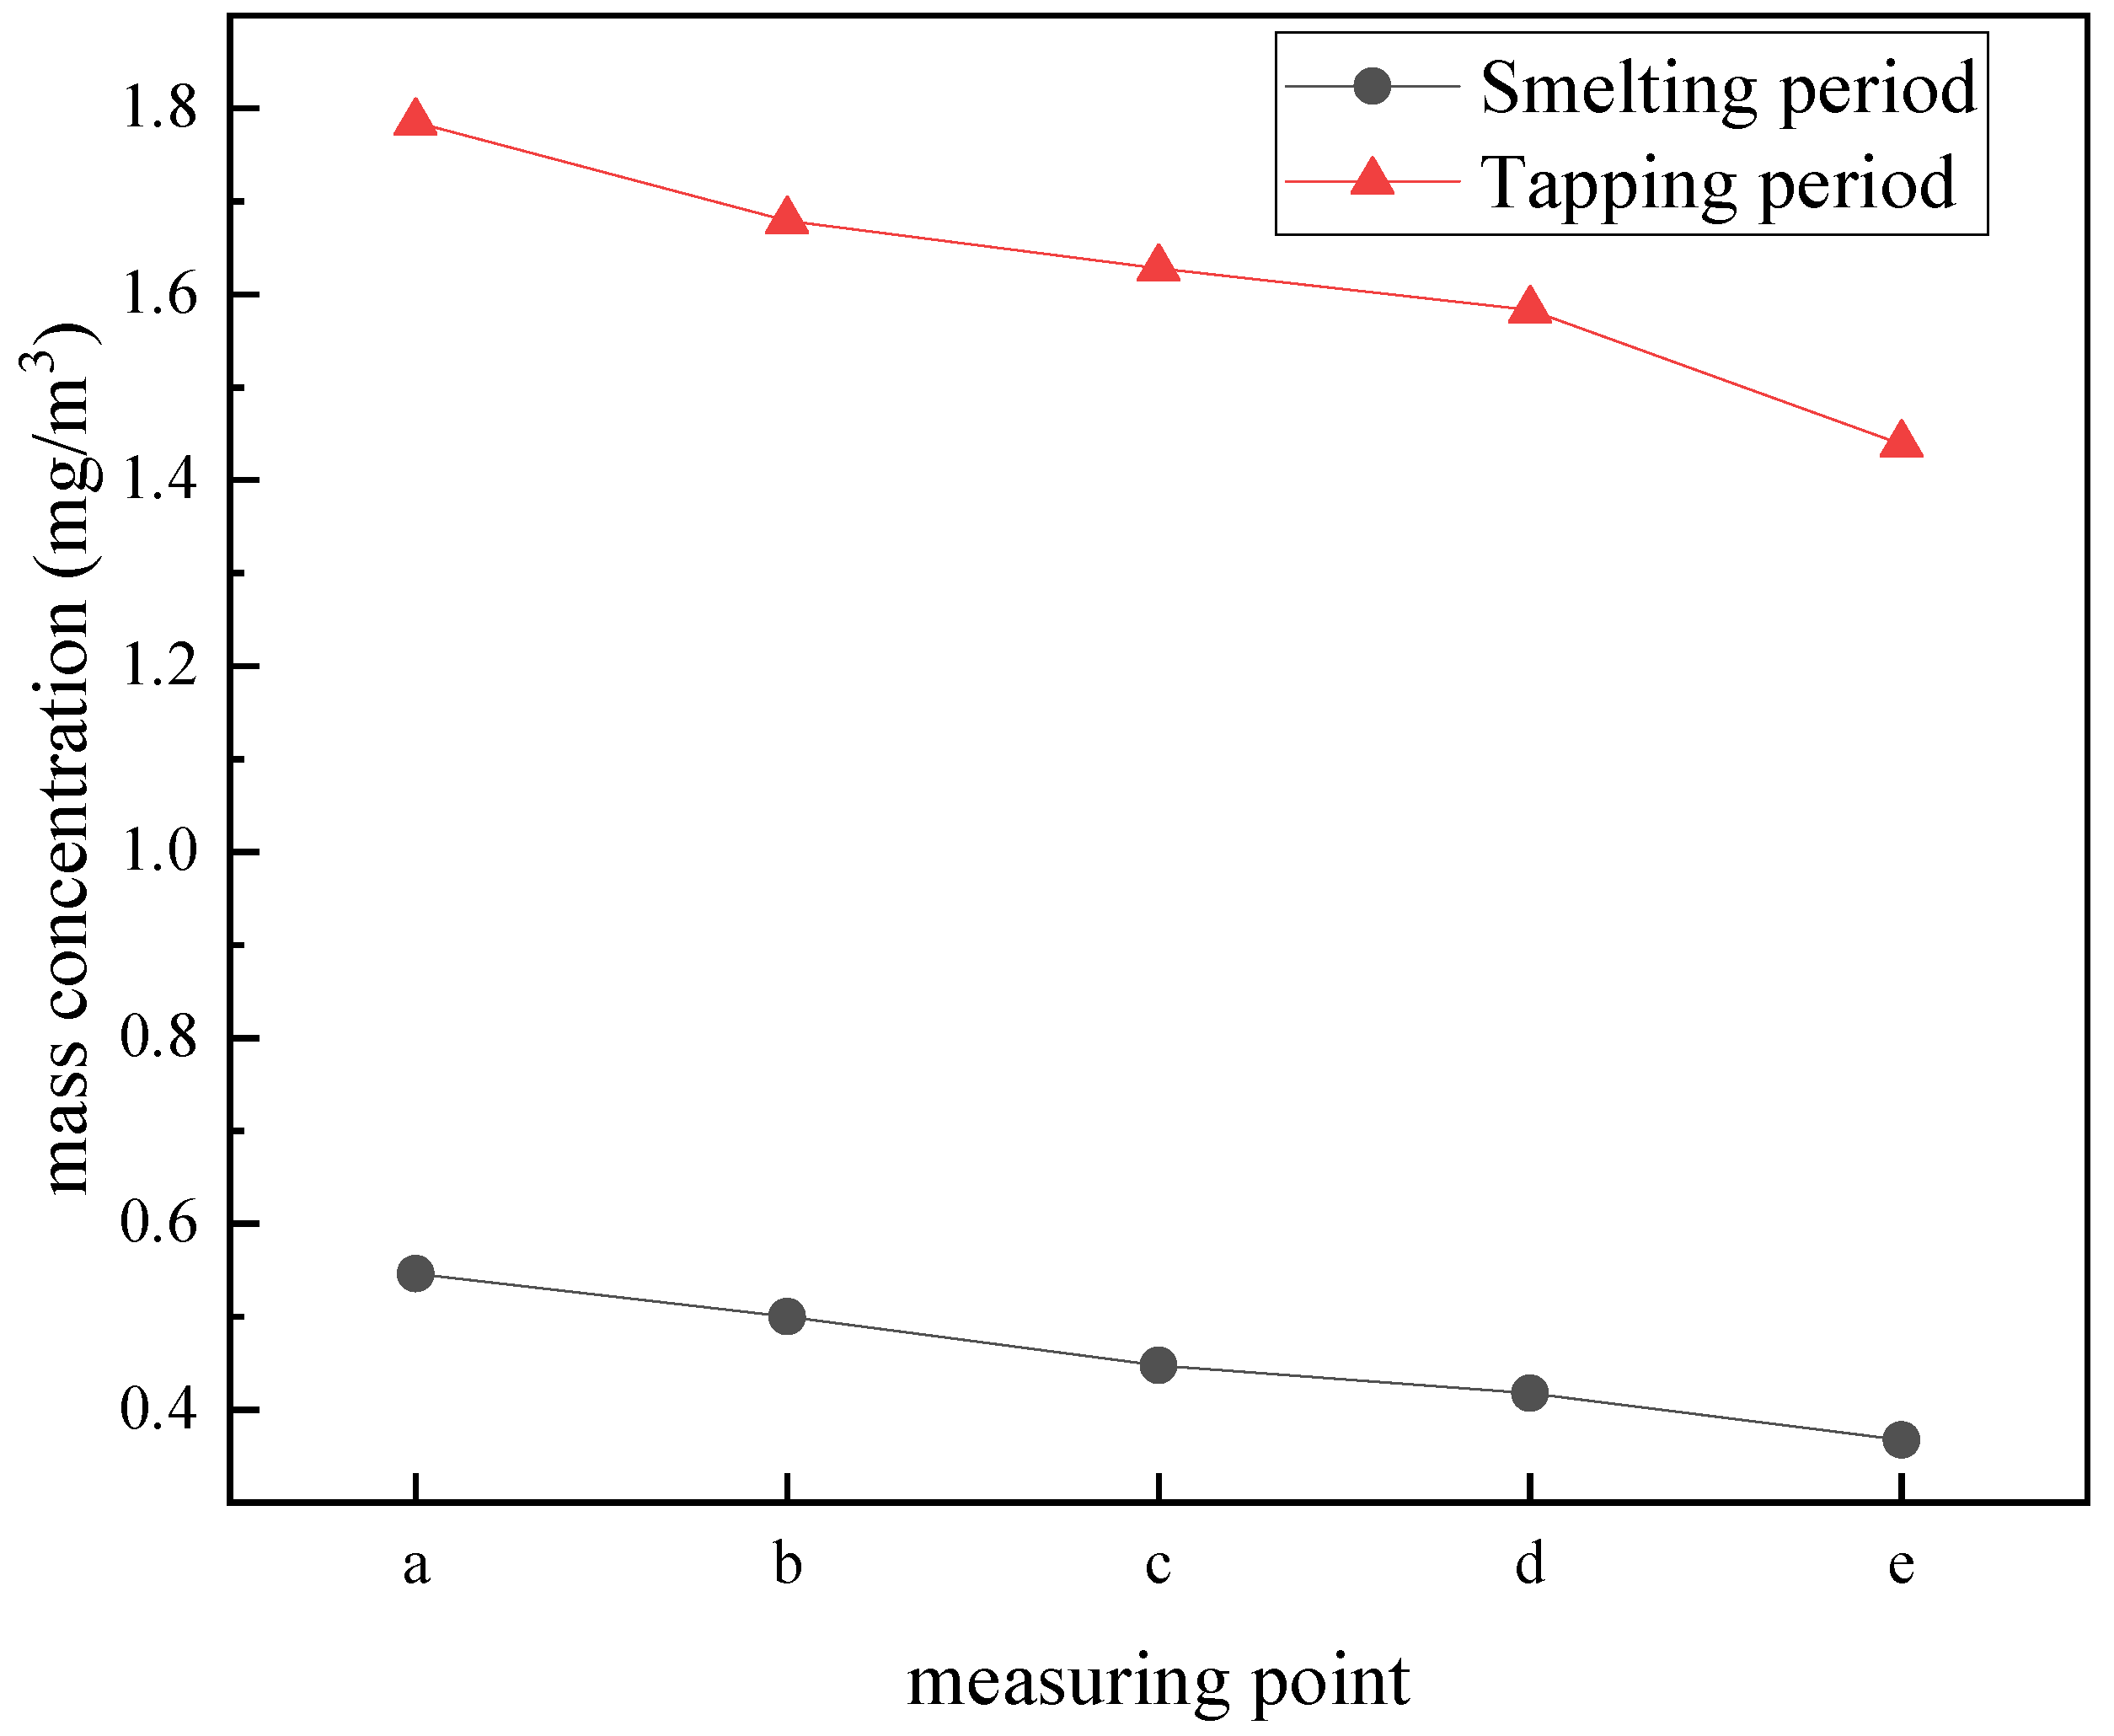
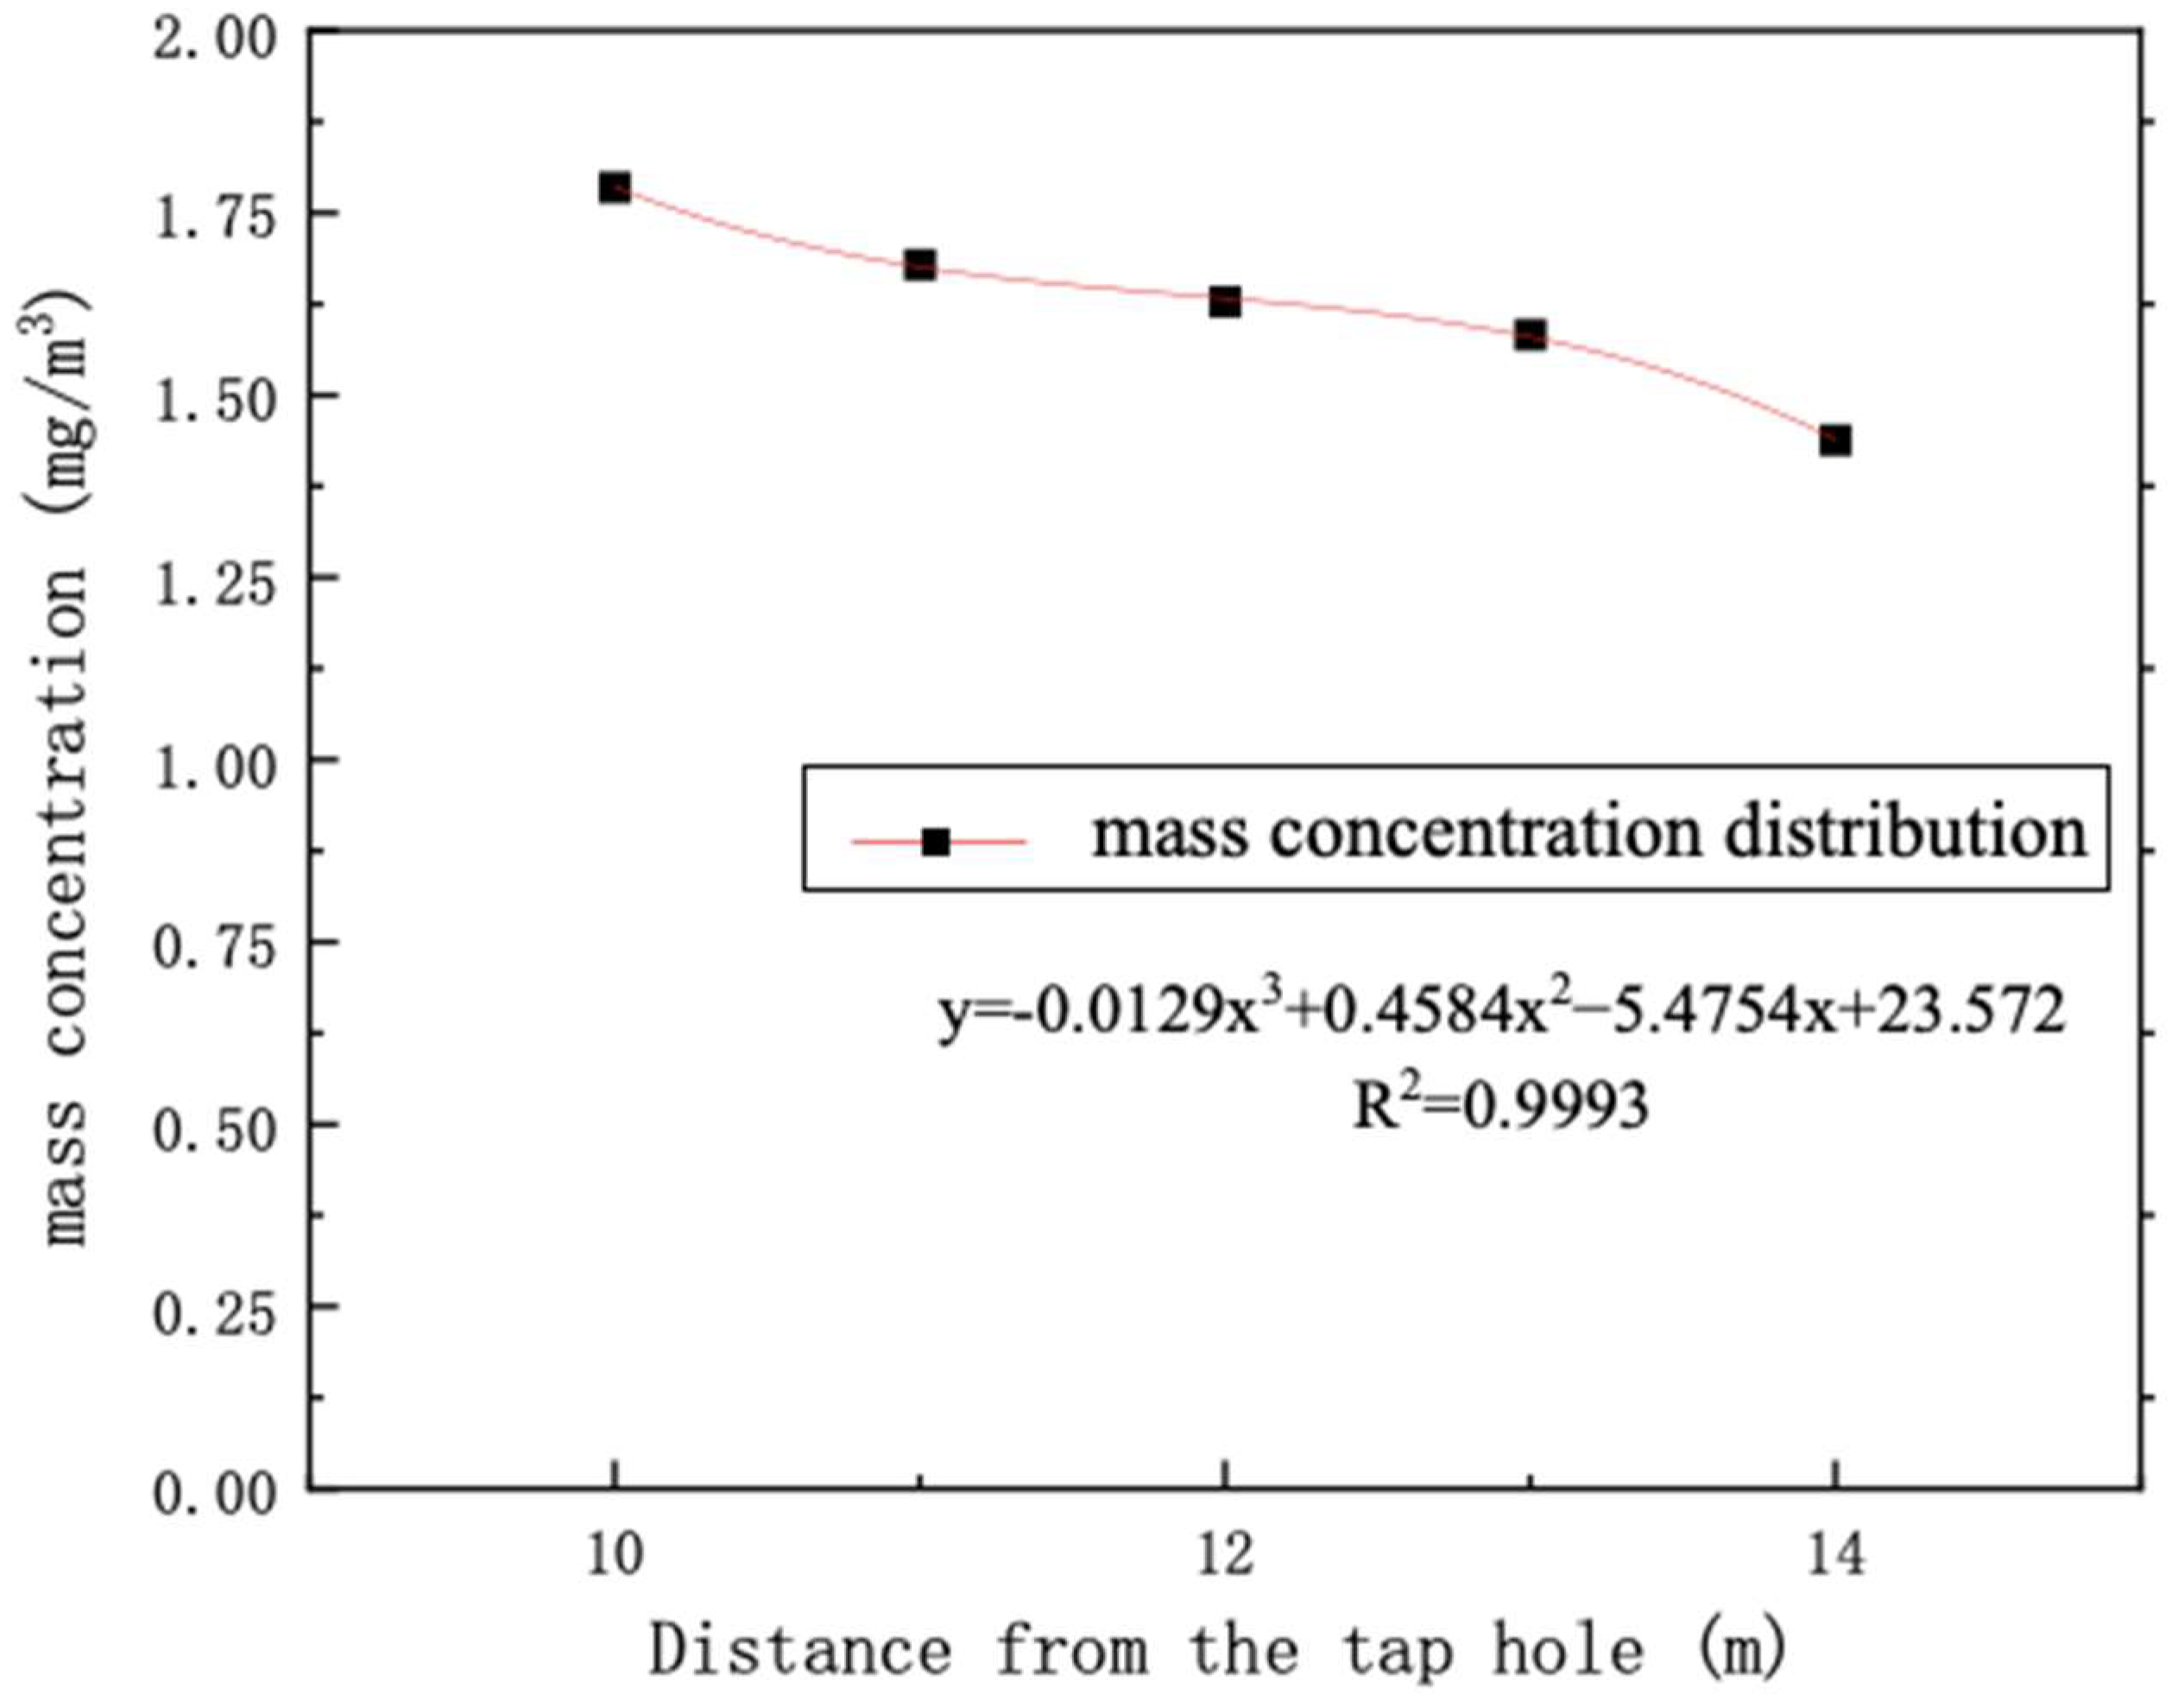
During the tapping period, the mass concentration of dust at each measuring point increased by 1.17 mg/m3 on average, and the concentration of unorganized emission dust near the outlet was 23.57 mg/m3. The paroxysmal unorganized emission dust generated during the tapping period would be scattered in the workshop.
(3)
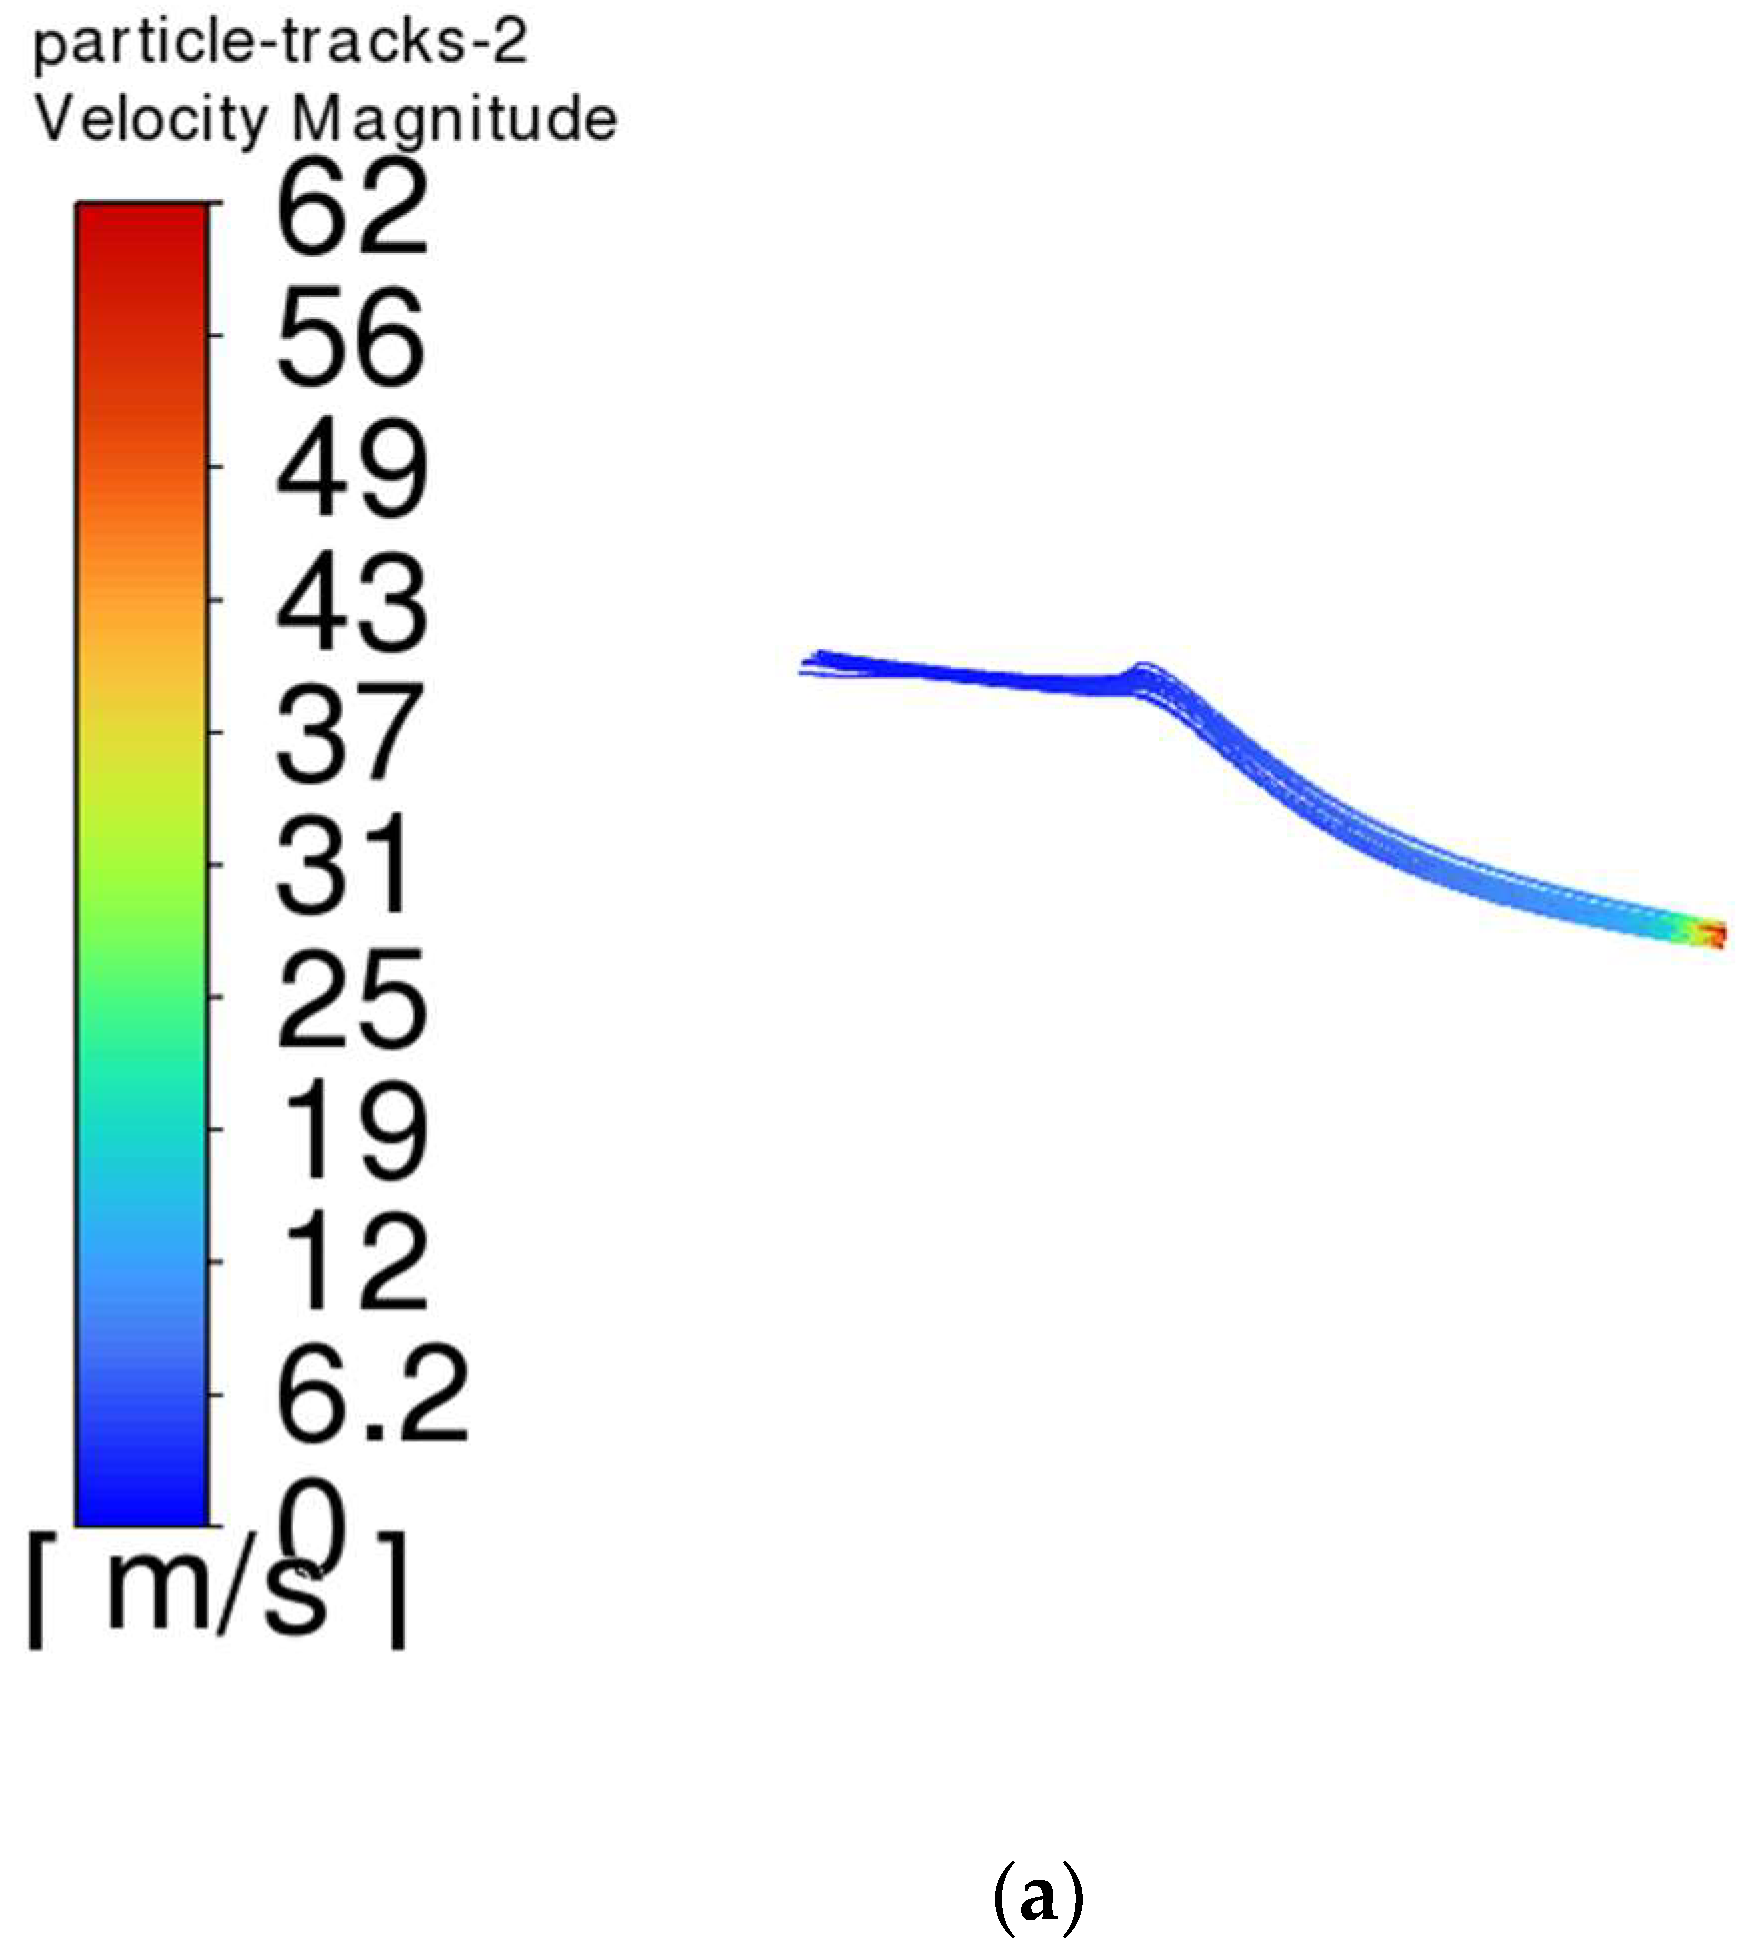
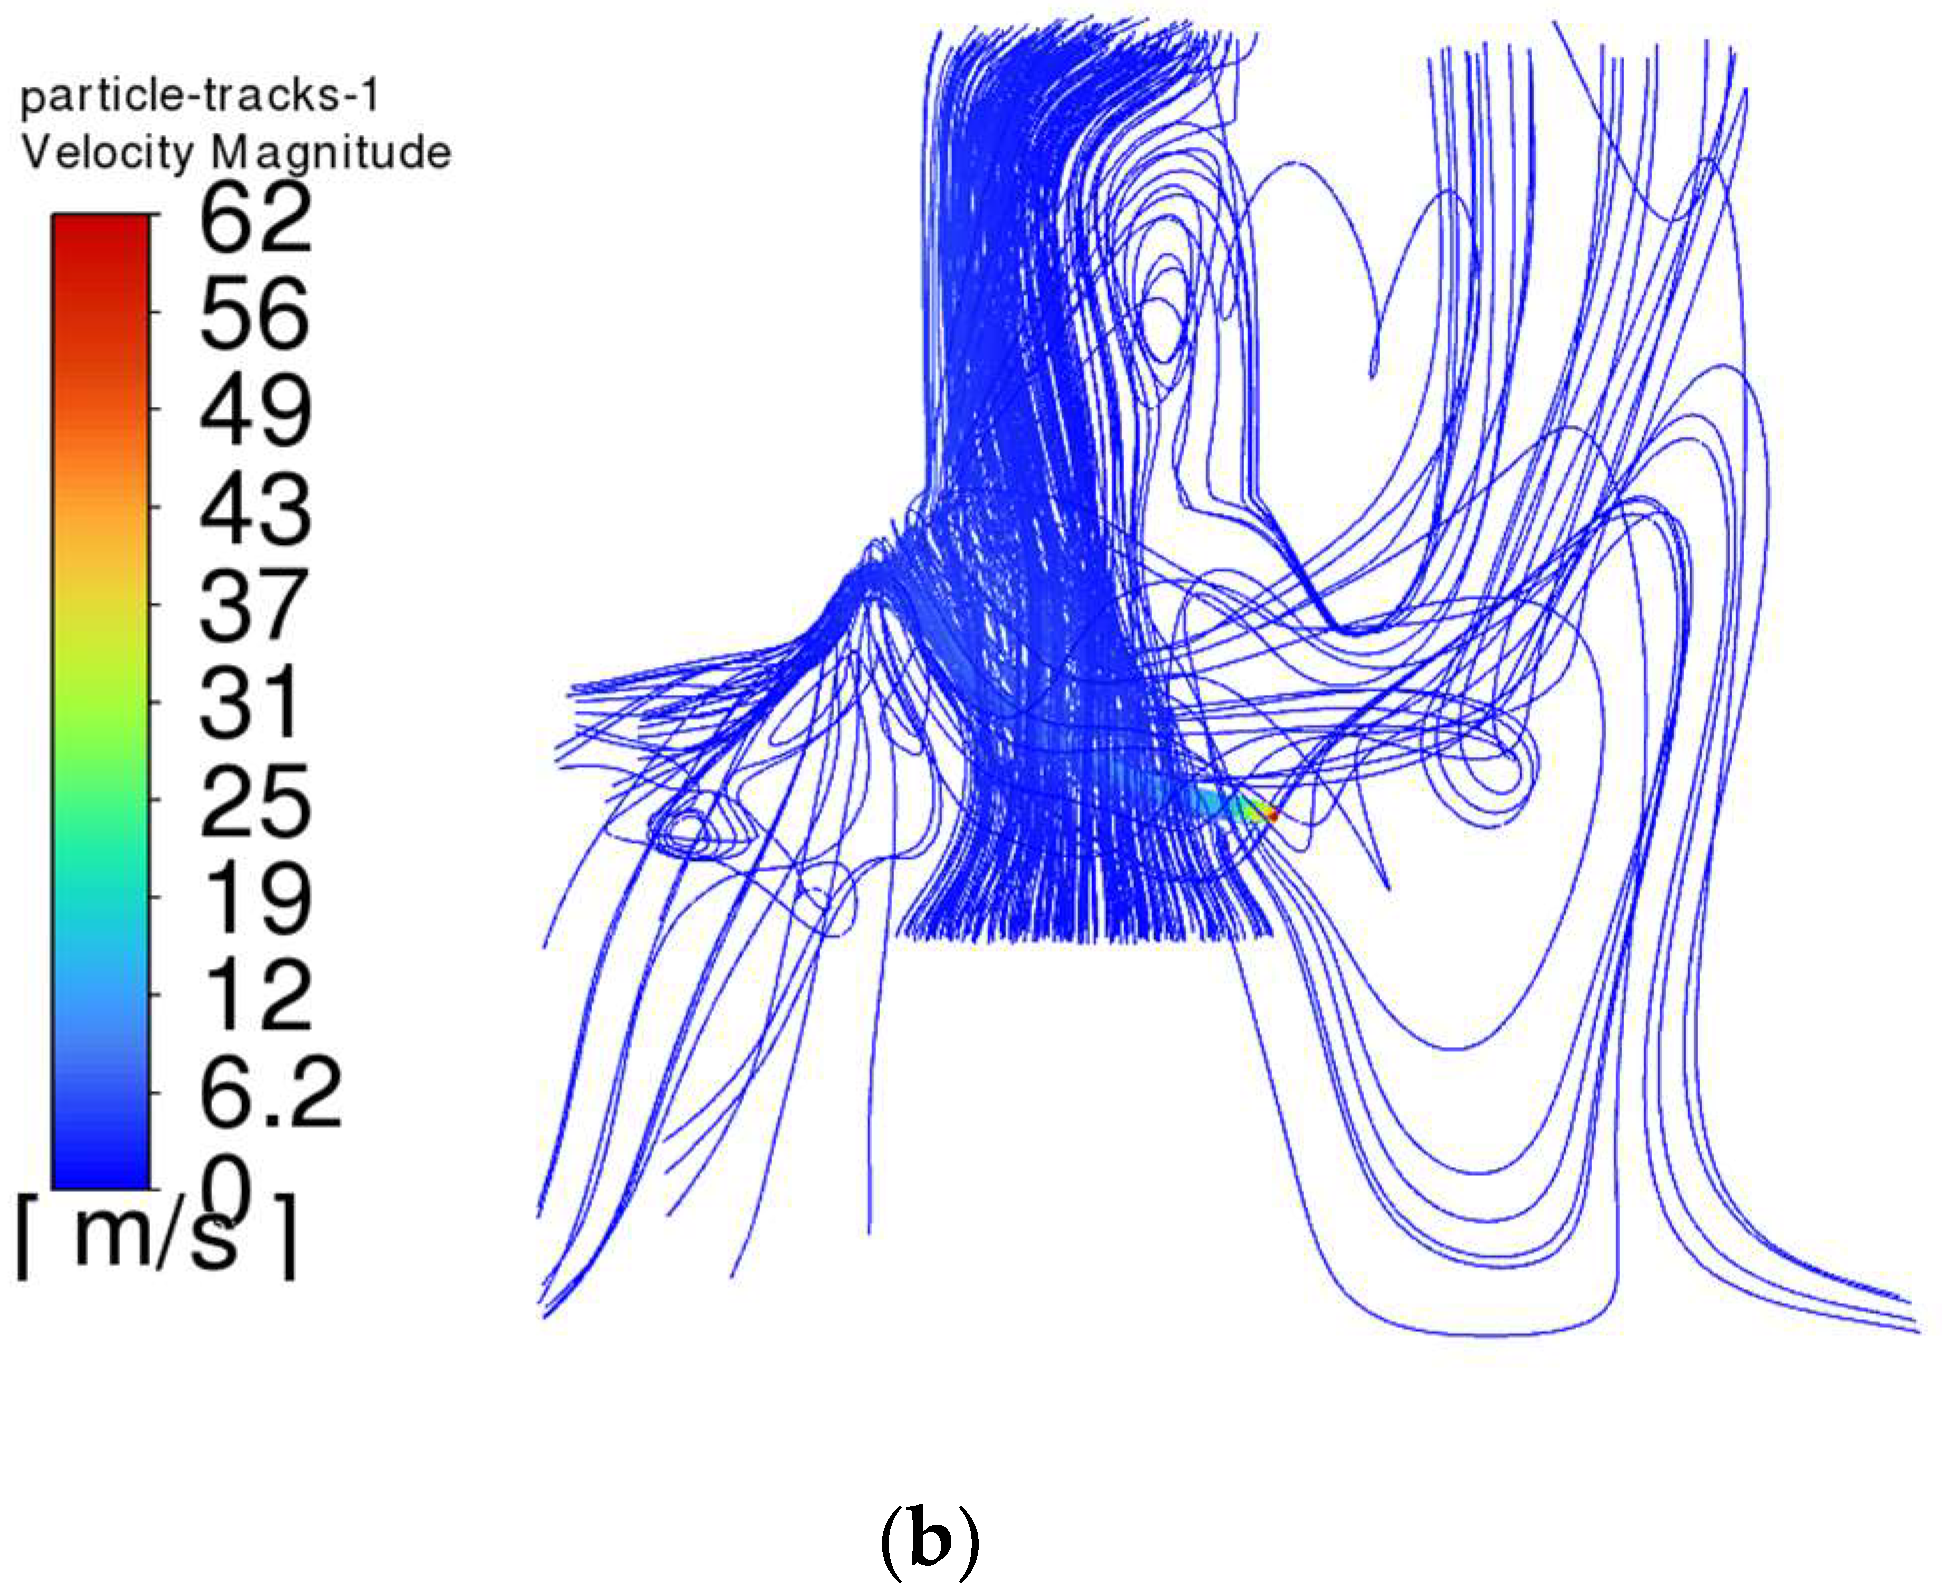
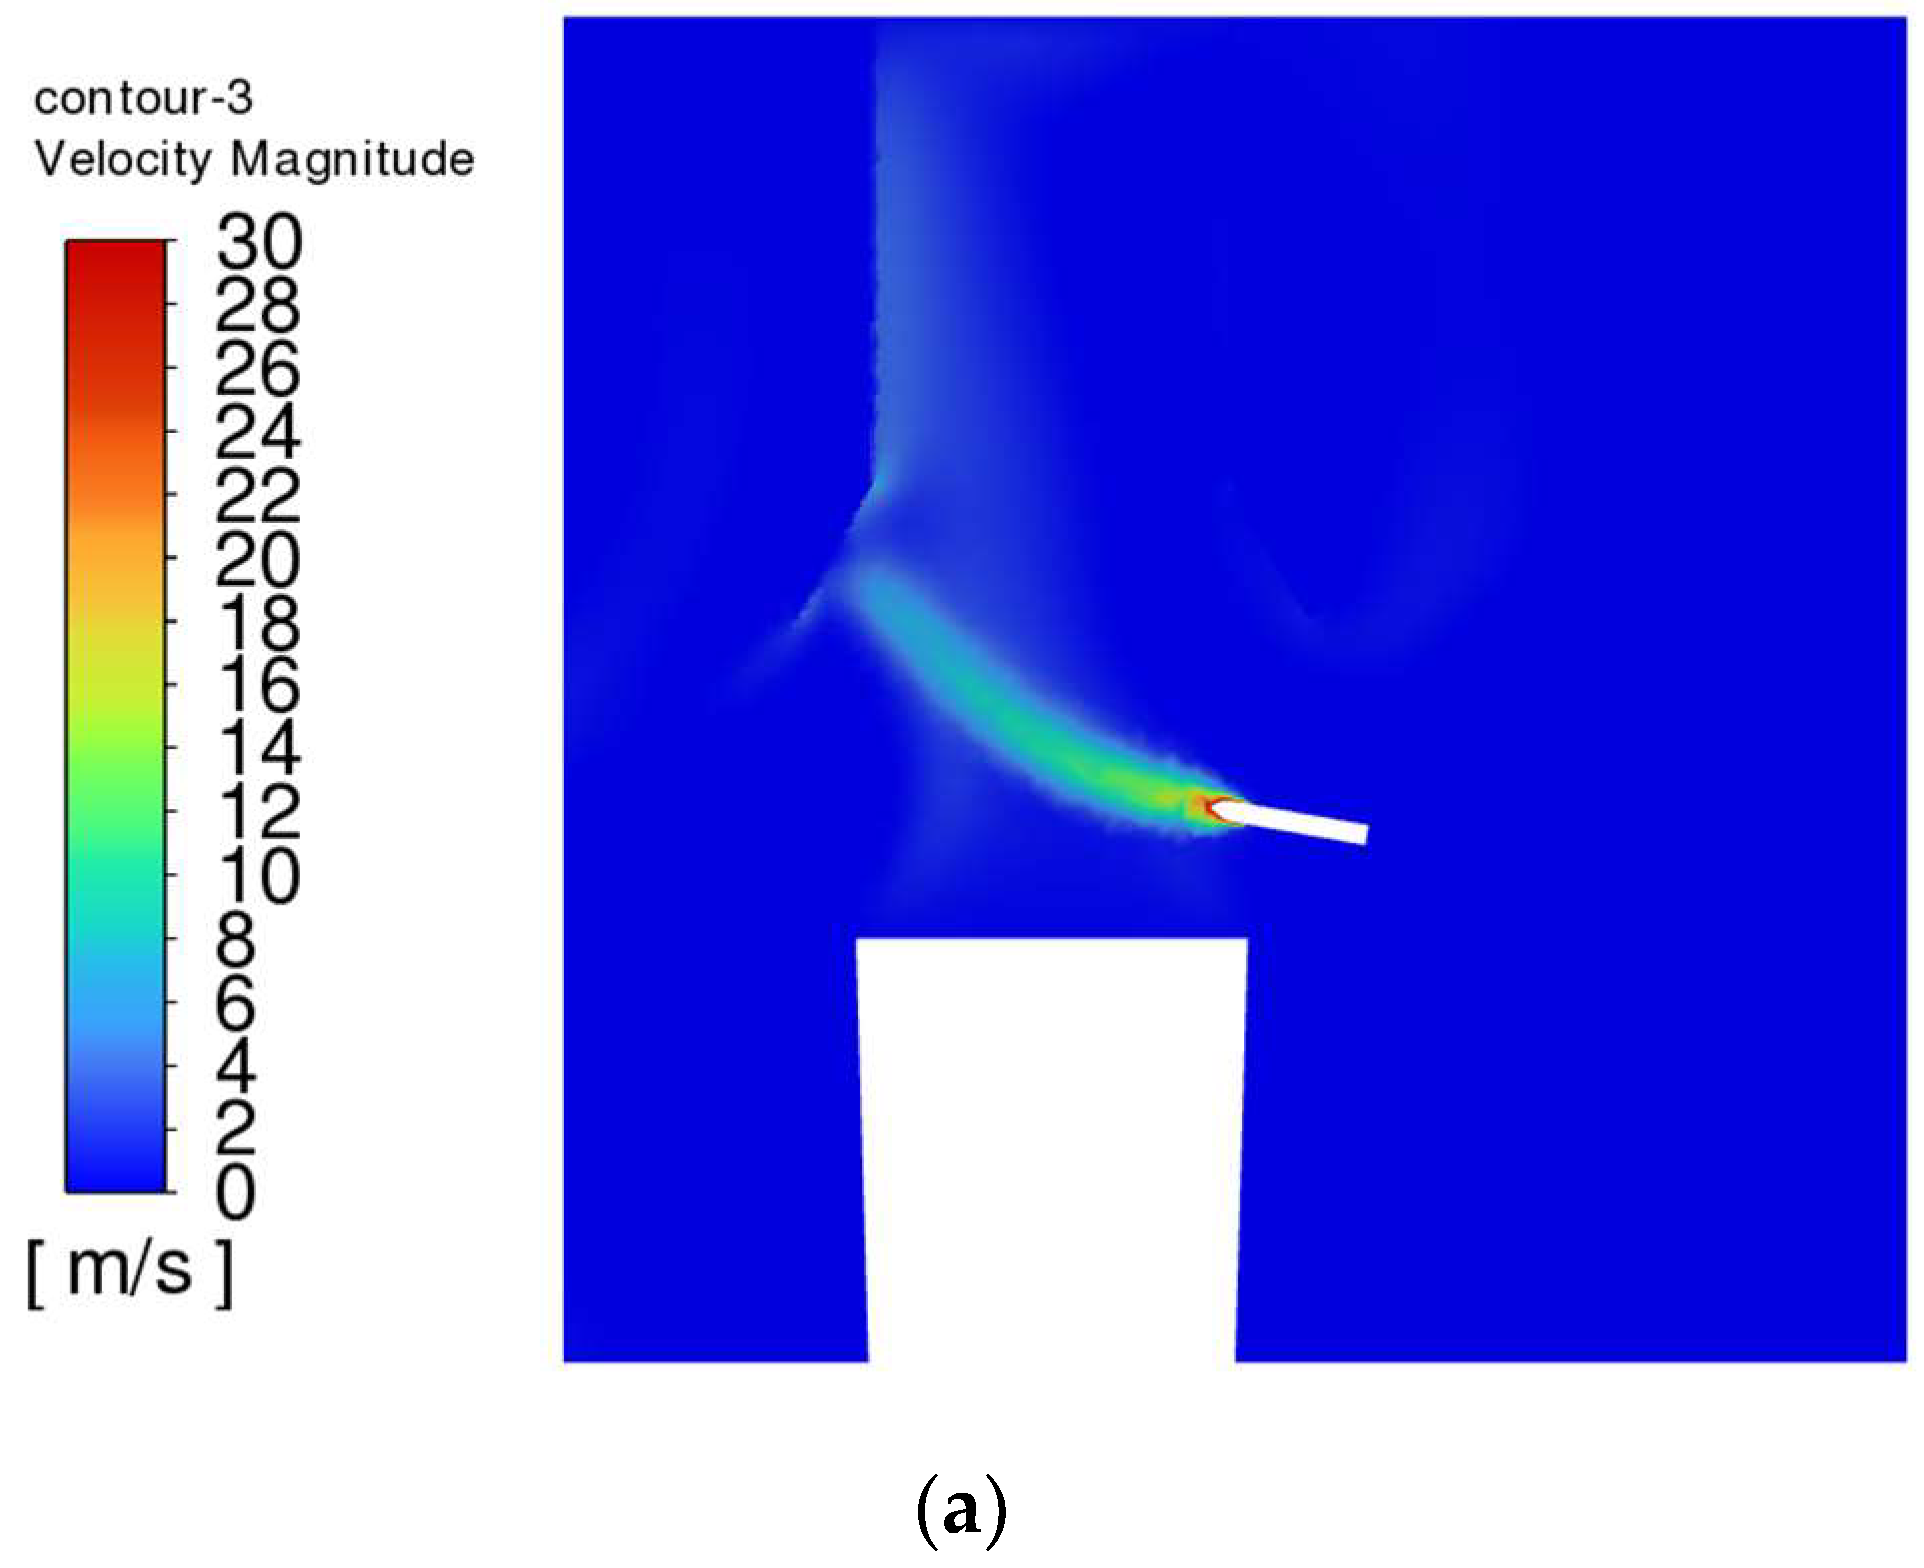
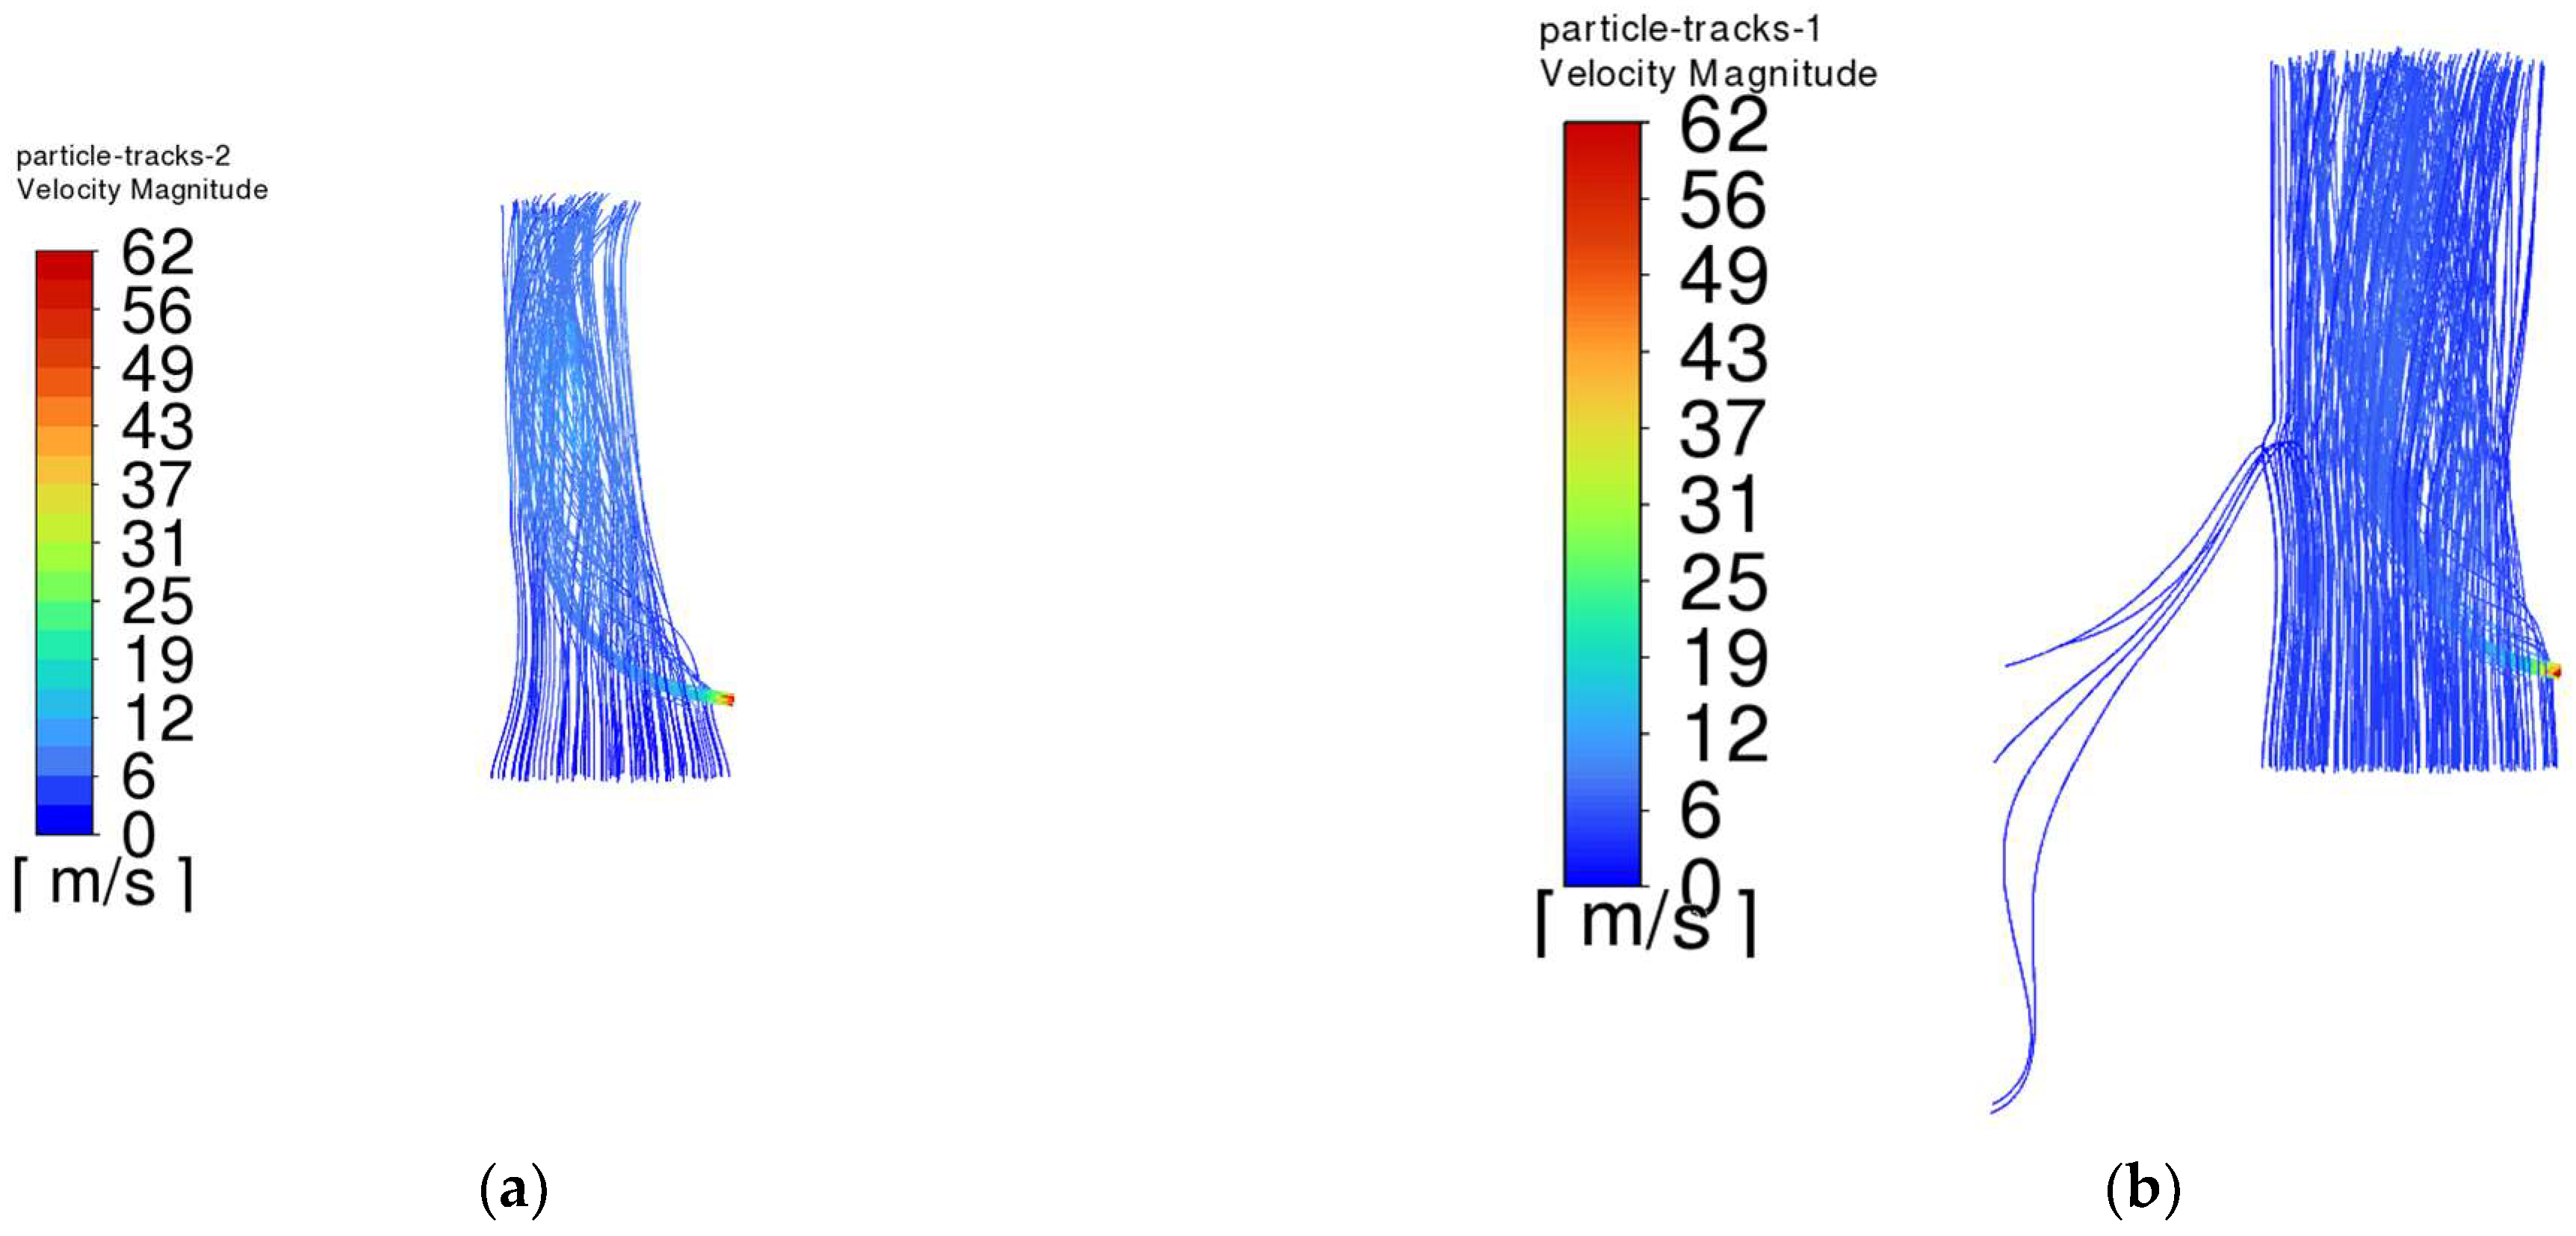
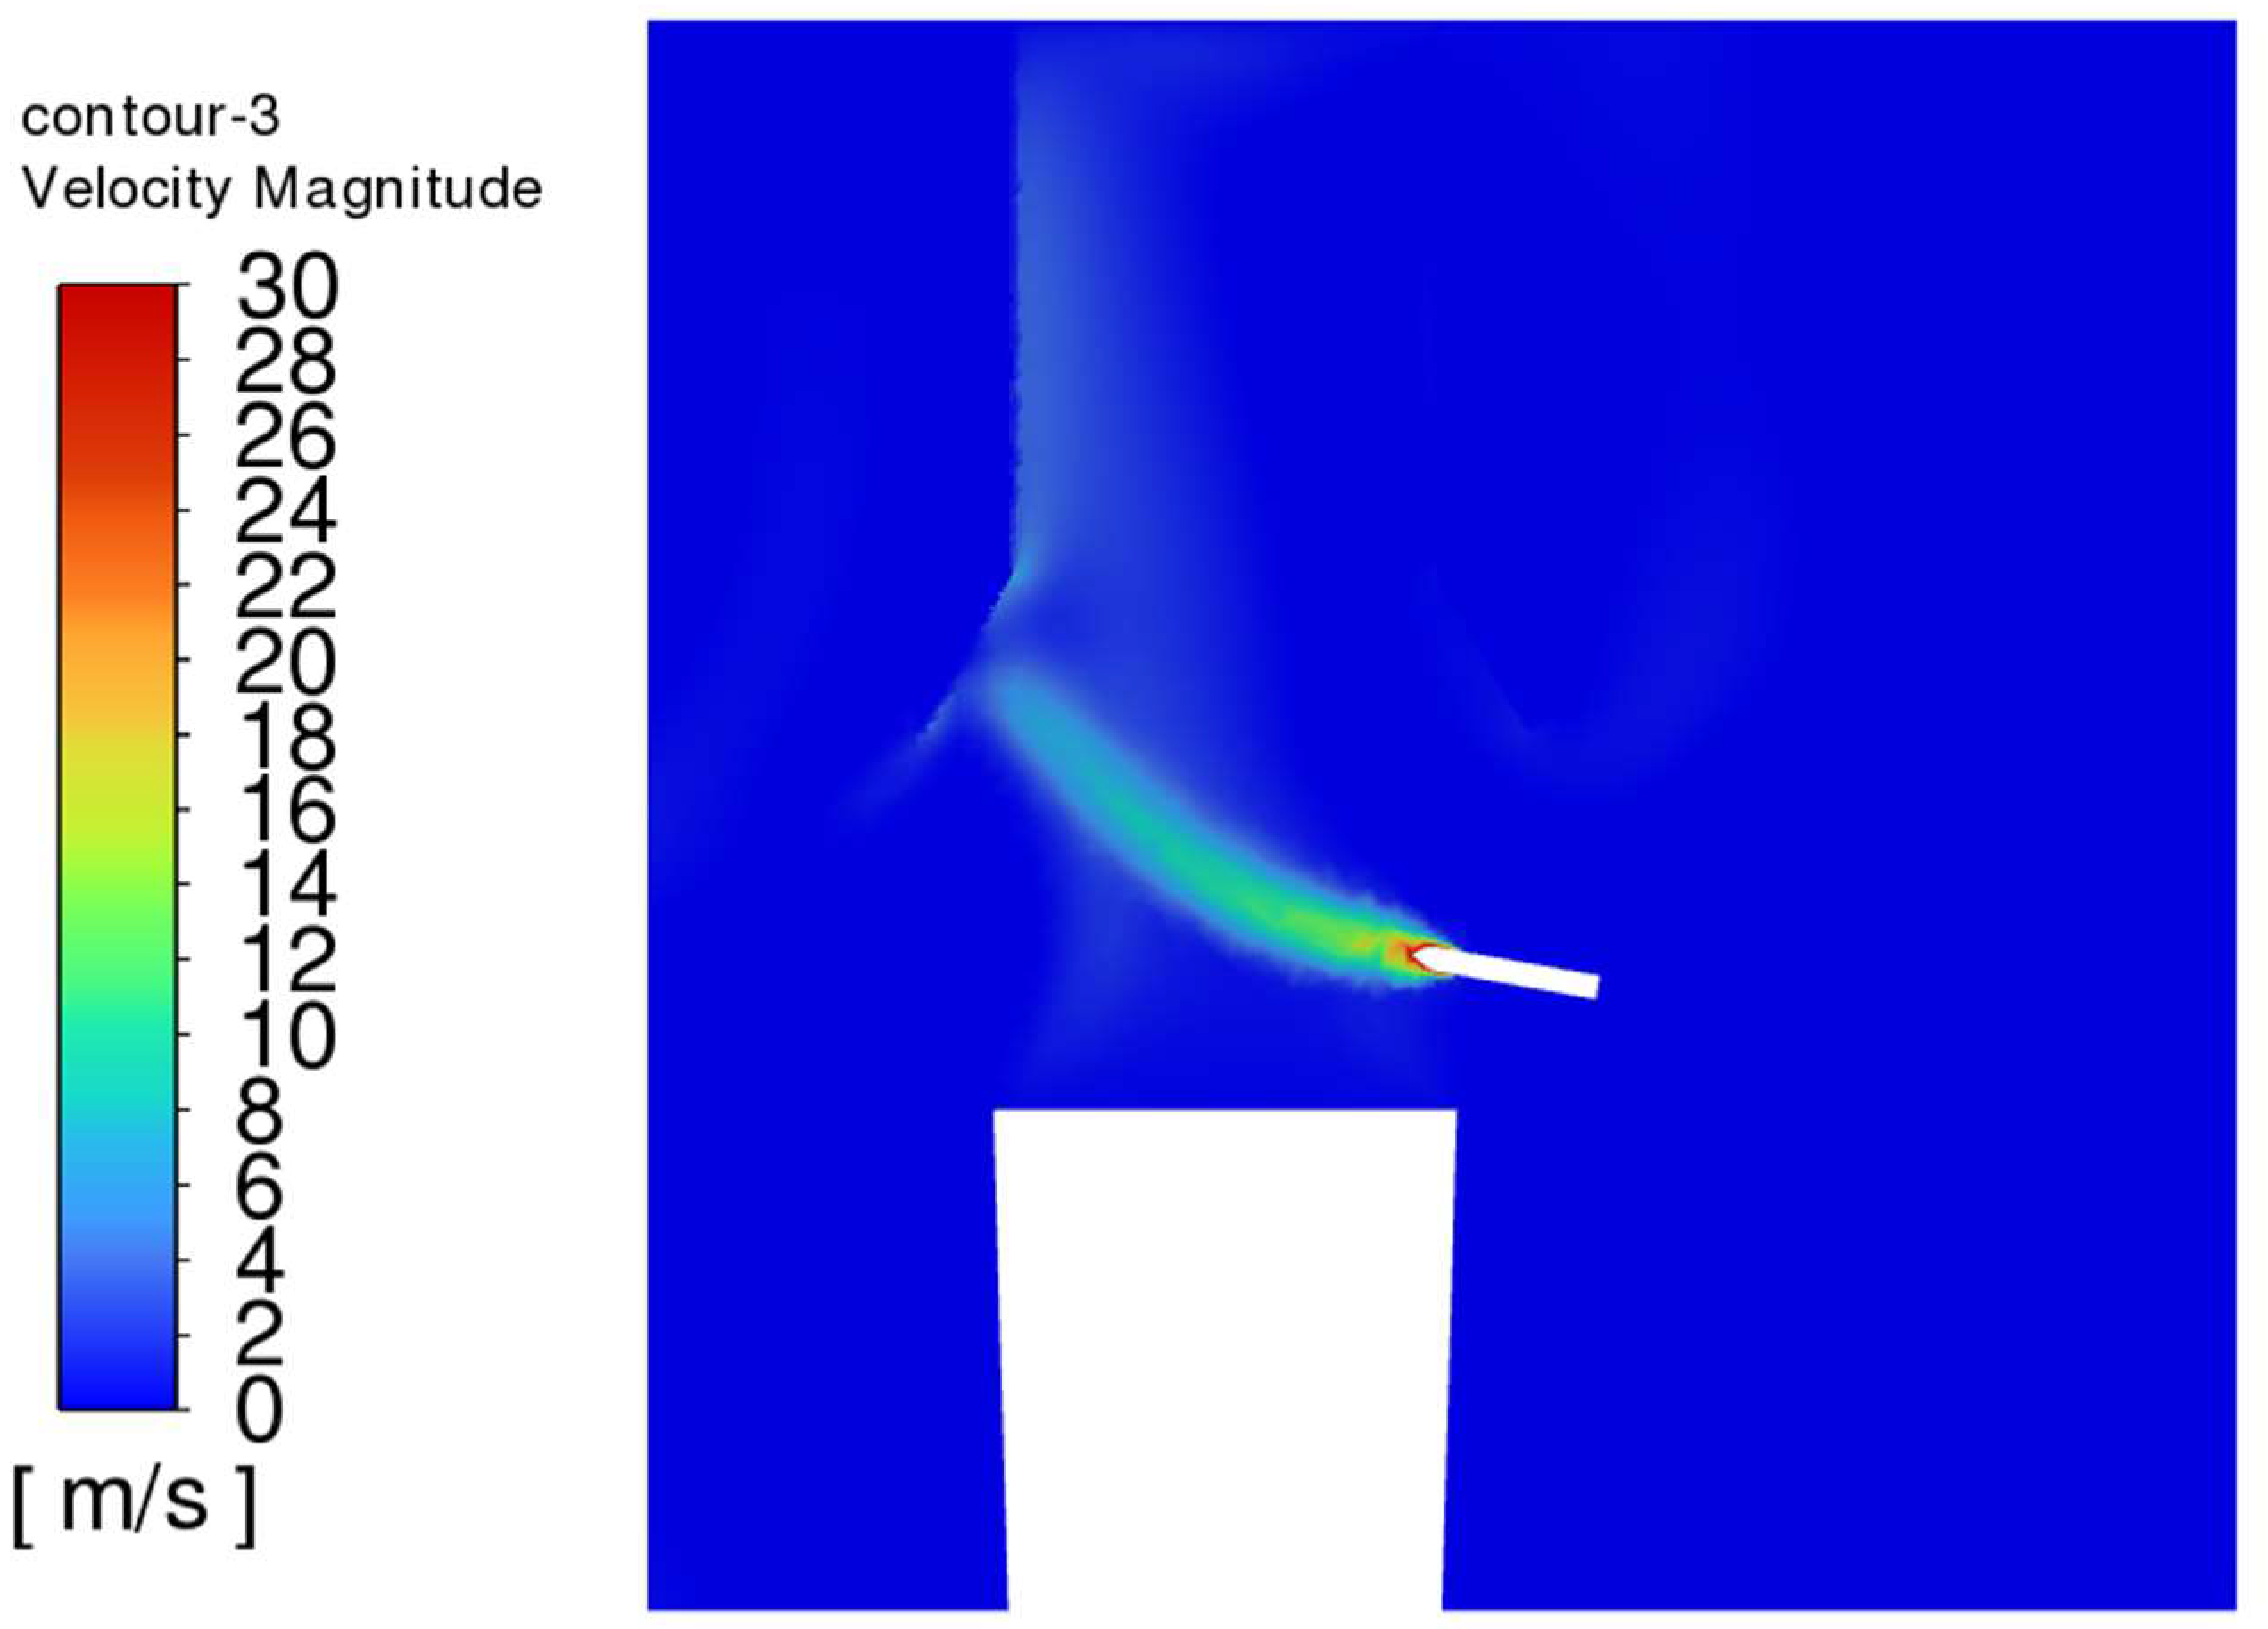
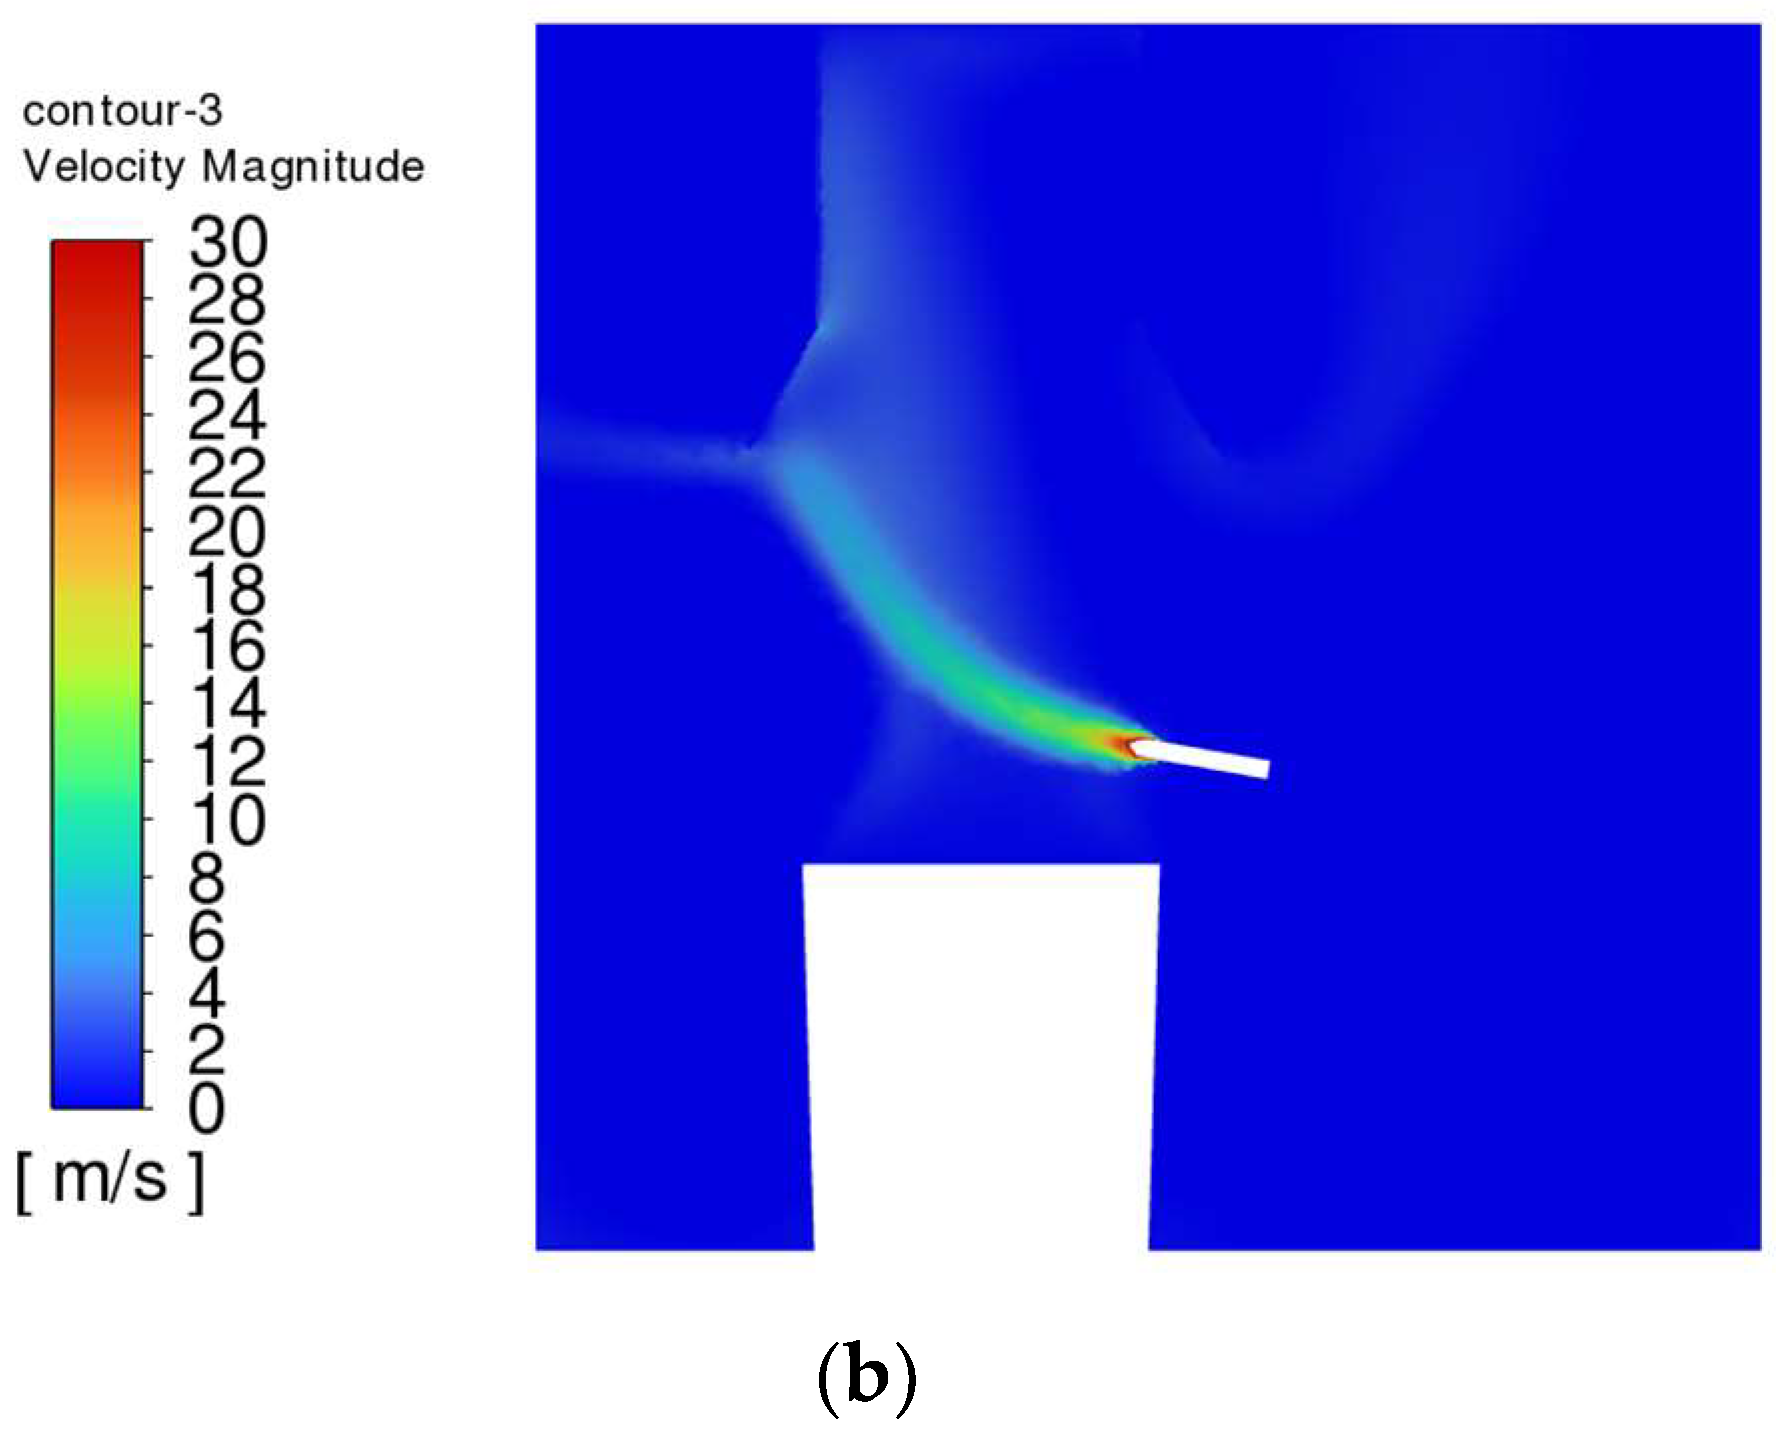
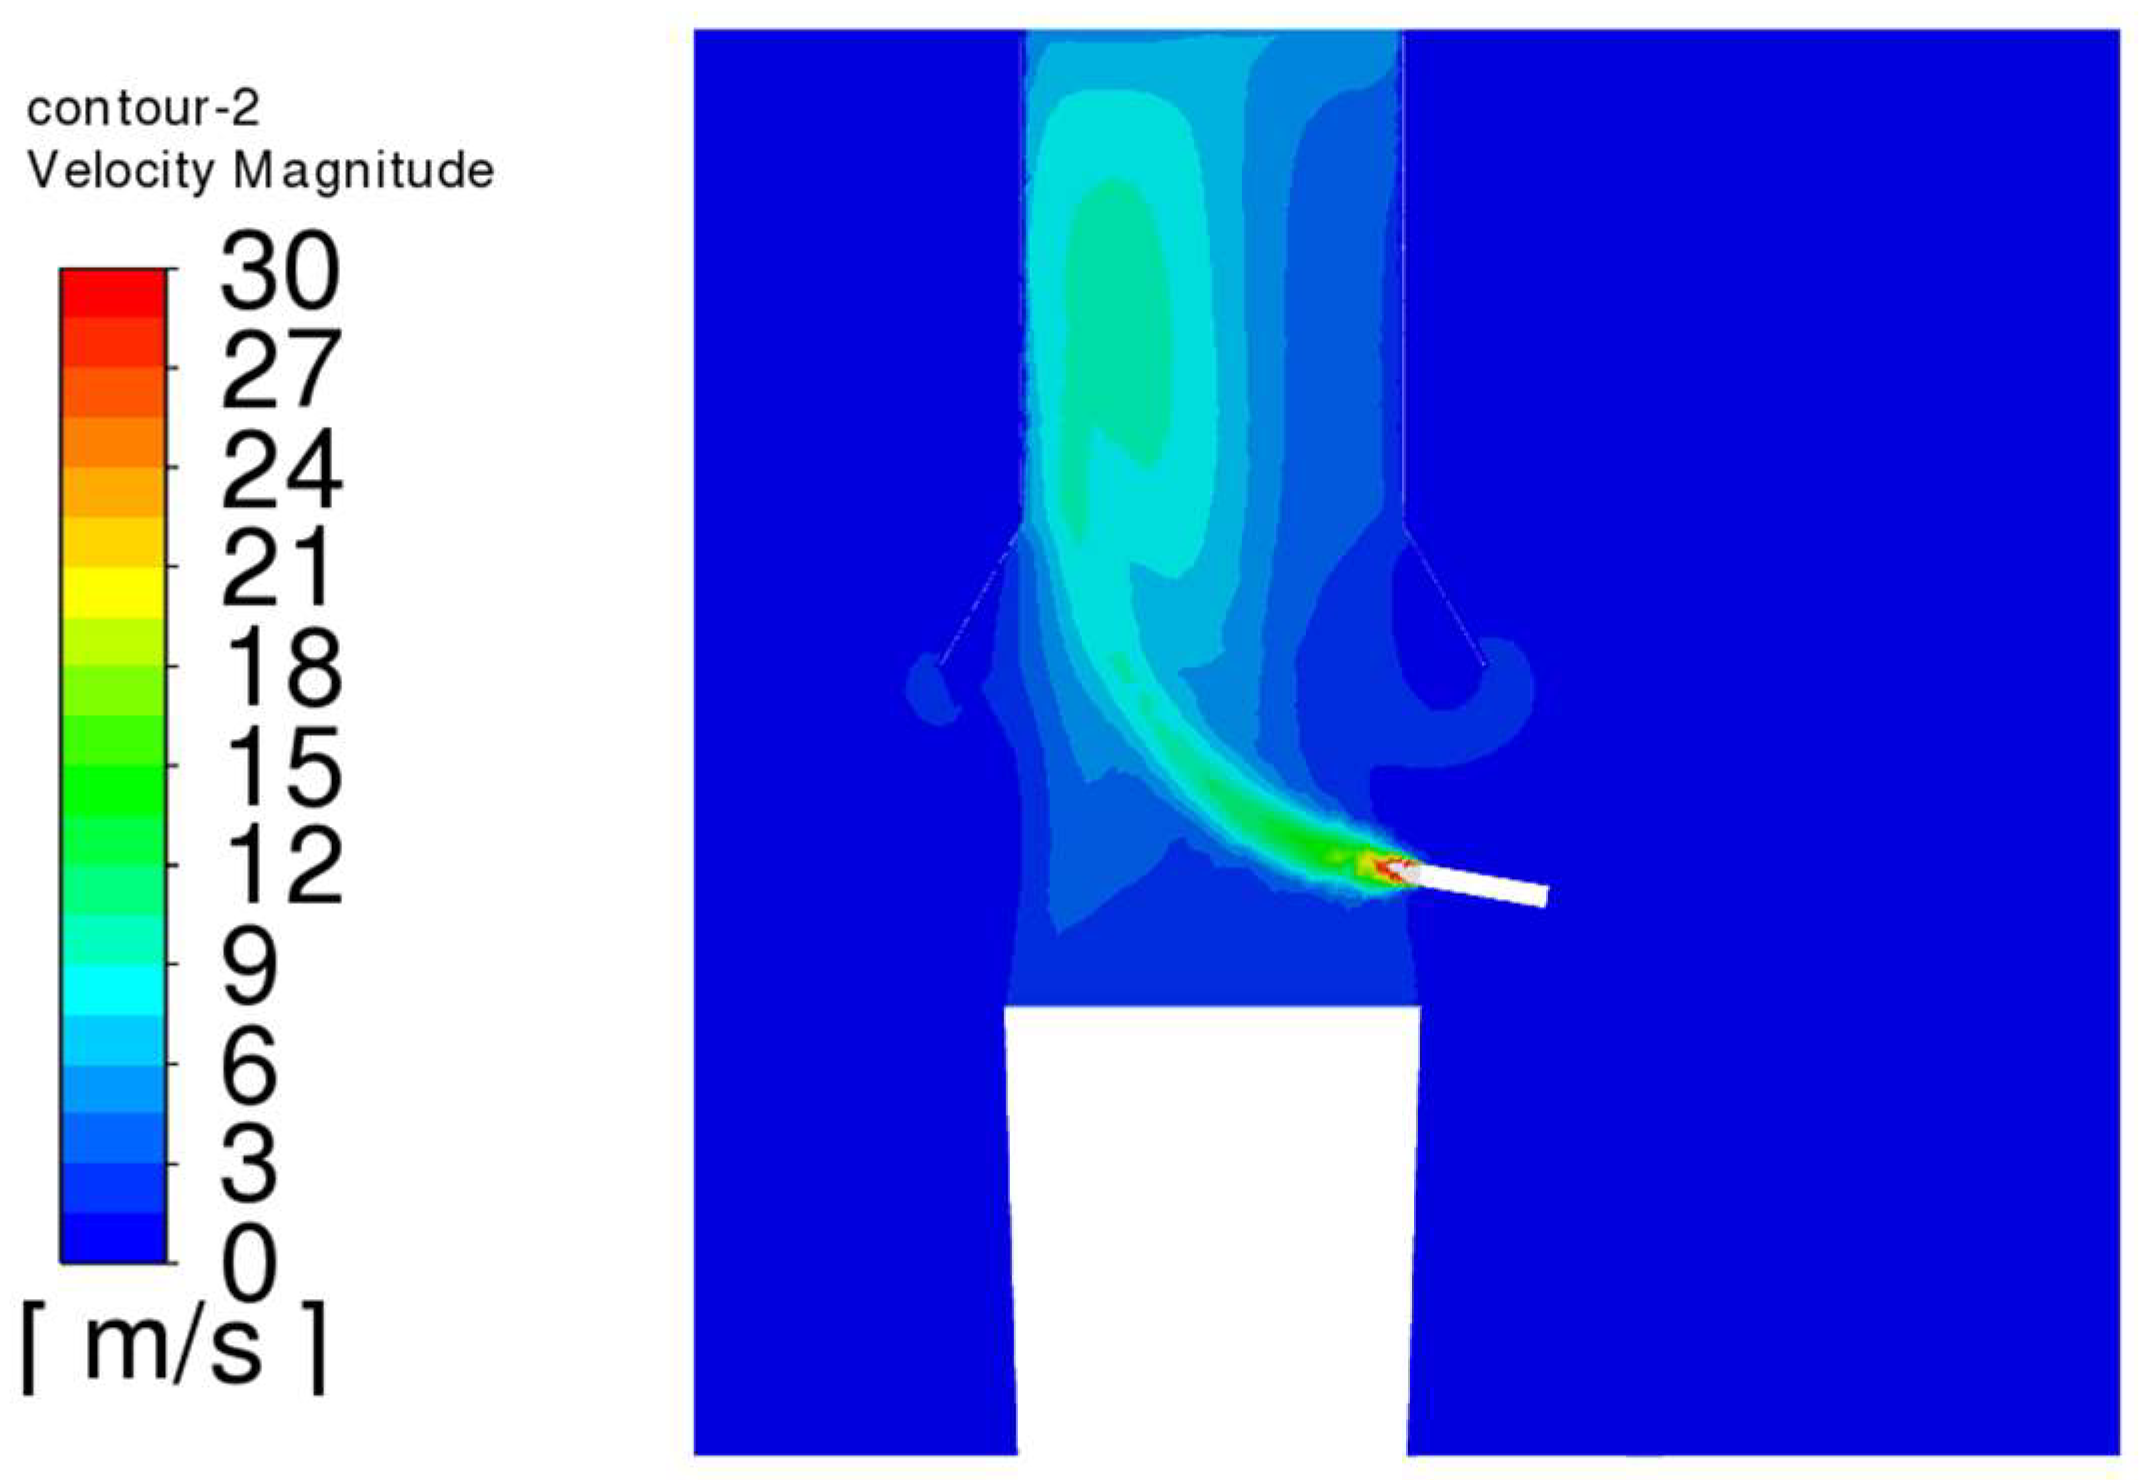
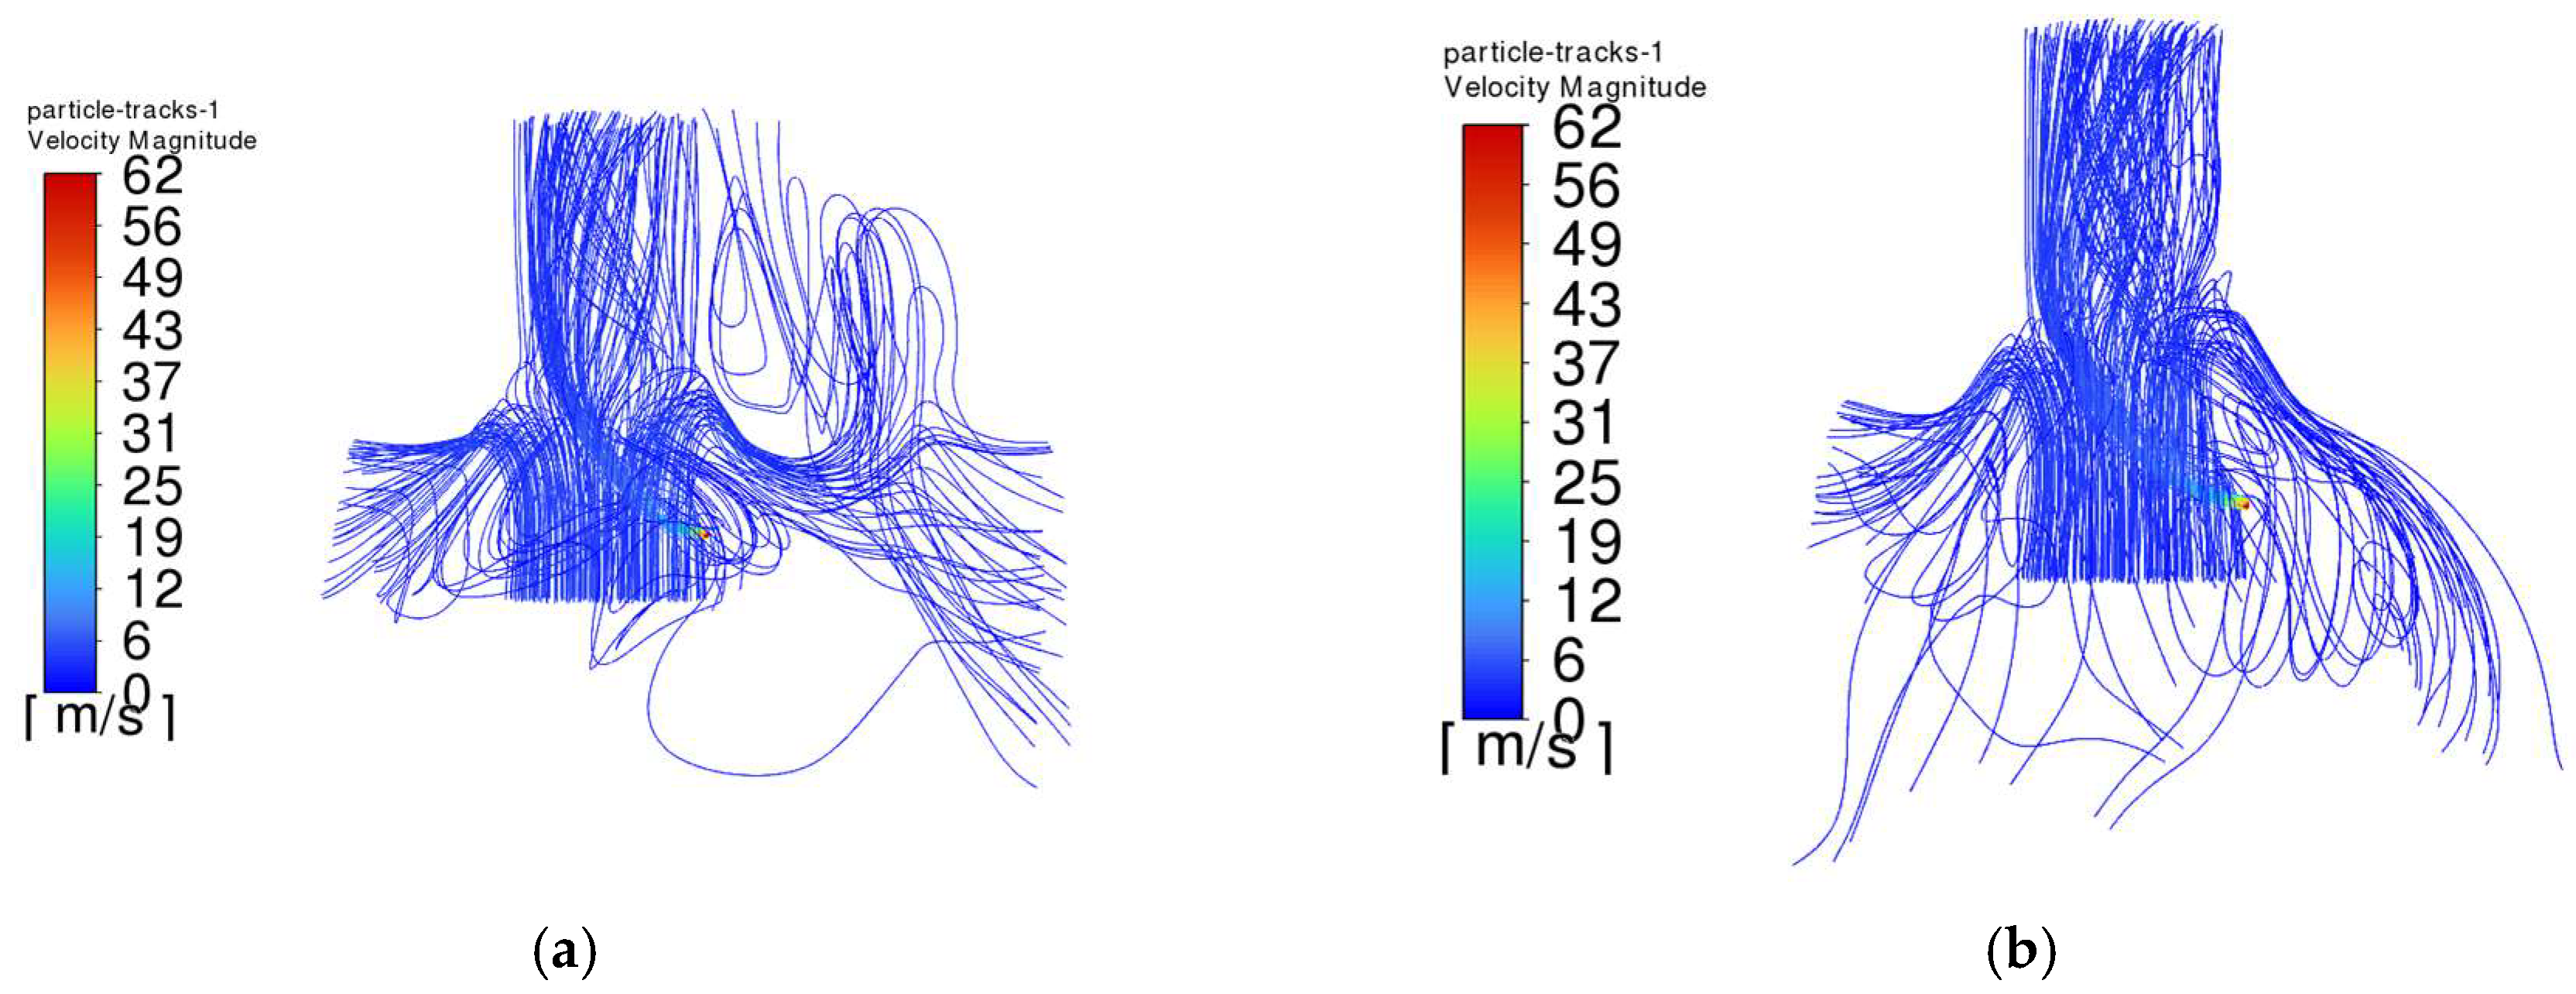
The trajectory of the jet dust at the exit of the steel is bent upward due to the movement of the plume dust, and the jet dust with Vgb = 0 rushes out of the control range of the dust collector quickly. The greater the Vgb value, the greater the upward curvature of the jet soot.
(4)
According to the actual layout structure in the workshop, a dust removal system with a heat-receiving dust-collecting cover is added above the ladle position to control the unorganized emission of smoke at the steel outlet. The size of the dust-collecting cover is 3.8 m long and 3.5 m wide. The optimal structural parameters of the dust-collecting cover are as follows: the inclination angle of the cover is 60°, and the layout height is 2.4 m; the optimal dust removal air volume is 110,000 m3/h.

6. Prospect

This study only analyzes the flow field and control methods of unorganized smoke and dust emissions at the steel outlet from the perspective of numerical simulation. The results obtained have not been verified by experiments. In further research, using the technique of particle image velocimetry may be considered for solving the problem of the high-temperature flow field not being close to testing while also more intuitively reflecting the flow field situation of smoke and dust particles at the steel outlet.

Author Contributions

Conceptualization, Y.W.; methodology, S.L.; software, S.L.; validation, S.L. and X.L.; formal analysis, S.L.; investigation, Y.W.; resources, Y.W.; data curation, S.L.; writing—original draft preparation, S.L. and X.L.; writing—review and editing, X.L.; visualization, S.L.; supervision, Y.W.; project administration, X.L.; funding acquisition, Y.W. All authors have read and agreed to the published version of the manuscript.

Funding

This research was funded by the Beijing Natural Science Foundation (8202034).

Institutional Review Board Statement

Not applicable.

Informed Consent Statement

Not applicable.

Data Availability Statement

The data presented in this study are available on request from the corresponding author. The data are not publicly available due to privacy requirements of testing workshop.

Conflicts of Interest

The authors declare no conflict of interest.

References

  1. Wang, P.; Jiang, Z.; Zhang, X.; Geng, X.; Hao, S. Long-term scenario forecast of production routes, energy consumption and emissions for Chinese steel industry. J. Univ. Sci. Technol. Beijing 2014, 36, 1683–1693. [Google Scholar] [CrossRef]
  2. Peng, F.; Li, X. Status and trend of China EAF steelmaking development. Iron Steel 2017, 52, 7–12. [Google Scholar] [CrossRef]
  3. Xuan, Y.; Yue, Q. Forecast of steel demand and the availability of depreciated steel scrap in China. Resour. Conserv. Recycl. 2016, 109, 1–12. [Google Scholar] [CrossRef]
  4. Cardarelli, A.; De Santis, M.; Cirilli, F.; Barbanera, M. Computational fluid dynamics analysis of biochar combustion in a simulated ironmaking electric arc furnace. Fuel 2022, 328, 125267. [Google Scholar] [CrossRef]
  5. Das, A.; Kandpal, T.C. Iron and steel manufacturing technologies in India: Estimation of CO2 emission. Int. J. Energy Res. 2015, 21, 1187–1201. [Google Scholar] [CrossRef]
  6. Liangming, L.; Lei, L.; Qiming, X. Development and application of electric furnace flue gas dust removal and waste heat recovery system. Technol. Wind. 2009, 19, 242–243. [Google Scholar] [CrossRef]
  7. Fan, Y.; Sun, H.; Jiang, R.W. Analysis of gas diffusion process of furnace smoke and optimization of dust collecting hood. Environ. Eng. 2020, 38, 112–117. [Google Scholar] [CrossRef]
  8. Jawahery, S.; Visuri, V.-V.; Wasbø, S.O.; Hammervold, A.; Hyttinen, N.; Schlautmann, M. Thermophysical model for online optimization and control of the electric arc furnace. Metals 2021, 11, 1587. [Google Scholar] [CrossRef]
  9. Liu, F.; Chen, H.; Yuan, H.; Zhang, T.; Liu, W. Shape optimization of the exhaust hood in machining workshops by a discrete adjoint method. Build. Environ. 2023, 244, 110764. [Google Scholar] [CrossRef]
  10. Liu, Y.; Bao, L.; Wang, H.; Yu, A.; Ge, C. Reduced-scale experimental investigation on flow field characteristics of exhaust hood of double helix lifting transportation equipment in an industrial plant. Case Stud. Therm. Eng. 2023, 43, 102798. [Google Scholar] [CrossRef]
  11. Wang, M. Study on Flow Field Characteristics and Contaminant Capture Effect of Vortex Side Suction Exhaust Hood; Xian University of Architecture and Technology: Xian, China, 2019. [Google Scholar] [CrossRef]
  12. Gonzalez, E.; Marzal, F.; Minana, A.; Doval, M. Influence of exhaust hood geometry on the capture efficiency of lateral exhaust and push–pull ventilation systems in surface treatment tanks. Environ. Prog. Sustain. Energy 2010, 27, 405–411. [Google Scholar] [CrossRef]
  13. Omran, M.; Fabritius, T. Effect of steelmaking dust characteristics on suitable recycling process determining: Ferrochrome converter (CRC) and electric arc furnace (EAF) dusts. Powder Technol. 2017, 308, 47–60. [Google Scholar] [CrossRef]
  14. Wang, H.; Zhang, P.; Zhu, F.; Zhuang, J. Simulation study on diffusion and collection characteristics of high temperature smoke and dust in blast furnace cast house. Environ. Eng. 2020, 38, 123–129. [Google Scholar] [CrossRef]
  15. Bonthoux, F. Factors Affecting the Capture Efficiency of a Fume Extraction Torch for Gas Metal Arc Welding. Ann. Occup. Hyg. 2016, 60, 761–770. [Google Scholar] [CrossRef] [PubMed]
  16. Huang, Y.; Lu, K.; Wang, Y.; Jiang, C.; Cao, L.; Liu, Y. Study on limit flow ratio method for a lateral exhaust hood above high-temperature buoyant jets. Sustain. Cities Soc. 2020, 54, 101969. [Google Scholar] [CrossRef]
  17. Zhang, J.; Wang, J.; Gao, J.; Xie, M.; Cao, C.; Lv, L.; Zeng, L. Experimental and numerical study of the effect of perimeter jet enhancement on the capture velocity of a rectangular exhaust hood. J. Build. Eng. 2021, 33, 101652. [Google Scholar] [CrossRef]
  18. Torano, J.; Torano, S.; Menendez, M.; Gent, M. Auxiliary ventilation in mining roadways driven with roadheaders: Validated CFD modelling of dust behaviour. Tunn. Undergr. Space Technol. 2011, 26, 201–210. [Google Scholar] [CrossRef]
  19. Aroussi, A.; Simmons, K.; Pickering, S.J. Particulate deposition on candle filters. Fuel 2001, 80, 335–343. [Google Scholar] [CrossRef]
  20. Xu, L. Analysis on the understanding and application of the balanced score method by financial personnel. Mod. Bus. 2021, 7, 169–171. [Google Scholar] [CrossRef]
  21. Wirehn, L.; Danielsson, A.; Nesset, T.S. Assessment of composite index methods for agricultural vulnerability to climate change. J. Environ. Manag. 2015, 156, 70–80. [Google Scholar] [CrossRef]
  22. Lu, H.; Zhu, C.; Cao, X.; Hsu, Y. The Sustainability Evaluation of Masks Based on the Integrated Rank Sum Ratio and Entropy Weight Method. Sustainability 2022, 14, 5706. [Google Scholar] [CrossRef]
  23. Hou, Y.; Gou, L.; Ren, J.; Hou, Y.; Ye, Y. A study on the evaluation of environmental factors based on TOPSIS method to construct ecological reserves. Environ. Resour. Ecol. J. 2022, 6, 62–69. [Google Scholar] [CrossRef]
  24. Nikkeh, N.S.; Abdulhussein, S.M.; Mohammed, M.A. Implementation of the decision making along with analytic hierarchy process (AHP) approaches in the assessment of the petroleum products cost based on the statical model. East. Eur. J. Enterp. Technol. 2022, 4, 68–74. [Google Scholar] [CrossRef]
  25. Yan, T.; Panyue, Z.; Jiaqiang, E.; Dandan, H.; Changlin, F. Effects of inlet velocity and structure parameters on the performance of a rotary diesel particulate filter for truck diesel engine based on fuzzy grey relational analysis. Chemosphere 2022, 307, 135843. [Google Scholar] [CrossRef]
  26. Su, Y.; Wang, C.; Li, Z.; Meng, Q.; Gong, A.; Wu, Z.; Zhao, Q. Summer outdoor thermal comfort assessment in city squares—A case study of cold dry winter, hot summer climate zone. Sustain. Cities Soc. 2024, 101, 105062. [Google Scholar] [CrossRef]
  27. Ramnath, R.A.; Thyla, P.; Harishsharran, A. Machining parameter selection in milling epoxy granite composites based on AHP. Mater. Today Proc. 2020, 42, 319–324. [Google Scholar] [CrossRef]
  28. Buyukozkan, G.; Havle, C.A.; Feyzioglu, O. A new digital service quality model and its strategic analysis in aviation industry using interval-valued intuitionistic fuzzy AHP. J. Air Transp. Manag. 2020, 86, 101817. [Google Scholar] [CrossRef]
  29. Li, G.; Liu, H.; Feng, G.; Yan, S.; Guo, G.; Du, Y.; Wu, S. The research of PM/PM2.5 test method for ultra-low emission. Boil. Technol. 2018, 49, 73–78. [Google Scholar]
  30. Xu, Y.; Yang, S.; Zhou, J.; Tan, H.; Zhou, J. Research on influencing factors of asphalt fume release based on quality method. For. Eng. 2022, 38, 119–124. [Google Scholar] [CrossRef]
  31. Shou, Z.; Zheng, S.; Liu, H.; Xu, X.; Fang, X.; Guo, G.; Zhang, J. Study on the determination of particulate matter in coal—Fired power plants. Clean Coal Technol. 2019, 25, 130–136. [Google Scholar] [CrossRef]
  32. Wang, Y. Study on Sampling Method of Low Concentration Particulate Matter in Coal-Fired Power Plant; Xinjiang Normal University: Ürümqi, China, 2018. [Google Scholar] [CrossRef]
  33. National Health Commission of the People’s Republic of China. GBZ/T192.1-2007; Determination of Airborne Dust in Workplace Part 1: Total Dust Concentration. People’s Health Publishing House: Beijing, China, 2007.
  34. Xiong, H.; Peng, X.; Xie, H.; Liu, J. Study on multi-pollution sources of harmful gas control with integrated exhaust hood. J. Univ. South China (Sci. Technol.) 2019, 33, 38–43. [Google Scholar] [CrossRef]
  35. Huang, Y.; Wang, Y.; Liu, L.; Nielsen, P.V.; Jensen, R.L.; Yang, X. Performance of constant exhaust ventilation for removal of transient high-temperature contaminated airflows and ventilation-performance comparison between two local exhaust hoods. Energy Build. 2017, 154, 207–216. [Google Scholar] [CrossRef]
  36. Wang, J.; Xie, G.; Zhou, J.; Fan, X. Application of third-time dedusting technology for converter. Shanxi Metall. 2018, 41, 71–73. [Google Scholar] [CrossRef]
  37. Li, Y.; Wu, C.; Yi, B.; Huang, X. Mathematical models and numerical simulation of concentration distribution of dust flowing in limited space. China Saf. Sci. J. 2007, 10, 50–55. [Google Scholar] [CrossRef]
  38. Wang, R.; You, H.; Shang, W.; Sun, F.; Yue, S.; Sun, J. CFD model coupled with particles force analysis and its application in ultrafiltration membrane fouling. Environ. Eng. 2021, 39, 116–121. [Google Scholar] [CrossRef]
  39. Qin, L.; Ban, J. Discussion on numerical simulation modeling and mesh generation for a boiler in power plant. Energy Eng. 2009, 4, 13–16. [Google Scholar] [CrossRef]
Figure 1. Hierarchy model.
Atmosphere 14 01829 g001
Figure 2. Tapping period of electric furnace. (a) Early stage of tapping. (b) Late stage of tapping.
Atmosphere 14 01829 g002
Figure 3. Schematic diagram of tapping hole side distribution.(a, b, c, d and e are experimental test points).
Atmosphere 14 01829 g003
Figure 4. FC-4 dust sampler.
Atmosphere 14 01829 g004
Figure 5. Smoke concentration at different points in different periods.
Atmosphere 14 01829 g005
Figure 6. Fitting curve of smoke concentration.
Atmosphere 14 01829 g006
Figure 7. Schematic diagram of electric furnace tapping process.(The red area: the pouring spout and ladle is taken as the calculation domain).
Atmosphere 14 01829 g007
Figure 8. Simplified physical model. (Different colors represent different structures, and arrows point to representthe structure explained by the text).
Atmosphere 14 01829 g008
Figure 9. Grid generation diagram. (Different colors represent different structures).
Atmosphere 14 01829 g009
Figure 10. Variation of velocity and temperature in x-axis direction under different grid numbers. (a) Speed. (b) Temperature.
Atmosphere 14 01829 g010aAtmosphere 14 01829 g010b
Figure 11. Capture efficiency under different hood angles.
Atmosphere 14 01829 g011
Figure 12. Velocity contour with α = 60°, Vgb = 1.125 m/s, y = 0.
Atmosphere 14 01829 g012
Figure 13. Smoke particle trail with α = 60°. (a) Vgb = 0. (b) Vgb = 1.125 m/s.
Atmosphere 14 01829 g013aAtmosphere 14 01829 g013b
Figure 14. Capture efficiency of flue dust under different arrangement heights.
Atmosphere 14 01829 g014
Figure 15. Velocity contour with Vgb = 1.125 m/s, y = 0. (a) H = 2.4 m. (b) H = 3.4 m.
Atmosphere 14 01829 g015aAtmosphere 14 01829 g015b
Figure 16. Capture efficiency under different air volumes.
Atmosphere 14 01829 g016
Figure 17. Velocity contour Q = 110,000 m3/h, Vgb = 2.25 m/s, y = 0.
Atmosphere 14 01829 g017
Figure 18. Smoke particle trail with Q = 110,000 m3/h. (a) Vgb = 2.25 m/s. (b) Vgb = 4.5 m/s.
Atmosphere 14 01829 g018
Figure 19. Smoke particle trail with Q = 55,000 m3/h. (a) Vgb = 4.5 m/s. (b) Vgb = 3.75 m/s.
Atmosphere 14 01829 g019
Table 1. Comparison of commonly used comprehensive evaluation methods.
Evaluation MethodAdvantageShortcomingSuitable
Scoring methodSimple and practical, no need to find another comparison standardThe original data have a certain lossEvaluation questions do not have a clear frame of reference
Comprehensive index methodFully reflect the gap between the evaluation unitsThere is no clear value range for a single evaluation value, and it is easy to exaggerate the influence of a certain evaluation index on the total evaluation value.There is little difference between the evaluated objects, and the fluctuation range of the individual index of each evaluation index is not much different
Rank sum ratio methodTargeted and easy to operateMetric transformations change the original informationMedical field, statistical forecasting, etc.
Topsis methodNo restrictions on data distribution and sample sizeIt is easy to cause reverse order problems due to the addition of new solutionsComprehensive evaluation of enterprise scale and social benefits
Analytic hierarchy process methodStrong reliability and small errorGenerally, no more than 9 evaluation objectsEnvironmental issues, military fields, resource allocation
Fuzzy analysis methodSolve the disadvantage of “unique solution”, and can obtain solutions to multi-level problems according to different possibilitiesCannot solve the problem of information duplication caused by the association between evaluation indicatorsPortfolio investment, bank loan project identification
Table 2. Comparison of overall goodness of discharge locations of different organizations.
CKind of
Work
Distance from Electric FurnaceWorkshop TemperatureWorkshop HumidityFlue Dust
Furnace door0.0990.900.0840.110.11
Feeding port0.260.300.340.310.24
Electrode hole0.110.100.110.120.12
Tapping port0.540.510.470.460.53
Disclaimer/Publisher’s Note: The statements, opinions and data contained in all publications are solely those of the individual author(s) and contributor(s) and not of MDPI and/or the editor(s). MDPI and/or the editor(s) disclaim responsibility for any injury to people or property resulting from any ideas, methods, instructions or products referred to in the content.

