
Clearing the Air: Assessing the Effectiveness of Emission Policy in Qinhuangdao’s Key Industries


Abstract
:1. Introduction
2. Methods and Data
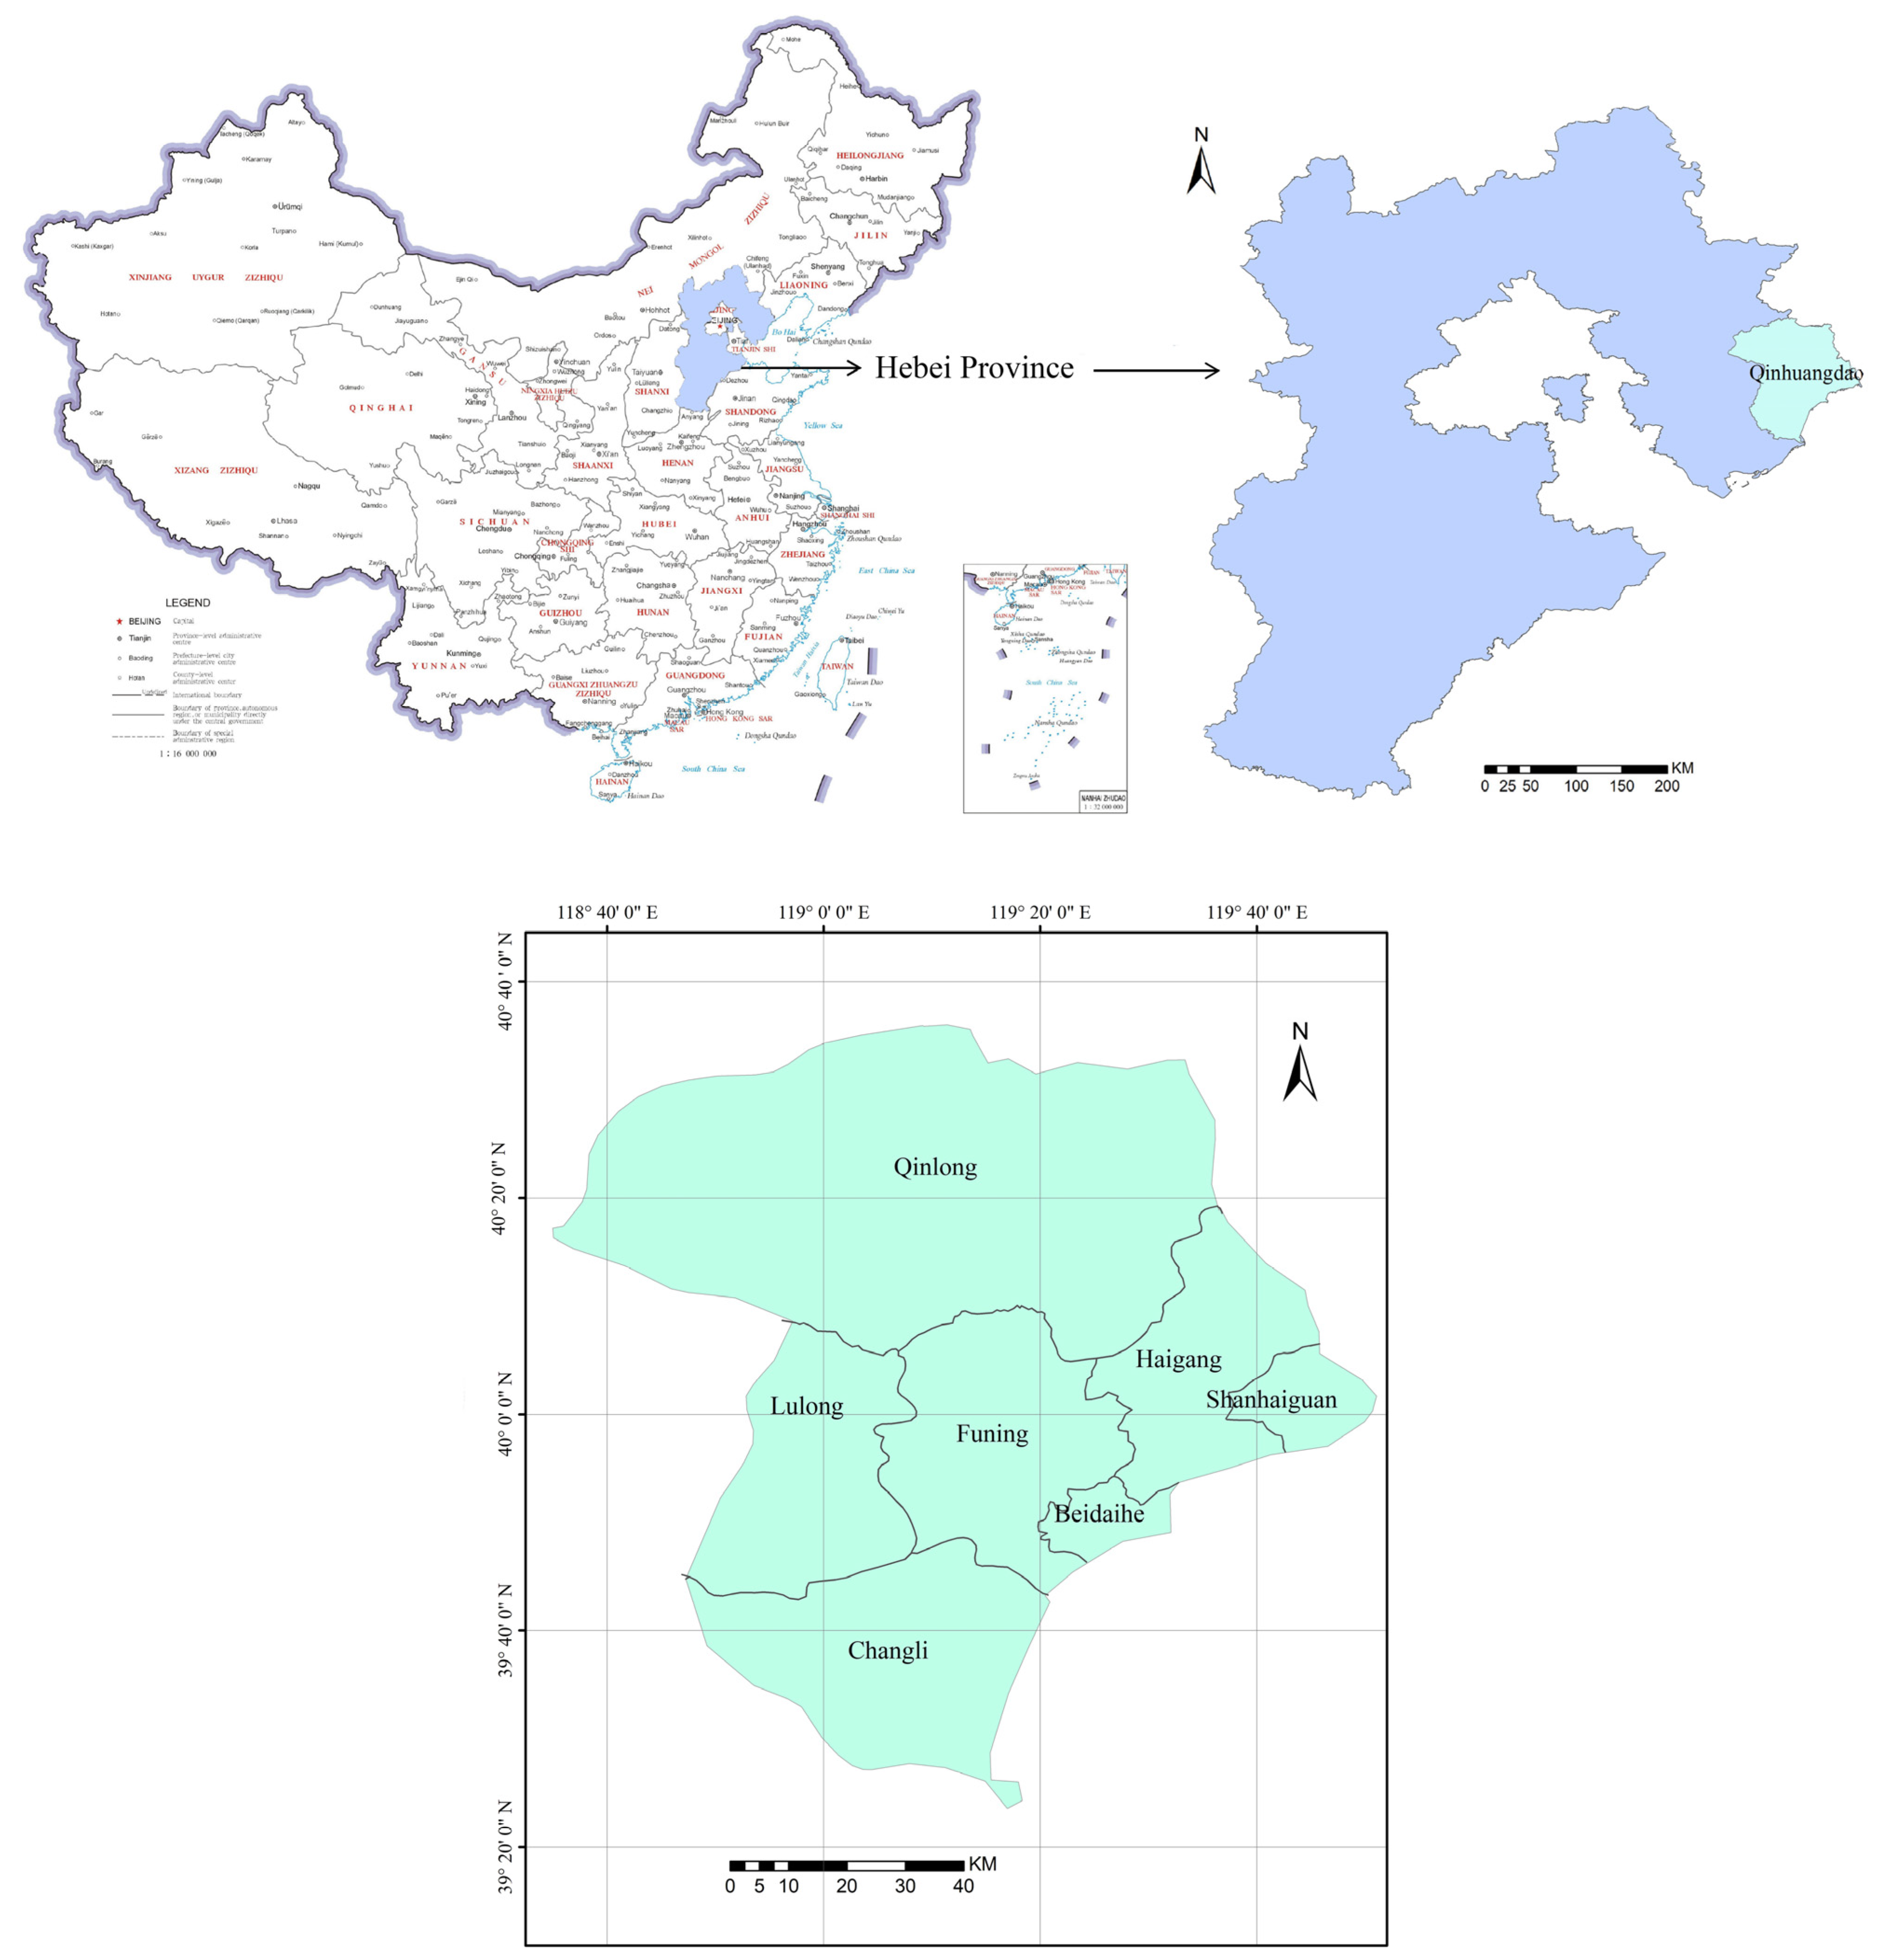
2.1. Study Domain
2.2. Emission Inventory
2.3. The Settings of Emission Reduction Scenarios
2.3.1. Business-as-Usual (BAU) Scenario
2.3.2. Ultra-Low Emission (ULE) Scenario
2.3.3. Peak Production Capacity (PPC) Scenario
3. Results and Discussion
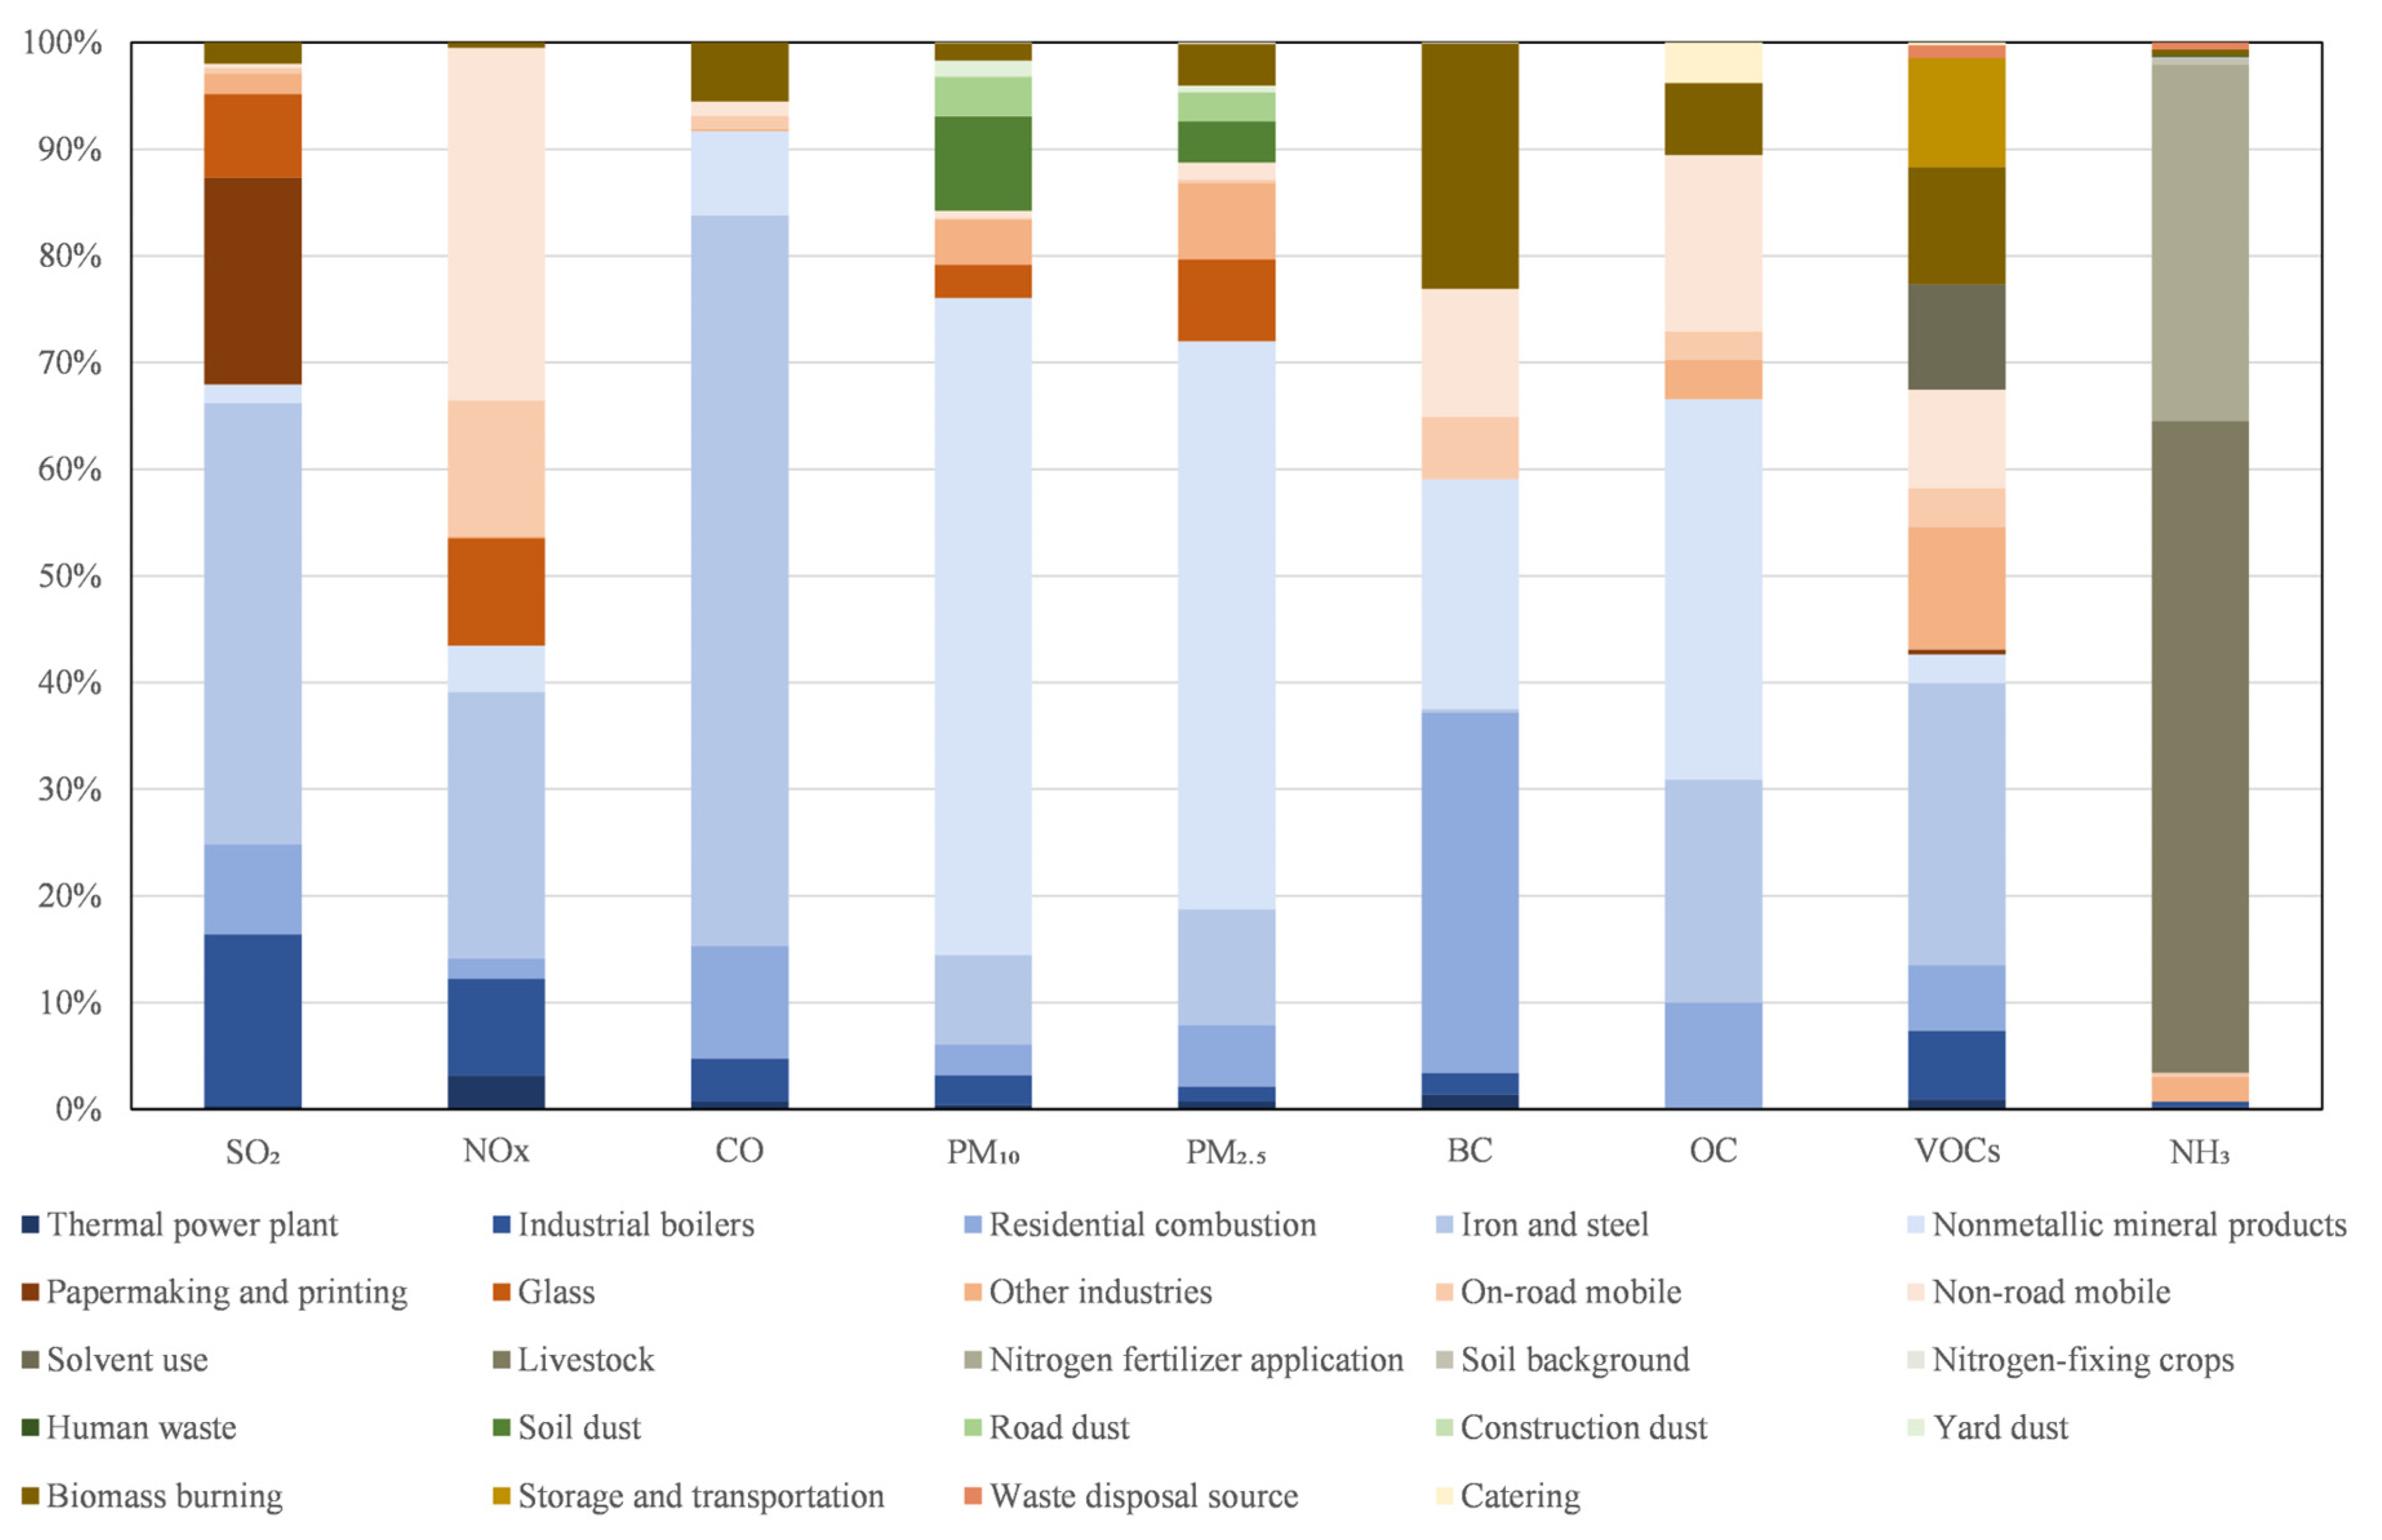
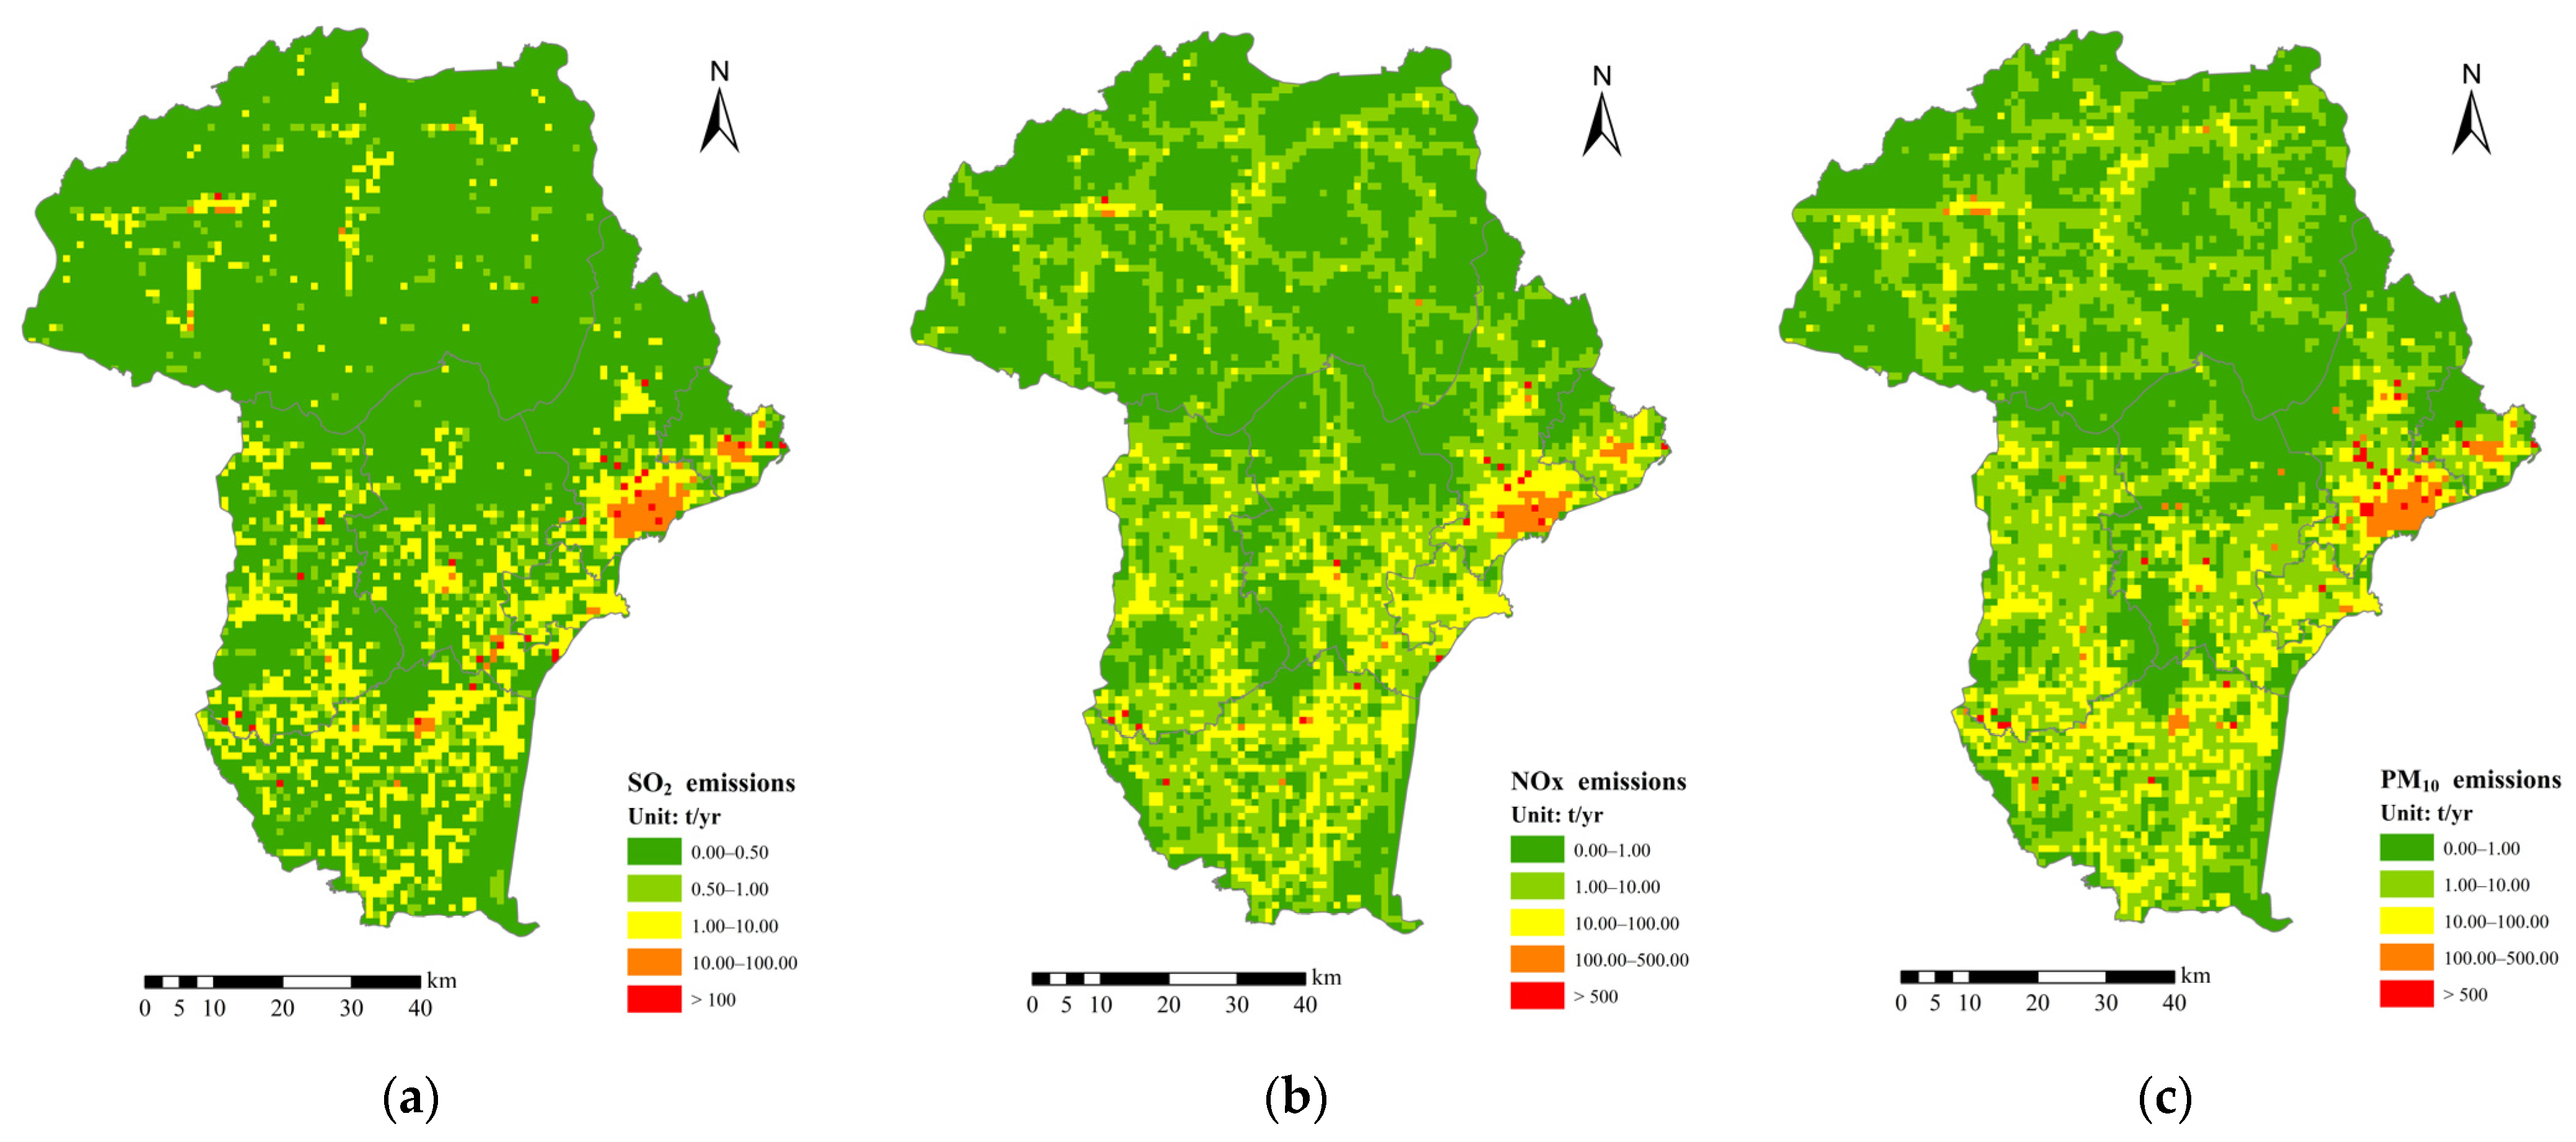
3.1. Spatial Emission Characteristics of Air Pollutants
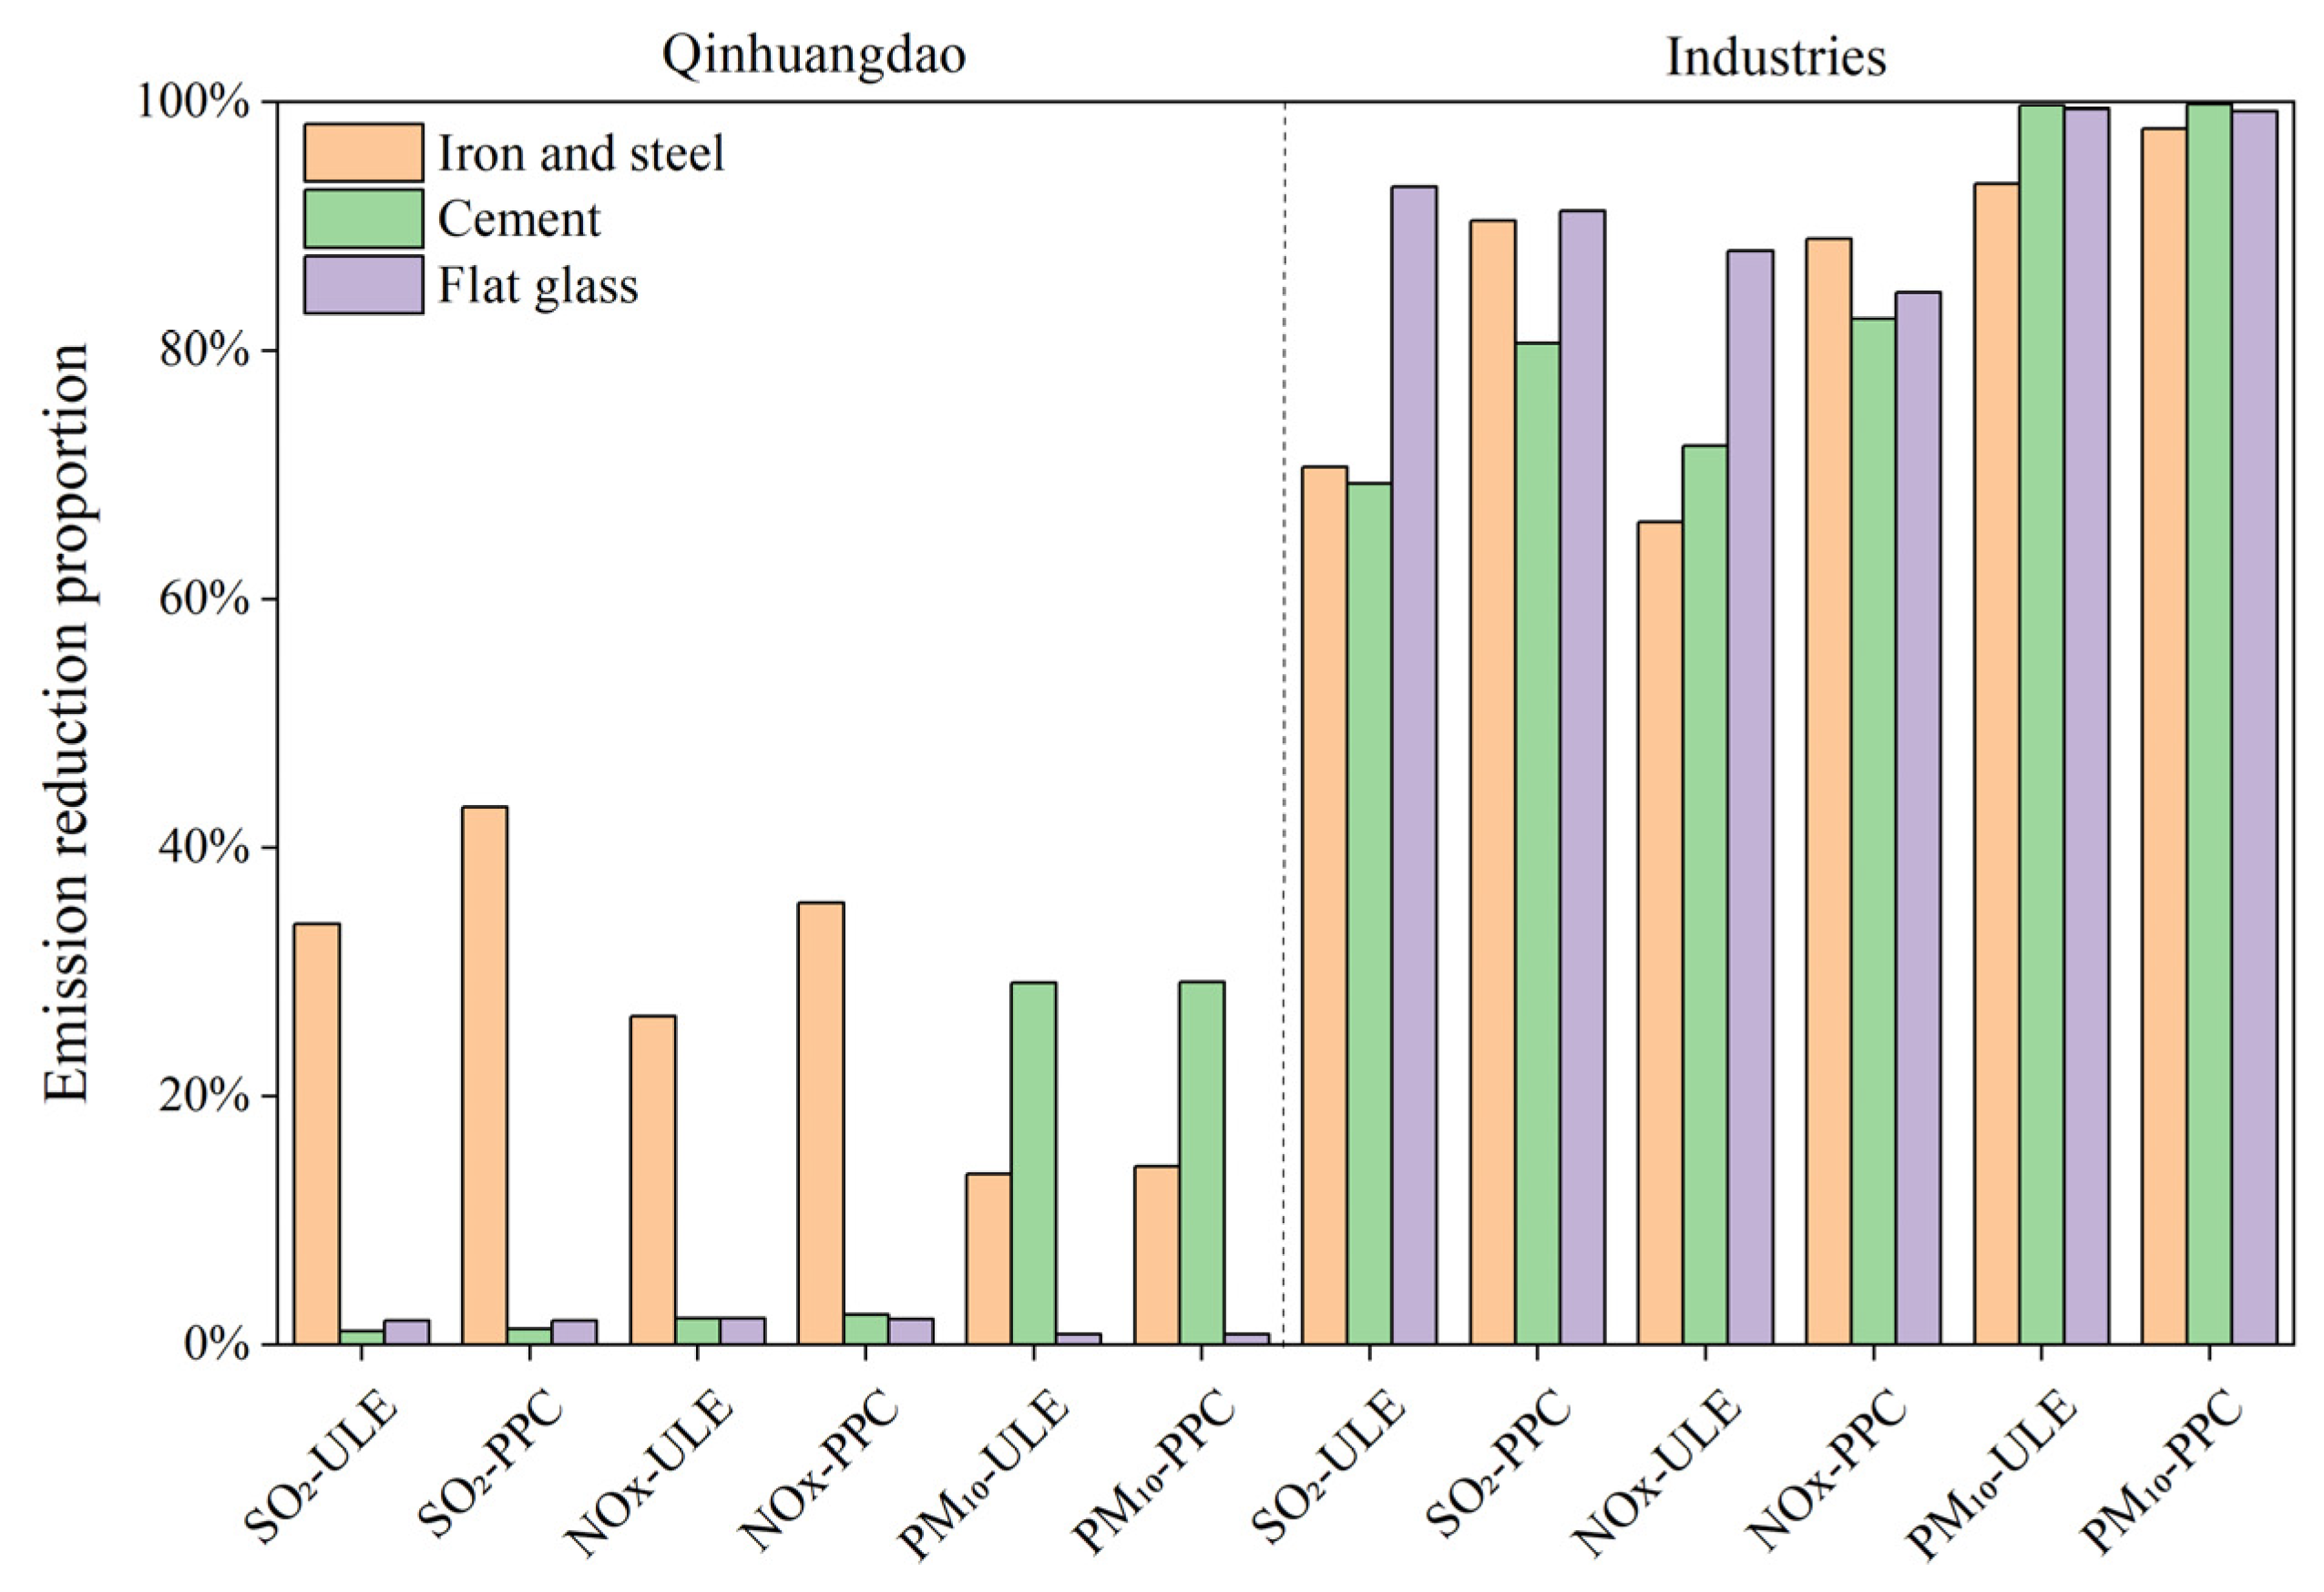
3.2. Emission Analysis under the Three Scenarios
3.3. Comparisons with Other Emission Inventories
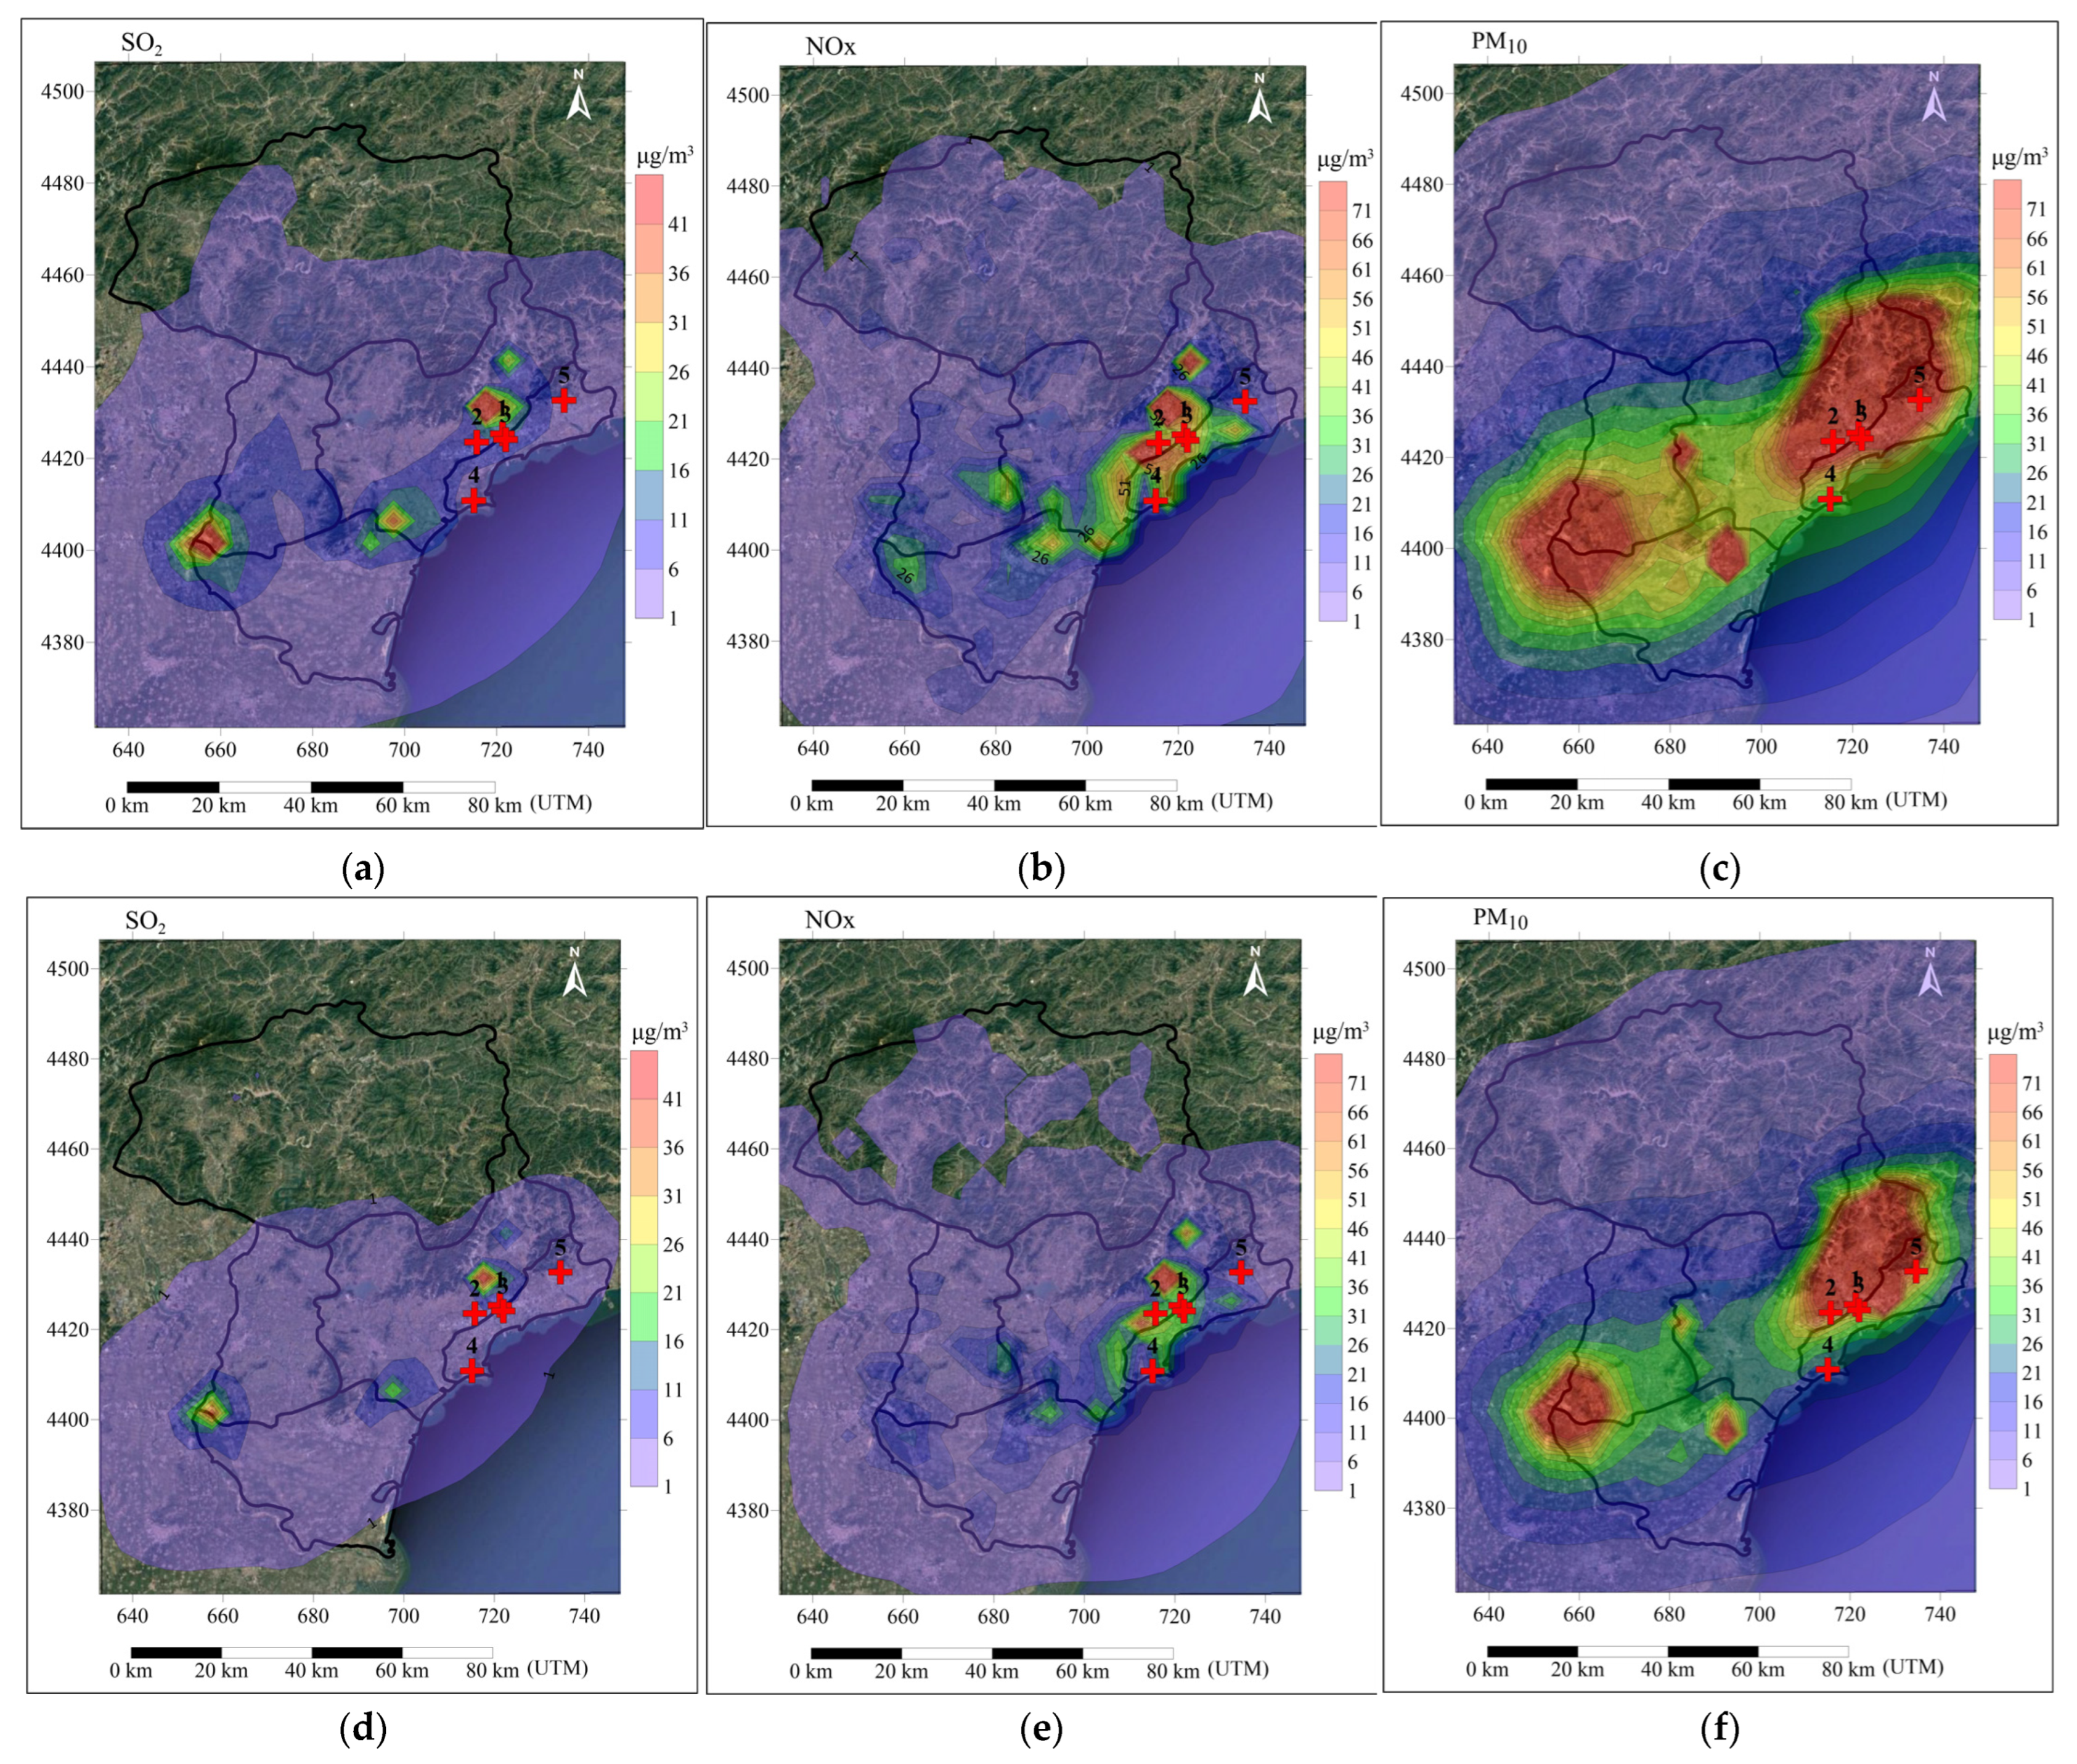
3.4. Impact Analysis of the PPC Scenario on the Atmosphere of Qinhuangdao
3.5. Policy Implications
3.6. Uncertainty Analysis and Limitations
4. Conclusions
Supplementary Materials
Author Contributions
Funding
Institutional Review Board Statement
Informed Consent Statement
Data Availability Statement
Conflicts of Interest
References
- National Bureau of Statistics of China. China’s Provincial Annual Data; National Bureau of Statistics of China: Beijing, China, 2022.
- Wu, X.; Li, D.; Feng, M.; Liu, H.; Li, H.; Yang, J.; Wu, P.; Lei, X.; Wei, M.; Bo, X. Effects of air pollutant emission on the prevalence of respiratory and circulatory system diseases in Linyi, China. Environ. Geochem. Health 2021, 43, 4475–4491. [Google Scholar] [CrossRef] [PubMed]
- Xu, X.; Yang, H.; Li, C. Theoretical Model and Actual Characteristics of Air Pollution Affecting Health Cost: A Review. Int. J. Environ. Res. Public Health 2022, 19, 3532. [Google Scholar] [CrossRef] [PubMed]
- Guo, X.; Shen, Y.; Liu, W.; Chen, D.; Liu, J. Estimation and Prediction of Industrial VOC Emissions in Hebei Province, China. Atmosphere 2021, 12, 530. [Google Scholar] [CrossRef]
- Li, T.; Bi, X.; Dai, Q.; Wu, J.; Zhang, Y.; Feng, Y. Optimized approach for developing soil fugitive dust emission inventory in “2+26” Chinese cities. Environ. Pollut. 2021, 285, 117521. [Google Scholar] [CrossRef]
- Qi, J.; Zheng, B.; Li, M.; Yu, F.; Chen, C.C.; Liu, F.; Zhou, X.F.; Yuan, J.; Zhang, Q.; He, K.B. A high-resolution air pollutants emission inventory in 2013 for the Beijing-Tianjin-Hebei region, China. Atmos. Environ. 2018, 170, 156–168. [Google Scholar] [CrossRef]
- Zhu, C.; Qu, X.; Qiu, M.; Zhu, C.; Wang, C.; Wang, B.; Sun, L.; Yang, N.; Yan, G.; Xu, C.; et al. High spatiotemporal resolution vehicular emission inventory in Beijing-Tianjin-Hebei and its surrounding areas (BTHSA) during 2000–2020, China. Sci. Total Environ. 2023, 873, 162389. [Google Scholar] [CrossRef] [PubMed]
- Gao, Y.; Zhang, L.; Huang, A.; Kou, W.; Bo, X.; Cai, B.; Qu, J. Unveiling the spatial and sectoral characteristics of a high-resolution emission inventory of CO2 and air pollutants in China. Sci. Total Environ. 2022, 847, 157623. [Google Scholar] [CrossRef]
- Li, M.; Liu, H.; Geng, G.N.; Hong, C.P.; Liu, F.; Song, Y.; Tong, D.; Zheng, B.; Cui, H.Y.; Man, H.Y.; et al. Anthropogenic emission inventories in China: A review. Natl. Sci. Rev. 2017, 4, 834–866. [Google Scholar] [CrossRef]
- Ministry of Ecology and Environment of the People’s Republic of China. China Ecological Environment Statistics Annual Report 2016. Available online: https:////www.mee.gov.cn/hjzl/sthjzk/sthjtjnb/202108/t20210827_860992.shtm (accessed on 27 August 2021). (In Chinese)
- Fang, D.; Yu, B. Driving mechanism and decoupling effect of PM2.5 emissions: Empirical evidence from China’s industrial sector. Energy Policy 2021, 149, 112017. [Google Scholar] [CrossRef]
- Qian, H.; Xu, S.; Cao, J.; Ren, F.; Wei, W.; Meng, J.; Wu, L. Air pollution reduction and climate co-benefits in China’s industries. Nat. Sustain. 2021, 4, 417–425. [Google Scholar] [CrossRef]
- Wang, B.; Wang, Y.; Zhao, Y. Collaborative Governance Mechanism of Climate Change and Air Pollution: Evidence from China. Sustainability 2021, 13, 6785. [Google Scholar] [CrossRef]
- GB 13271-2014; Emission Standard of Air Pollutants for Boiler. Ministry of Ecology and Environment of the People’s Republic of China: Beijing, China, 2014.
- DB13/2169-2018; Standards for Ultra-Low Emission of Air Pollutants in the Iron and Steel Industry. Department of Ecology and Environment of Hebei Province: Shijiazhuang, China, 2020.
- HJ847—2017; Technical Specification for Application and Issuance of Pollutant Permit Cement Industry. Ministry of Ecology and Environment of the People’s Republic of China: Beijing, China, 2017.
- HJ856—2017; Technical Specification for Application and Issuance of Pollutant Permit Glass Industry—Flat Glass. Ministry of Ecology and Environment of the People’s Republic of China: Beijing, China, 2017.
- HJ854—2017; Technical Specification for Application and Issuance of Pollutant Permit Coking Chemical Industry. Ministry of Ecology and Environment of the People’s Republic of China: Beijing, China, 2017.
- Bo, X.; Jia, M.; Xue, X.; Tang, L.; Mi, Z.; Wang, S.; Cui, W.; Chang, X.; Ruan, J.; Dong, G.; et al. Effect of strengthened standards on Chinese ironmaking and steelmaking emissions. Nat. Sustain. 2021, 4, 811–820. [Google Scholar] [CrossRef]
- Chen, L.; Wang, T.; Bo, X.; Zhuang, Z.; Qu, J.; Xue, X.; Tian, J.; Huang, M.; Wang, P.; Sang, M. Thermal Power Industry Emissions and Their Contribution to Air Quality on the Fen-Wei Plain. Atmosphere 2022, 13, 652. [Google Scholar] [CrossRef]
- Chen, X.; Li, J.; Jia, M.; Chen, S.; Zhang, S.; Bo, X.; Feng, X.; Dong, G. High Spatial Resolution Emission Inventory of Air Pollutants and Carbon in China’s Independent Coking Industry. Atmosphere 2023, 14, 348. [Google Scholar] [CrossRef]
- Jiao, X.; Liu, X.; Gu, Y.; Wu, X.; Wang, S.; Zhou, Y. Satellite verification of ultra-low emission reduction effect of coal-fired power plants. Atmos. Pollut. Res. 2020, 11, 1179–1186. [Google Scholar] [CrossRef]
- Tang, L.; Qu, J.; Mi, Z.; Bo, X.; Chang, X.; Anadon, L.D.; Wang, S.; Xue, X.; Li, S.; Wang, X.; et al. Substantial emission reductions from Chinese power plants after the introduction of ultra-low emissions standards. Nat. Energy 2019, 4, 929–938. [Google Scholar] [CrossRef]
- Bo, Z.; Dan, T.; Meng, L.; Fei, L.; Chaopeng, H.; Guannan, G.; Haiyan, L.; Xin, L.; Liqun, P.; Ji, Q. Trends in China’s anthropogenic emissions since 2010 as the consequence of clean air actions. Atmos. Chem. Phys. Discuss. 2018, 18, 14095–14111. [Google Scholar]
- Xu, Z.J.; Chen, S.B.; Sang, M.J.; Wang, Z.T.; Bo, X.; You, Q. Air quality improvement through vehicle electrification in Hainan province, China. Chemosphere 2023, 316, 137814. [Google Scholar] [CrossRef]
- Qinhuangdao Ecological Environment Bureau. Qinhuangdao City Environment Condition Bulletin in 2016. Available online: http://sthj.qhd.gov.cn/home/details?code=NDAyOGFiODE2MzI5MTVjZDAxNjMyOTFhOTVlYTAwMTI%ce%b3&id=866 (accessed on 4 August 2017). (In Chinese)
- Qinhuangdao Ecological Environment Bureau. Qinhuangdao Ecological Environment Protection ‘14th Five-Year’ Plan. Available online: http://sthj.qhd.gov.cn/home/details?code=NDAyOGFiODE2MzI5MTVjZDAxNjMyOTIwZGExMTAwNjE%ce%b3&id=10898 (accessed on 6 July 2022). (In Chinese)
- Ministry of Ecology and Environment of the People’s Republic of China. 2016 State of the Environment Bulletin of China. Available online: https://www.mee.gov.cn/hjzl/sthjzk/zghjzkgb/201706/P020170605833655914077.pdf (accessed on 5 June 2016). (In Chinese)
- Liu, J.-W.; Xiao, Y.; Wang, Z.-P.; Li, Q.-W. Electron heat transport in low-rank lignite: Combining experimental and computational methods. J. Therm. Anal. Calorim. 2023, 148, 4759–4768. [Google Scholar] [CrossRef]
- Wu, Z.-H.; Wu, Y.; Tang, Y.; Jiang, J.-C.; Huang, A.-C. Evaluation of composite flame-retardant electrolyte additives improvement on the safety performance of lithium-ion batteries. Process Saf. Environ. Prot. 2023, 169, 285–292. [Google Scholar] [CrossRef]
- Zhang, C.-Z.; Jiang, J.-C.; Huang, A.-C.; Tang, Y.; Xie, L.-J.; Zhai, J.; Xing, Z.-X. A novel multifunctional additive strategy improves the cycling stability and thermal stability of SiO/C anode Li-ion batteries. Process Saf. Environ. Prot. 2022, 164, 555–565. [Google Scholar] [CrossRef]
- Bo, X.; Xu, J.; Du, X.; Guo, Q.; Zhen, R.; Tian, J.; Cai, B.; Wang, L.; Ma, F.; Zhou, B. Impacts assessment of steel plants on air quality over Beijing-Tianjin-Hebei area. China Environ. Sci. 2017, 37, 1684–1692. [Google Scholar]
- Liu, X.Y. Modeling Research on the Regional Transport of PM2.5 over Jing-Jin-Ji Region. Ph.D. Thesis, Tsinghua University, Beijing, China, 2015. [Google Scholar]
- Cangzhou Ecological Environment Bureau. Notice on Forwarding the Provincial Atmospheric Office’s ‘Deep Emission Reduction Plan for Iron and Steel, Coking and Coal-Fired Power Plants in Hebei Province’. Available online: http://hb.cangzhou.gov.cn/hb/c100466/201806/a001f11e91be43d0b694ed64d5c8d432.shtml (accessed on 26 June 2018). (In Chinese)
- People’s Government of Hebei Province. Interpretation of ‘Several Measures to Support Ultra-Low Emission Transformation (Deep Treatment) of Key Industries and Key Facilities’. Available online: http://info.hebei.gov.cn//hbszfxxgk/6806024/6807473/6807180/6904218/6904253/6927677/index.html (accessed on 27 May 2020). (In Chinese)
- Qinhuangdao Development and Reform Commission. Interpretation of the Notice of the General Office of the People’s Government of Hebei Province on Printing and Distributing Several Measures to Support Ultra Low Emission Transformation (Deep Treatment) of Key Industries and Key Facilities. Available online: http://fgw.qhd.gov.cn/home/details?id=462421 (accessed on 29 June 2020). (In Chinese)
- Qinhuangdao Municipal People’s Government. Qinhuangdao Atmospheric Office Eight Measures to Promote the Industrial Enterprise Air Pollution Control Work. Available online: http://www.qhd.gov.cn/front_pcthi.do?uuid=03AF2865F2A3A55F12662828CDF5766C (accessed on 19 February 2019). (In Chinese)
- Qinhuangdao Municipal People’s Government. Charming Qinhuangdao. Available online: http://mail.qhd.gov.cn/front_pcsec_qjqhd.do?tid=13A044B8ABA63145BAE7AAD47B6A4E79&p=1 (accessed on 1 May 2022). (In Chinese)
- Qinhuangdao Municipal People’s Government. Qinhuangdao Statistical Yearbook 2016; Qinhuangdao Municipal People’s Government: Qinhuangdao, China, 2017.
- Qinhuangdao Municipal People’s Government. Qinhuangdao Statistical Yearbook 2019; Qinhuangdao Municipal People’s Government: Qinhuangdao, China, 2020.
- He, K. The Technical Guidelines for the Preparation of Emission Inventories; School of Environment, Tsinghua University: Beijing, China, 2018. [Google Scholar]
- Jiang, P.Y.; Chen, X.L.; Li, Q.Y.; Mo, H.H.; Li, L.Y. High-resolution emission inventory of gaseous and particulate pollutants in Shandong Province, eastern China. J. Clean. Prod. 2020, 259, 120806. [Google Scholar] [CrossRef]
- Krecl, P.; Oukawa, G.Y.; Charres, I.; Targino, A.C.; Grauer, A.F.; Silva, D.C.E. Compilation of a city-scale black carbon emission inventory: Challenges in developing countries based on a case study in Brazil. Sci. Total Environ. 2022, 839, 156332. [Google Scholar] [CrossRef]
- Lei, T.T. Emission Inventory and Environmental Impact of Air Pollution Sources in Cangzhou. Master’s Thesis, Hebei University of Science and Technology, Shijiazhuang, China, 2020. [Google Scholar]
- Ran, H.; Lei, T.; Bo, X.; Tian, F.; Qu, J.; Ma, Y.; Gao, S.; Chen, A.; Zhao, X.; Lv, W.; et al. Research on the Verification of Industrial Source Emission Inventory Considering Environmental Management Data: Taking Cangzhou as an Example. Environ. Impact Assess. 2019, 41, 46–49+54. [Google Scholar]
- Qinhuangdao Municipal People’s Government. The City Air Pollution Control Work Scheduling Meeting. Available online: http://www.qhd.gov.cn/front_wmwz_thi.do?uuid=6D30098944AAA88E286BCF3B385E5116 (accessed on 23 September 2015). (In Chinese)
- Yang, Y.; Wang, X.-F.; Pan, M.-Y.; Li, P.; Tsai, Y.-T. Evaluation on algorithm reliability and efficiency for an image flame detection technology. J. Therm. Anal. Calorim. 2023, 148, 5063–5070. [Google Scholar] [CrossRef]
- Yang, Y.; Yuan, H.; Li, Z.; Tsai, Y. Investigation on incompatible hazards of nitrocellulose mixed with three types of copper compounds. J. Therm. Anal. Calorim. 2023, 148, 4699–4706. [Google Scholar] [CrossRef]
- Tong, D.; Cheng, J.; Liu, Y.; Yu, S.; Yan, L.; Hong, C.; Qin, Y.; Zhao, H.; Zheng, Y.; Geng, G.; et al. Dynamic projection of anthropogenic emissions in China: Methodology and 2015–2050 emission pathways under a range of socio-economic, climate policy, and pollution control scenarios. Atmos. Chem. Phys. 2020, 20, 5729–5757. [Google Scholar] [CrossRef]
- Qinhuangdao Agriculture and Rural Bureau. General Situation of Characteristic Modern Agriculture Development in Qinhuangdao City. Available online: http://nyncj.qhd.gov.cn/home/details1?id=4518 (accessed on 23 March 2023). (In Chinese)
- Bo, X.; Qu, J.; Lei, X.; Chen, J.; Kan, H.; Zhou, T.; Ma, Y. The impact of air pollution on key industries in Tangshan City. In Proceedings of the Chinese Society for Environmental Sciences, Hefei, China, 1–3 August 2018; pp. 110–119. [Google Scholar]
- Tang, L.; Jia, M.; Bo, X.; Xue, X.; Guo, J.; Tian, J.; Huang, M.; Wang, T.; Cui, L.; Dong, G. High resolution emission inventory and atmospheric environmental impact research in Chinese iron and steel industry. China Environ. Sci. 2020, 40, 1493–1506. [Google Scholar]
- Department of Ecology and Environment of Hebei Province. 2021 Hebei Province Ecology and Environment Condition Statement; Department of Ecology and Environment of Hebei Province: Shijiazhuang, China, 2020.
- Zhang, M.; Chen, W.; Shen, X.; Zhao, H.; Gao, C.; Zhang, X.; Liu, W.; Yang, C.; Qin, Y.; Zhang, S.; et al. Comprehensive and high-resolution emission inventory of atmospheric pollutants for the northernmost cities agglomeration of Harbin-Changchun, China: Implications for local atmospheric environment management. J. Environ. Sci. 2021, 104, 150–168. [Google Scholar] [CrossRef]
- Ministry of Ecology and Environment of the People’s Republic of China. Technical Guidelines for the Preparation of Air Pollutant Emission Inventory from Non-Road Mobile Sources (Trial). Available online: https://www.mee.gov.cn/gkml/hbb/bgg/201501/t20150107_293955.htm (accessed on 31 December 2014). (In Chinese)
- Ministry of Ecology and Environment of the People’s Republic of China. Technical Guidelines for the Preparation of Dust Source Particulate Matter Emission Inventory (Trial). Available online: https://www.mee.gov.cn/gkml/hbb/bgg/201501/t20150107_293955.htm (accessed on 31 December 2014). (In Chinese)
- Ministry of Ecology and Environment of the People’s Republic of China. Technical Guidelines for the Preparation of Atmospheric Ammonia Emission Inventory (Trial). Available online: https://www.mee.gov.cn/gkml/hbb/bgg/201408/t20140828_288364.htm (accessed on 31 December 2014). (In Chinese)
- Ministry of Ecology and Environment of the People’s Republic of China. Technical Guide for Compiling Air Pollutant Emission Inventory of Civil Coal (Trial). Available online: https://www.mee.gov.cn/gkml/hbb/bgg/201610/t20161031_366528.htm (accessed on 26 October 2016). (In Chinese)
- Bo, X.; Xue, X.; Xu, J.; Du, X.; Zhou, B.; Tang, L. Aviation’s emissions and contribution to the air quality in China. Atmos. Environ. 2019, 201, 121–131. [Google Scholar] [CrossRef]
- Bo, X. Emission Characteristics and Environmental Impacts of Air Pollutants in China’s Iron and Steel Industry. Ph.D. Thesis, University of Science and Technology Beijing, Beijing, China, 2020. [Google Scholar]
- Department of Ecology and Environment of Hebei Province. Interpretation of Three Local Standards: “Standards for Ultra-low Emission of Air Pollutants in the Cement Industry” and Others. Available online: http://hbepb.hebei.gov.cn/hbhjt/zwgk/zc/101612404329562.html (accessed on 13 March 2020). (In Chinese)
- Hua, H.; Jiang, S.; She, H.; Zhang, Y.; Liu, X.; Zhang, L.; Yuan, Z.; Chen, T. A high spatial-temporal resolution emission inventory of multi-type air pollutants for Wuxi city. J. Clean. Prod. 2019, 229, 278–288. [Google Scholar] [CrossRef]
- Zhao, Y.; Zhou, Y.; Qiu, L.; Zhang, J. Quantifying the uncertainties of China’s emission inventory for industrial sources: From national to provincial and city scales. Atmos. Environ. 2017, 165, 207–221. [Google Scholar] [CrossRef]


| Scenario | Year | Industry | Output (kt) 1 |
|---|---|---|---|
| BAU | 2016 | Iron and steel | 60,691.29 |
| Cement | 5663.42 | ||
| Flat glass | 726.75 | ||
| 2025 | Iron and steel | 189,411.80 | |
| Cement | 14,635.83 | ||
| Flat glass | 565.97 | ||
| 2030 | Iron and steel | 248,703.52 | |
| Cement | 18,603.88 | ||
| Flat glass | 489.60 | ||
| ULE | 2016 | Iron and steel | 60,691.29 |
| Cement | 5663.42 | ||
| Flat glass | 726.75 | ||
| 2025 | Iron and steel | 189,411.80 | |
| Cement | 14,635.83 | ||
| Flat glass | 565.97 | ||
| 2030 | Iron and steel | 248,703.52 | |
| Cement | 18,603.88 | ||
| Flat glass | 489.60 | ||
| PPC | 2016 | Iron and steel | 60,691.29 |
| Cement | 5663.42 | ||
| Flat glass | 726.75 | ||
| 2025 | Iron and steel | 60,691.29 | |
| Cement | 5663.42 | ||
| Flat glass | 726.75 | ||
| 2030 | Iron and steel | 60,691.29 | |
| Cement | 5663.42 | ||
| Flat glass | 726.75 |
| Sources | SO2 | NOx | CO | PM10 | PM2.5 | BC | OC | VOCs | NH3 |
|---|---|---|---|---|---|---|---|---|---|
| Fossil fuel combustion | 12.16 | 12.26 | 184.80 | 18.29 | 9.21 | 1.41 | 0.27 | 7.12 | 0.46 |
| Industrial processes | 35.33 | 34.34 | 926.20 | 233.65 | 92.33 | 0.83 | 1.64 | 21.63 | 1.45 |
| Mobile | 0.45 | 39.79 | 31.15 | 2.40 | 2.26 | 0.68 | 0.52 | 6.79 | 0.26 |
| Solvent use | 0 | 0 | 0 | 0 | 0 | 0 | 0 | 5.20 | 0 |
| Agriculture | 0 | 0 | 0 | 0 | 0 | 0 | 0 | 0 | 59.95 |
| Fugitive dust | 0 | 0 | 0 | 42.55 | 8.41 | 0 | 0 | 0 | 0 |
| Storage and transportation | 0 | 0 | 0 | 0 | 0 | 0 | 0 | 5.40 | 0 |
| Biomass burning | 0.97 | 0.43 | 66.66 | 4.93 | 4.59 | 0.87 | 0.18 | 5.78 | 0.37 |
| Waste treatment | 0 | 0 | 0 | 0 | 0 | 0 | 0 | 0.63 | 0.38 |
| Others (catering) | 0 | 0 | 0 | 0.18 | 0.15 | 0.003 | 0.10 | 0.13 | 0 |
| Sum | 48.91 | 86.83 | 1208.80 | 302.01 | 116.85 | 3.79 | 2.72 | 52.69 | 62.87 |
| Reference | Base Year | Region | Reference Policy | Industry | SO2 Emission Reduction (%) | NOx Emission Reduction (%) | PM10 Emission Reduction (%) |
|---|---|---|---|---|---|---|---|
| Bo et al. [51] | 2013 | Tangshan | Air Pollution Prevention and Control Action Plan | Iron and steel | 2.28 | 5.97 | 37.02 |
| Cement | 0 | 7.55 | 25.00 | ||||
| This study | 2016 | Qinhuangdao | ULE | Iron and steel | 70.65 | 66.21 | 93.44 |
| Cement | 69.33 | 72.37 | 99.70 | ||||
| Flat glass | 93.21 | 88.06 | 99.44 | ||||
| Tang et al. [52] | 2018 | China | ULE | Iron and steel | 82.98 | 88.61 | 85.69 |
| Reference | Year | Region | SO2 | NOx | PM10 | PM2.5 | CO | VOCs | NH3 | BC | OC |
|---|---|---|---|---|---|---|---|---|---|---|---|
| Qi et al. [6] | 2013 | Qinhuangdao | 87.9 | 116.7 | 47.7 | 32.9 | 694.1 | 48.1 | 24.3 | 3.3 | 5.7 |
| MEIC [9] | 2016 | Qinhuangdao | 39.3 | 76.6 | 33.9 | 25.1 | 578.5 | 70.2 | 23.1 | 4.3 | 6.3 |
| CHRED 3.0A [8] | 2018 | Qinhuangdao | 26.2 | 40.8 | 22.6 | 18.1 | 763.6 | 59.9 | 26.2 | 2.7 | 5.7 |
| This study | 2016 | Qinhuangdao | 48.9 | 86.8 | 302.0 | 116.8 | 1208.8 | 52.7 | 62.9 | 3.8 | 2.7 |
| The ID of the Air Monitoring Station | The Contribution of Average Annual Concentration under the BAU Scenario (μg/m3) | The Contribution of Average Annual Concentration under the PPC Scenario (μg/m3) | ||||
|---|---|---|---|---|---|---|
| SO2 | NOx | PM10 | SO2 | NOx | PM10 | |
| 1 | 11.64 | 50.07 | 118.52 | 6.04 | 29.39 | 52.28 |
| 2 | 9.74 | 63.27 | 117.66 | 4.73 | 35.70 | 55.32 |
| 3 | 10.21 | 52.08 | 96.89 | 4.48 | 31.12 | 42.25 |
| 4 | 4.42 | 28.45 | 36.95 | 2.35 | 15.40 | 18.99 |
| 5 | 5.02 | 10.84 | 117.78 | 2.72 | 6.57 | 53.91 |
| Pollutant | SO2 | NOx | CO | PM10 | PM2.5 | VOCs | NH3 | BC | OC |
|---|---|---|---|---|---|---|---|---|---|
| Uncertainty | −6% to 6% | −7% to 7% | −6% to 6% | −6% to 6% | −7% to 7% | −7% to 7% | −37% to 39% | −17% to 19% | −16% to 19% |
Disclaimer/Publisher’s Note: The statements, opinions and data contained in all publications are solely those of the individual author(s) and contributor(s) and not of MDPI and/or the editor(s). MDPI and/or the editor(s) disclaim responsibility for any injury to people or property resulting from any ideas, methods, instructions or products referred to in the content. |
© 2023 by the authors. Licensee MDPI, Basel, Switzerland. This article is an open access article distributed under the terms and conditions of the Creative Commons Attribution (CC BY) license (https://creativecommons.org/licenses/by/4.0/).
Share and Cite
Shan, W.; Chen, S.; Wang, G.; Li, J.; Bo, X. Clearing the Air: Assessing the Effectiveness of Emission Policy in Qinhuangdao’s Key Industries. Atmosphere 2023, 14, 1218. https://doi.org/10.3390/atmos14081218
Shan W, Chen S, Wang G, Li J, Bo X. Clearing the Air: Assessing the Effectiveness of Emission Policy in Qinhuangdao’s Key Industries. Atmosphere. 2023; 14(8):1218. https://doi.org/10.3390/atmos14081218
Chicago/Turabian StyleShan, Wanyue, Shaobo Chen, Gang Wang, Jianhui Li, and Xin Bo. 2023. "Clearing the Air: Assessing the Effectiveness of Emission Policy in Qinhuangdao’s Key Industries" Atmosphere 14, no. 8: 1218. https://doi.org/10.3390/atmos14081218
APA StyleShan, W., Chen, S., Wang, G., Li, J., & Bo, X. (2023). Clearing the Air: Assessing the Effectiveness of Emission Policy in Qinhuangdao’s Key Industries. Atmosphere, 14(8), 1218. https://doi.org/10.3390/atmos14081218