Communication

The Characteristics of the Abnormal Day-to-Day TEC Variation above East Asian Region

1
Institute of Seismology, China Earthquake Administration, Wuhan 430071, China
2
Key Laboratory of Earthquake Geodesy, China Earthquake Administration, Wuhan 430071, China
3
Hubei Earthquake Administration, Wuhan 430071, China
*
Author to whom correspondence should be addressed.
Atmosphere 2023, 14(10), 1493; https://doi.org/10.3390/atmos14101493
Submission received: 15 August 2023 / Revised: 15 September 2023 / Accepted: 20 September 2023 / Published: 27 September 2023

Abstract

:
We investigate the abnormal day-to-day variability of total electron content (TEC) over 60 Global Navigation Satellite System (GNSS) stations above the East Asian region from 2012 to 2018 and find that the positive anomalies occur more frequently at the middle latitude at about LT 14–20 and occur frequently around 28° N at about LT 22–00. The negative anomalies occur more frequently at the middle latitude at LT 10–02, and they obviously occur less frequently at about 15° N~30° N and LT 08–12, and occur less frequently near about 22° N~30° N and LT 14–18. The quantities of positive anomalies and negative anomalies are comparable. The direction of moving anomalies is from east to west in a zonal direction in all conditions. The moving speeds of anomalies are around 15~19 degrees per hour in the zonal direction and seem to grow as the latitude increases. TEC anomalies occur in 22.1% of temporal bins before large earthquakes within seven days and occur in 24% of temporal bins in the interval, which is within one day before and three days later than the main phase of geomagnetic storms. Further work is necessary to determine the sources of these anomalies.

1. Introduction

The ionosphere is highly variable. The primary drivers of this variability are linked to solar activity, geomagnetic activity, and processes from lower atmospheric sources [1,2,3]. Total electron content (TEC) is the total number of electrons along the path between the transmitter and receiver of the global position system. It is a critical ionospheric parameter that can help mitigate uncertainties in location and navigation. Solar radiation, solar wind, geomagnetic activity, different scales of neutral atmosphere waves, and electrodynamic processes significantly contribute to the day-to-day TEC variability. The temporal and spatial characteristics of day-to-day variations of TEC are important to provide improved ionospheric specifications and forecasts. There are many interesting studies about the day-to-day variations of TEC or F2 layer peak density (NmF2, which contributes much to TEC). Rishbeth and Mendillo [4] found that the day-to-day variability of NmF2 exhibited a relative standard deviation of 20% by day and 33% by night using ionosonde data from 13 stations with geomagnetic latitudes from −58 to +51 in 1957–1990. The day-to-day variability strength is height-dependent, according to the results from incoherent scatter radar [5]. The meridional correlation lengths of day-to-day ionospheric TEC variations, which were obtained from more than 1000 ground-based GPS receivers on a global scale, were about 7 degrees and 4 degrees at middle and low latitudes, respectively. The zonal correlation lengths were approximately 20 degrees at mid-latitudes and 11 degrees at low latitudes [6]. Day-to-day variation of TEC over China during 1–28 January 2015 had a good correlation with F10.7 cm flux in a purely quiet period, and Kp index was closely linked to day-to-day TEC variation during geomagnetic disturbance conditions [7].
Forbes et al. (2000) analyzed the ionosonde data from over 100 globally distributed stations under geomagnetic quiet conditions and attributed about 25–35% variation of day-to-day NmF2 to meteorological influences. Fang et al. [8] explored the relative contributions of different sources with simulation and found that ~40% of TEC day-to-day variability was caused by lower atmospheric perturbations during the northern summer of 2012. Zhou et al. [9] suggested that taking day-to-day variability in lower atmospheric perturbations into account was important for characterizing the semiannual variations when simulating nighttime NmF2 day-to-day variability.
Although many studies have revealed the day-to-day variations of TEC, detailed information about the day-to-day variations of TEC in specific locations, such as the East Asian region, is limited. Ban et al. [10] put forward a regional perturbation index to depict the ionospheric storm magnitude. But the moving speed of the disturbance is out of the scope of many studies. The goal of this study is to demonstrate the characteristics of TEC anomalies (dramatic changes) of day-to-day variability above the East Asian region, including the temporal and spatial distribution and the moving speed.
In this study, TEC measurements from 60 GNSS receivers above the East Asian region were used to explore the characteristics of abnormal day-to-day TEC changes in the specific region. In Section 2, we present the method to conduct TEC for our analysis. Our results are presented in Section 3. The discussion and conclusions are in Section 4 and Section 5.

2. Method

We analyze the day-to-day changes from 2012 to 2018 above the East Asian region with the TEC from 60 GNSS continuously operating reference stations of the CMONOC (Crustal Movement Observation Network of China) network, which are relatively evenly distributed in China, as shown in Figure 1. The distribution of these stations, which is used for the calculation of TEC, has not changed in these years. In this case, we use the Bernese GNSS software to realize the calculation of TEC. The coverage area of the regional model is [70° E–140° E, 15° N–55° N], and the spatial resolution of TEC is 1 degree in geographic longitude and 1 degree in geographic latitude. The sample time is 2 h. The TEC calculated from Bernese GNSS software on a regional scale has been compared with the GIM (Global Ionospheric Map) from CODE (Center for Orbit Determination in Europe) and other global ionospheric maps in many references, e.g., [11,12,13]. The Bernese GNSS Software is a scientific, high-precision, multi-GNSS data processing software developed at the Astronomical Institute of the University of Bern (AIUB). It is used by CODE for its international (IGS) and European activities. The GNSS stations supply the measurements of the pseudorange and the carrier phase at the two working frequencies of GNSS. We can obtain the pseudorange TEC (STECr) and phase TEC (STECp) along the path from a satellite to a receiver from Equation (1):
S T E C r = f 1 2 f 2 2 40.3 ( f 2 2 f 1 2 ) [ ( P 1 P 2 ) c ( b s 1 b s 2 ) c ( b r 1 b r 2 ) ]
where f1 and f2 are the two frequencies of the GNSS signal, P1 and P2 are the pseudoranges, c is the speed of light, and b s 1 b s 2 and b r 1 b r 2 are the interfrequecy biases for the satellite amd receivers. The phase TEC is in Equation (2):
STECp = f 1 2 f 2 2 40.3 ( f 1 2 f 2 2 ) [ ( c Φ 1 f 1 c Φ 2 f 2 ) ( λ 1 N r 1 s λ 2 N r 2 s ) ]
where Φ 1 and Φ 2 are the carrier phases, λ 1 and λ 2 are the wavelengths, and λ 1 N r 1 s λ 2 N r 2 s is the integer cycle ambiguity.
The slant TEC is converted into a vertical TEC with a single-layer model using Equation (3):
V T E C = S T E C c o s ( z )   w i t h   s i n ( z ) = R R + H s i n ( z )
where z and z’ are the zenith distances at the height of the station and the single layer, respectively, R is the mean radius of the Earth, and H is the height of the single layer above the Earth’s surface.
The regional model based on spherical harmonic expansions is then used to obtain the TEC at each position in Equation (4):
V T E C ( β , s ) = n = 0 n m a x m = 0 n P n m ( s i n β ) ( a n m c o s ( m s ) + b n m s i n ( m s ) )
where β and s are the geographic latitude and longitude of the ionospheric pierce point, n m a x is the maximum degree of the spherical harmonic expansion, P n m are the normalized associated Legendre functions of degree n and order m, and a n m and b n m are the unknown TEC coefficients of the spherical harmonics to be estimated. After obtaining the TEC coefficients with the measurements from 60 GNSS stations, we can use these coefficients to obtain the TEC at other locations.
We plan to use the following index in Equation (5) to show the variation of the day-to-day TEC changes:
D T E C i = T E C i + 1 T E C i
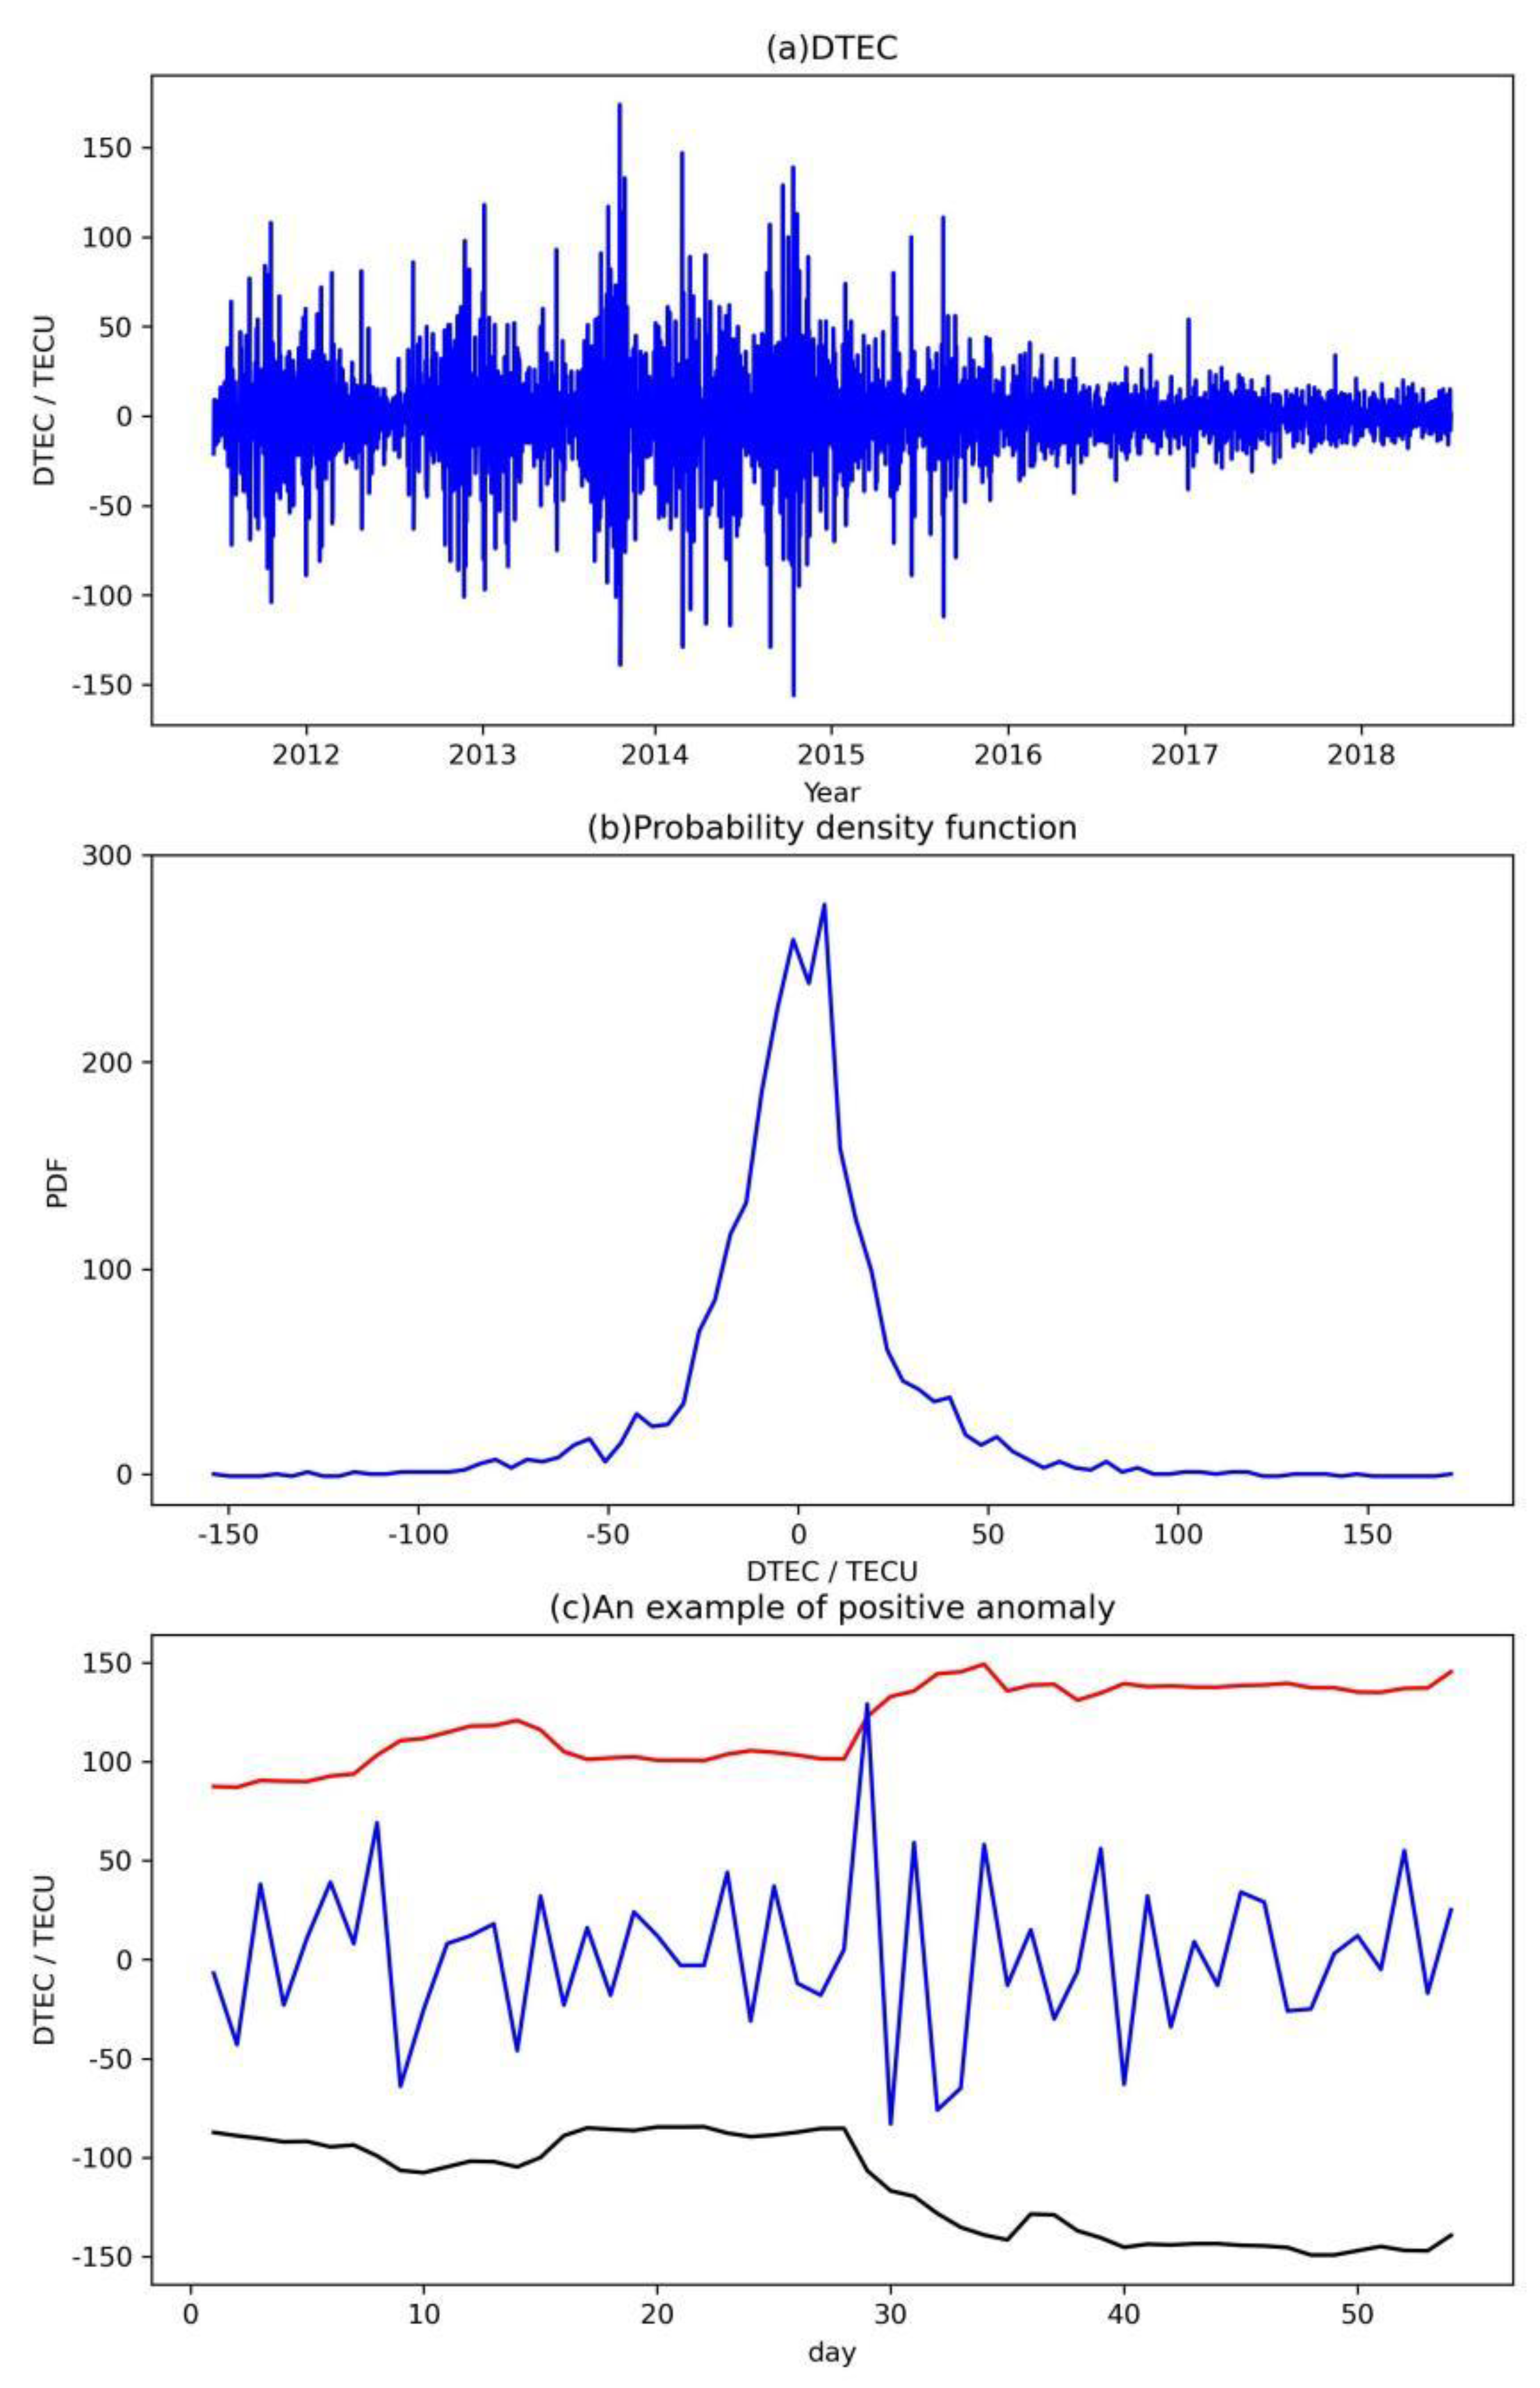
where T E C i is the TEC at certain spatial and temporal points, and T E C i + 1 is the TEC the next day at the same geography point and universal time. The day-to-day variation ( D T E C ) of TEC at [70° E, 15° N] and UT 00 from 2012 to 2018 and its probability density function are shown in Figure 2a,b as an example. The DTEC at most locations has similar variations with day of year, and they also have a similar probability density function close to a normal distribution. The data in Figure 2a,b are located at [70° E, 15° N], which have larger variations than those at the middle latitude. There should be noise in the data. We analyze the data manually, and only the anomaly that can cover a range would be treated as an anomaly and obtain the follow-up process. Thus, the single noise point would be excluded.
Then, we analyze the abnormal variation of the day-to-day TEC change using D T E C . These anomalies are the extremely large (positive) or small (negative) values of DTEC in these years. We show an example of a positive anomaly in Figure 2c. To determine whether the D T E C i is an extreme value (anomaly), we collect the data 27 days before the index at the same geographic point and universal time. For example, we collect the DTEC 27 days before D T E C i at [101°E, 51°N] and UT 12 to form a sliding window. The sample data in this sliding window are used to determine the upper limit and the lower limit. The mean value of these sample data in the sliding window is denoted as μ , and the standard deviation of these sample data is denoted as σ. When we find an index ( D T E C i ) larger than μ + 3 σ (upper limit) or less than μ 3 σ (lower limit), we consider that an anomaly of day-to-day TEC variability occurs. We treat the D T E C i larger than μ + 3 σ as a positive anomaly, and D T E C i less than μ 3 σ as a negative anomaly. We can see a positive anomaly in Figure 2c.

3. Result

3.1. Temporal and Spatial Distribution of TEC Anomaly

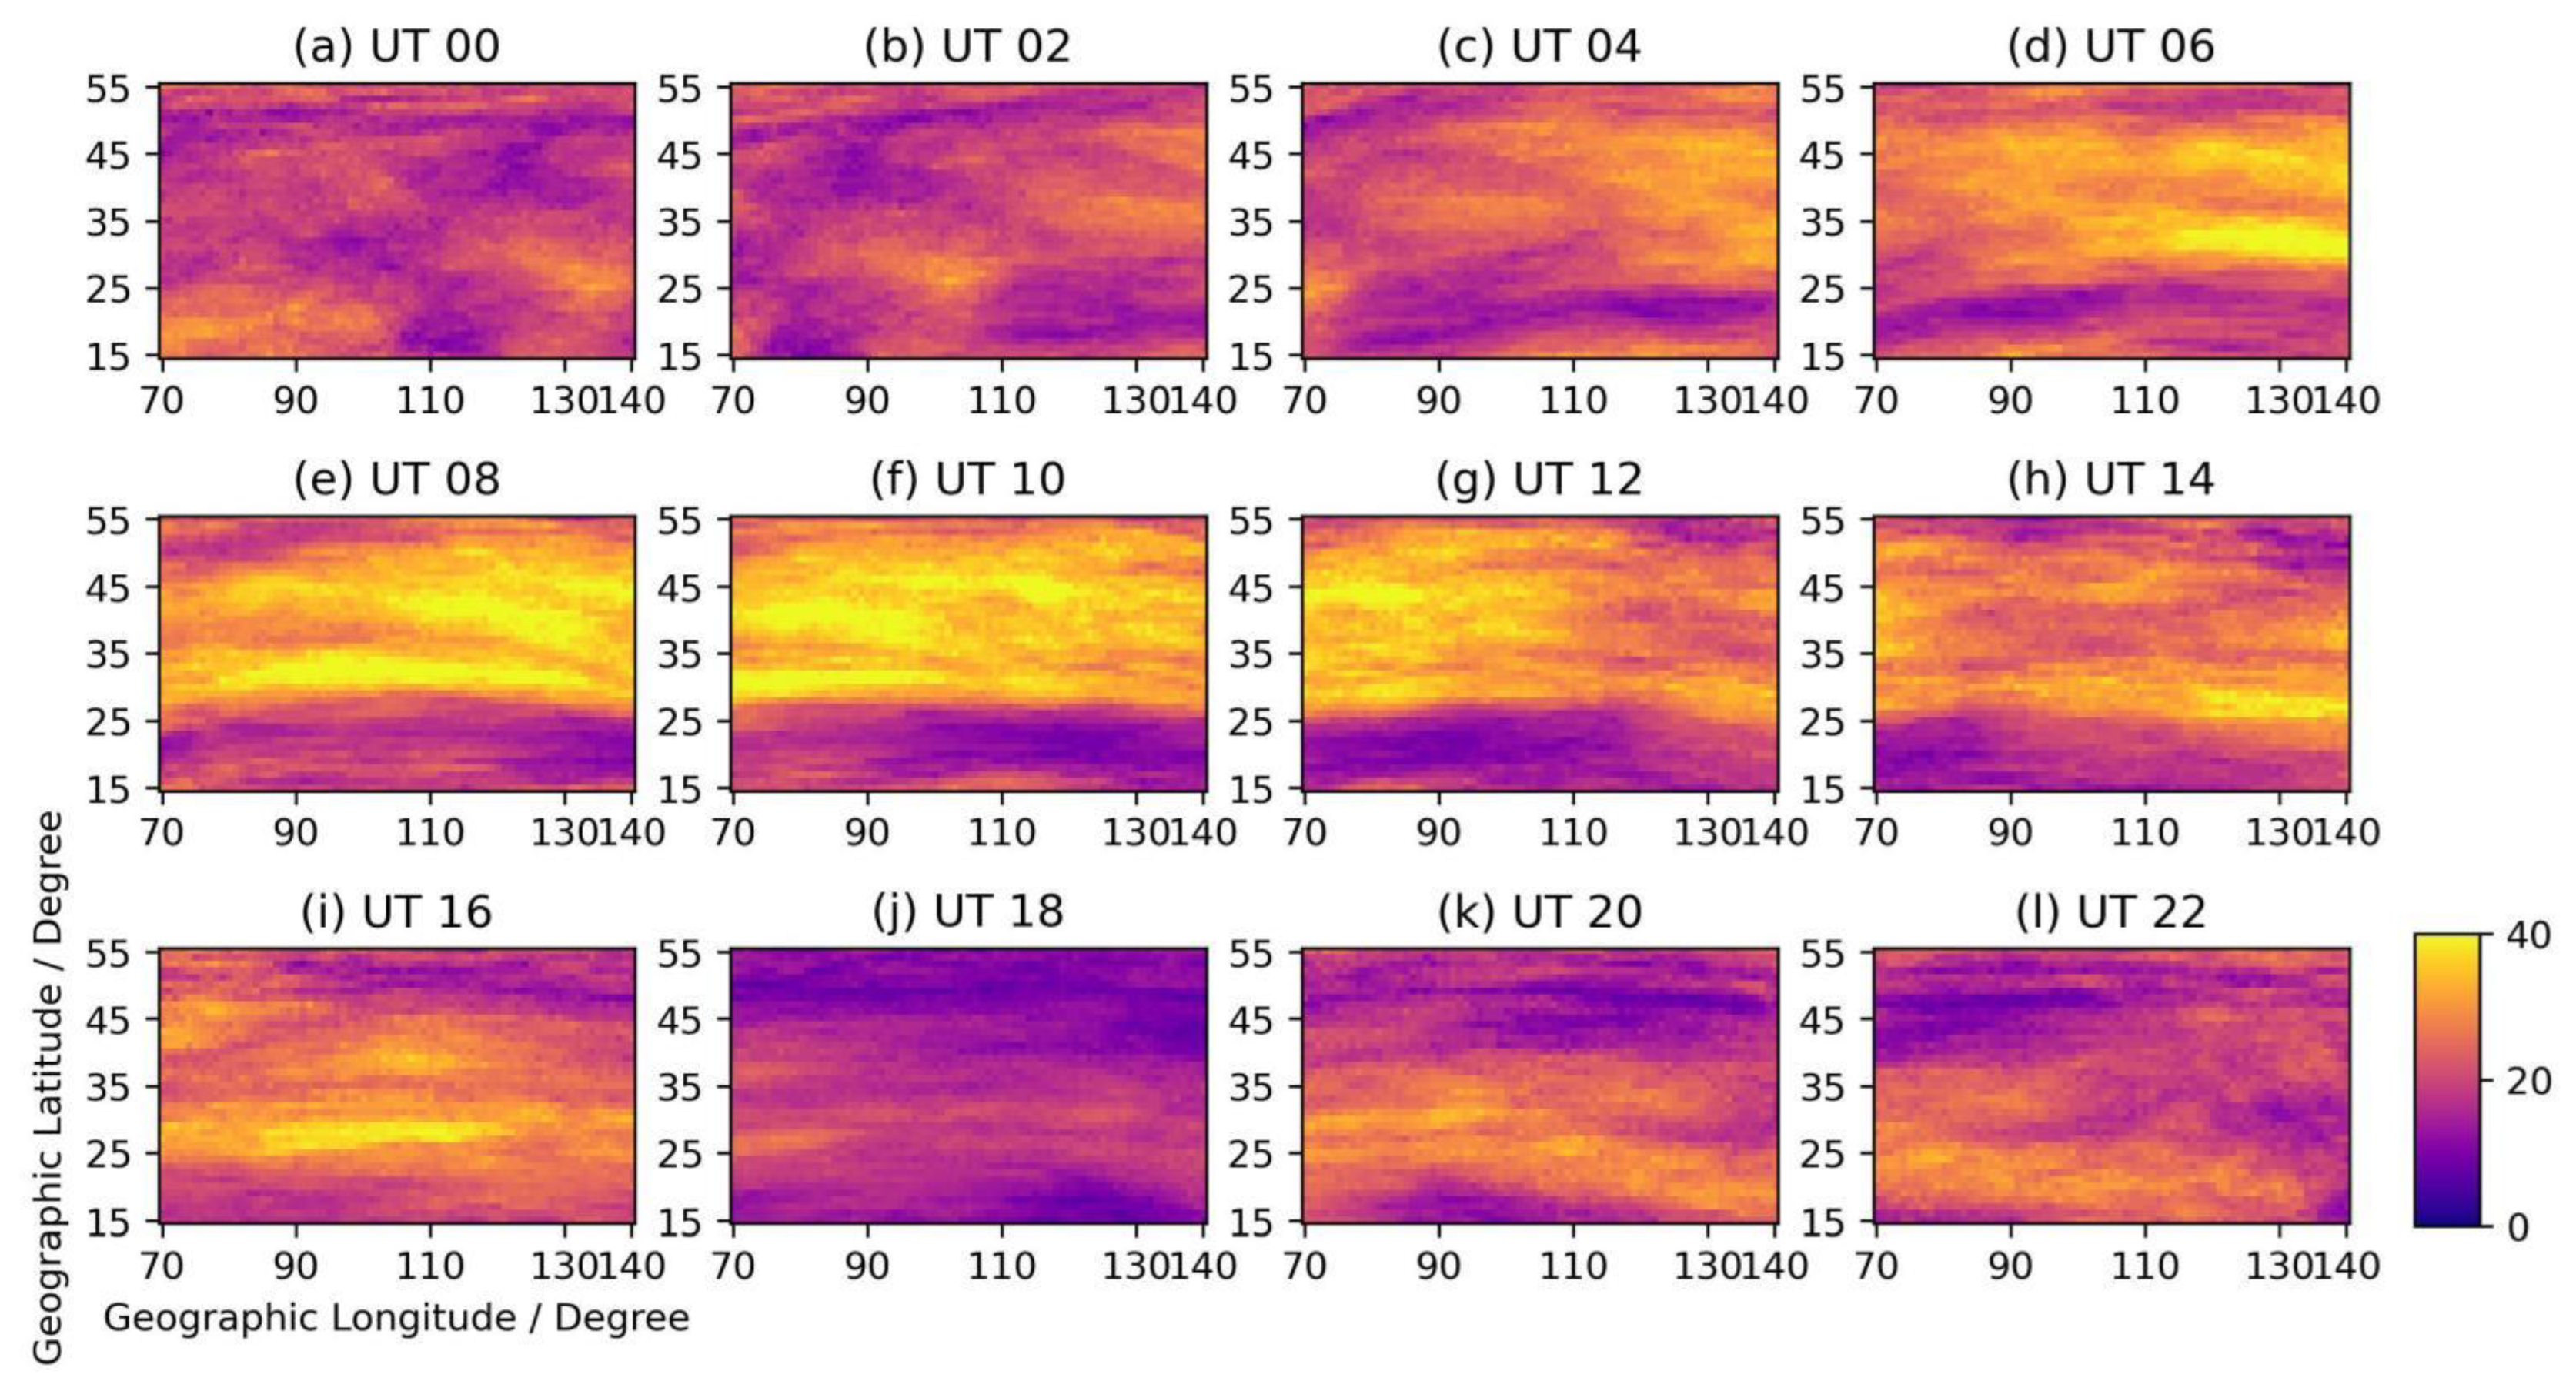
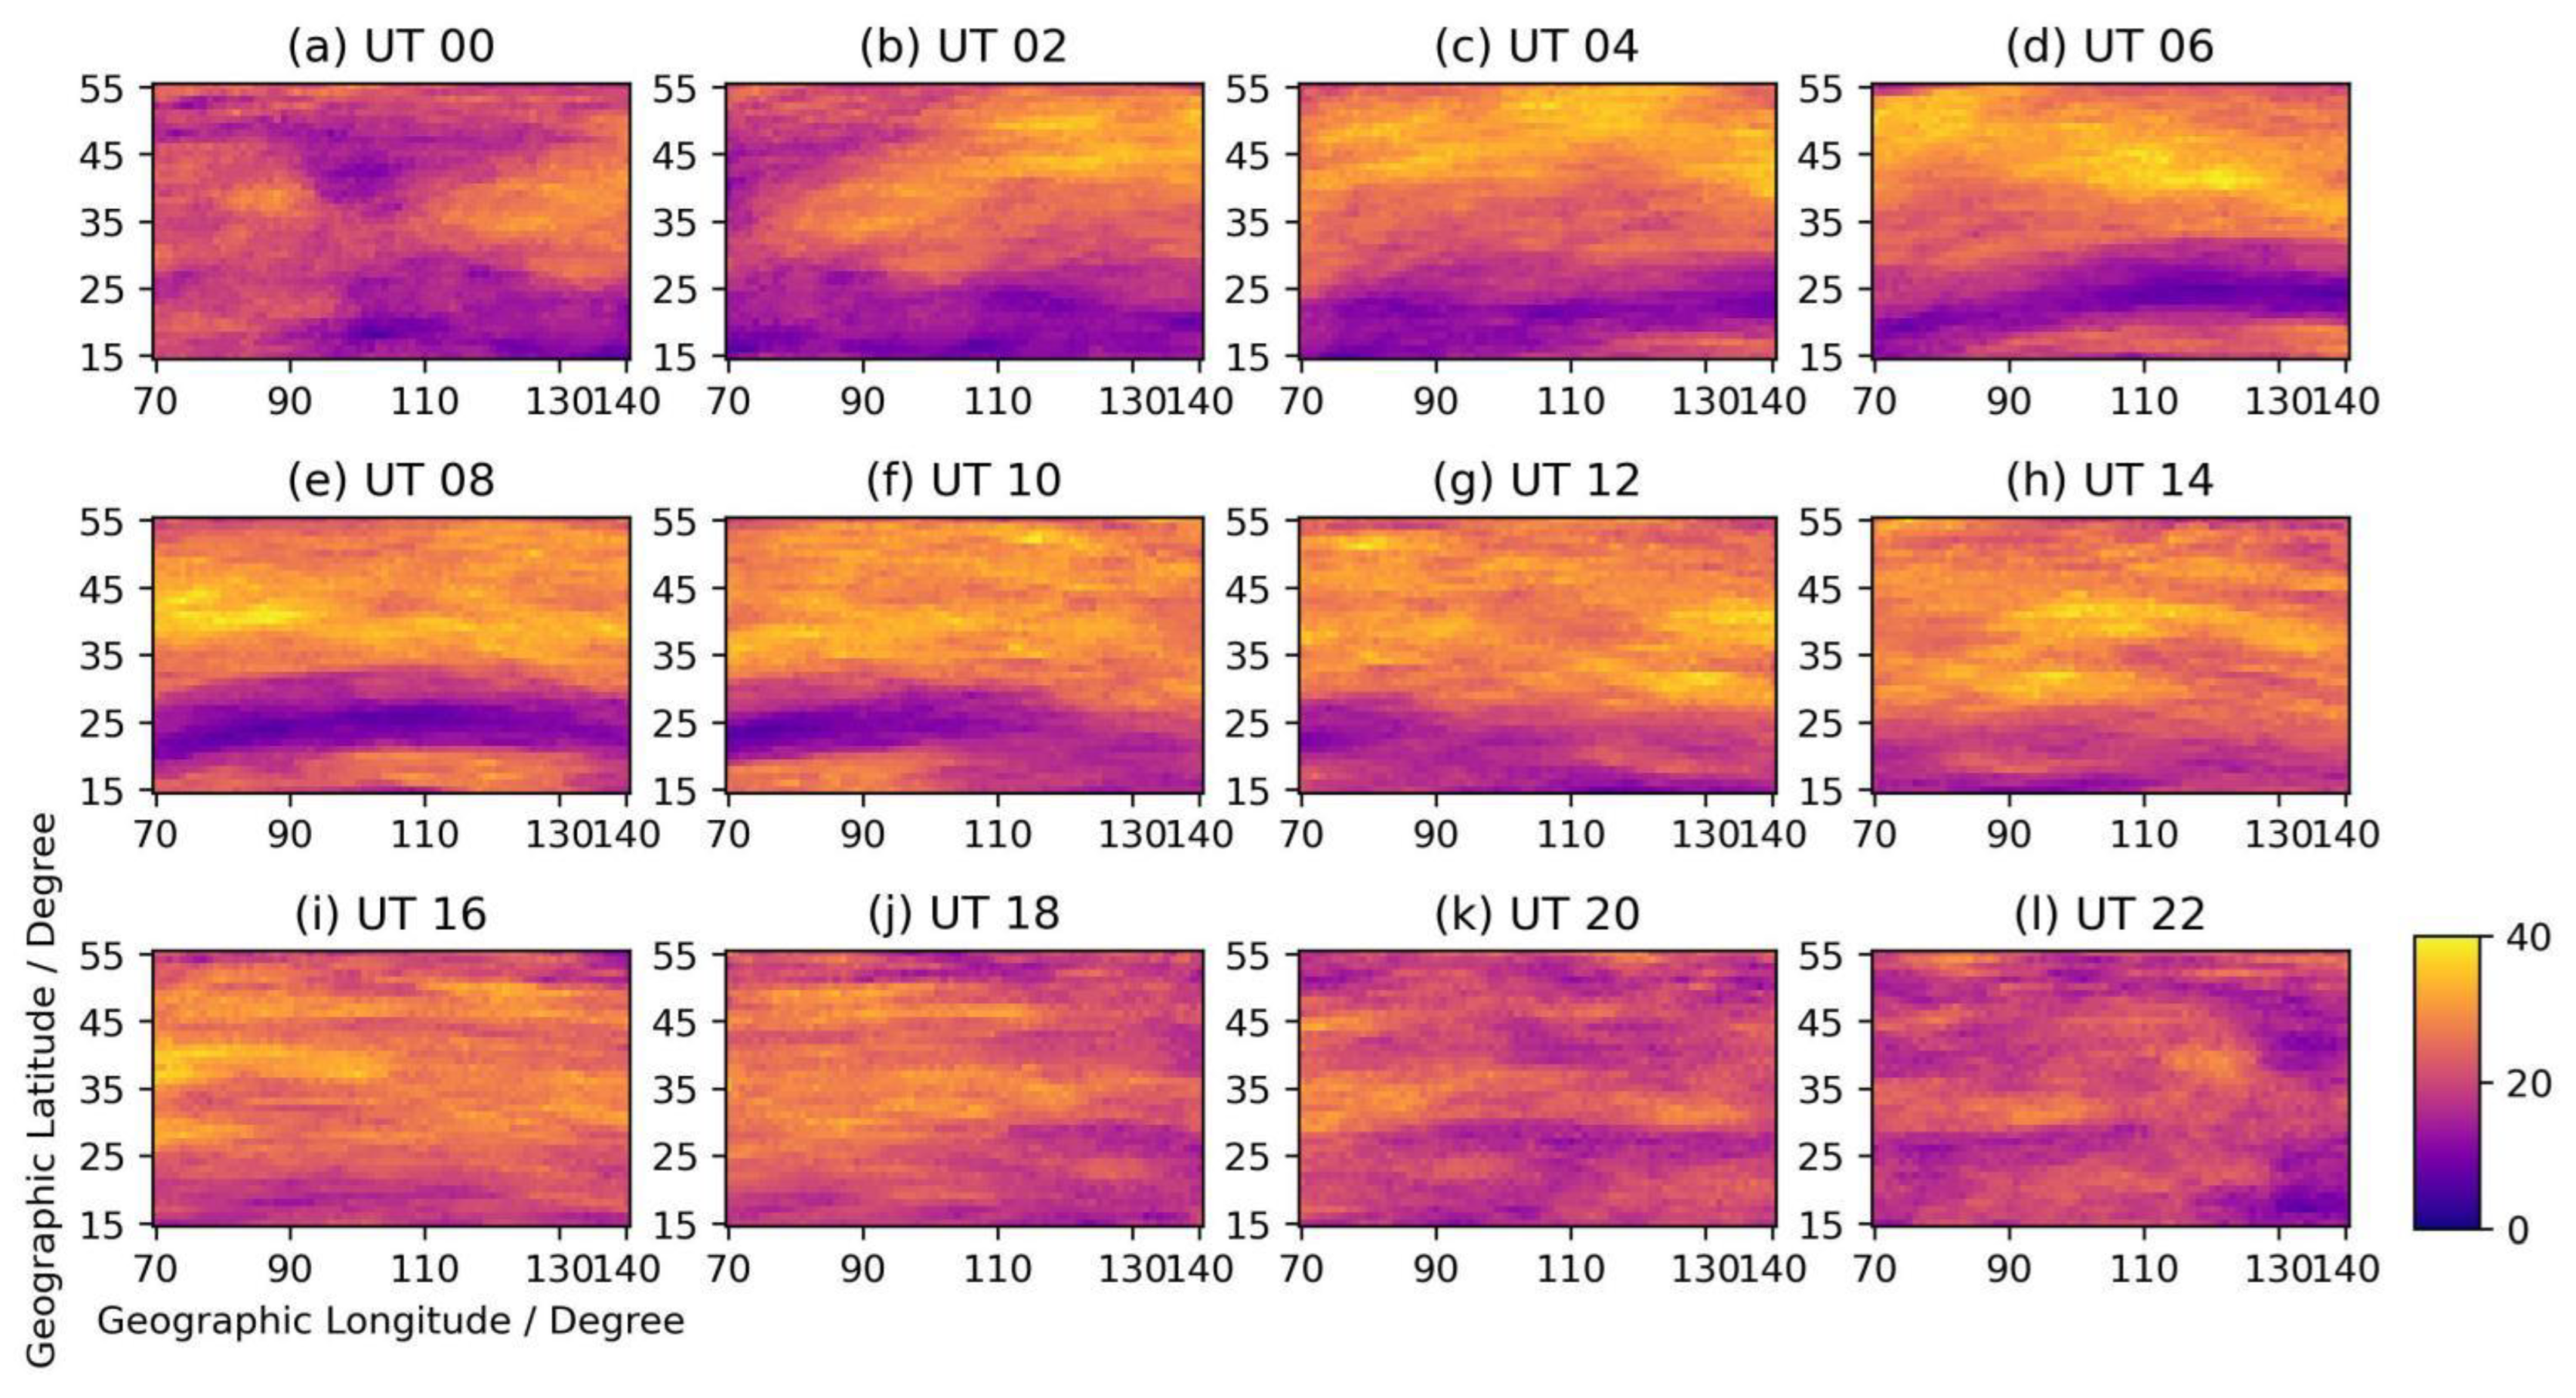
We use the data from 2012 to 2018 to determine the anomalies of day-to-day TEC variability in the way described in Section 2, and then sum up the count of the anomalies in each temporal and spatial bin in these years. The amount of positive and negative anomalies in each bin is used to show the temporal and spatial distribution. The change in temporal and spatial distribution of positive and negative TEC anomalies is shown in Figure 3 and Figure 4. The positive anomaly occurs frequently in the middle latitude (about 30° N~55° N) at UT 06–16, which is about LT 14–20, and occurs more frequently around 28° N at UT 14–18, which is mainly at about LT 22–00, as shown in Figure 3. The negative anomaly occurs more frequently at middle latitude at UT 02–18, as shown in Figure 4. They obviously occur less frequently at low latitudes (about 15° N~30° N) at UT 00–04, which is LT 08–12, and less frequently near the Equator Ionization Anomaly area (about 22° N~30° N) at UT 06–12, which is mainly at LT 14–18.
We should notice that the amount of positive and negative anomalies is comparable, although the details are different. The positive anomaly occurs less frequently at about 45° N~55° N at night. The negative anomaly occurs especially less frequently at low latitudes during the daytime. It occurs less frequently in the middle latitudes at night. Another thing we should notice is that the ionosphere at the low latitudes is highly dynamic, and the standard deviation of the data at the low latitudes is much larger than those at the middle latitudes [14], which may lead to higher thresholds of anomaly detection and lower detection probability. The day-to-day TEC variation around solar terminator passage will be large nearly every day, and the thresholds to determine an anomaly would be large in this condition, so we will not see so many huge anomalies in these periods.

3.2. Moving Anomaly of TEC Day-To-Day Variation

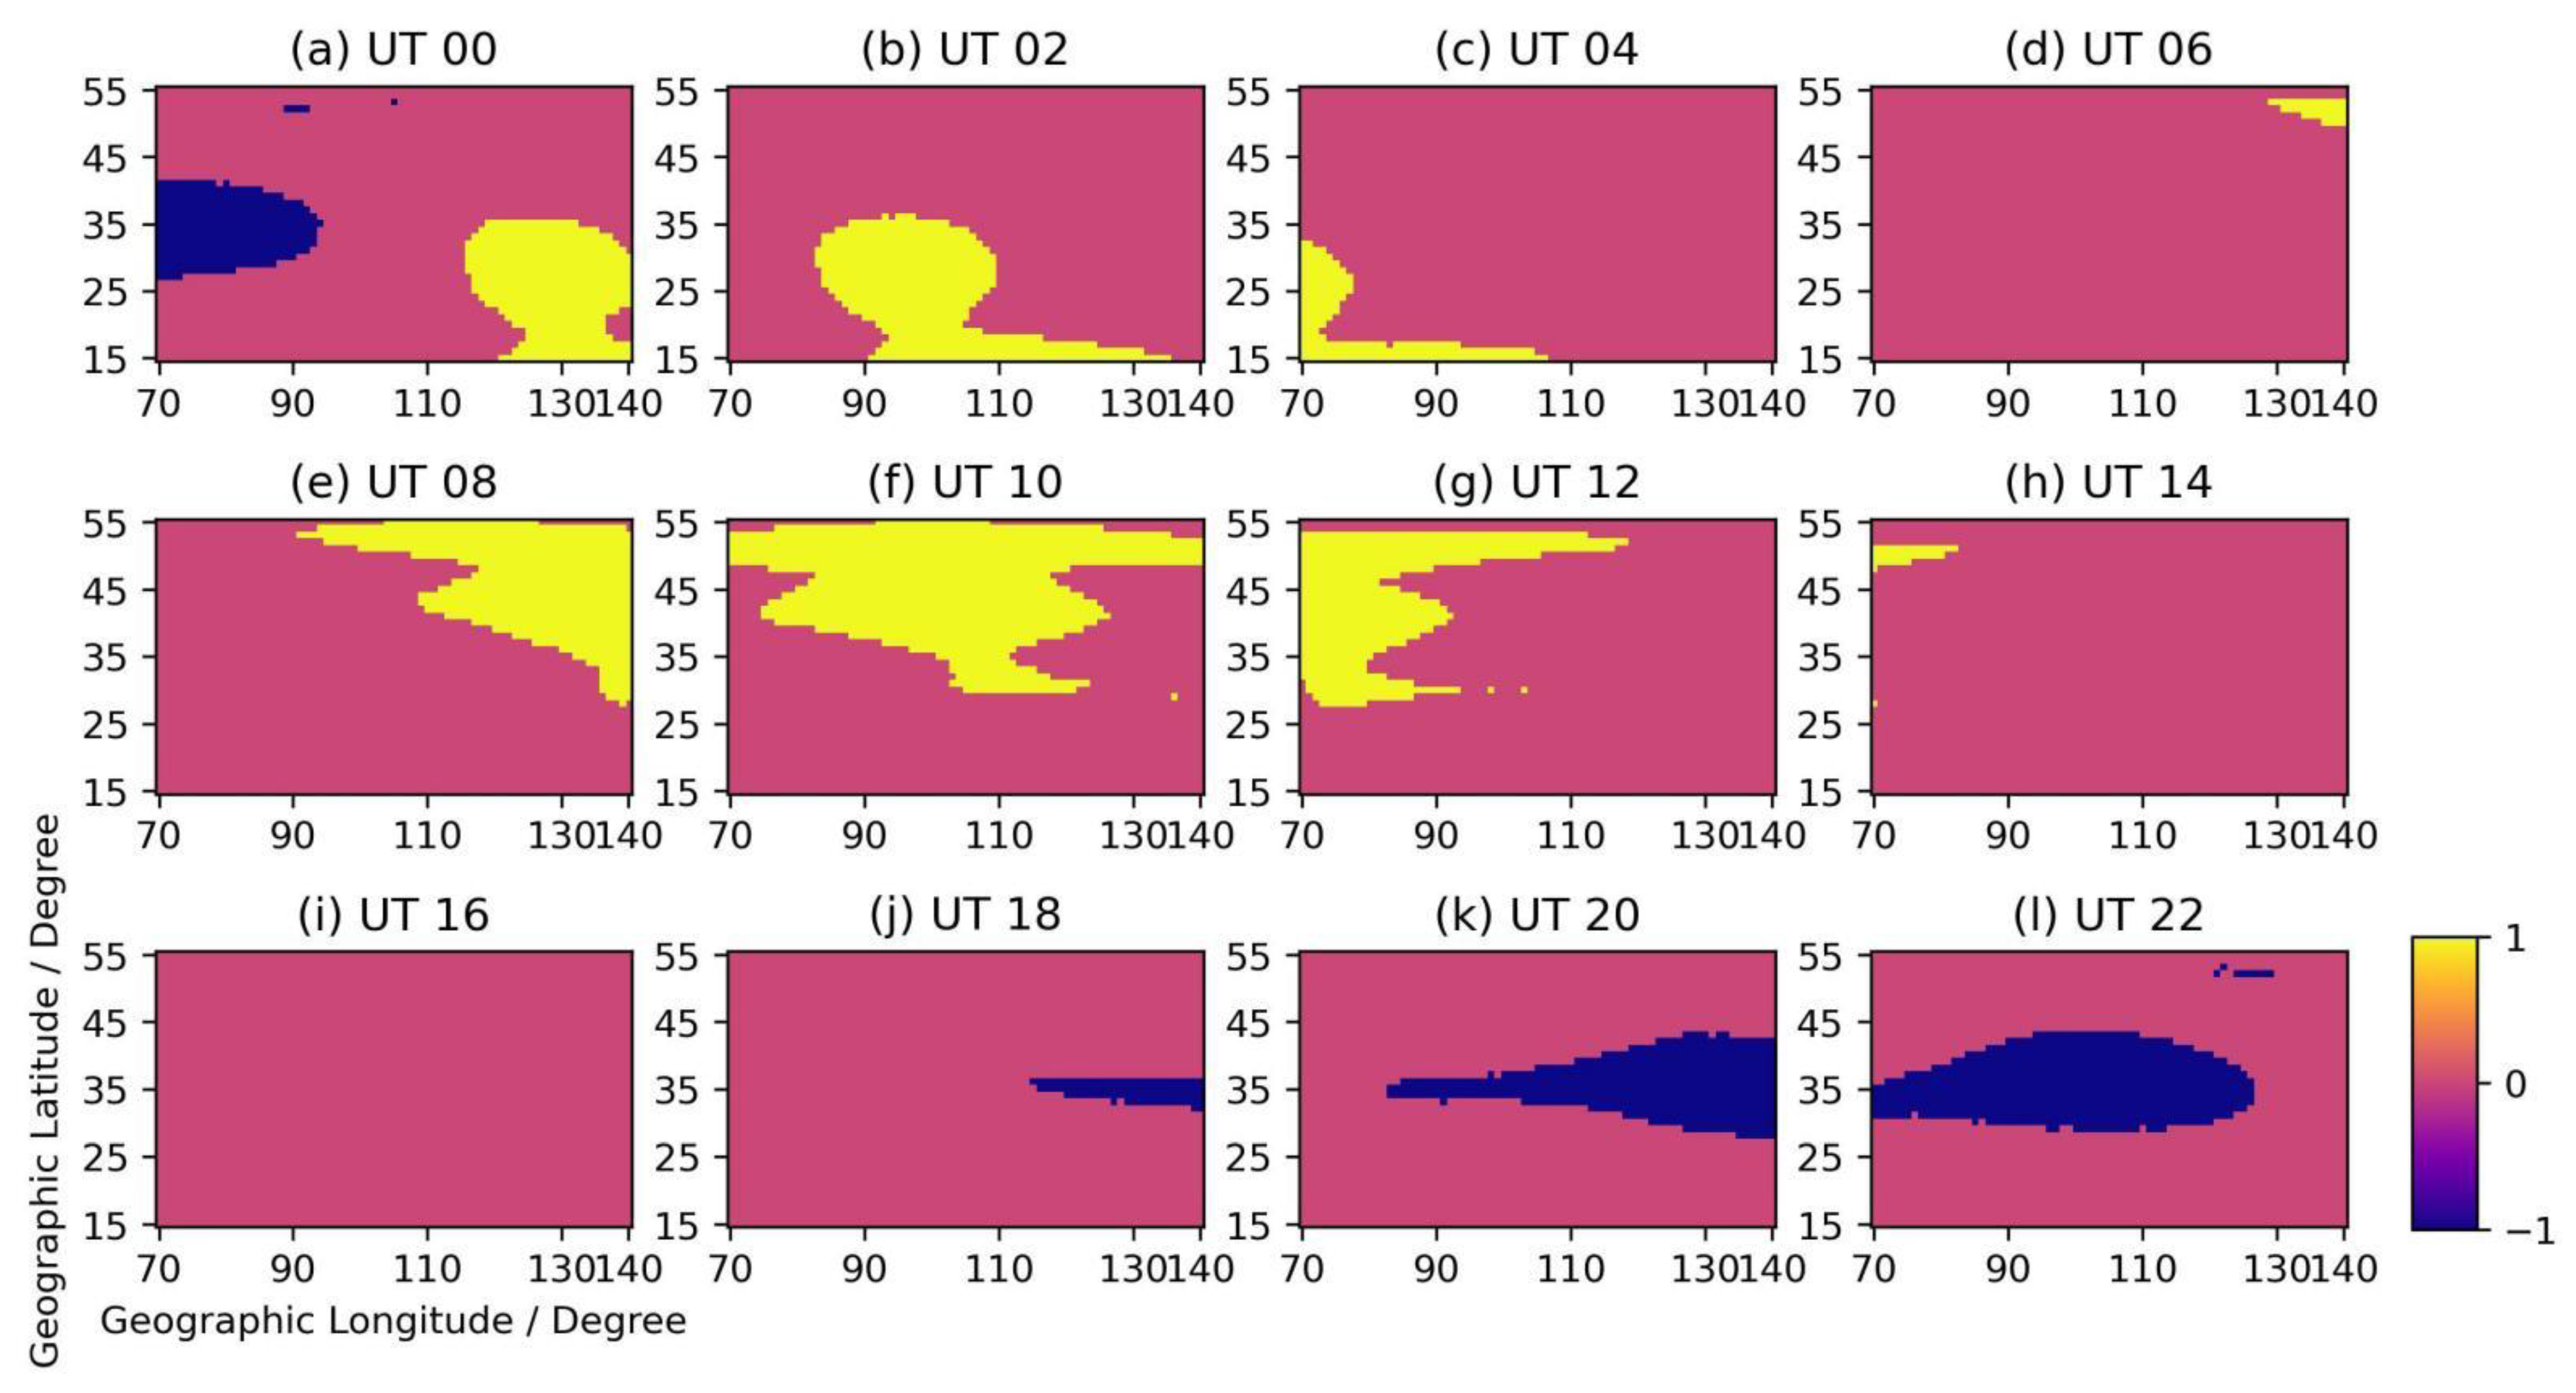
When we investigate the change in TEC anomaly, we firstly observe the spatial distribution of TEC anomaly in each temporal bin, then we check the differences in the spatial distribution of TEC anomaly over a continuous period of time. There is an interesting phenomenon: sometimes the anomaly of TEC day-to-day variation seems to be moving. For investigating the spatial distribution of anomalies at each temporal bin, we make an anomaly map in which the positive anomaly at each location is denoted as “1”, the negative anomaly is denoted as “−1”, and the location without anomalies is denoted as ”0”. Then we put 12 maps from the same day in a figure. An example is shown in Figure 5. This is the anomaly map for 5 March 2012. We can see that the shape of the anomaly at the adjacent time window looks similar. This kind of phenomenon occurs many times. It indicates that some anomalies are moving instead of staying at a fixed location.
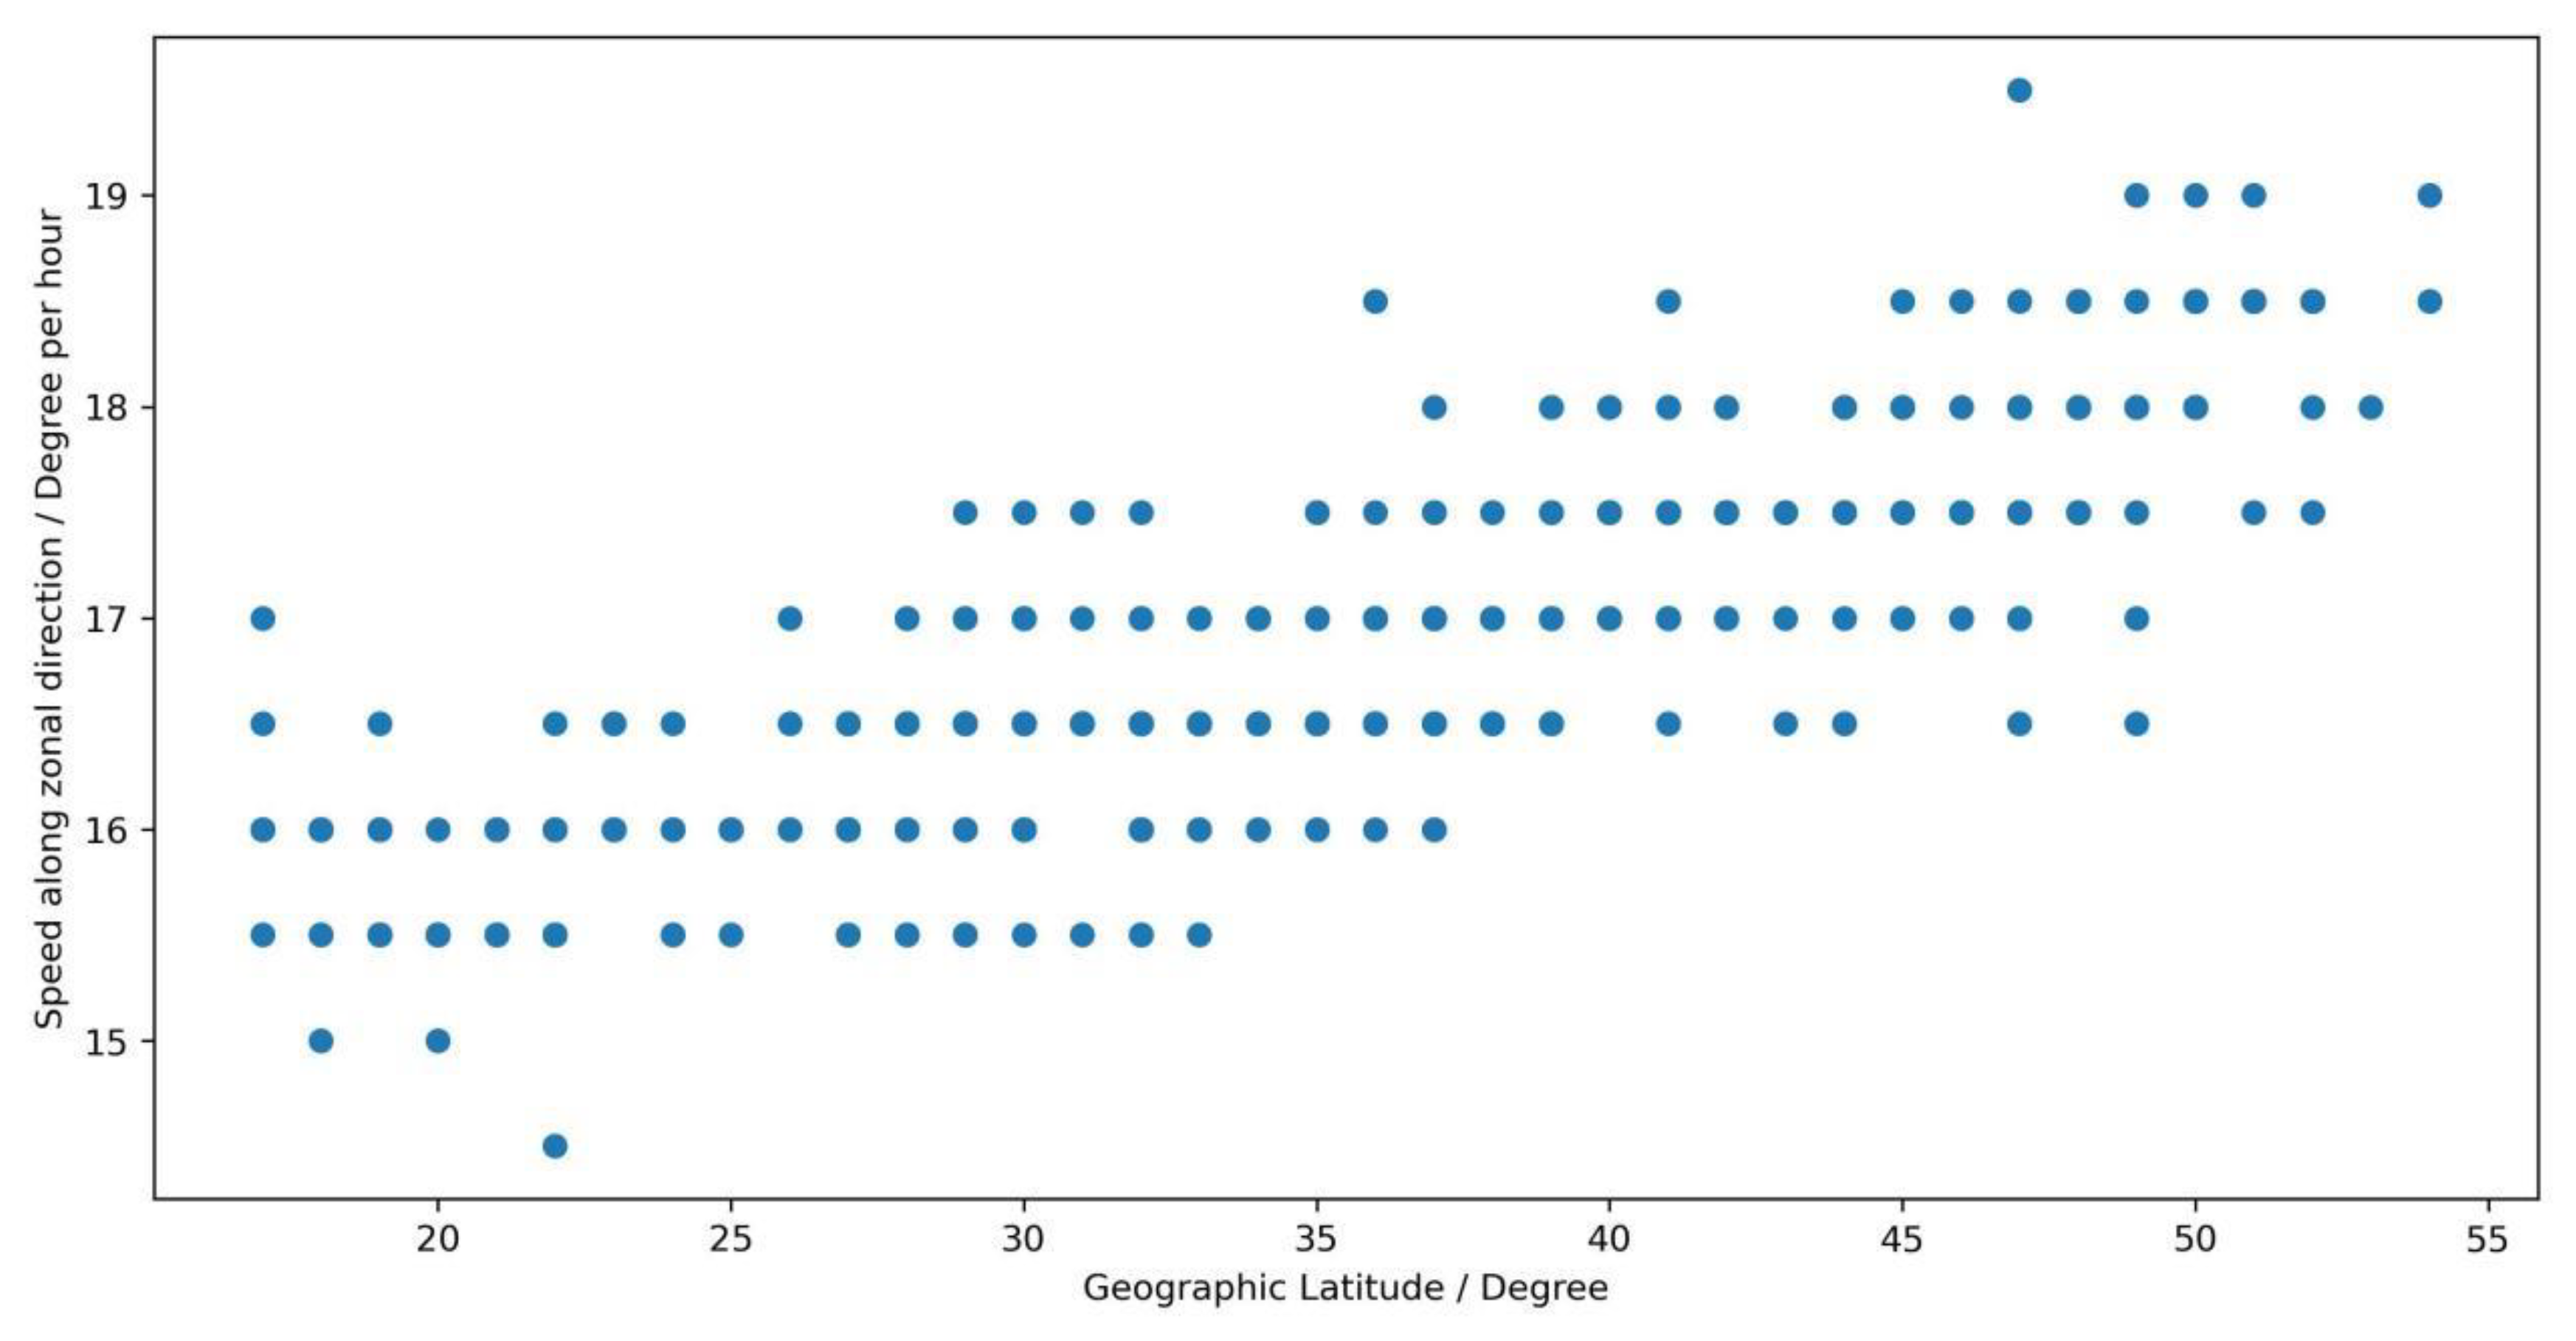
We found 850 moving TEC anomalies from 2012 to 2018, including 413 positive anomalies and 437 negative anomalies. The quantities of positive anomalies and negative anomalies are comparable. The direction of movement is from east to west in a zonal direction in all conditions. We think that the moving anomaly that we detected might be correlated to the rotation of the Earth. The anomalies may move with the Sun and have a slightly different speed relative to the Earth. We analyze the speed, temporal, and spatial distribution of the front of the moving anomalies. We obtain the speed by comparing two spatial distribution figures of anomalies with continuous time. The anomalies have characteristic points as shown in Figure 5, such as [110° E, 44° N] in Figure 5e and [76° E, 43° N] in Figure 5f. We calculate the longitudinal distance between these points, and it is 34°. The interval is 2 h. The speed is the longitudinal distance divided by the interval, and it is 17° per hour in this example. It is a rough estimate, and we find that the speeds are around 15~19 degrees per hour in the zonal direction. The moving anomalies may occur in each temporal bin with similar probability. They are nearly evenly distributed in geography by longitude and occur more at middle latitudes. There is another interesting phenomenon: the speed of moving anomalies seems to grow as the latitude increases, as shown in Figure 6.

3.3. TEC Anomaly before Large Earthquakes and Geomagnetic Storms

There are 89 large earthquakes with magnitudes larger than 6.0 from 2012 to 2018 and [70° E–140° E, 15° N–55° N] in the earthquake list from the China Earthquake Networks Center. A TEC anomaly that occurs within 7 days before a large earthquake and within the earthquake preparation zone may correlate to the large earthquake (a likelihood of a connection between the two events). We perform these analyses based on the results from other references, such as Le et al. [15]. They considered that the occurrence rate of anomalies is greater for earthquakes with greater magnitude and for days closer to the earthquakes. According to their results, we chose 7 days before earthquakes and a magnitude greater than 6 as our threshold to search for the ionospheric anomaly before earthquakes. According to the formula of Dobrovolsky et al. [16] (r = 100.43M km), the radius of the earthquake preparation zone would be 380 km when M = 6. A part of the moving anomaly should occur within the earthquake preparation zone if it has a connection with the earthquake. Even if there is no connection with an earthquake, we may conclude that some anomalies will appear within 7 days before an earthquake. A statistical test to check the hypothesis and an error matrix including error I and error II should be performed in the future when we explore further about the seismic ionospheric responses. The TEC anomaly, which occurs within 1 day before and 3 days later than the main phase of the geomagnetic storm (Dst < −50 nT), may correlate to the storm. Some statistical analysis was carried out based on this assumption, and here are the results. TEC anomalies occur in 22.1% of temporal bins before large earthquakes within 7 days, which may correlate to the earthquakes or not, and occur in 24% of temporal bins in the interval, which is within 1 day before and 3 days later than the main phase of geomagnetic storms. Although ionospheric response to geomagnetic storms is common from a global view, the response might appear in an uncertain area, so the probability of occurrence is not so high in this specific region. TEC anomalies in 0.9% of temporal bins occur before both earthquakes and storms. The count of TEC anomaly temporal bins that occurred in all temporal intervals is 6670. Each temporal bin has a spatial distribution of TEC anomalies for more analysis in detail, which provides a lot of information and needs us to explore further.

4. Discussion

This work analyzes the characteristics of the observed anomalies in the day-to-day variability of TEC. The day-to-day variability is of great importance to the development of empirical models, e.g., [17]. There are many studies to reveal the dependence of the day-to-day variation on local time, season, and solar activity, e.g., [1,7,8,9], and day-to-day variation is attributed to solar activity, geomagnetic activity, and the lower part of the atmosphere (termed the ‘meteorological effect’). The influences from both the top and lower atmospheres on the ionosphere make it complicated to understand these TEC anomalies. The effect of solar activity on the ionosphere cannot be neglected. The energy and energetic particles deposited in the polar atmosphere may drive the changes in the ionosphere. The ionosphere and thermosphere may act differently in geomagnetic storms when the solar EUV energy input is different, although a poor correlation between TEC and solar flux was found during high solar activity, and other mechanisms may rule the TEC over selected stations besides the solar flux [18]. A significant part of the day-to-day abnormal changes observed in TEC cannot be explained by geomagnetic storms and/or earthquakes, according to the results above. Many studies attribute the day-to-day variability to the direct or indirect effects of meteorological processes such as tides and gravity waves [4,8,9,19] and references therein. Lower atmosphere sources such as sudden stratosphere warning (SSW) may also cause day-to-day TEC changes [20]. Planetary waves, tidal waves, gravity waves, and even infrasonic waves propagate in the lower atmosphere and affect the ionosphere. Fang et al. [8] used the coupled Whole Atmosphere Model and Global Ionosphere Plasmasphere models to simulate and demonstrate that absolute TEC variability was equally driven by geomagnetic activity and solar activity at the middle and high latitudes, and the absolute TEC variability was largely controlled by solar activity, and the contributions from the lower atmosphere and geomagnetic activity were almost equally at low latitudes. However, it is still unclear how much of the variability is due to the inherent variations in the ionosphere-thermosphere system. Further studies are necessary.
The positive anomaly usually comes from the positive phase of a geomagnetic storm, which is caused by disturbed thermospheric wind and electric fields [21]. The thermospheric wind arrives at the middle latitude, lifts up the F2 layer, and leads to the enhancement. The negative anomaly usually comes from the negative phase of ionospheric storms, which is mainly due to composition changes [22]. The negative anomaly occurs more at higher middle latitudes because the composition changes from polar to lower latitudes. The daytime may be a more effective time for both positive and negative anomalies. The situation at night is quite different.
We work on the topic of anomalous day-to-day TEC variation to explore more data characteristics for improving the study of ionospheric seismic response, although we do not obtain enough valid information from this study. It is well known that large earthquakes are often preceded or accompanied by electric, magnetic, and electromagnetic signatures. The abnormal ionospheric electron density variations before and after large earthquakes have attracted a lot of attention for many years, e.g., [15,23,24,25,26,27,28,29,30,31,32,33]. TEC and other ionospheric parameters have been employed to detect seismo-ionospheric signatures in the past few years. Although there is not a standard method to extract ionospheric electron density anomalies that may be related to larger earthquakes, many studies used the normal values of day-to-day variation before an earthquake as references. Liu et al. [24] analyzed the maximum plasma frequency foF2 at Chung-Li and found that NmF2 reduced by about 51% from the normal value of day-to-day variation before the Chi-Chi earthquake in 1999. Their results [25] showed that NmF2 and TEC had similar tendencies and were highly correlated. The spatial analyses revealed that TEC centering on the epicenters notably decreased 3–4 days before the earthquake. They attributed the significant TEC decreases to the upward electric field near the forthcoming earthquake’s seismogenic zone and/or the equatorward neutral wind in the ionosphere. A statistical investigation based on 20 M > 6.0 earthquakes during September 1999 to December 2002 in the Taiwan area demonstrated that TEC significantly reduced in the period of 1200–2200 LT within 5 days prior to the earthquakes [26]. Zhao et al. [27] observed the enhanced TEC anomalies in the afternoon period of 9 May 2008 (day 3 before the Wenchuan earthquake) around the epicenter by subtracting the 12-day median using the TEC from 58 GNSS receivers distributed around China and adjacent areas. Liu et al. [28] used the global ionospheric map to observe TEC associated with 35 M > 6.0 earthquakes that occurred in China from May 1998 to April 2008 and found that TEC above the epicenter significantly decreased on days 3–5 before 17 M > 6.3 earthquakes. They also found that TEC reduced significantly in an area of about 10–15° in latitude and 15–30° in longitude from the epicenter during the afternoon periods of days 4–6 (6–8 May 2008) and the evening period on day 3 (9 May 2008) before the Wenchuan earthquake. Although the generated mechanism is not understood, some researchers considered that the upward/downward electric field and the perpendicular component of Earth’s magnetic field would be able to produce a westward/eastward plasma E×B drift, which may result in reductions/enhancements of TEC near the epicenter [27,28]. Our results show that the movement of the TEC anomalies is from east to west in a zonal direction, no matter whether they are positive (enhancement according to day-to-day TEC variation) or negative (reduction according to day-to-day TEC variation) anomalies, which need further exploration.

5. Conclusions

This paper investigates the abnormal day-to-day variability of TEC over 60 GNSS stations above the East Asian region from 2012 to 2018. The temporal and spatial distribution and the moving state of the anomaly of the day-to-day change of TEC are estimated. TEC anomalies before large earthquakes are observed. The main results are concluded as follows.
  • The positive anomaly occurs frequently at the middle latitude at UT 06–12, which is about LT 14–20, and frequently around 28° N at UT 14–20, which is mainly at about LT 22–00.
  • The negative anomaly occurs frequently at middle latitude at UT 02–18. They obviously occur less frequently at low latitudes (about 15° N~30° N) at UT 00–04, which is LT 08–12, and occur less frequently near the Equator Ionization Anomaly area (about 22° N~30° N) at UT 06–12, which is mainly at LT 14–18.
  • The quantities of positive anomalies and negative anomalies are comparable. The direction of moving anomalies is from east to west in a zonal direction in all conditions. The moving speeds of anomalies are around 15~19 degrees per hour in the zonal direction and seem to grow as the latitude increases.
  • The moving anomalies may occur in each temporal bin with similar probability. They are nearly evenly distributed in geography by longitude and occur more at middle latitudes.
  • TEC anomalies occur in 22.1% of temporal bins before large earthquakes within 7 days, which may correlate to the earthquakes or not, and occur in 24% of temporal bins in the interval, which is within 1 day before and 3 days later than the main phase of geomagnetic storms.

Author Contributions

Conceptualization, F.S.; methodology, F.S.; software, F.S. and J.Y.; validation, J.Y., L.H. and F.Z.; writing—review and editing, F.S. All authors have read and agreed to the published version of the manuscript.

Funding

This research was funded by [APSCO Earthquake Research Project Phase II] grant number [WX0519502], and funded by [Detection of seismic ionospheric anomalies by electromagnetic satellite and evaluation of performance based on ground-based GNSS] grant number [WH0012].

Institutional Review Board Statement

Not applicable.

Informed Consent Statement

Not applicable.

Data Availability Statement

The Dst index were obtained from the World Data Center (http://wdc.kugi.kyoto-u.ac.jp/dst_final/index.html, accessed on 10 January 2022), and the earthquake list were obtained from the China Earthquake Networks Center (https://www.csi.ac.cn/csi/dzml/index.html, accessed on 15 March 2023).

Acknowledgments

The figures were created using matplotlib.

Conflicts of Interest

The authors declare no conflict of interest.

References

  1. Forbes, J.M.; Palo, S.E.; Zhang, X. Variability of the ionosphere. J. Atmos. Sol. Terr. Phys. 2000, 62, 685–693. [Google Scholar] [CrossRef]
  2. Schunk, R.W.; Nagy, A.F. Ionospheres: Physics, Plasma Physics, and Chemistry; Cambridge University Press: New York, USA, 2009. [Google Scholar]
  3. Goncharenko, L.P.; Chau, J.L.; Liu, H.-L.; Coster, A.J. Unexpected connections between the stratosphere and ionosphere. Geophys. Res. Lett. 2010, 37, L10101. [Google Scholar] [CrossRef]
  4. Rishbeth, H.; Mendillo, M. Patterns of F2-layer variability. J. Atmos. Sol. Terr. Phys. 2001, 63, 1661–1680. [Google Scholar] [CrossRef]
  5. Moore, L.; Mendillo, M.; Martinis, C.; Bailey, S. Day-to-day variability of the E layer. J. Geophys. Res. 2006, 111, A06307. [Google Scholar] [CrossRef]
  6. Shim, J.S.; Scherliess, L.; Schunk, R.W.; Thompson, D.C. Spatial correlations of day-to-day ionospheric total electron content variability obtained from ground-based GPS. J. Geophys. Res. 2008, 113, A09309. [Google Scholar] [CrossRef]
  7. Xiong, B.; Wan, W.; Yu, Y.; Hu, L. Investigation of ionospheric TEC over China based on GNSS Data. Adv. Space Res. 2016, 58, 867–877. [Google Scholar] [CrossRef]
  8. Fang, T.W.; Fuller-Rowell, T.; Yudin, V.; Matsuo, T.; Viereck, R. Quantifying the sources of ionosphere day-to-day variability. J. Geophys. Res. Space Phys. 2018, 123, 9682–9696. [Google Scholar] [CrossRef]
  9. Zhou, X.; Yue, X.; Liu, H.-L.; Lu, X.; Wu, H.; Zhao, X.; He, J. A comparative study of ionospheric day-to-day variability over Wuhan based on ionosonde measurements and model simulations. J. Geophys. Res. Space Phys. 2021, 126, e2020JA028589. [Google Scholar] [CrossRef]
  10. Ban, P.; Guo, L.; Zhao, Z.; Sun, S.; Zhang, H.; Wang, F.; Xu, Z.; Sun, F.; Xu, T. A new index to descript the regional ionospheric disturbances during storm time. J. Geophys. Res. Space Phys. 2022, 127, e2021JA030126. [Google Scholar] [CrossRef]
  11. Abdelazeem, M.; Çelik, R.N.; El-Rabbany, A. An enhanced real-time regional ionospheric model using IGS real-time service (IGS-RTS) products. J. Navig. 2016, 69, 521–530. [Google Scholar] [CrossRef]
  12. Başçiftçi, F.; Cevat, I.N.A.L.; Yildirim, O.; Bulbul, S. Comparison of regional and global TEC values: Turkey model. Int. J. Eng. Geosci. 2018, 3, 61–72. [Google Scholar] [CrossRef]
  13. Abdallah, A.; Agag, T.; Schwieger, V. Method of Development of a New Regional Ionosphere Model (RIM) to Improve Static Single-Frequency Precise Point Positioning (SF-PPP) for Egypt Using Bernese GNSS Software. Remote Sens. 2023, 15, 3147. [Google Scholar] [CrossRef]
  14. Wu, Y.W.; Liu, R.Y.; Zhang, B.C.; Wu, Z.S.; Ping, J.S.; Liu, J.M.; Hu, Z.J. Variations of the ionospheric TEC using simultaneous measurements from the China Crustal Movement Observation Network. Ann. Geophys. 2012, 30, 1423–1433. [Google Scholar] [CrossRef]
  15. Le, H.; Liu, J.Y.; Liu, L. A statistical analysis of ionospheric anomalies before 736 M6.0+ earthquakes during 2002–2010. J. Geophys. Res. Space Phys. 2011, 11, EGU2011-389. [Google Scholar]
  16. Dobrovolsky, I.R.; Zubkov, S.I.; Myachkin, V.I. Estimation of the size of earthquake preparation zones. Pure Appl. Geophys. 1979, 117, 1025–1044. [Google Scholar] [CrossRef]
  17. Bilitza, D. International Reference Ionosphere 2000. Radio Sci. 2001, 36, 261–275. [Google Scholar] [CrossRef]
  18. Romero-Hernandez, E.; Denardini, C.M.; Takahashi, H.; Gonzalez-Esparza, J.A.; Nogueira, P.A.B.; de Pádua, M.B.; Lotte, R.G.; Negreti, P.M.D.S.; Jonah, O.F.; Resende, L.C.A.; et al. Daytime ionospheric TEC weather study over Latin America. J. Geophys. Res. Space Phys. 2018, 123, 10,345–10,357. [Google Scholar] [CrossRef]
  19. Jonah, O.F.; de Paula, E.R.; Muella, M.T.A.H.; Dutra, S.L.G.; Kherani, E.A.; Negreti, P.M.S.; Otsuka, Y. TEC variation during high and low solar activities over South American sector. J. Atmos. Sol. Terr. Phys. 2015, 135, 22–35. [Google Scholar] [CrossRef]
  20. Laštovička, J. Forcing of the ionosphere by waves from below. J. Atmos. Sol. Terr. Phys. 2006, 68, 479–497. [Google Scholar] [CrossRef]
  21. Tanaka, T. Severe ionospheric disturbances caused by the sudden response of evening subequatorial ionospheres to geomagnetic storms. J. Geophys. Res. 1981, 86, 11,335–11,349. [Google Scholar] [CrossRef]
  22. Prölss, G.W. Density perturbations in the upper atmosphere caused by the dissipation of solar wind energy. Surv. Geophys. 2011, 32, 101–195. [Google Scholar] [CrossRef]
  23. Pulinets, S.; Boyarchuk, K. Ionospheric Precursors of Earthquakes; Springer: Berlin/Heidelberg, Germany, 2005. [Google Scholar] [CrossRef]
  24. Liu, J.Y.; Chen, Y.I.; Pulinets, S.A.; Tsai, Y.B.; Chuo, Y.J. Seismo-ionospheric signatures prior to M > 6.0 Taiwan earthquakes. Geophys. Res. Lett. 2000, 27, 3113–3116. [Google Scholar] [CrossRef]
  25. Liu, J.Y.; Chen, Y.I.; Chuo, Y.J.; Tsai, H.F. Variations of ionospheric total electron content during the chi-chi earthquake. Geophys. Res. Lett. 2001, 28, 1383–1386. [Google Scholar] [CrossRef]
  26. Liu, J.Y.; Chuo, Y.J.; Shan, S.J.; Tsai, Y.B.; Chen, Y.I.; Pulinets, S.A.; Yu, S.B. Pre-earthquake ionospheric anomalies registered by continuous GPS TEC measurements. Ann. Geophys. 2004, 22, 1585–1593. [Google Scholar] [CrossRef]
  27. Zhao, B.; Yu, T.; Wang, M.; Wan, W.; Lei, J.; Liu, L.; Ning, B. Is an unusual large enhancement of ionospheric electron density linked with the 2008 great Wenchuan earthquake? J. Geophys. Res. 2008, 113, A11304. [Google Scholar] [CrossRef]
  28. Liu, J.Y.; Chen, Y.I.; Chen, C.H.; Liu, C.Y.; Chen, C.Y.; Nishihashi, M.; Li, J.Z.; Xia, Y.Q.; Oyama, K.I. Seismoionospheric GPS total electron content anomalies observed before the 12 May 2008 Mw7.9 Wenchuan earthquake. J. Geophys. Res. 2009, 114, A04320. [Google Scholar] [CrossRef]
  29. Zhou, C.; Liu, Y.; Zhao, S.; Liu, J.; Zhang, X.; Huang, J.; Shen, X.; Ni, B.; Zhao, Z. An electric field penetration model for seismoionospheric research. Adv. Space Res. 2017, 60, 2217–2232. [Google Scholar] [CrossRef]
  30. Sorokin, V.M.; Chmyrev, V.M.; Hayakawa, M. A review on electrodynamic influence of atmospheric processes to the ionosphere. Open J. Earthq. Res. 2020, 9, 113–141. [Google Scholar] [CrossRef]
  31. Li, M.; Shen, X.; Parrot, M.; Zhang, X.; Zhang, Y.; Yu, C.; Yan, R.; Liu, D.; Lu, H.; Guo, F.; et al. Primary joint statistical seismic influence on ionospheric parameters recorded by the CSES and DEMETER Satellites. J. Geophys. Res. Space Phys. 2020, 125, e2020JA028116. [Google Scholar] [CrossRef]
  32. Song, R.; Hattori, K.; Zhang, X.; Sanaka, S. Seismic-ionospheric effects prior to four earthquakes in Indonesia detected by the China seismo-electromagnetic satellite. J. Atmos. Sol. Terr. Phys. 2020, 205, 105291. [Google Scholar] [CrossRef]
  33. Liu, J.; Wang, W.; Zhang, X.; Wang, Z.; Zhou, C. Ionospheric total electron content anomaly possibly associated with the April 4, 2010 Mw7.2 Baja California earthquake. Adv. Space Res. 2022, 5, 69. [Google Scholar] [CrossRef]
Figure 1. The locations of the GNSS stations used in the calculation of TEC.
Atmosphere 14 01493 g001
Figure 2. (a) The day-to-day variability ( D T E C ) of TEC at [70° E, 15° N] and UT 00 from 2012 to 2018 and (b) its probability density function. (c) An example of a positive anomaly. The blue line is the DTEC from 8 February to 1 April in 2012 on UT 12 at [101°E, 51°N]. The red line is the upper limit ( μ + 3 σ ) from the sample data in the sliding window. The black line is the lower limit ( μ 3 σ ).
Atmosphere 14 01493 g002
Figure 3. The change in temporal and spatial distribution of a positive TEC anomaly. The color is the amount of positive anomaly from 2012 to 2018.
Atmosphere 14 01493 g003
Figure 4. The change of temporal and spatial distribution of negative TEC anomaly. The color is the amount of negative anomaly from 2012 to 2018.
Atmosphere 14 01493 g004
Figure 5. The anomaly map for 5 March 2012. The yellow color means that the positive anomaly occurs at that location. The blue color means that the negative anomaly occurs at that location, and the pink color means that there is no anomaly.
Atmosphere 14 01493 g005
Figure 6. The change in speed of moving anomalies with latitude.
Atmosphere 14 01493 g006
Disclaimer/Publisher’s Note: The statements, opinions and data contained in all publications are solely those of the individual author(s) and contributor(s) and not of MDPI and/or the editor(s). MDPI and/or the editor(s) disclaim responsibility for any injury to people or property resulting from any ideas, methods, instructions or products referred to in the content.