Abstract
Elevated air temperatures in cities with potential negative effects on, e.g., residents are a major challenge for urban planning. Open green spaces on hills where at night air can cool and drain into residential areas are of great importance to ameliorate the heat load in urban areas. In the Ruhr Metropolitan Region in Germany, tailing piles from the former coal mining industry offer a previously neglected potential for cooling neighbourhoods. The genesis and drainage of cold air on tailing piles have not been extensively investigated so far. Tailing piles are often located in or nearby residential areas and are exposed as open spaces, where cold air can build up and drain into the surrounding neighbourhoods due to their slopes. In the present study, the genesis of cold air and the cold air drainage are empirically investigated using thermal infrared imagery and air temperature measurements during one night in 2019 at the Rungenberg tailing pile in Gelsenkirchen. Furthermore, the cooling effect on the adjacent residential area, Schüngelberg, was studied. The results indicate that cold air builds up at Rungenberg and drains into Schüngelberg. However, the cold air flow into the residential area was blocked by a brick wall located at the foot of the Rungenberg tailing pile. More awareness should be given to the cooling potential of tailing piles, and urban planners should improve this cooling potential by keeping tailing piles open and removing barriers located in the drainage pathways in order to alleviate urban heat.
1. Introduction
The occurrence of cold air and its drainage is becoming increasingly important in urban and spatial planning due to the importance of the nocturnal cooling and ventilation of residential areas. Thus, the effects of cold air on the urban climate are one of the main focuses of urban planning [1]. Effects such as the frequent occurrence of heat periods—temperatures above 30 C for five consecutive days—underline the relevance of the topic [2]. Overall, cold air represents an elementary ecosystem service. Cold air flows are of great relevance in planning processes, especially due to the limited air exchange within a city [3]. Cold air generally describes an air parcel that has a relatively lower temperature near the ground compared to the upper limit of the cold air parcel [4]. Cold air occurs particularly during high-pressure, autochthonous weather conditions, i.e., in cloudless nights with weak winds, low air exchange, and a negative radiation balance. In addition to the meteorological conditions, the decisive influencing variables are the surface, vegetation, type of soil, soil density, soil water balance, and the associated energy transport, as well as the heat capacity [2]. Soils with a low heat capacity and low energy transport or poor thermal conductivity are favorable to produce cold air, as the air near the ground cools down quickly due to the non-continuous flow of heat [5]. The albedo of a surface also determines the formation of cold air. Dark surfaces with a low albedo absorb a relatively high proportion of radiation and therefore have stronger increases in temperature, while light-coloured surfaces with a higher albedo reflect more radiation. Thus, the potential for cold air to form over darker surfaces decreases [2,6]. The exposure of a surface also contributes to the intensity of cold air genesis. The likelihood of cold air genesis and the thickness of the cold air are greater on slopes exposed to the north because they receive less solar radiation [2]. This results in a lower surface temperature, which favours the formation of cold air [5]. Furthermore, sealed areas heat up more intensively during the day than unsealed areas. At night, this heat is continuously released into the environment and thus hardly allows the production of cold air [2]. During cold air genesis, the layer of air near the ground is colder than the layer above due to the nocturnal radiation balance. The colder air layer has a higher density and higher weight and therefore moves catabatically in a gravity-induced manner downwards and accumulates in depressions [6]. This process is called cold air drainage [5,7]. The topography of an area is decisive for the drainage of cold air. Cold air drainages have already been recorded for slopes of less than one percent [8]. Rough, uneven surfaces, such as those with high vegetation, influence the speed of cold air drainage negatively [5]. During drainage, cold air flows continuously from the upper slope and accumulates at lower slopes and in depressions. Therefore, the thickness of the cold air increases at lower terrain levels [7]. Valleys, hollows, and basins are predestined for cold air accumulation [9]. The accumulation of cold air in closed, concave terrain forms is called a “cold air pool” [5]. Moreover, temperature minima are formed in cold air pools. According to [10], 5 K lower air temperatures or more can be measured in such cold air pools compared to the outside of the cold air pool. The generation and drainage of cold air on mountain slopes [11,12] and on low-roughness opened and greened spaces [13] and its benefits for surrounding urban areas has already been investigated by [14]. They demonstrated that with high-relief energy, there is cold air runoff, and the cold air can penetrate into urban structures and contribute to local cooling. Consequently, hills in urban areas are of great importance for nocturnal cooling, and their drainage pathways should be preserved.
In the Ruhr Metropolitan Region, numerous tailing piles from the former coal-mining industry can be found, which are often located in residential areas. The structure of tailing piles is, in a broad sense, similar to that of mountains and sloped open green areas. Furthermore, tailing piles are already mentioned as relevant for climatic compensation in the climate adaption planning of Gelsenkirchen [15]. However, a detailed analysis of the cooling potential of mining tailing piles has not been performed so far.
In the context of this article, the genesis and drainage of cold air is investigated at the Rungenberg tailing pile in Gelsenkirchen, Germany (Figure 1). Tailing piles have a high relief energy and therefore represent an idle potential for cooling settlements. This is of particular importance in the flat Ruhr Metropolitan Region. Therefore, the aim of our study is to record and analyse the small-scale cold air drainage and its flow behaviour on the Rungenberg using infrared (IR) thermography and additional air temperature measurements at the slope and in the adjacent residential area, Schüngelberg. In addition, it is of interest to identify if the residential area benefits from the cold air flow. The Rungenberg was selected for this analysis because it (i) has surfaces that have potential for cold air production in a sufficiently large area, (ii) has a topography that allows cold air to flow into the surrounding area, and (iii) has a residential structure (Schüngelberg) in the immediate vicinity, where a climatological balancing effect could take place. We hypothesize that due to its natural open spaces, Rungenberg offers great potential for cold air genesis. The relief, with its steep slope and a height difference of about 60 m [16], favours cold air flow. Furthermore, we assume that at the bottom of the slope, the cold air flow is restricted and may accumulate by the flattening of the terrain and a 3.5-meter-high wall. Due to the mostly bar-built settlement and the wall, it is not expected that the cold air has far-reaching effects on the adjacent residential area, Schüngelberg.
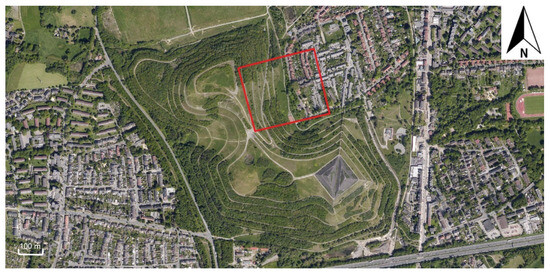
Figure 1.
Aerial view of the Rungenberg in Gelsenkirchen (5133 N, 702 E). The red box shows the study area. Highway A2 can be seen in the south. Projection: ETRS89 UTM 32N (EPSG-Code 25832) (changed from: Regionalverband Ruhr 2019).
2. Materials and Methods
The investigation site “Halde Rungenberg” (5133 N, 72 E) is located in Gelsenkirchen-Buer in North Rhine-Westphalia (Figure 1). Gelsenkirchen has a temperate oceanic climate with warm summers. The Köppen climate type corresponds to Cfb [17]. Halde Rungenberg is an anthropogenic tailing pile of the Hugo stone coal mine [18]. Nowadays, the tailing pile serves as a local recreation area and represents an industrial monument of the Ruhr Metropolitan Region. With a height of 60 m (110 m above sea level), it is one of the highest tailing piles in the region [16]. For the empirical analysis, the east-facing slope of the Rungenberg was selected as the study area due to the adjacent residential area of Schüngelberg and the large open lawn area on the tailing pile itself. The Rungenberg consists of excavation material. Due to the Rungenberg’s surface properties and its overall inclination of 13, the genesis of cold air and its drainage towards the residential area can be expected. The selected area is approximately 90 m wide and has a slope length of approximately 200 m. Furthermore, the slope is built like a terrace. It consists of individual small slopes with a path between each of them (see Figure 1 and Figure 2). In the lower part of the slope, trees stand close together. The slope consists of extensively managed meadows without irrigation. The transition to Schüngelberg is separated by a 3.5 m continuous high brick wall (see Figure 3, yellow line).
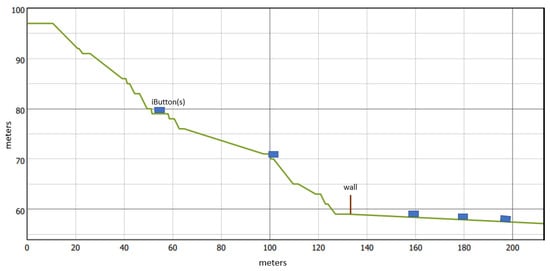
Figure 2.
Schematic profile of the Rungenberg in Gelsenkirchen and position of the wall and the iButtons.
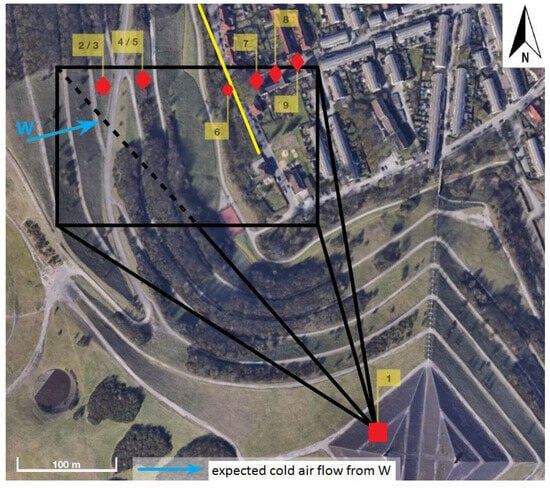
Figure 3.
Aerial view of the Rungenberg with the arrangement of the measurement devices (red dots). Point 1 (square) corresponds to the TIR camera, points 2–5 and 7–9 (diamonds) are the iButtons, and point 6 (dot) represents the air temperature string. The black box shows the recorded section from the perspective of the TIR camera. The yellow line represents the brick wall described in the text (5133’ N, 702’ E). The orange line is the Albrechtstraße projection: ETRS89 UTM 32N (EPSG-Code 25832) (changed from: Regionalverband Ruhr 2019).
Measurement Setup
An overview of the technical information of the measurement devices can be found in Table 1 and Table 2 provides further information about the locations of the air temperature measurements. The measurement campaign took place from sunset at 19:30 Central European Time (hereinafter CET, UTC+1) on 21 April 2019 until 04:30 CET on 22 April 2019. The degree of cloudiness was zero during this time period and during the preceding day. On 21 April, the maximum air temperature was 25 C at 17:20 CET, and the minimum air temperature at the end of the measurement period was 7.5 C. The average wind speed in the measurement period was 2.4 m/s, and the average wind direction was from the East (all weather data are from the Rudolf Geiger Climate Station in Bochum: 51.445614, 7.275347). Although the sunset was at 20:37 CET, the first shading took place at 17:00 CET. The slope was completely shaded at 18:50 CET. A thermal infrared (TIR) camera recorded surface temperatures and took thermal images, which were aligned in such a direction that it almost captured the complete slope and the first rows of buildings, which are located approximately 30 m into the built-up area (Figure 3). The images were evaluated with the IR evaluation software IRBIS Professional [19]. The TIR data were examined for visual analysis. For the numerical analysis of the surface temperatures, points were extracted from the series of thermal images (see Figure 4) and processed as time series. According to [20], the assumed emissivity for lawn surface is 0.90–0.95. However, surface temperatures are not identical to air temperatures, and it is hardly possible to derive the extent of the cold air flow from TIR images. Therefore, in addition, the air temperature was recorded with iButton Hygrochron Temperature/Humidity Loggers [21] at the upper and lower part of the tailing pile (Figure 2 and Figure 3). To record the vertical air temperature gradient, the iButtons were attached at different heights (Table 1). The most commonly used measurement heights (5 cm and 2 m above ground level) were not possible due to a lack of fastening options for the sensors. In order to determine relative air temperature differences and a possible cold air inflow in the residential area, three iButtons were installed in the residential area of Schüngelberg in Albrechtstraße (Figure 3 “7–9”). Each of the iButtons contained a radiation shield and was protected from any meteorological influences in order to maintain the data quality. Albrechtstraße is oriented orthogonal to the tailing pile, and therefore, it is hypothesized that this street benefits from the cold air inflow. Unfortunately, the air temperature measurements did not cover the whole investigation period due to limited data storage capacity (Table 1). A brick wall of about 3.5 m separates the tailing pile from the residential area of Schüngelberg, which might prevent the inflow of nocturnal cold air. To investigate if the wall inhibits the effect of cooling for the residential area, a 1-Wire Digital Thermometer (Dallas Semiconductor/Maxim Integrated, Dallas, TX, USA) (hereafter: temperature string) was installed above the wall on an approximately 5.5 m high tree branch (Figure 3 “6”). The string hung down from the branch. Thus, five of the eleven temperature sensors measured the air temperature at different heights on the tailing pile, and five sensors measured the air temperature in the residential area. All measuring devices were arranged in a W–E transect that ran parallel to the expected cold air drainage direction (Figure 3).

Table 1.
Details of the measurement devices used during the measurement campaign.
Table 2.
Details regarding the setups of the iButtons used during the measurement campaign.
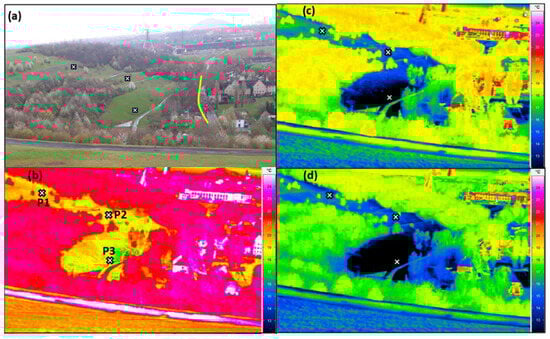
Figure 4.
(a) Photo from the position of the IR camera. The yellow line describes the position of the wall. The crosses (x) indicate the position of the iButtons. (b–d) are derived from the IR camera and show the measured surface temperatures at (b) 19:28 CET, (c) 20:57 CET, and (d) 21:31 CET.
3. Results
3.1. Genesis of Cold Air on the Tailing Pile
The iButtons positioned on the slope show that a ground inversion is formed at 20:00 CET, one hour after the slope was completely shaded (Figure 5). At the beginning of the measurements, the air near the ground showed higher air temperatures than the air at chest height. This vertical air temperature distribution was reversed shortly after sunset. The vertical air temperature difference is more pronounced on the lower slope with a value of 0.5 K/m than on the central slope with a value of 0.2 K/m.
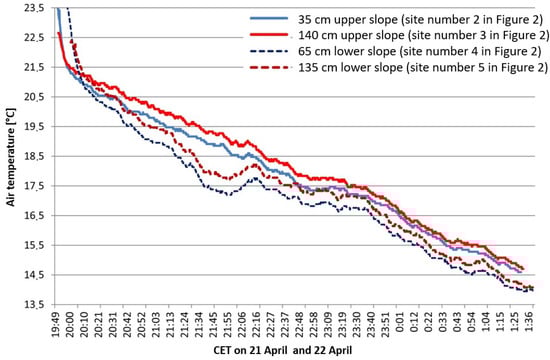
Figure 5.
Air temperatures of the iButtons on the slope (see Figure 3, points 2–5).
For the evaluation of the TIR images, P1—P3 serve as reference points for the surface temperatures on the slope, as seen in Figure 5b. The change in the surface temperatures on the slope during the night is shown in Figure 6. At the beginning of the TIR recordings at 19:30 CET, all measuring points show a decrease in surface temperatures. While the cooling on the upper and middle slope is relatively even, the areas at the foot of the slope cool down more quickly. At 21:00 CET, the difference in surface temperature between P1 and P3 is 5 K. Furthermore, at the foot of the slope, a continuously growing area of lower surface temperature compared to the higher slope gradually forms from 19:35 CET onwards. The vertical and horizontal expansion of this cold air pool can be inferred via the TIR images. The exact thickness of the cold air cannot be determined. From 21:25 CET onwards, the treetops at the bottom of the slope are almost completely covered with cold air (see Figure 5b–d). Therefore, the thickness of the cold air parcel that accumulated in the depression can be assumed to be several meters high.
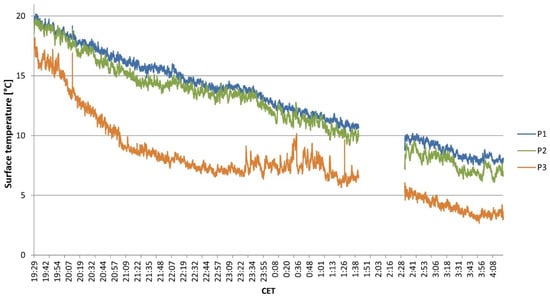
Figure 6.
Surface temperature of the three selected pixels shown in Figure 5. 21–22 April 2019 between 19:29 CET and 04:20 CET. Measurements were interrupted between 01:42 CET and 02:32 CET.
3.2. Dynamics of the Cold Air Drainage
Figure 4 and Figure 6 show that surface and air temperatures on the entire slope generally decrease. However, they fluctuate in irregular intervals. The duration of individual fluctuations is about ten minutes and is not a constant process. A particularly intense and long-lasting drainage was recorded from 20:50 CET until 22:10 CET from the iButtons and also from the temperature string. This period is shown in more detail in Figure 7 and Figure 8.
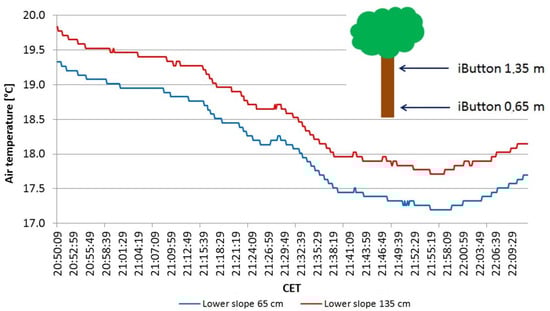
Figure 7.
Air temperature on the lower slope (points 4 and 5, Figure 3) between 20:50 CET and 22:14 CET.
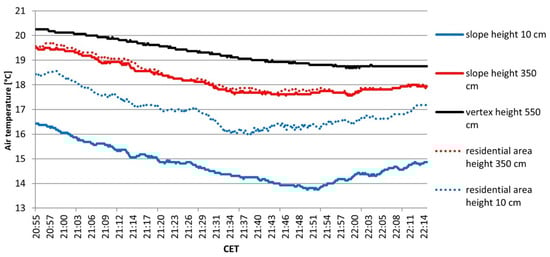
Figure 8.
Air temperature fluctuations of the highest and lowest sensors on the slope-facing and the residential area-facing side of the wall of the temperature string. Heights refer to height above ground level.
Initially, the iButtons on the lower slope show a constant decrease in the air temperature (Figure 7). However, at 21:20 CET, there is a first shorter, noticeable decrease in air temperature, followed by an increase in air temperature after three minutes. Subsequently, at 21:27 CET, the air temperature drops again rapidly by about 1.6 K and gradually increases again at 21:55 CET.
The temperature string recorded the same air temperature fluctuation at 21:20 CET (Figure 8). The reaction is much more pronounced near the ground (at a height of 10 cm) than at the top of the wall (350 cm). At the apex (550 cm), the temperature fluctuation is not detectable, so the thickness of the cold air can be estimated to be between 3.5 m and 5.5 m.
3.3. Influence of Cold Air on the Residential Area of Schüngelberg
Significant temperature differences developed in the residential area compared to the slope during the day. A general observation of the TIR images reveals higher surface temperatures in the residential area throughout the night compared to the slope (Figure 5). As can be seen on the TIR images, there is a clear temperature cut in the area surrounding the wall, which separates the residential area from the tailing pile. Figure 9 shows the spatial and temporal air temperature distribution at the wall. Evaluating the data of the temperature string at the wall, at 18:40 CET, air temperatures are almost identical in the vertical extent. However, an inverse air temperature distribution was slowly formed at 19:00 CET (not shown). At 19:09 CET, the vertical temperature distribution is completely inverted for the measurable range of the temperature string, where the highest temperatures are measured at the vertex at 5.5 m and the lowest are measured at the bottom at 0.1 m. The inversion kept stable until the end of the measuring period.
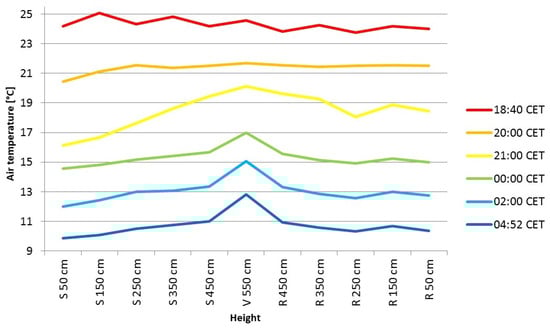
Figure 9.
Air temperature measured on the logger chain at the specified heights about ground level at selected times. S corresponds to the recorded temperature of the sensors on the slope side; R corresponds to the side facing the residential area, and V corresponds to the temperature at the apex.
In general, the sensors at the temperature string facing the residential area recorded higher air temperatures over the entire measurement period compared to the slope-facing sensors. At 21:00 CET, the air temperature difference between the sensors exposed to the tailing pile and those facing the residential area was highest (2.6 K), and at the end of the measurement period, it was lowest (0.5 K).
Furthermore, compared to the iButtons on the slope (17.7 C), the air temperature in the residential area (20.0 C) was, on average, 2.3 K higher at night. Within the residential area, the average air temperature at the three measurement points differed by up to 1 K (P7: 19.5 C, P8: 20.5 C, P9: 20.0 C).
At P7 and P8, an air temperature fluctuation was recorded with a duration of about one hour at 21:00 CET. The temperature fluctuation coincides in time with that recorded on the slope (Figure 10).
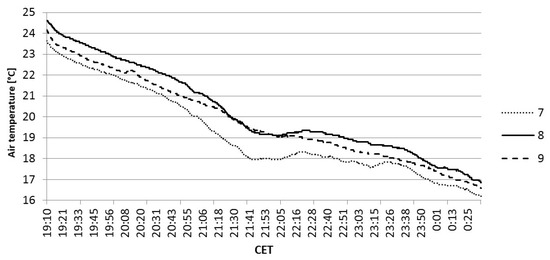
Figure 10.
Air temperature measured by the iButtons in the residential area at sites 7, 8, and 9 (cf. Figure 3) during 21–22 April 2019.
4. Discussion
With the aid of the measurement campaign, the genesis and dynamics of cold air production and dynamics on the eastern slope of the Rungenberg was recorded, and its influence on the adjacent residential area was shown. The evidence first reveals an air temperature inversion measured on the tailing pile. It can be interpreted as an indication that cold air is forming on the slope. This is also supported by the TIR images. Furthermore, the decrease in surface temperature at the bottom of the slope might not only be caused by the cooling of the surface. Rather, induced by the concave shape of the terrain, there might be an inflow of cold air. It seems that a constant pool of cold air gradually formed from 19:35 CET onwards at the foot of the slope. Several studies already depicted that cold air accumulates in basins and valleys, and thus, cold air pools arise [22,23]. Pypker et al. [22] in addition elaborates that the depth of the inversion layer in the cold air pool and its further drainage depends on the topography. They showed that a cold air pool grows continuously in a closed valley. Thus, it can be transferred to this study that during the night, cold air is continuously formed over the entirety of the slope, which flows down and converges in the depression between the tailing pile and the residential area. The cold air pool grows continuously. Initially, the wall acts in a restrictive manner until the inversion layer enlarges and can pass over the wall, which is discussed below. Furthermore, the surface and air temperatures on the entire slope generally decrease during the investigation period but sometimes fall and rise again at irregular intervals. Because the measurements were carried out during a cloud- and windless night, it is assumed that the fluctuations in temperature describe the uneven catabatic movement of cold air. This is caused by different cold air production rates on heterogeneous surfaces due to the differences in shading of the individual slope sections, the surface roughness, and the stepped topography [1]. Additionally, increases and decreases in the air temperature are recorded by the iButtons. Firstly, small parcels of cold air seem to flow down as “precursors” before the actual large drainage of the cold air mass was recorded. It is likely that a conglomerate of many individual parcels of cold air was formed, which combined and formed a large and continuous mass of cold air flowing downslope for about 30 min. The iButtons in the residential area recorded those fluctuations. Thus, the influence of cold air that spilled over the wall and the resulting cooling effect of the tailing pile on the residential area can be inferred. However, in the Schüngelberg area itself, air temperatures differed only slightly. Consequently, the cold air inflow might be compensated for by thermal radiation occurring in the residential area. Another possibility is that cold air cannot reach far into the residential area. The fluctuation, which was identified as a large cold air mass, seems to have spilled over the wall due to its assumed thickness. The iButtons thus confirm that the residential area receives cold air from the tailing pile, at least temporarily, if the cold air pool is more than 3.5 m thick. Since no other noticeable fluctuations were recorded by those iButtons compared to the ones positioned on the slope (Figure 4 and Figure 10), it can be assumed that smaller cold air masses were not sufficiently thick or did not induce a sufficiently strong movement impulse for entering the residential area. In addition, based on the orography of the residential area, it is plausible that the cold air mass, if it is too thin, only spills over the wall and remains there. Another possible inhibiting influencing factor can be the insufficient flow velocity of smaller cold air parcels. [24] showed a positive correlation between the flowing distance and the velocity of cold air drainage. The wall itself and the trees in front of the wall facing the tailing pile likely have a breaking effect. The ascending Albrechtstraße (from the tailing pile into the residential area) also counteracts the speed and has a negative effect on the inflow depth. However, because the flow velocity was not measured in the test setup, further investigation is needed. The inflow of cold air from the wider area as well as the building structures in other directions were also disregarded in this analysis.
Comparing the iButton data in the Schüngelberg region, the decrease in temperature measured by the iButton at point 9 (Figure 3) is more constant without noticeable fluctuations, which can indicate the fact that the cold air parcel did not penetrate that far into the residential area.
Another aspect that must be discussed is the differences in air temperature in the surroundings of the wall. This indicates that the wall may have a restrictive effect on the cold air drainage. As already depicted, a temperature inversion measured at the temperature string slowly forms at 19:00 CET, which underlines the increasing influence of cold air flow. The cold air layer enlarges due to the continuous cold air genesis and the drainage from the tailing pile. From that moment, when the vertical temperature distribution is completely inverted in the measurable range by the string, the upper cold air limit must be at a height of approximately 5.5 m. This confirms, that the cold air can spill over the 3.5 m high wall into the residential area. Nevertheless, there are constantly higher air temperatures on the site that is exposed to the residential area. Thus, the wall can be identified as a barrier for cold air flowing into the Schüngelberg area. However, the blocking effect of the wall against cold air flow was highest at sunset but continuously equalized during the night. This might be accompanied by the general cooling of the residential area at night-time. In addition, cold air genesis inside the residential area from the front gardens of the houses or other small, grassy areas is assumable. The study [11] depicted that obstacles hinder cold air drainage and induce a stagnation of cold air, which cause high temperature differences. To illustrate this, the spillage of cold air over the wall will be examined in more detail. As shown in Figure 11, layers of air of different temperatures are encountered at the height where the wall ends; on the side exposed to the tailing pile, there is cooler air from the open spaces of the tailing pile, and on the other side, warmer air from the residential area can be found. Due to the temperature inversion on both sides, the thermodynamic exchange of the air masses is not possible. Therefore, the cold air can only pass the wall by mechanical impulses or when the thickness of the cold air pool has grown to the level of the wall. If there is an impulse from, e.g., new arriving air parcels to the cold air pool at the slope side or through the general effort to equalize temperature and thus air pressure, air parcels of the cold air pool spill over the wall. Regarding the higher density of the cold air compared to the warmer air on the residential area side, the spilled cold air sinks to the ground on the residential side. After the moment when the inversion already exists on the slope side, a temperature inversion also develops with a time delay on the side facing the residential area. Furthermore, it must be considered that on the slope side, the air temperature increases with height above ground, and thus the residential area receives, in relative terms, the warmer air from the cold air drainage. This can be seen in Figure 11. The temperatures in the immediate vicinity of the ground on the side of the residential area roughly correspond to those recorded by the sensor at the upper end of the wall on the side facing the slope. The cooler air from the slope side close to the ground does not overcome the wall due to gravity. Due to the fact that only relatively warmer air spills over the wall, the potential for cooling the residential area remains small.
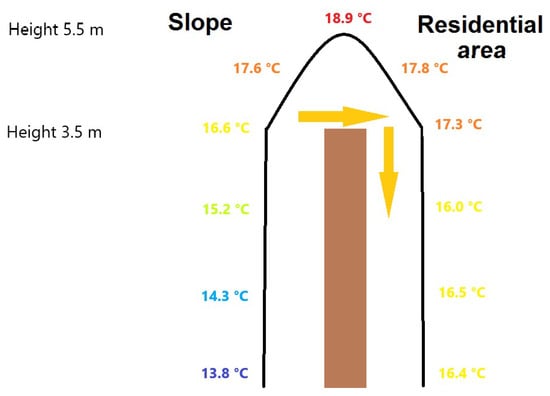
Figure 11.
Air temperature distribution as measured by the temperature string (black line) at 21:50 CET, visualized as a schematic at the wall that separates the slope from the residential area (site 6).
To sum up, the cooling potential that the tailing pile offers cannot be utilized to its full extent due to the restrictive effect of the wall. To amplify the cooling potentials of hills or tailing piles, it is useful to provide open-air corridors and remove obstacles, such as walls or dense vegetation. Furthermore, for the unhindered inflow of cold air, it is advantageous that streets are orthogonal to the slope. Thus, the air flow is not blocked by house fronts. This is also recommended by [15], which mentions the climatic compensation potential of tailing piles in the Ruhr Metropolitan Region. The authors further identified that tailing piles have the potential to contribute to the cooling of adjacent areas. This is especially important if there are no other open and green areas in the surrounding. Accordingly, tailing piles must be kept free of any obstacles for the unhindered cold air drainage into adjacent areas. Ref.[25] developed a method for this purpose and estimated cold air paths with the aid of machine learning. Depending on the relative surface elevation and topographic position index, topographic wind pathways should be kept free. The dynamics of cold air have already been demonstrated in other studies, such as [26]. Although that study did not examine tailing piles, they had similar conditions on slopes with open spaces with cold air flow oscillations. Therefore, it is not surprising that in this study, cold air drainage could only be detected once in the residential area during the investigation period. Moreover, ref. [26] also contemplated the velocity of the cold air parcels. It is probable that, with a higher velocity, the depth of inflow into the Schüngelberg region would increase [24]. In further studies, flow velocity, cold air production rates, and cold air volume should be measured or calculated with the aid of model simulations. A simple method for estimating mean wind velocity is provided in the [12]. They combined data from a digital elevation model with data from a meteorological station and TIR images. In this study, a quantification of the exact depth of inflow of cold air into the residential area was not possible. In further campaigns that focus on the Rungenberg, an infrared camera should be positioned in the Albrechtstraße facing the wall and street simultaneously. Thus, it would be easier to firstly determine the amount of cold air and inflow depth and derive recommendations for planning institutions. Moreover, in this study, there are several uncertainties. For example, the iButtons did not log measurements for the whole measuring period for technical reasons, which restricts a comprehensive analysis of the air temperature changes throughout the night. The recording with the IR camera was also interrupted. The accuracy and the response time of the used devices are also limitations of this study.
5. Conclusions
The study shows that tailing piles have the potential to cool their immediate surroundings and thus provide an important ecosystem service. As open spaces in or adjacent to cities, tailing piles are able to produce cold air, and because of their slope, cold air can flow into residential areas. The cold air drainage at the Rungenberg tailing pile is important for the thermal ventilation of the Schüngelberg area. Nevertheless, despite the favourable relief, a brick wall hinders the complete drainage of cold air into the residential area. Only a small amount of cold air spilled over the wall during the investigation period. Cold air inflow could only be detected once, and therefore, the climate compensation potential of the tailing pile is relatively unused. More awareness should be given to the cooling potential of tailing piles in future urban planning. Many tailing piles in the Ruhr Metropolitan Region are characterized by higher vegetation, such as urban forests, which block cold air drainage. Tailing piles should rather be cultivated with more open vegetation, such as extensively managed meadows, to increase cold air genesis and drainage. Furthermore, other barriers in the pathway, such as brick walls, between the cold air’s origin and residential areas should be removed. In this way, the cooling potential of tailing piles for residential areas can be maximized. In order to show the specific cooling effects more precisely, numerical analyses, modeling, and also large comprehensive measurement campaigns are recommended. To conclude, the understanding of the potential of tailing piles as natural heat sinks is crucial and cannot only improve the local micro-climate but can further lead to more sustainable and cost-effective solutions for managing urban heat, reducing reliance on energy-intensive cooling systems. Thus, urban planners must be more aware of the direct surroundings of tailing piles, which become highly important for the impact of future construction areas in order to ensure better climate resilience in cities.
Author Contributions
Conceptualization, P.G., A.M.G. and T.S.; methodology, P.G., A.M.G. and T.S.; validation, P.G.; formal analysis, P.G.; investigation, P.G.; data curation, P.G.; writing—original draft preparation, P.G.; writing—review and editing, T.S. and A.M.G.; visualization, P.G.; supervision, T.S. and A.M.G.; project administration, P.G. All authors have read and agreed to the published version of the manuscript.
Funding
This research received no external funding.
Acknowledgments
We acknowledge the support given by the KIT-Publication Fund of the Karlsruhe Institute of Technology. Furthermore, we would like to thank Susanne A. Benz of the Karlsruhe Institute of Technology for her expertise and proof reading. Since May 2023, P. Glocke was supported as part of a Freigeist Fellowship funded by the Volkswagen Foundation.
Conflicts of Interest
The authors declare no conflict of interest.
Abbreviations
The following abbreviations are used in this manuscript:
| TIR | Thermal infrared |
| CET | Central European Time |
References
- Hupfer, P.; Kuttler, W.; Chmielewski, F.M.; Pethe, H. (Eds.) Witterung und Klima; Vieweg+Teubner Verlag: Wiesbaden, Germany, 2005. [Google Scholar] [CrossRef]
- Ax, L.; Dietrich, U. 5.6 Trendanalyse von Hitzewellen im 21. Jahrhundert auf der Basis von IPCC Szenarien mit Anwendung auf den Gebäudesektor. Available online: https://www.klima-warnsignale.uni-hamburg.de/wp-content/uploads/pdf/de/gesundheitsrisiken/warnsignal_klima-gesundheitsrisiken-kapitel-5_6.pdf (accessed on 1 August 2023).
- Sachsen, T.; Ketzler, G.; Knörchen, A.; Schneider, C. Past and future evolution of nighttime urban cooling by suburban cold air drainage in Aachen. DIE ERDE—J. Geogr. Soc. Berl. 2013, 144, 274–289. [Google Scholar] [CrossRef]
- Chmielewski, F.M.; Hupfer, P.; Kuttler, W.; Pethe, H. (Eds.) Witterung und Klima; Vieweg+Teubner Verlag: Wiesbaden, Germany, 1998. [Google Scholar] [CrossRef]
- VDI/DIN-Kommission Reinhaltung der Luft. VDI 3787 Blatt 5—Umweltmeteorologie. Lokale Kaltluft. 2003. Available online: https://www.vdi.de/richtlinien/details/vdi-3787-blatt-5-umweltmeteorologie-lokale-kaltluft (accessed on 1 August 2023).
- Bendix, J.; Lauer, W. Klimatologie; Westermann: Braunschweig, Germany, 2006. [Google Scholar]
- Bendix, J. Geländeklimatologie; Borntraeger: Stuttgart, Germany, 2004; ISBN 9783443071394. [Google Scholar]
- Häckel, H. Meteorologie; UTB: Stuttgart, Germany, 2016. [Google Scholar]
- Noppel, H. Modellbasierte Analyse des Stadtklimas als Grundlage für die Klimaanpassung am Beispiel von Wiesbaden und Mainz: Abschlussbericht zum Arbeitspaket 3 des Projekts KLIMPRAX Wiesbaden/Mainz—Stadtklima in der kommunalen Praxis; Freie Universität: Berlin, Germany, 2017. [Google Scholar] [CrossRef]
- Fenn, C.; Baumüller, D.J.; Langholz, H. Die Bedeutung der Hanglagen für das Stadtklima in Stuttgart unter Besonderer Berücksichtigung der Hangbebauung. 2005. Available online: https://www.stadtklima-stuttgart.de/stadtklima_filestorage/download/Diplarb-Fenn.pdf (accessed on 20 August 2023).
- Kuttler, W.; Barlag, A.B.; Robmann, F. Study of the thermal structure of a town in a narrow valley. Atmos. Environ. 1996, 30, 365–378. [Google Scholar] [CrossRef]
- Ikani, V.; Chokmani, K.; Fathollahi, L.; Granberg, H.; Fournier, R. Spatiotemporal Evaluation of Nocturnal Cold Air Drainage over a Simple Slope Using Thermal Infrared Imagery. Int. Arch. Photogramm. Remote. Sens. Spat. Inf. Sci. 2016, XLI–B8, 265–269. [Google Scholar] [CrossRef]
- Grunwald, L.; Kossmann, M.; Weber, S. Mapping urban cold-air paths in a Central European city using numerical modelling and geospatial analysis. Urban Clim. 2019, 29, 100503. [Google Scholar] [CrossRef]
- Nkemdirim, L.C. Cold air drainage and temperature fields in an urban environment: A case study of topographical influence on climate. Atmos. Environ. (1967) 1980, 14, 375–381. [Google Scholar] [CrossRef]
- Kuttler, W.; Mersmann, M.; Barlang, A.B. Gesamtstädtische Klimaanalyse Gelsenkirchen Darstellung und Bewertung der Klimatischen und Lufthygienischen Situation Unter Zusätzlicher Berücksichtigung des Globalen Klimawandels—Abschlussbericht; Technical Report; Stadt Gelsenkirchen: Gelsenkirchen, Germany, 2011. [Google Scholar]
- Hellmann, S. Die Halde Rungenberg in Gelsenkirchen. 2018. Available online: https://www.ruhrgebiet-industriekultur.de/halde-rungenberg/ (accessed on 20 August 2023).
- Kottek, M.; Grieser, J.; Beck, C.; Rudolf, B.; Rubel, F. World Map of the Köppen-Geiger climate classification updated. Meteorol. Z. 2006, 15, 259–263. [Google Scholar] [CrossRef] [PubMed]
- Berke, W. Über alle Berge—Haldenführer Ruhrgebiet 2.0; Klartext Verlag: Essen, Germany, 2016. [Google Scholar]
- GmbH, I. VarioCam High Resolution. Benutzerhandbuch; UTB GmbH: Willmering, Germany, 2007. [Google Scholar]
- Kuttler, W. Klimatologie; UTB GmbH: Willmering, Germany, 2013. [Google Scholar]
- Integrated, M. DS9105 iButton Number Set. 2015. Available online: https://www.stg-maximintegrated.com/en/products/ibutton-one-wire/ibutton/DS9105.html (accessed on 20 August 2023).
- Pypker, T.G.; Unsworth, M.H.; Lamb, B.; Allwine, E.; Edburg, S.; Sulzman, E.; Mix, A.C.; Bond, B.J. Cold air drainage in a forested valley: Investigating the feasibility of monitoring ecosystem metabolism. Agric. For. Meteorol. 2007, 145, 149–166. [Google Scholar] [CrossRef]
- Clements, C.B.; Whiteman, C.D.; Horel, J.D. Cold-Air-Pool Structure and Evolution in a Mountain Basin: Peter Sinks, Utah. J. Appl. Meteorol. Climatol. 2003, 42, 752–768. [Google Scholar] [CrossRef]
- Yoshino, M.M. Thermal belt and cold air drainage on the mountain slope and cold air lake in the basin at quiet, clear night. GeoJournal 1984, 8, 235–250. [Google Scholar] [CrossRef]
- Grunwald, L.; Schneider, A.K.; Schröder, B.; Weber, S. Predicting urban cold-air paths using boosted regression trees. Landsc. Urban Plan. 2020, 201, 103843. [Google Scholar] [CrossRef]
- Grudzielanek, A.M.; Cermak, J. Temporal Patterns and Vertical Temperature Gradients in Micro-Scale Drainage Flow Observed Using Thermal Imaging. Atmosphere 2018, 9, 498. [Google Scholar] [CrossRef]
Disclaimer/Publisher’s Note: The statements, opinions and data contained in all publications are solely those of the individual author(s) and contributor(s) and not of MDPI and/or the editor(s). MDPI and/or the editor(s) disclaim responsibility for any injury to people or property resulting from any ideas, methods, instructions or products referred to in the content. |
© 2023 by the authors. Licensee MDPI, Basel, Switzerland. This article is an open access article distributed under the terms and conditions of the Creative Commons Attribution (CC BY) license (https://creativecommons.org/licenses/by/4.0/).