Article

Analysis of Hotspots and Trends in Soil Moisture Research since the 21st Century

1
School of Geographic Sciences, Nanjing Normal University, Nanjing 210023, China
2
National Earth System Science Data Center, National Science and Technology Resources Sharing Service Platform, Beijing 100101, China
3
Institute of Geographic Sciences and Natural Resources Research, Chinese Academy of Sciences (CAS), Beijing 100101, China
4
Jiangsu Center for Collaborative Innovation in Geographical Information Resource Development and Application, Nanjing 210023, China
5
School of Geography and Environment, Henan University, Kaifeng 475004, China
*
Author to whom correspondence should be addressed.
Atmosphere 2023, 14(10), 1494; https://doi.org/10.3390/atmos14101494
Submission received: 26 July 2023 / Revised: 18 September 2023 / Accepted: 24 September 2023 / Published: 27 September 2023
(This article belongs to the Special Issue New Insights in Surface Process under Climate Change)

Abstract

:
Soil moisture is a key factor in ecosystems that profoundly affects carbon, nitrogen, and water cycles on land surfaces, vegetation growth, and climate change. Consequently, numerous scholars have researched and authored scientific literature on soil moisture and related topics. Using the Web of Science database, we conducted a bibliometric analysis of 60,581 papers published in the field of soil moisture between 2000 and 2022. The findings revealed the following trends. (1) The number of publications on soil moisture has consistently increased in the 21st century at an increasing rate. For instance, although the annual increase was only 94 publications in 2005, it surged to 321 publications in 2020. (2) The United States (US), China, and developed European countries emerged as primary research institutions and authors. The US occupies a leading position in soil moisture research, boasting the highest number of publications and total citations in the field, whereas China ranks second in both publications and total citations. (3) Regarding international collaboration, the US has established close partnerships with numerous international research institutions. However, China’s international cooperation in this field requires improvement. (4) The Journal of Hydrology holds the top position in terms of both the total number of published articles and citations. Research on water resources ranked first in terms of its H-index. (5) Keyword analysis highlighted several current research hotspots, including the coupled covariance effect of soil moisture and land surface environmental factors in the context of climate change, soil moisture utilization rate, crop yield, influence mechanism of soil moisture on soil ecosystem structure, and development of high-precision soil moisture data products. In conclusion, this study provides a systematic review of the research hotspots and trends in soil moisture studies in the 21st century. The objective is to offer a comprehensive reference to aid in understanding the evolutionary patterns of soil moisture research in multiple dimensions.

1. Introduction

Soil moisture, located between the soil surface and groundwater surface (submerged surface), serves as a crucial link in the conversion of atmospheric, surface, soil, and groundwater and plays an indispensable role in water and material cycles [1,2]. They act as a source of life for terrestrial vegetation, profoundly impacting ecological and agricultural production [3]. Both precipitation and irrigation are transformed into soil moisture so that it is readily accessed by crops and natural vegetation [4]. In arid and semiarid regions, it is essential to regulate soil moisture through artificial irrigation to promote high and stable crop yields [5,6]. In short, soil moisture is intricately connected to soil [7], water [8], and plant [9] components and represents a key factor in ecosystems. Soil moisture serves as a vital indicator and reference for regional and global climate change studies, water cycle research, vegetation growth monitoring, and early drought and flood warnings [10,11,12].
In recent decades, research on soil moisture has gained increasing attention, yielding abundant results in data acquisition and quality improvement, drought and flood monitoring, early warning, crop growth analysis, yield estimation, and the interplay with climate change [13,14,15,16]. Several scholars have elucidated the development of soil moisture research in detail, and most have provided reviews based on a methodological system from the perspective of the multidimensional scientific issues involved in soil moisture [17,18]. However, these classical reviews lack a comprehensive and systematic statistical representation of soil moisture research hotspots and evolutionary processes. Bibliometrics is the quantitative analysis and categorization of the published literature in a specific field to assess the overall research landscape [19]. It uses mathematical and statistical measures to study bibliographic systems and bibliometric characteristics, to explore certain structures and patterns in science and technology [20]. A knowledge map is a graphic that depicts the development process and structural relationships of scientific knowledge and can visualize the coupled relevance of information in a domain [21]. Since the beginning of the 21st century, the global climate has continued to warm, and extreme droughts and floods have occurred, posing a great challenge to the sustainable recycling of water resources. Soil moisture is a critical component of the water cycle and is highly responsive to climate change. Numerous analytical studies have been conducted by scholars to investigate soil moisture, providing a strong basis for a comprehensive and thorough understanding of its evolutionary characteristics [12,16]. This study provides a comprehensive quantitative analysis of the soil moisture-related literature published in Web of Science (WOS) from 2000 to 2022. The analysis incorporates multiple dimensions and levels using bibliometrics. The findings of this study are presented as a knowledge graph with the goal of assisting researchers in understanding the current state and upcoming trends in soil moisture research through extensive information mining and analysis.

2. Materials and Methods

2.1. Data Sources and Pre-Processing

The Scopus database and the WOS Core Collection database are widely used, and these are the two most popular bibliometric databases [22,23]. In this study, we selected the WOS Core Collection Science Citation Index Expanded Database as our data source. The choice of this database was determined by its broader coverage in the field of natural sciences, as well as its inclusion of accurate and reliable research information, along with the provision of numerous analytical tools to handle this information [24,25]. The search formula for the advanced method, selected according to soil moisture research, was as follows: TS = (soil moisture or soil water or soil humidity or soil-water or soil-moisture or soil-humidity). The index dates ranged from 1 January 2000 to 31 December 2022, resulting in 65,077 search results. To focus on the research topics and hotspots in relevant fields, we selected the document type “Article”. After filtering, 60,581 valid citation data were obtained.
We used the bibliometric software package Bibliometrix R to extract keywords from the citation data. We merged and unified synonyms, such as combining “soil water” into “soil moisture”, “rainfall” into “precipitation”, and “transpiration” into “evapotranspiration”. For the keyword study, we eliminated the words “soil moisture”, “soil”, and “moisture” to obtain valid keyword information because the keyword category of “soil moisture” appeared in every article.

2.2. Data Processing Methods

Data visualization allows the identification and analysis of pertinent information in a study area using a visual representation of data, for a comprehensive understanding of data structures and relationships [26]. We employed Bibliometrix to process bibliographic data and optimized the plot results using the R language toolkit Tidyverse. The key steps were as follows.
(1) Articles published in the field of soil moisture-related research over the years were collated and the data were exported for plotting.
(2) Statistics on the number of articles published by countries, institutions, and journals were collected and the data were exported for organization and mapping.
(3) Author information was extracted from the articles to analyze and visualize collaborations between countries and institutions.
(4) The authors’ listed keywords were extracted from the citation data to identify and summarize research hotspots.

3. Results

3.1. Publication and Cooperation Networks

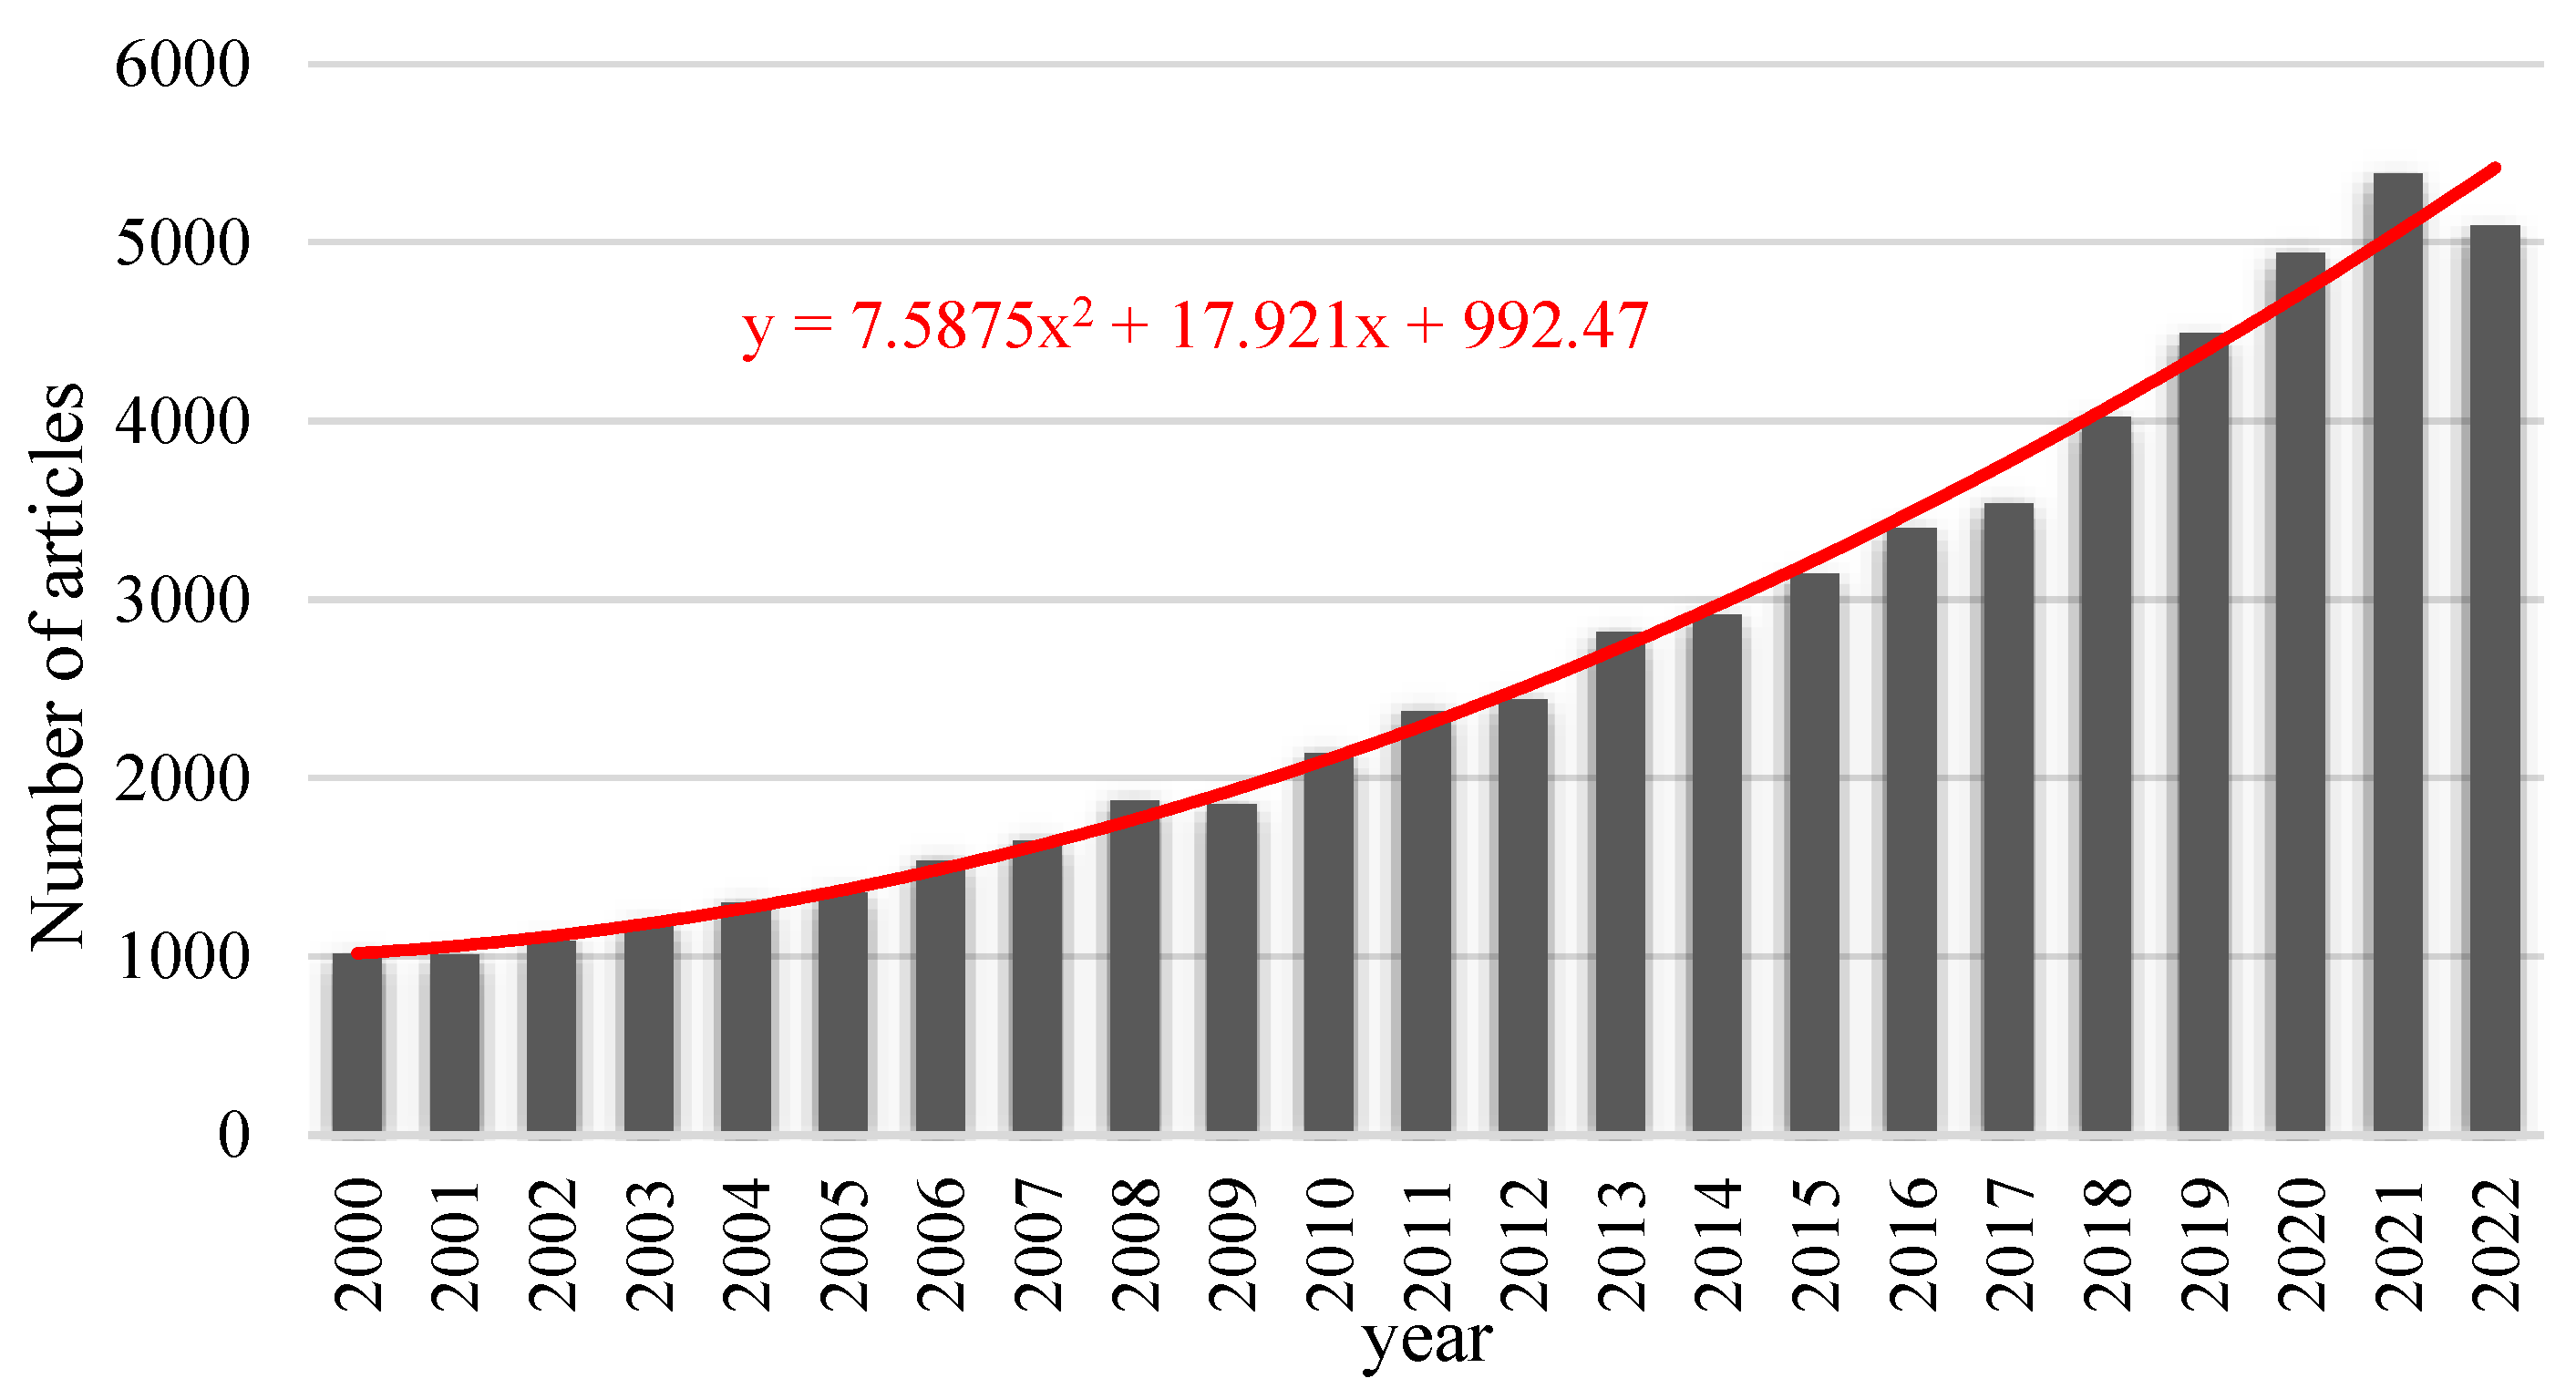
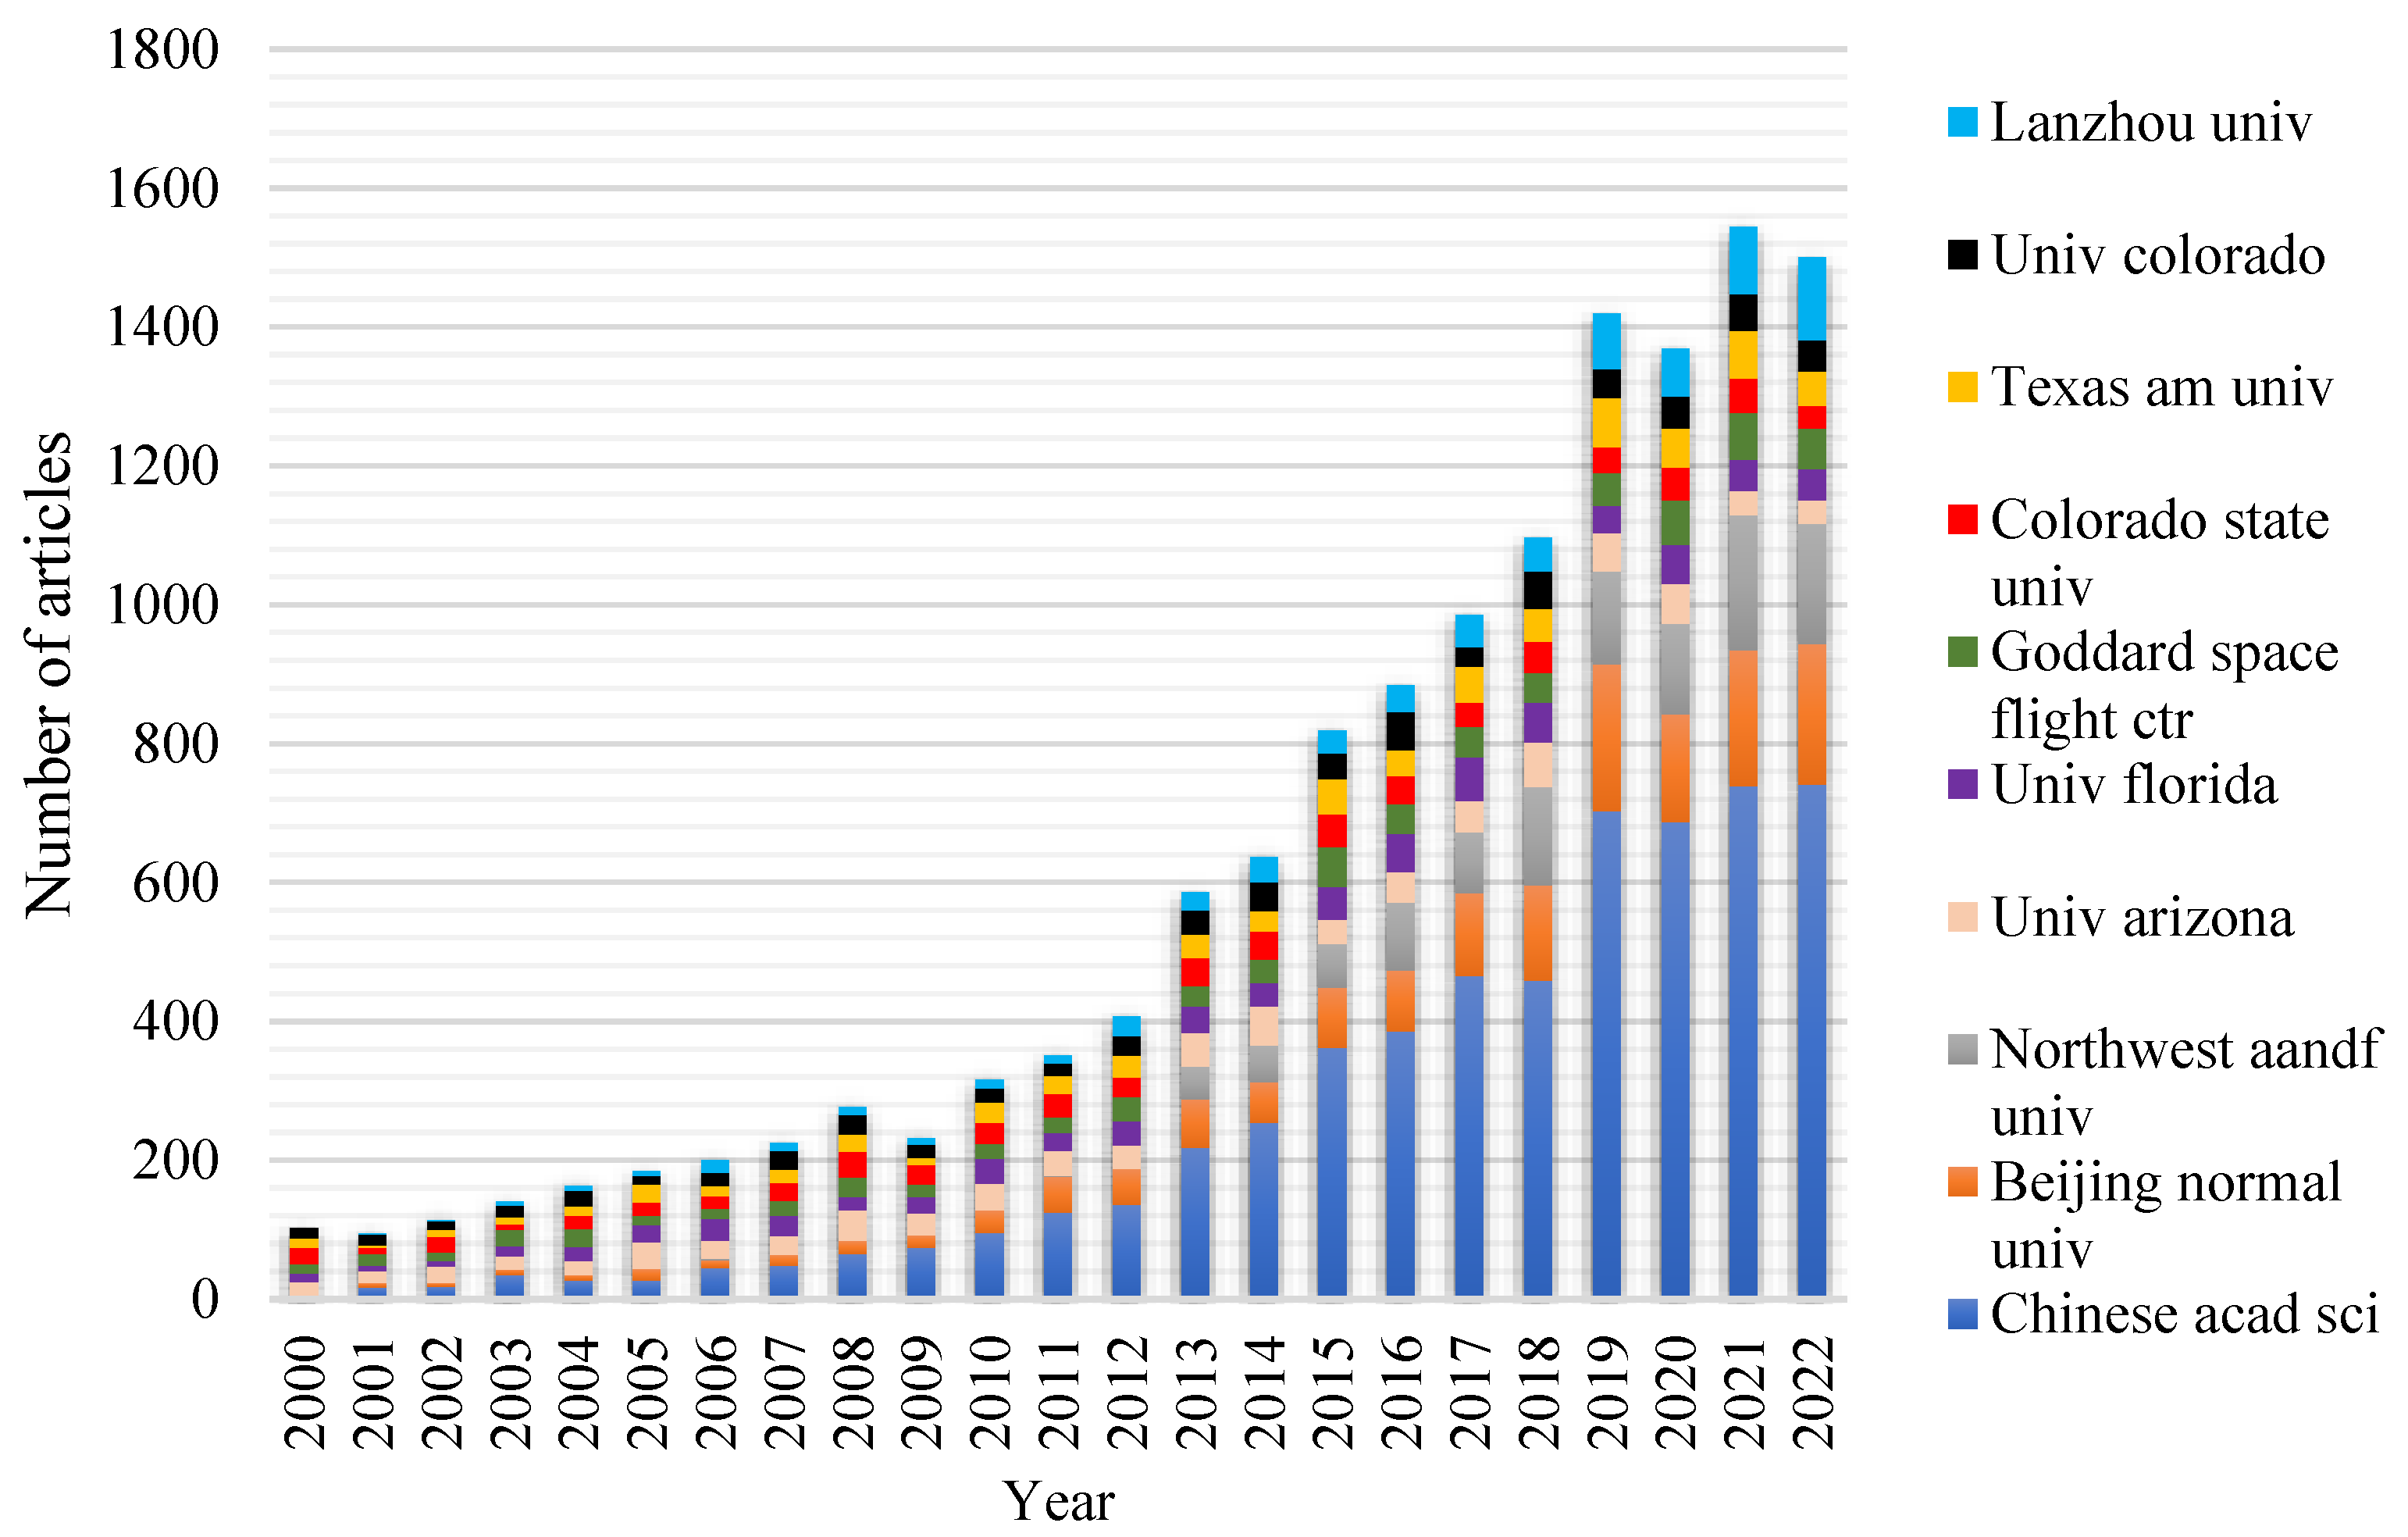
3.1.1. Quantitative Evolution Trend of Article Publications

The number of publications represents research activity in an area. Figure 1 depicts the annual changes in the number of articles published in soil moisture research from 2000 to 2022. In 2000, only 1014 articles were published, whereas, in 2010, the number increased to 2139, and in 2020, it reached 4941. This increase indicates growing interest in soil moisture research. The trend line in Figure 1, fitted to the data, reveals an expanding trend in the publication growth rate. In 2005, the growth rate was 84 articles per year, increasing to 170 articles per year in 2010 and reaching 343 articles per year in 2020. In the 21st century, the popularity of Internet technology has made it convenient to access literature search methods, enhancing information retrieval by scholars and accelerating research development. Figure 2 presents the changes in citation status of articles published in soil moisture research from 2000 to 2022. The total citations per paper (TCP) represents the ratio of the total citations to the number of articles published in a year, whereas the total citations per paper per year (TCCP) is the TCP divided by the number of years since publication. The graph’s average number of citations per article exhibited a clear declining trend, indicating a decrease in the average impact of articles in this field each year. The number of citations is directly associated with the length of time since an article has been published. Thus, the TCPP serves as a better indicator of the quality of recently published articles, and its change indicates a stable and slight improvement in literature quality over the past decade.

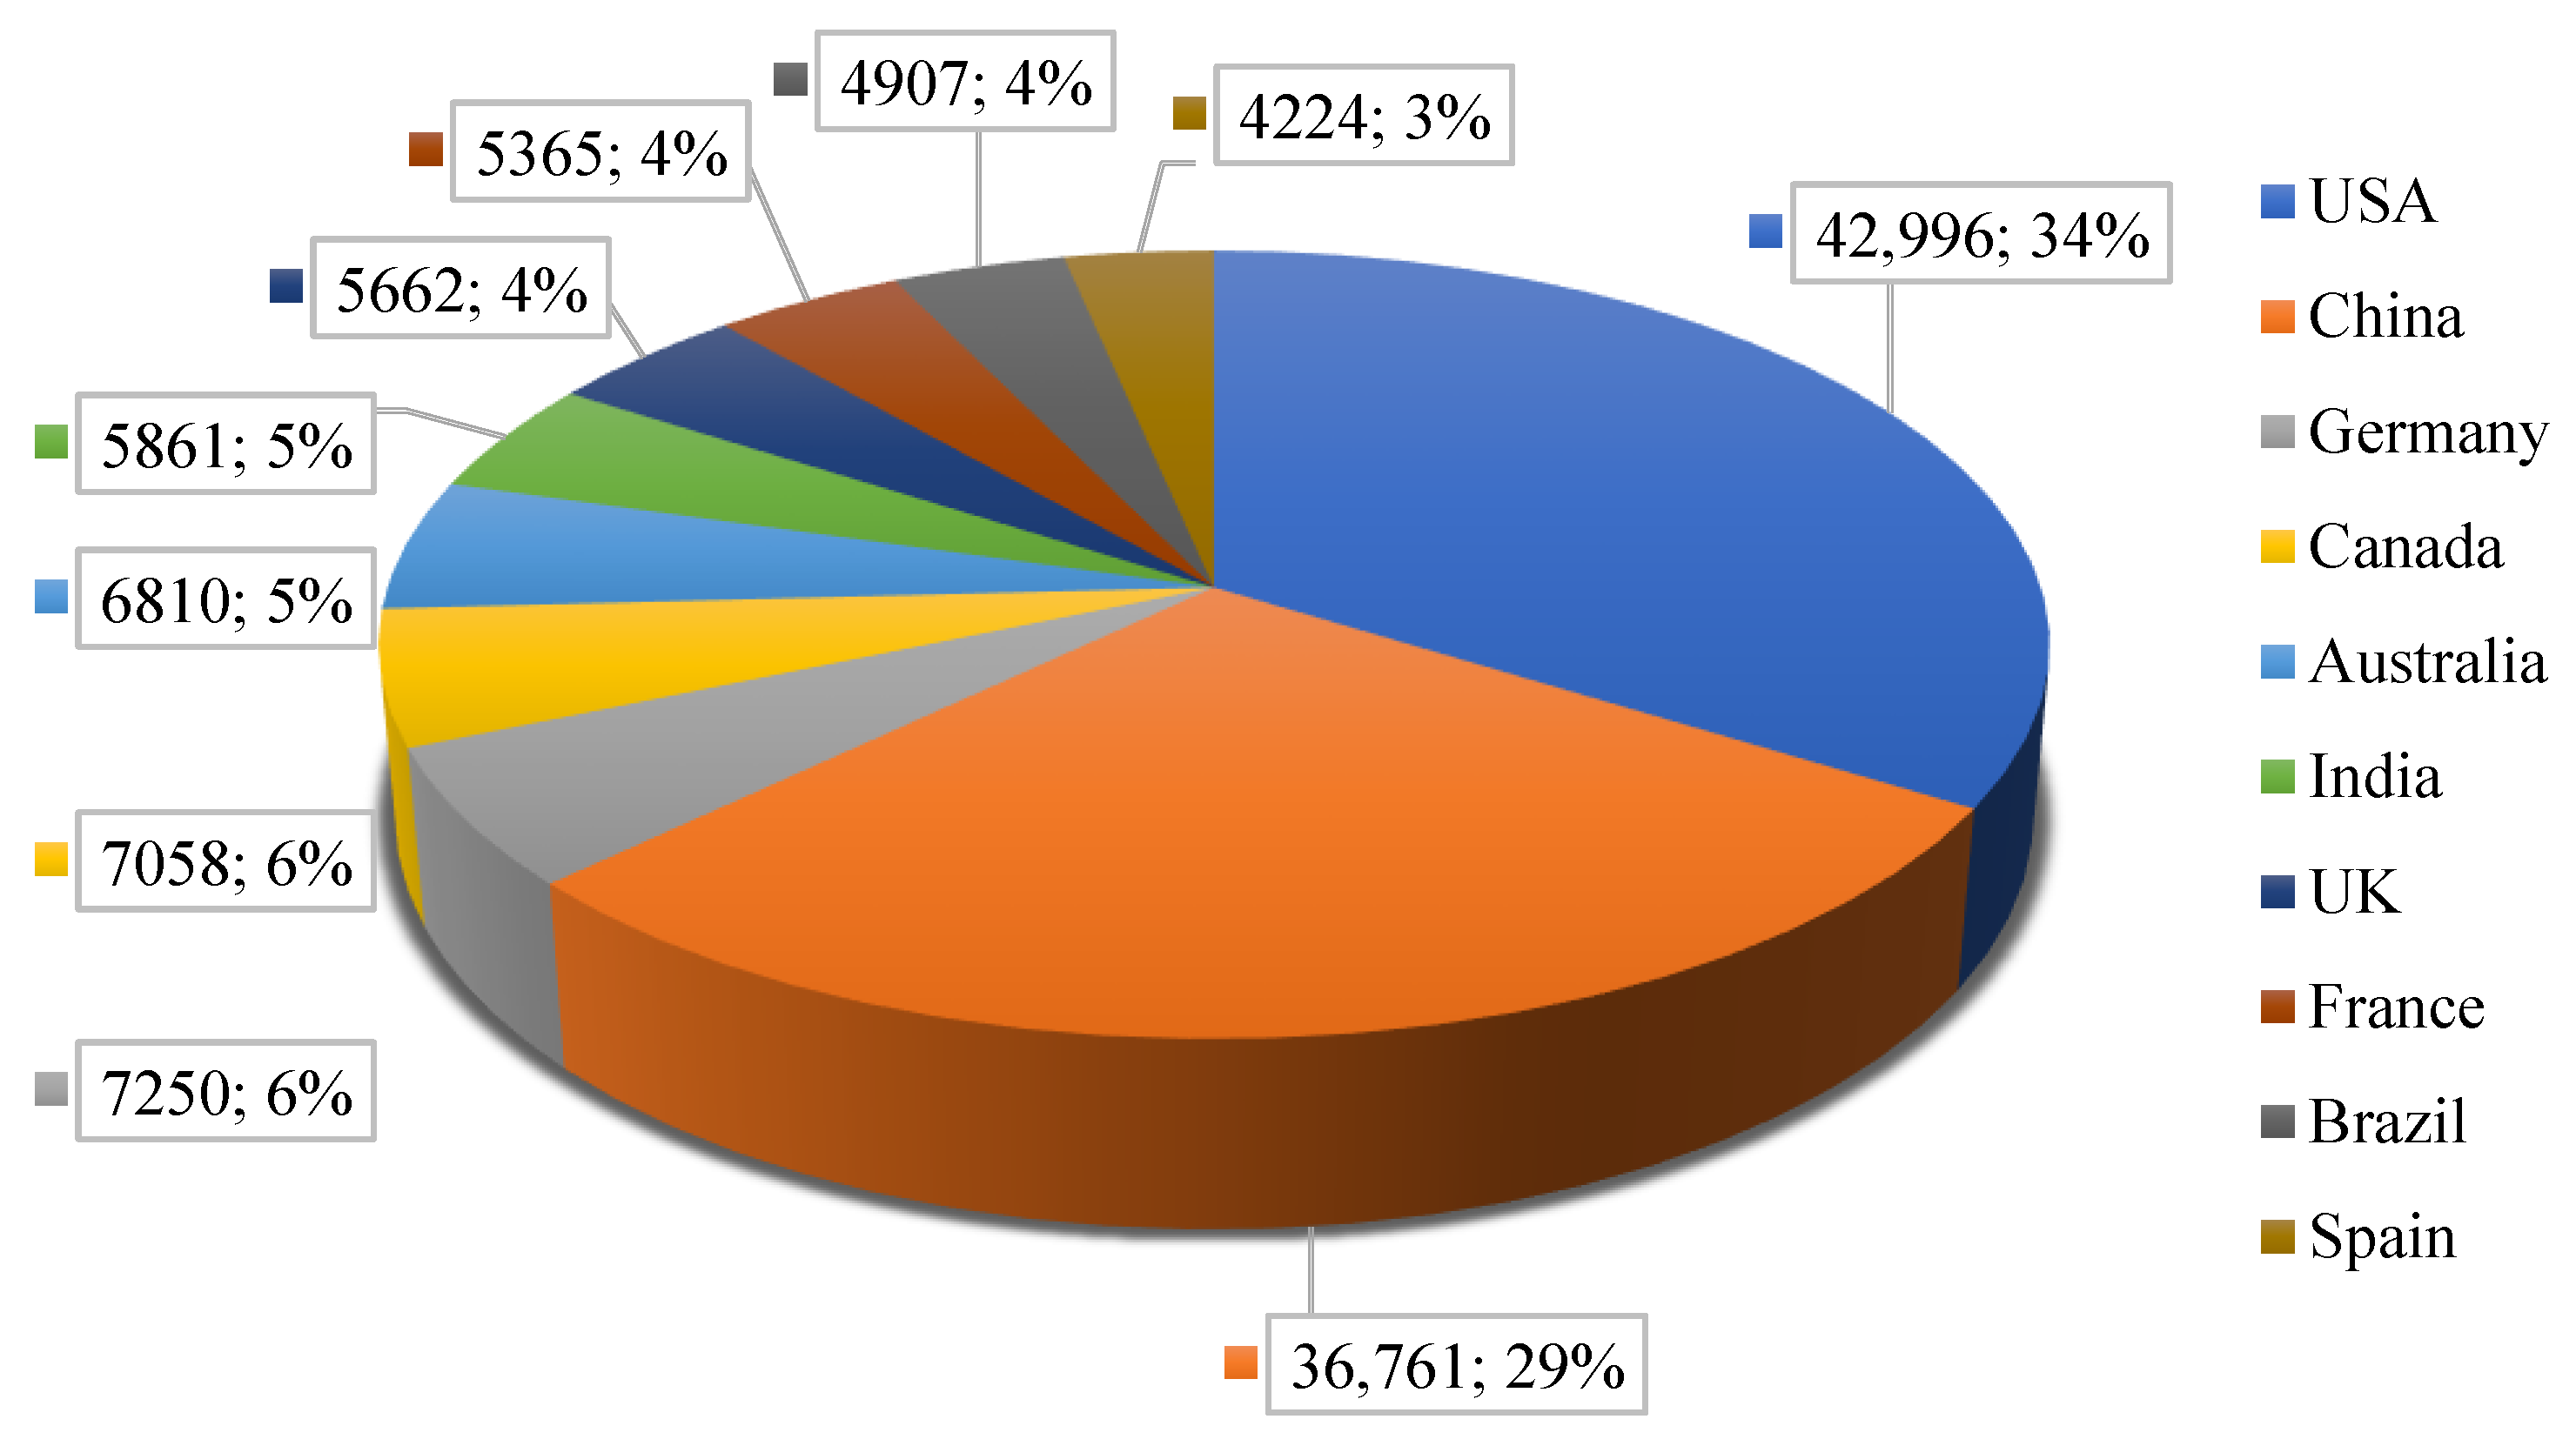
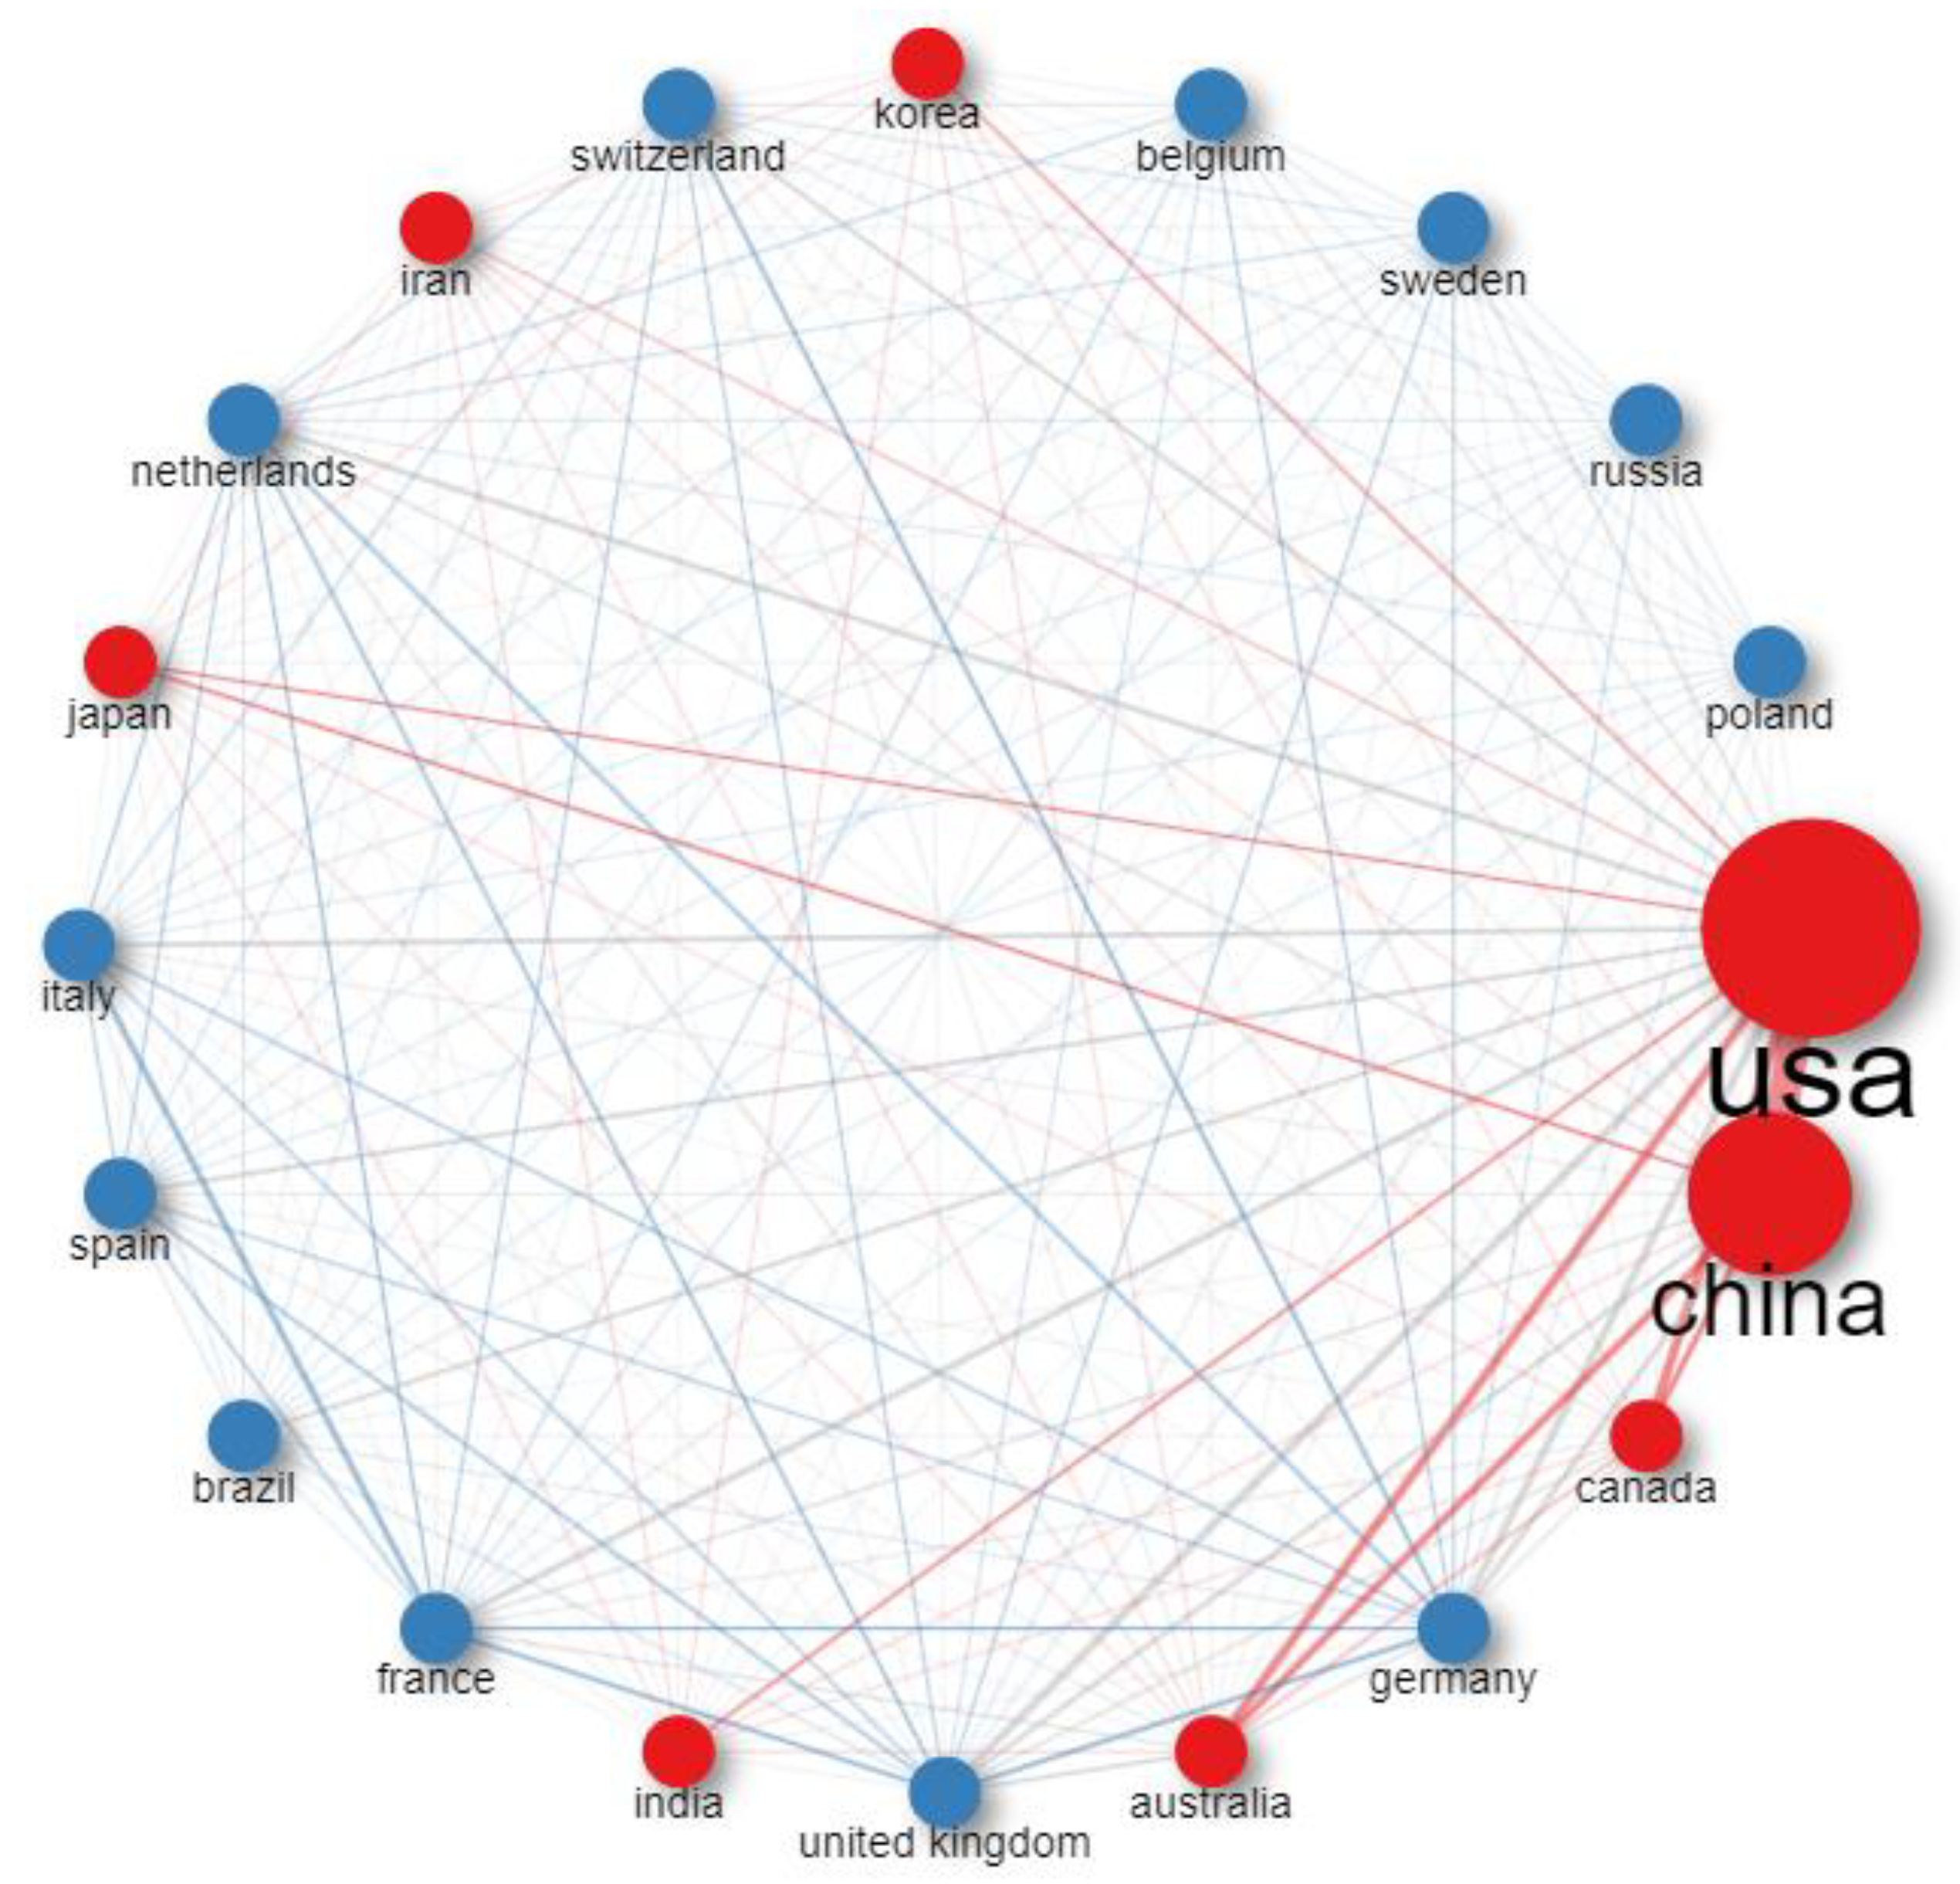
3.1.2. International Collaborations

Figure 3 presents the collaborative network of the top 20 countries in terms of publication count. The level of refinement in the network reflects the depth of research exchange, and the number of national publications indicates each country’s investment in this research area [27]. In this study, collaborative relationships were established between the authors, institutions, and countries involved in a single publication [28]. The node size in the collaborative network represents the country’s publication count in the research area, whereas the link thickness between nodes signifies the strength of the collaboration between countries. Figure 4 displays the top 10 countries in terms of publication count in this field: the United States (US), China, Germany, Canada, Australia, India, the United Kingdom, France, Brazil, and Spain. The US and China accounted for 34% and 29%, respectively, of the total number of articles. American and Chinese scholars had the most extensive and deep connections in their collaborative networks. The US was the top choice for Chinese students, comprising approximately one third of international students and scholars during the 2018/19 academic year, surpassing all other countries [29]. Simultaneously, with China’s rapid economic growth, an increasing number of American students and scholars are conducting research at Chinese universities. This collaboration is crucial in advancing global knowledge. However, starting in 2018, the US imposed strict limitations on Chinese citizens studying or researching in the fields of science, technology, engineering, and mathematics. Measures such as the United States Innovation and Competition Act of 2021 (USICA) have severely disrupted US–China scientific relations. Comprehensive technological decoupling between the US and China will significantly disrupt both commercial and scientific ties, potentially harming international collaboration in addressing global challenges, especially in areas such as public health, food security, climate change, energy, and sustainable development [29]. Canada and Australia exhibited high levels of collaboration with both China and the US. The United Kingdom and France have strong relationships with Germany and cooperate with Switzerland, the Netherlands, and Italy.

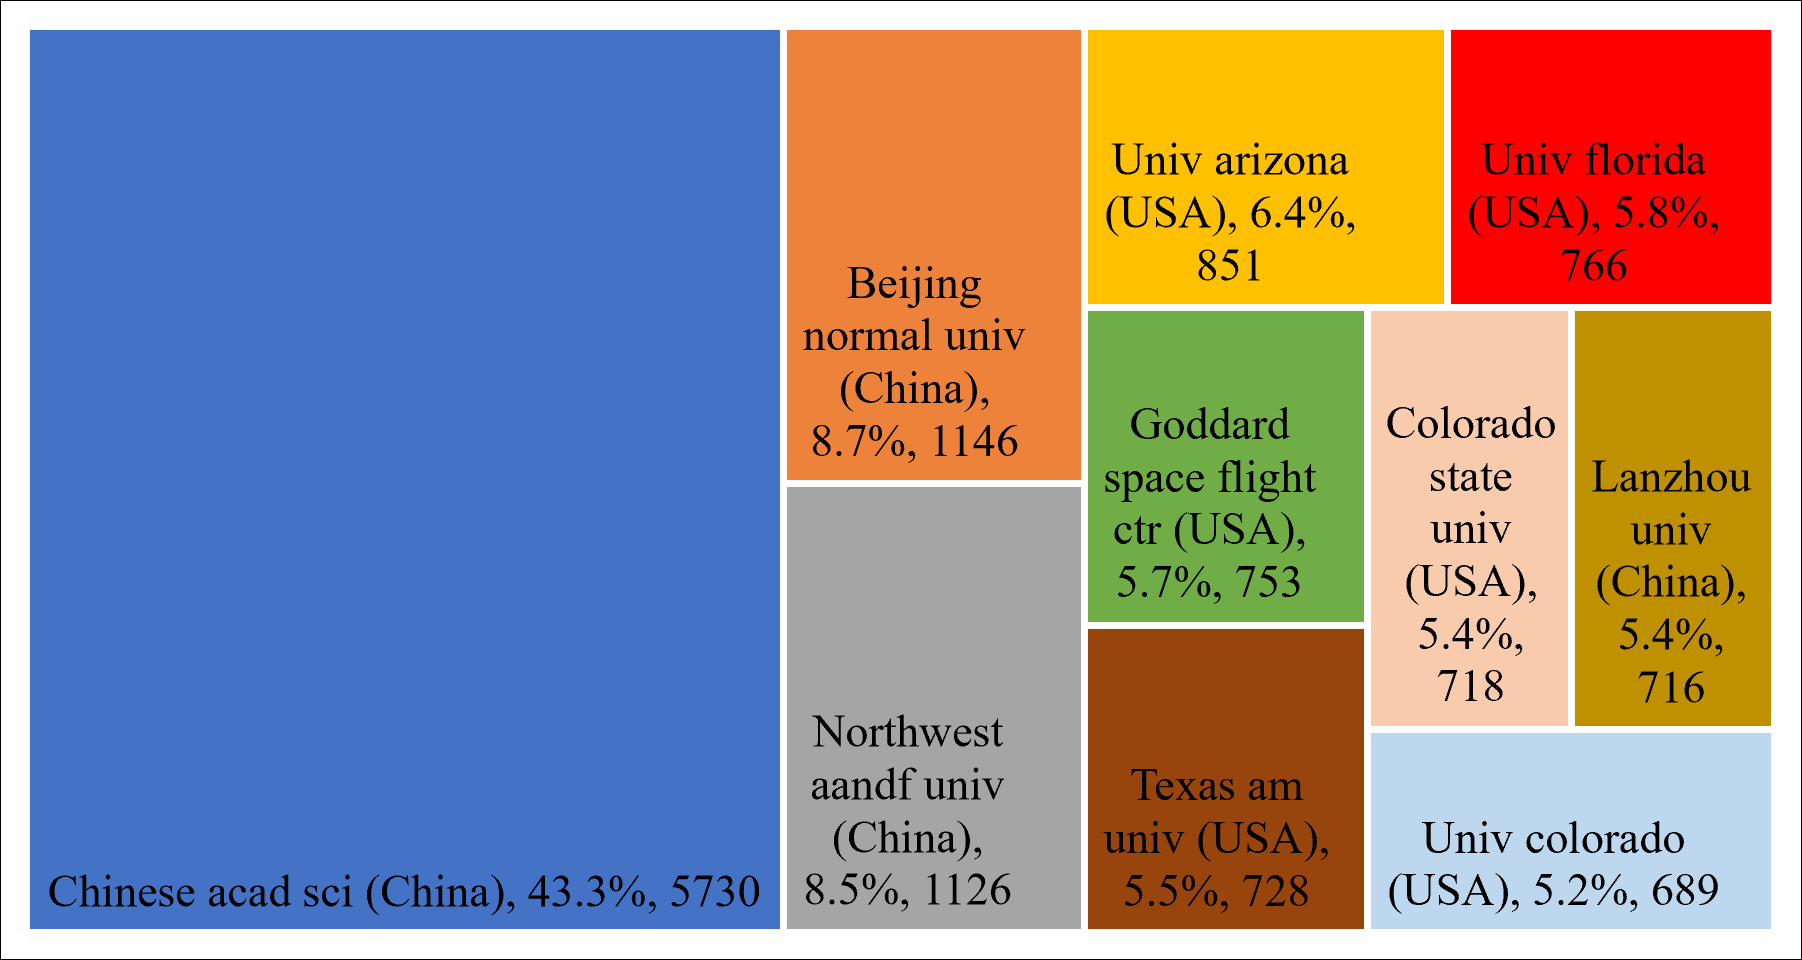
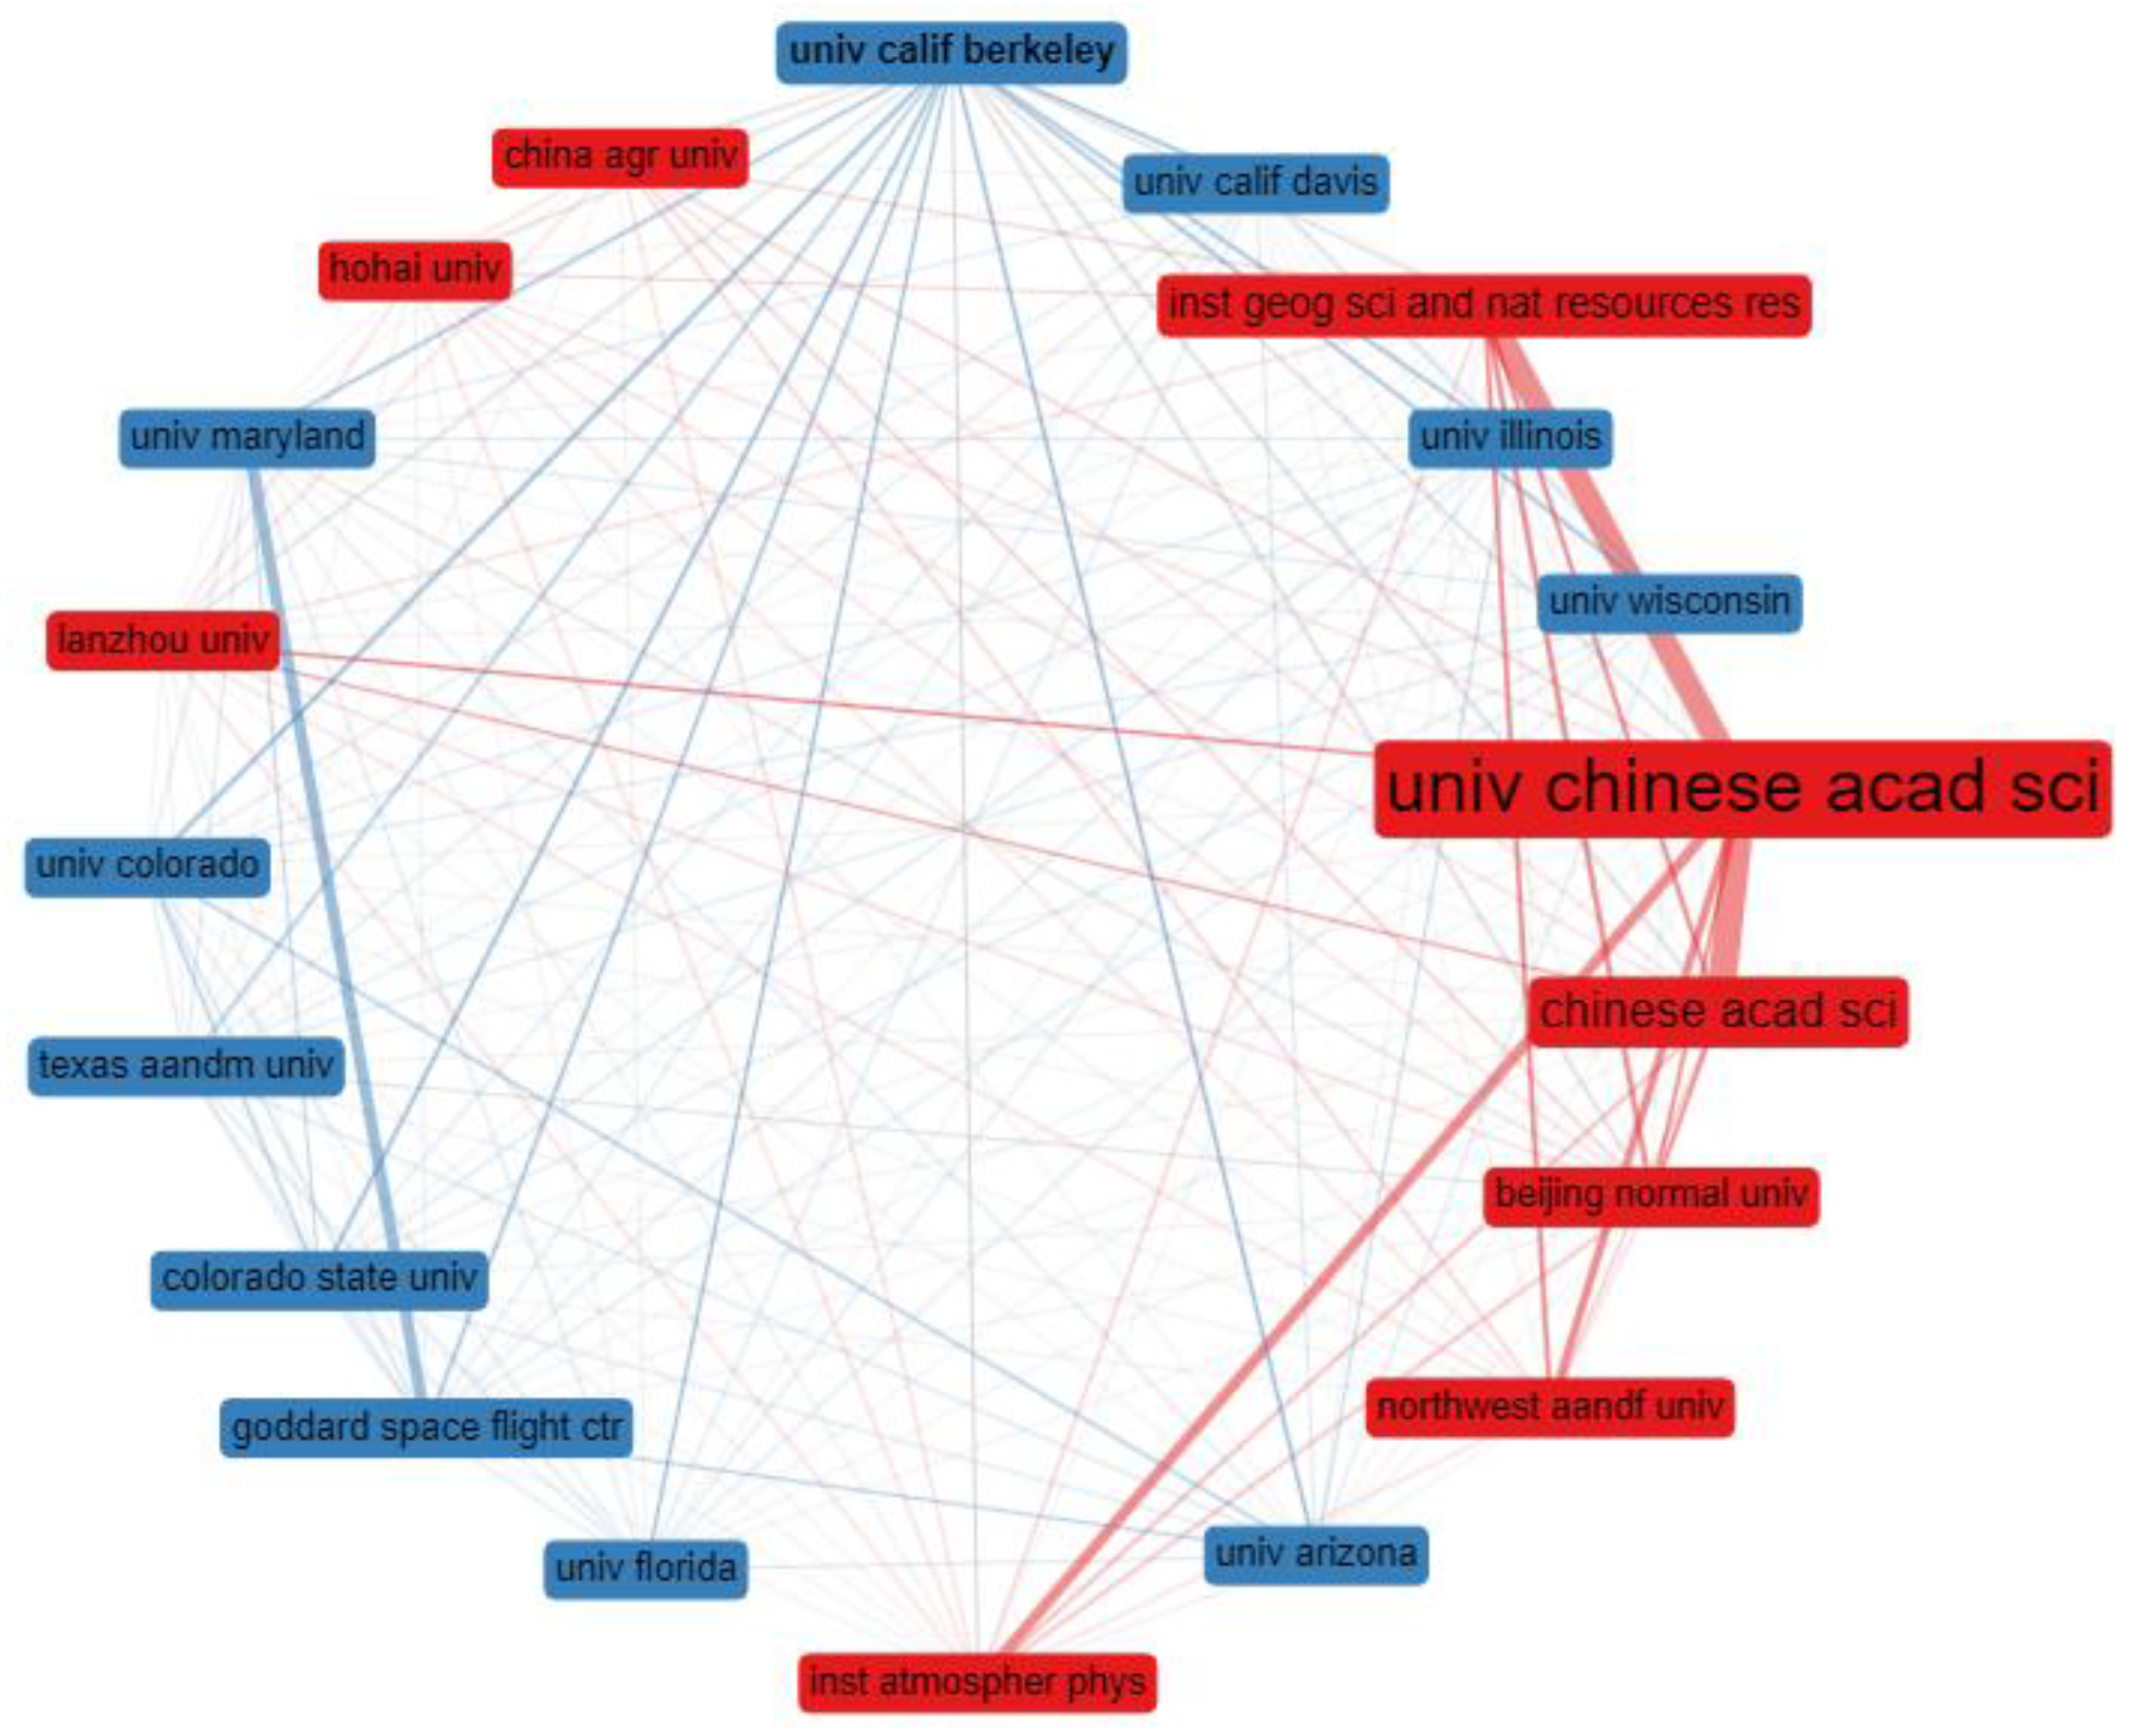
3.1.3. Institutional Collaborations

Figure 5 illustrates the publication statistics, highlighting the top 10 institutions in terms of article count: the Chinese Academy of Sciences, Beijing Normal University, Northwest A&M University, the University of Arizona, the University of Florida, the Goddard Space Flight Center, Texas A&M University, Colorado State University, Lanzhou University, and the University of Colorado. China holds four positions in the top 10, comprising the top three and the ninth positions, whereas the remaining institutions are from the US. Notably, the Chinese Academy of Sciences led the field in terms of the number of articles published, accounting for 43.3% of the total number of the top 10. Figure 6 depicts the collaborations among major international research institutions. Chinese research institutions are represented by red labels, whereas US research institutions are represented by blue labels. The label size indicates the number of publications and the lines between labels reflect the intensity of collaboration. The mapping of cooperation networks demonstrates that Chinese research institutions cooperate closely within the country; however, cooperation with international research institutions can be relatively weak. The links between the University of Maryland and the Goddard Space Flight Center are the strongest among US research institutions, with extensive links between the University of California, Berkeley, and other institutions. Cooperation between the remaining research institutions should be further strengthened.
Figure 7 illustrates the annual publication count changes in the top 10 institutions in this field. American research institutions demonstrated stable and slow growth in the annual number of paper publications, while Chinese research institutions experienced a rapid increase. Compared to the US, China had a late start in this field, with only three articles published by the Northwest Agriculture and Forestry University of Science and Technology before 2012; other Chinese research units also had low output. However, since 2012, Chinese research institutions have significantly increased their investments in time and effort, resulting in outstanding growth in research output. For instance, the Chinese Academy of Sciences published 136 articles in 2012 and 741 in 2022, whereas the Beijing Normal University published 52 articles in 2012 and 203 articles in 2022. The Chinese Academy of Sciences experienced the highest growth rate regarding the article count, with an average annual increase of 475 articles. This also corroborates the previous research findings by Zhu et al. [30]. In the SCI index, the annual production of original research articles in the US is growing slowly, whereas the annual production of original research articles in China is rapidly increasing. The number of original research articles contributed by China is steadily approaching and may soon surpass that of the US.

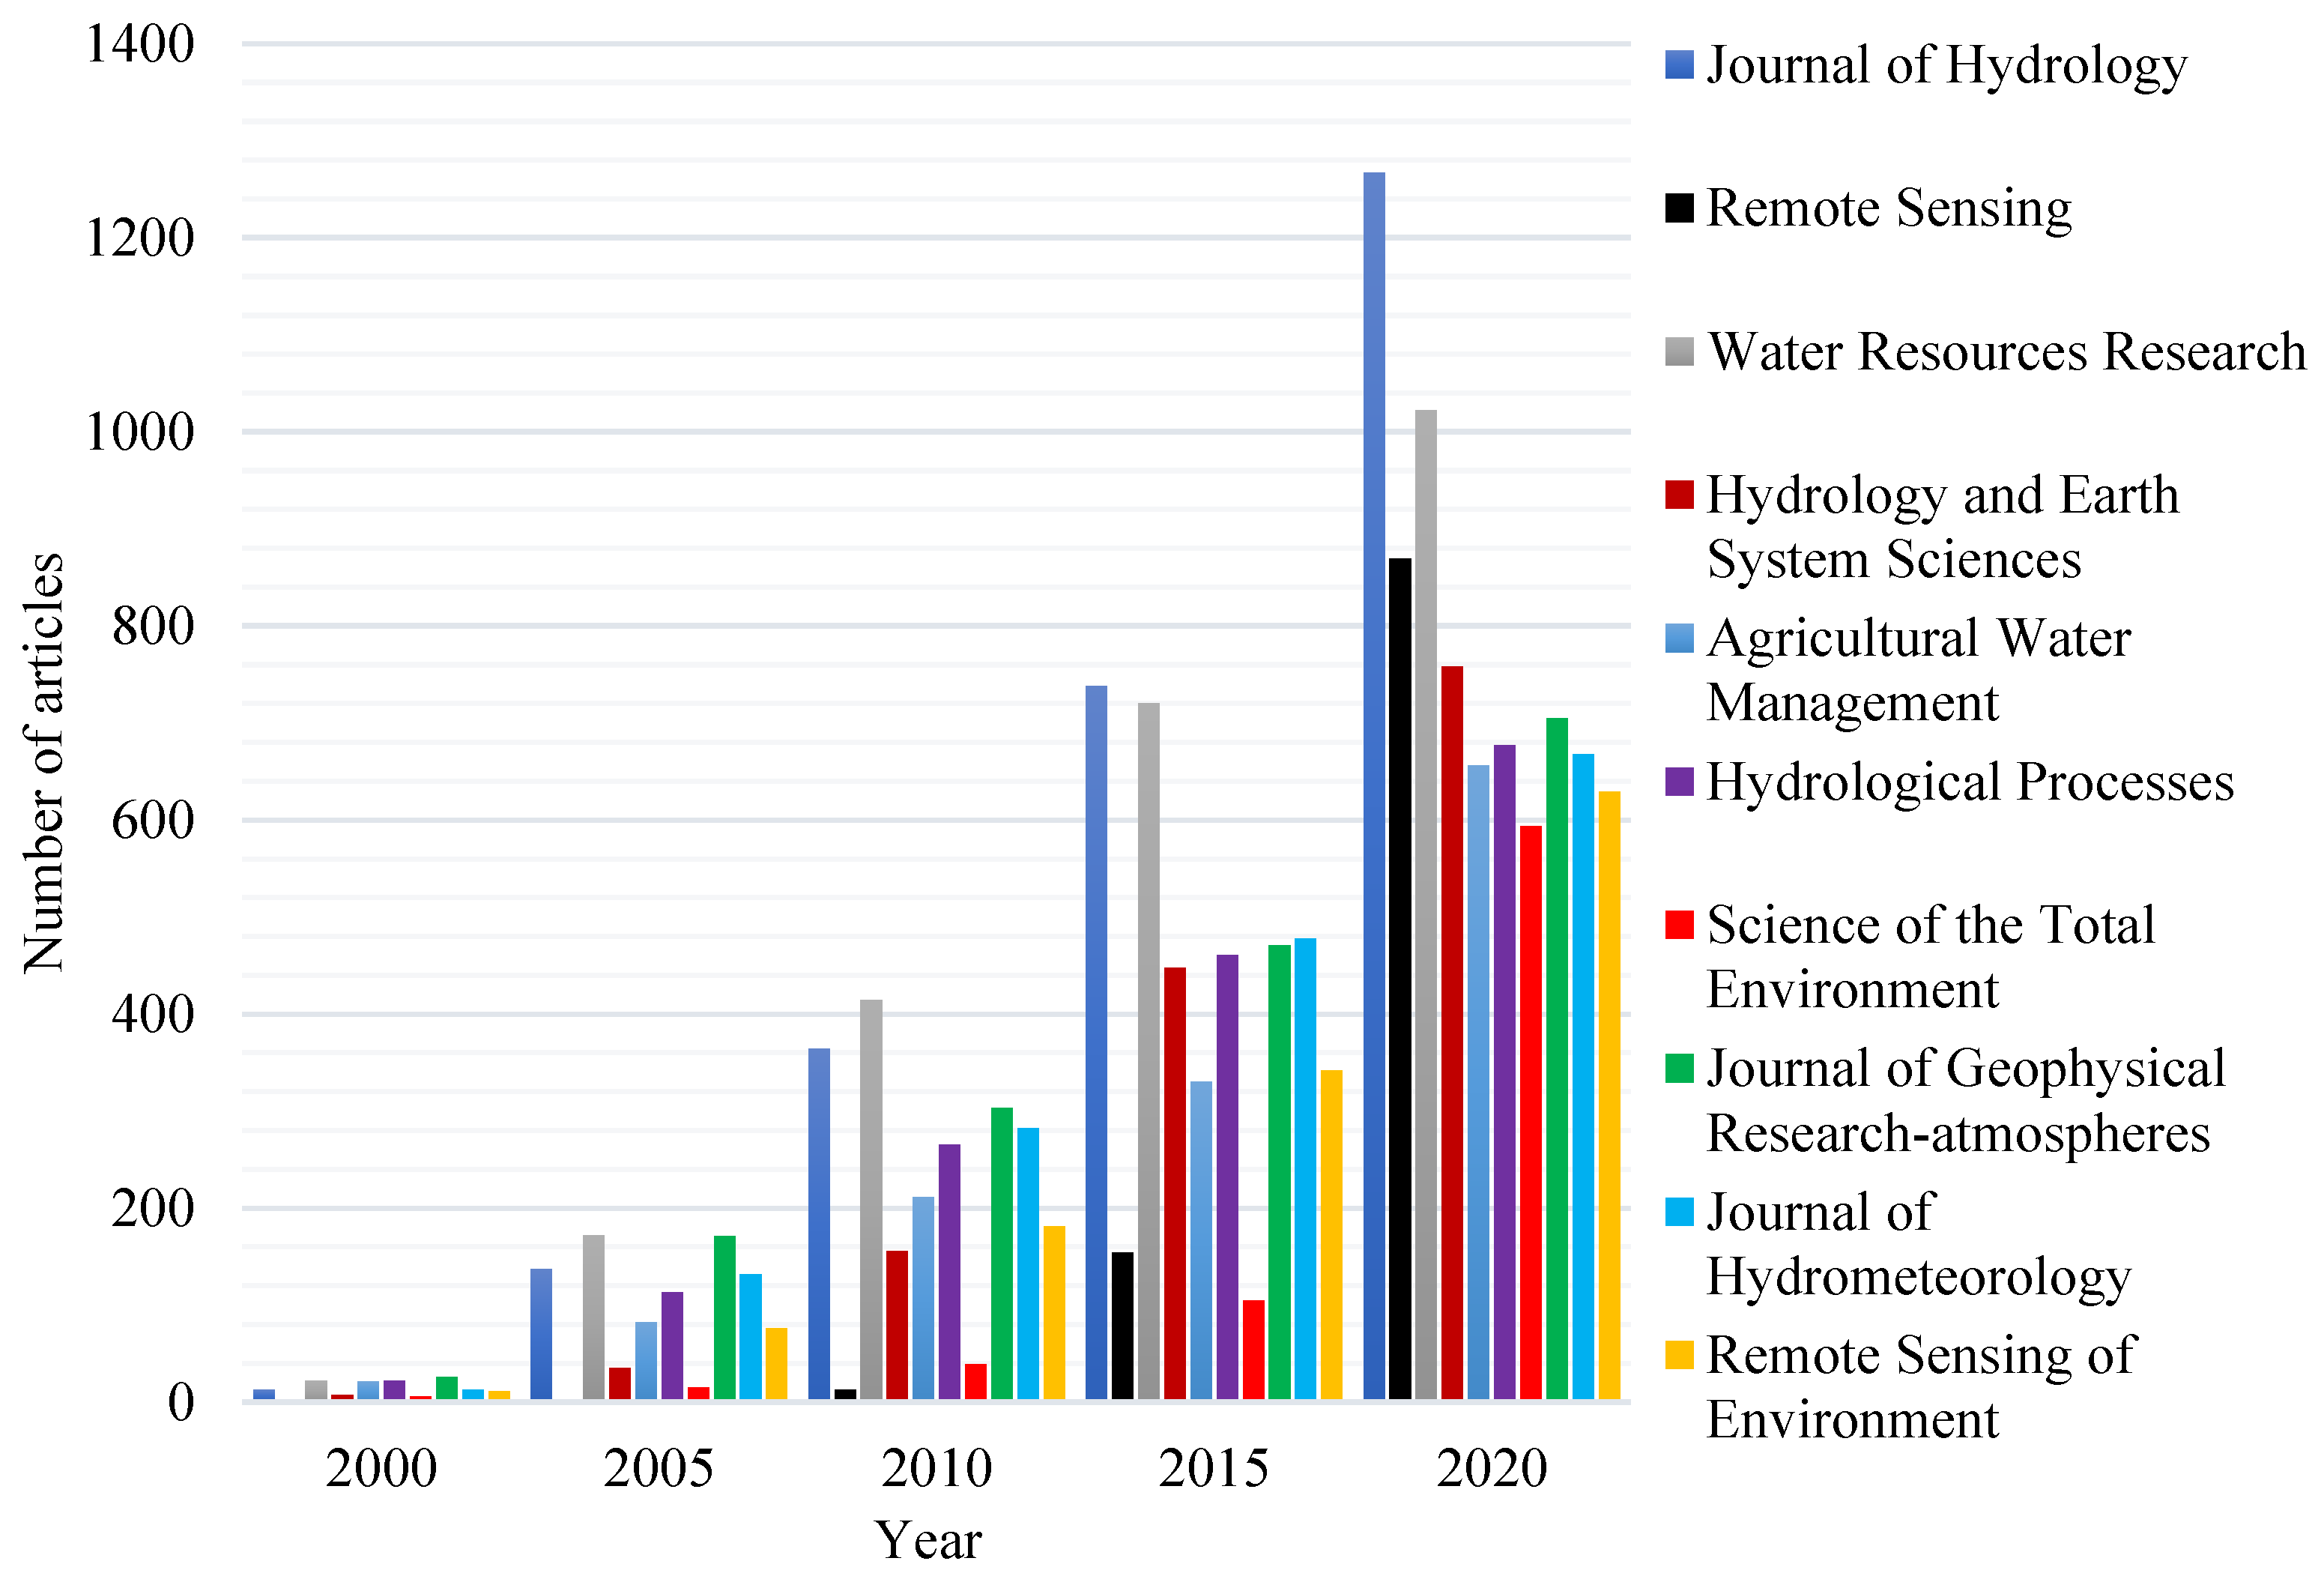
3.2. Mainstream Journals

The analysis of soil moisture research papers revealed the top journals in this field [31]. Table 1 presents the top 10 journals based on the total number of published papers. Three journals stood out, with over 1000 articles each: the Journal of Hydrology (1558 articles), Remote Sensing (1370 articles), and Water Resources Research (1133 articles). All three journals are among the top 25% ranked journals in Journal Citation Reports (JCR) and hold significant prominence in the field of soil moisture research. To evaluate the journals’ impact, the table includes the TC, IF, Quartile, and H-index. The H-index is a measure that indicates that a journal’s H articles have each been cited at least H times. For example, if a journal has 20 papers that have each been cited at least 20 times, the H-index of that journal is 20. Q1 refers to a journal’s rankings in the top 25%. Q2 refers to a journal’s ranking in the 25–50% range. Water Resources Research, the Journal of Hydrology, and Remote Sensing of the Environment have an H-index of 100 or more. Certain journals in the table, such as Remote Sensing, have a high number of publications but relatively low total citations and H-index. This indicates a lack of high-quality literature or a relatively high number of new articles in the journal. However, certain journals had a comparatively low number of publications but high total citations and H-indices, such as Remote Sensing of the Environment, suggesting the publication of high-quality articles in this category. Figure 8 compares the number of articles published in the top 10 journals over time. The graph demonstrates that journals with higher H-indices maintain a relatively stable annual research output, whereas journals with lower H-indices exhibit more variability. For example, Science of the Total Environment and Remote Sensing had fewer than 30 publications per year until 2015, after which they grew rapidly to reach 160 and 251 publications by 2022, respectively.

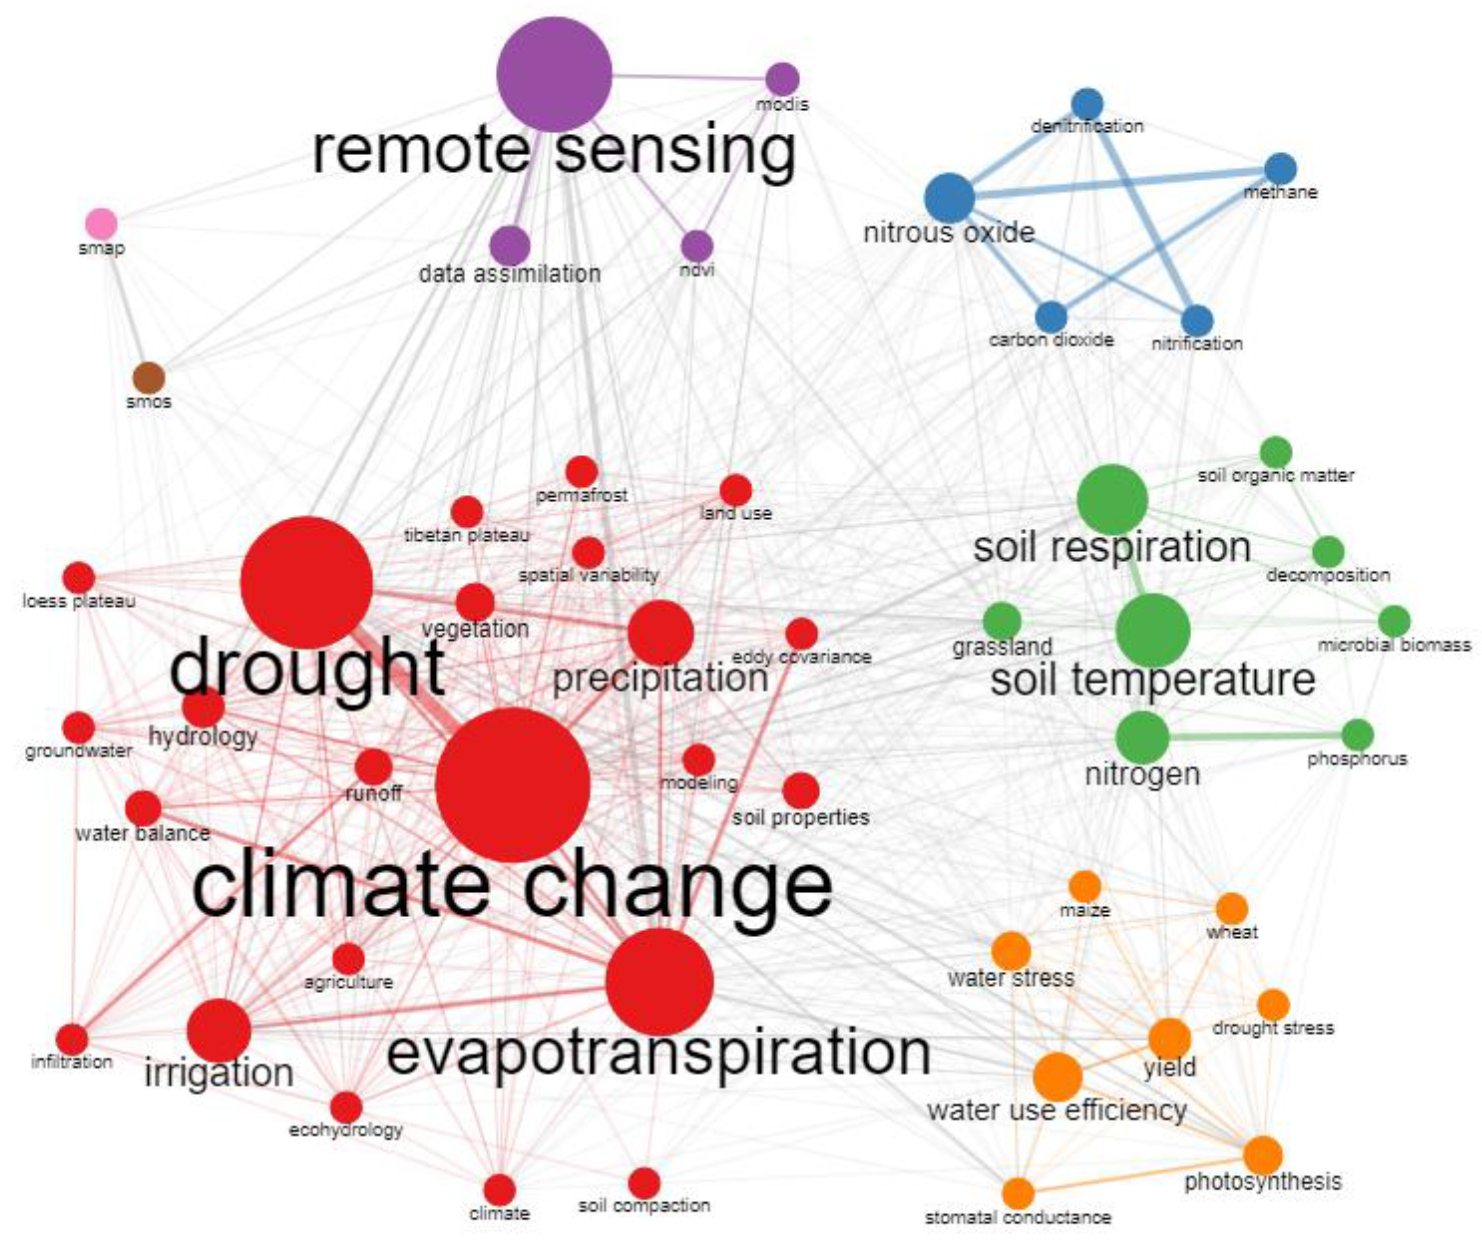
3.3. Hot Topics and Frontiers

Keywords serve as a concise summary of the content and core ideas of an article, and their frequency of occurrence can reveal hotspots and trends in the research field [32]. Table 2 presents the top 20 keywords based on frequency, with four keywords appearing 1000 times or more: climate change, evapotranspiration, drought, and remote sensing. Climate change is the most frequently used keyword in soil moisture research. Soil moisture, which is sensitive to changes in the climate system, plays a crucial role in analyzing the spatiotemporal evolution of climate change and in modeling different scenarios. Research in this field focuses on constructing climate change prediction models [33] and studying the effects of climate change on soil moisture and soil water erosion [34,35]. Evapotranspiration represents a significant pathway for soil moisture entering the atmospheric system, thereby linking physical processes such as the land surface water cycle, energy balance, and carbon balance. Quantifying the stress effect of soil moisture on evapotranspiration is a key process, and it is difficult to estimate surface evapotranspiration [36]. The third most studied is drought, which not only affects the carbon, nitrogen, and water cycles of ecosystems but also has an impact on socioeconomic development and people’s production and livelihoods, and even causes huge losses. Drought is a major cause of reduced crop harvests, and research on drought has focused on the effects of soil moisture on agricultural irrigation [37], crop growth, and the yield of agricultural products [38,39]. Remote sensing, with its ability to collect large-scale continuous spatial and temporal data, plays a crucial role in acquiring surface hydrology and vegetation information. It has become the mainstream method of studying the spatiotemporal patterns of soil moisture [40,41]. Several remote sensing tools, including microwave radiometers, medium-resolution imaging spectrometers, and satellite-based products for soil moisture and seawater salinity, have been widely employed in soil moisture research [42,43].
The co-occurrence mapping of keywords visually illustrates the relationships between them. Nodes in the mapping represent keywords, with the node size indicating their frequency and the thickness of the connecting lines reflecting the strength of association. The top 50 keywords in terms of frequency were categorized into five distinct groups, as illustrated in Figure 9.
The purple cluster primarily consists of “remote sensing”, which serves as a key technical method and provides a wealth of multi-source heterogeneous data for soil moisture research. Traditional soil moisture monitoring often involves setting up stations in the field. The gravimetric method provides precise measurements of soil moisture content; however, it consumes time and human resources [44]. Embedded sensors rely on soil moisture content conductivity for measurements, saving time and effort; however, these are still limited to the scale of the monitoring site. In summary, although traditional monitoring methods can yield precise soil moisture information, they lack spatial representativeness and face challenges in large-scale monitoring [45]. Remote sensing for soil moisture monitoring is based on the reflectance or emissivity curve of soil moisture in a specific waveband, which is resolved to invert the soil moisture content. Remote sensing offers distinct advantages over traditional station monitoring, saving time and resources while enabling large-scale real-time monitoring. It has become a prevalent method in monitoring the spatial and temporal distributions and changes in soil moisture at regional scales. The visible, near-infrared, thermal infrared, and microwave bands are employed for soil moisture remote sensing inversion, with infrared and microwave remote sensing being current research hotspots [46]. Furthermore, remote sensing inversion to obtain soil moisture data has proven effective in monitoring agricultural drought at large spatial scales [47]. Spatial resolution plays a critical role in datasets, especially when applied locally to areas characterized by non-uniform land surfaces. Numerical models, remote sensing, and artificial intelligence methods have been integrated into continuous spatial datasets to significantly improve the spatiotemporal resolution. Currently, remote sensing-derived soil moisture data typically have daily temporal and spatial resolutions of several tens of kilometers [14]. For instance, the ESA’s SMOS project provides daily data with a spatial resolution of 25 km × 25 km [48], whereas NASA’s SMAP project offers daily data with a spatial resolution of 36 km × 36 km [49]. Land assimilation and reanalysis datasets can achieve even higher spatiotemporal resolutions, with temporal resolutions reaching hourly levels and spatial resolutions of 0.1 degree × 0.1 degree or higher. For example, the ERA5 land dataset released by the ECMWF features a 1-h temporal resolution and a spatial resolution of 0.1 degree × 0.1 degree [50].
The blue cluster primarily consisted of keywords such as “nitrous oxide”, “carbon dioxide”, and “methane”, highlighting the important links between greenhouse gases and soil moisture. The accurate modeling of soil moisture and temperature is crucial in simulating greenhouse gas emissions from soil. The use of models to simulate changes in soil carbon and nitrogen dynamics and soil moisture balance under different on-farm management scenarios is a popular research topic and a global trend. The greenhouse effect poses a significant environmental challenge in the 21st century, with agricultural soils being a key source of greenhouse gases [51]. Soil represents the largest carbon reservoir in terrestrial ecosystems, with its global carbon stock at the 1–3 m soil depth being thrice that of global vegetation and twice that of the atmosphere. Carbon dioxide is generated through microbial respiration, animal respiration, plant root respiration, and the oxidation of carbonaceous substances in agricultural soils. In addition, carbon dioxide emissions result from fuel consumption during farming, irrigation, and harvesting [52,53]. Carbon dioxide contributes approximately 66% of the radiative forcing of long-lived greenhouse gases. Methane, the second-largest greenhouse gas, contributes approximately 15% to the greenhouse effect. Its warming effect per unit mass is approximately 84 to 87 times that of carbon dioxide over 20 years and 28 to 36 times that of carbon dioxide over 100 years [54]. The cultivation of rice and livestock breeding are major sources of methane in agricultural activities, with anaerobic conditions in paddy fields and animal intestines providing favorable environments for methanogen-driven methane production. Nitrous oxide, accounting for approximately 7.9% of the greenhouse effect, has a warming potential 296 to 310 times that of carbon dioxide and is a significant contributor to stratospheric ozone depletion [55]. Agricultural fertilization is responsible for approximately 30% of global nitrous oxide emissions [56,57]. Several technical measures have been developed to mitigate greenhouse gas emissions from agricultural soils, including biochar addition, straw incorporation, the utilization of organic fertilizers, and soil amendments [58,59,60].
The green cluster encompasses keywords such as “soil temperature”, “soil respiration”, and “soil organic matter”. Soil respiration refers to the emission of carbon dioxide resulting from the respiration of microorganisms, animals, and roots in the soil. Soil temperature is a major factor influencing greenhouse gas production and emissions from soils [61,62]. Higher soil temperatures can enhance crop root respiration, accelerate organic matter decomposition, and increase microbial activity, thereby promoting carbon dioxide diffusion in the soil [63]. Soil organic matter, a complex polymeric compound, is formed through a series of physical, chemical, and microbial interactions with organic residues in the soil [64]. It acts as the primary carbon source for soil respiration and significantly affects soil greenhouse gas production. Studies have demonstrated a strong correlation between soluble organic matter in soil organic matter and carbon dioxide production in the soil [65,66]. Soil moisture content and soil temperature have a close hydrothermal coupling and can significantly influence the metabolic intensity of microorganisms in the soil, whereas the strength of microbial metabolism significantly influences soil organic matter synthesis.
The red clusters consist of the elements “climate change”, “drought”, “evapotranspiration”, and “precipitation”, which are primarily relevant to the study of drought in the context of global climate change. Drought refers to a severe water scarcity phenomenon occurring over a significant area and is typically characterized by extended periods of little to no precipitation or abnormally low precipitation [67]. There are four main types of drought: meteorological, agricultural, hydrological, and socioeconomic [68]. Meteorological droughts generally occur first because of an imbalance between precipitation and evaporation, followed by agricultural droughts resulting from reduced soil moisture content and insufficient crop recharge. As drought progresses, it can lead to decreased river runoff or reservoir storage, resulting in hydrological drought and socioeconomic impacts, including unmet water needs and damage to lives and property. Excessive evaporation and insufficient precipitation are usually the direct causes of declining soil moisture content and the resulting drought [14], and researchers commonly analyze the interaction between soil moisture and drought by examining the combined processes of evaporation and precipitation [12]. In recent years, with the advancement of remote sensing technology, the coverage and accuracy of soil moisture remote sensing data have significantly improved. Soil moisture-based drought monitoring has garnered increased attention [69]. Furthermore, soil moisture serves as a key factor in the climate system, acting as an integrated indicator of surface hydrological processes that reflect the combined effects of precipitation and evaporation [70]. Moreover, soil moisture is the medium that connects the land and the atmosphere, and its variability increases the complexity of surface–atmosphere interactions and plays a very important role in climate change. Soil moisture influences the climate by altering the sensible, latent, and longwave radiation fluxes from the surface to the atmosphere. Furthermore, it influences the thermodynamic properties and hydrological processes of soil moisture itself, leading to the spatial and temporal evolutionary heterogeneity of soil moisture. Research has demonstrated that soil moisture is second only to the ocean surface temperature in climate change and plays an even greater role on land than the ocean surface temperature [71]. Current research on the relationship between climate change and soil moisture can be divided into two main areas: diagnostic parsing and exploration of the relationship between soil moisture and climate change, which is usually conducted using actual measurement data or remote sensing data [16]. The other is a numerical simulation study of the relationship between soil moisture and climate change, which generally uses models such as land surface models, coupled land–air models, and atmospheric circulation models [11].
The yellow cluster includes keywords such as “water use efficiency”, “drought stress”, and “yield”, focusing on the impact of soil moisture use efficiency on crop production. Water use efficiency refers to the amount of biomass or grain carbon produced per unit of water used by a crop [71]. It plays a crucial role in crop drought resistance and is considered a significant factor influencing crop yields under drought stress [72]. Changes in climatic factors such as temperature, precipitation, and carbon dioxide levels can affect plant water use. At the leaf level, elevated carbon dioxide levels can increase water utilization when the environment does not exceed the optimal growth temperature. Conversely, drought-stressed leaves exhibit different responses in terms of water utilization efficiency. When considering the entire crop canopy, the dynamics of crop water use and biomass accumulation must account for soil moisture evaporation, leaf transpiration, and crop growth patterns. Because organic matter synthesis is intricately linked to transpiration, maximizing soil moisture capture to promote photosynthesis under drought stress is crucial in achieving high and stable yields. Enhancing soil moisture utilization involves minimizing water loss due to non-stomatal transpiration and soil evaporation. This can be achieved through effective crop residue management, mulch use, and irrigation, which increase soil moisture utilization within the canopy and lead to improved and stable yields [71].

4. Discussion

This study conducted a quantitative analysis of the soil moisture-related literature published from 2000 to 2021 using bibliometrics from multiple angles and levels. The research findings are expressed and presented through a knowledge graph. From a bibliometric perspective, this study reveals the research history and frontiers of global soil moisture studies, providing reference information for future research by scholars in this field. Our study revealed that the number of original articles published by Chinese scholars has rapidly increased, approaching or even surpassing that of the US, which is consistent with the findings of previous research by Zhu et al. [30]. In terms of international cooperation, we found that the research collaboration between China and the US was the most profound, confirming the results of Tang et al. [29]. In the journal analysis, compared to the study by Badaluddin et al. [73], we performed a comparative analysis of journals across different time periods for a more comprehensive journal analysis. In terms of keyword analysis, compared to the previous research by Zhang et al. [41], we organized and merged synonyms within the keywords to enhance the accuracy of the research results. Nonetheless, several limitations should be acknowledged. (1) The data source was relatively homogeneous because it relied only on the WOS Core Collection SCI Extended Database in English, neglecting citation data from other scientific literature databases. (2) The research data timeframe was limited to the period from 2000 to 2022 in the WOS database, excluding citation data before 2000. (3) Existing statistical methods require further improvement. The analysis considered all authors and institutions listed in the articles uniformly, without distinguishing between the first author and the first institution. Despite these limitations, this systematic review and analysis significantly contributes to the understanding of the research landscape of soil moisture and offers valuable guidance for future scholarly endeavors in this area.

5. Conclusions

This study conducted a bibliometric analysis of soil moisture research using the WOS database from 2000 to 2022. The findings are as follows. (1) The number of publications on soil moisture has consistently increased in the 21st century, indicating growing interest and promising research prospects. (2) Studies based on the publication institution, number of publications, and highly cited articles indicated that the US, China, and developed European countries have made outstanding contributions to soil moisture-related research. (3) With respect to international cooperation, the US collaborates closely with research institutions in other countries, and Chinese scholars can enhance international cooperation. (4) The Journal of Hydrology ranks first in total articles and citations in the field of soil moisture, whereas Water Resources Research has the highest H-index. (5) The findings of the keyword study revealed that climate change, water availability, crop yield, soil temperature and respiration, greenhouse gases, remote sensing, and model assimilation techniques are prominent research areas in this field. Soil moisture research spans ecology, the environment, agriculture, and meteorology. Amid global warming, soil moisture, a sensitive indicator of climate change, has become a vital component in studying the spatial and temporal patterns of the land surface water cycle. The water content of agricultural soils directly affects crop growth and is crucially linked to crop yields and food security strategies, making it a focal point of agronomic research for a considerable time. Furthermore, the hydrothermal coupling mechanism in soil ecosystems and its evolution significantly affect carbon and nitrogen cycles, as well as soil respiration. Considering the enduring interest in soil moisture across these diverse fields, the acquisition of highly accurate, long-time-series, high-resolution, and large-scale soil moisture products has emerged as a present and future research priority in the realm of remote sensing and assimilation. The development of new satellite-based sensors, supercomputing, artificial intelligence technology, and other advanced software and hardware has contributed to the creation of soil moisture data products. These advancements ensure a solid foundation of multimodal mass data for the performance of scientific research in the field of soil moisture [41].

Author Contributions

Conceptualization, Y.C. and Y.Y.; methodology, Y.Y.; software, Y.C. and Y.X.; validation, Y.C. and X.Y.; resources, Y.Y.; data curation, Y.C.; writing—original draft preparation, Y.C.; writing—review and editing, Y.Y. and Y.C.; visualization, Y.C.; supervision, Y.Y.; project administration, X.Y.; funding acquisition, Y.Y. All authors have read and agreed to the published version of the manuscript.

Funding

This work was supported in part by the Second Tibetan Plateau Scientific Expedition and Research Program (2019QZKK09), the Special Program of Network Security and Informatization of the Chinese Academy of Sciences (CAS-WX2021SF-0106-03), and the National Earth System Science Data Center (2005DKA32300), accessed on 1 July 2023.

Institutional Review Board Statement

Not applicable.

Informed Consent Statement

Not applicable.

Data Availability Statement

Not applicable.

Conflicts of Interest

The authors declare no conflict of interest.

References

  1. Seneviratne, S.I.; Corti, T.; Davin, E.L.; Hirschi, M.; Jaeger, E.B.; Lehner, I.; Orlowsky, B.; Teuling, A.J. Investigating soil moisture-Climate interactions in a changing climate: A review. Earth-Sci. Rev. 2010, 99, 125–161. [Google Scholar] [CrossRef]
  2. Štekauerová, V.; Nagy, V.; Kotorová, D. Soil water regime of agricultural field and forest ecosystems. Biologia 2006, 61, 300–304. [Google Scholar] [CrossRef]
  3. Bell, J.M.; Schwartz, R.C.; McInnes, K.J.; Howell, T.A.; Morgan, C.L.S. Effects of irrigation level and timing on profile soil water use by grain sorghum. Agric. Water Manag. 2020, 232, 106030. [Google Scholar] [CrossRef]
  4. Robock, A.; Vinnikov, K.Y.; Srinivasan, G.; Entin, J.K.; Hollinger, S.E.; Speranskaya, N.A.; Liu, S.; Namkhai, A. The Global Soil Moisture Data Bank. Bull. Am. Meteorol. Soc. 2000, 81, 1281–1299. [Google Scholar] [CrossRef]
  5. Chen, H.; Qin, A.; Chai, Q.; Gan, Y.; Liu, Z. Quantification of Soil Water Competition and Compensation Using Soil Water Differences between Strips of Intercropping. Agric. Res. 2014, 3, 321–330. [Google Scholar] [CrossRef]
  6. Bodner, G.; Nakhforoosh, A.; Kaul, H. Management of crop water under drought: A review. Agron. Sustain. Dev. 2015, 35, 401–442. [Google Scholar] [CrossRef]
  7. Sawatsky, N.; Li, X. Importance of soil-water relations in assessing the endpoint of bioremediated soils. Plant Soil 1997, 192, 227–236. [Google Scholar] [CrossRef]
  8. Rawls, W.J.; Pachepsky, Y.A.; Ritchie, J.C.; Sobecki, T.M.; Bloodworth, H.; Ahuja, L.R. Effect of soil organic carbon on soil water retention. Geoderma 2003, 116, 61–76. [Google Scholar] [CrossRef]
  9. Li, S.; Zhou, D.; Luan, Z.; Pan, Y.; Jiao, C. Quantitative simulation on soil moisture contents of two typical vegetation communities in Sanjiang Plain, China. Chin. Geogr. Sci. 2011, 21, 723–733. [Google Scholar] [CrossRef]
  10. Wood, E.F. Global Scale Hydrology: Advances in Land Surface Modeling; Shea, M.A., Ed.; American Geophysical Union: Washington, DC, USA, 1991; Volume 29, pp. 193–201. [Google Scholar]
  11. Mehrotra, R. Sensitivity of runoff, soil moisture and reservoir design to climate change in central Indian River basins. Clim. Chang. 1999, 42, 725–757. [Google Scholar] [CrossRef]
  12. Ying, Z.; Bingcheng, S.; Hailong, H.; Jinghui, X.; Stephan, P.; Rainer, H. Modeling of Coupled Water and Heat Transfer in Freezing and Thawing Soils, Inner Mongolia. Water 2016, 8, 424. [Google Scholar]
  13. Bogoslovskiy, N.N.; Erin, S.I.; Borodina, I.A.; Kizhner, L.I. Filtration and assimilation of soil moisture satellite data. In Proceedings of the 21st International Symposium on Atmospheric and Ocean Optics: Atmospheric Physics, Tomsk, Russia, 22–26 June 2015; Volume 9680, pp. 1411–1415. [Google Scholar]
  14. Liu, Y.; Yang, Y. Advances in the Quality of Global Soil Moisture Products: A Review. Remote Sens. 2022, 14, 3741. [Google Scholar] [CrossRef]
  15. Van Hateren, T.C.; Chini, M.; Matgen, P.; Teuling, A.J. Ambiguous Agricultural Drought: Characterising Soil Moisture and Vegetation Droughts in Europe from Earth Observation. Remote Sens. 2021, 13, 1990. [Google Scholar] [CrossRef]
  16. Ramat, G.; Santi, E.; Paloscia, S.; Fontanelli, G.; Pettinato, S.; Santurri, L.; Souissi, N.; Ponte, E.D.; Wahab, M.M.A.; Khalil, A.A.; et al. Remote sensing techniques for water management and climate change monitoring in drought areas: Case studies in Egypt and Tunisia. Eur. J. Remote Sens. 2023, 56, 23. [Google Scholar] [CrossRef]
  17. McColl, K.A.; Alemohammad, S.H.; Akbar, R.; Konings, A.G.; Yueh, S.; Entekhabi, D. The global distribution and dynamics of surface soil moisture. Nat. Geosci. 2017, 10, 100–104. [Google Scholar] [CrossRef]
  18. Cui, Y.; Zeng, C.; Zhou, J.; Xie, H.; Wan, W.; Hu, L.; Xiong, W.; Chen, X.; Fan, W.; Hong, Y. A spatio-temporal continuous soil moisture dataset over the Tibet Plateau from 2002 to 2015. Sci. Data 2019, 6, 247. [Google Scholar] [CrossRef]
  19. Ellegaard, O.; Wallin, J.A. The bibliometric analysis of scholarly production: How great is the impact? Scientometrics 2015, 105, 1809–1831. [Google Scholar] [CrossRef]
  20. Godin, B. On the origins of bibliometrics. Scientometrics 2006, 68, 25. [Google Scholar] [CrossRef]
  21. Yan, J.; Wang, C.; Cheng, W.; Gao, M.; Zhou, A. Aretro spective of knowledge graphs. Front. Comput. Sci. 2018, 12, 20. [Google Scholar] [CrossRef]
  22. Guil-Guerrero, J.L.; Manzano-Agugliaro, F. Worldwide research trends on Neanderthals. J. Quat. Sci. 2023, 38, 208–220. [Google Scholar] [CrossRef]
  23. Burhanudin, K.; Jusoh, M.H.; Latiff, Z.I.A.; Hashim, M.H.; Ashar, N.D.K. The Estimation of the Geomagnetically Induced Current Based on Simulation and Measurement at the Power Network: A Bibliometric Analysis of 42 Years (1979–2021). IEEE Access 2022, 10, 56525–56549. [Google Scholar] [CrossRef]
  24. Sanchez-Nunez, P.; Cobo, M.J.; De Las Heras-Pedrosa, C.; Pelaez, J.I.; Herrera-Viedma, E. Opinion Mining, Sentiment Analysis and Emotion Understanding in Advertising: A Bibliometric Analysis. IEEE Access 2020, 8, 134563–134576. [Google Scholar] [CrossRef]
  25. Blanco-Mesa, F.; Leon-Castro, E.; Merigo, J.M. A bibliometric analysis of aggregation operators. Appl. Soft Comput. 2019, 81, 105488. [Google Scholar] [CrossRef]
  26. Chen, X.; Jia, S.; Xiang, Y. Areview: Knowledge reasoning over knowledge graph. Expert Syst. Appl. 2020, 141, 21. [Google Scholar] [CrossRef]
  27. Aria, M.; Cuccurullo, C. bibliometrix: An R-tool for comprehensive science mapping analysis. J. Informetr. 2017, 11, 959–975. [Google Scholar] [CrossRef]
  28. Xu, Y.; Yang, Y.; Chen, X.; Liu, Y. Bibliometric Analysis of Global NDVI Research Trends from 1985 to 2021. Remote Sens. 2022, 14, 3967. [Google Scholar] [CrossRef]
  29. Tang, L.; Cao, C.; Wang, Z.; Zhou, Z. Decoupling in science and education: A collateral damage beyond deteriorating US–China relations. Sci. Public Policy 2021, 48, 630–634. [Google Scholar] [CrossRef]
  30. Zhu, J.; Liu, W. Comparing like with like: China ranks first in SCI-indexed research articles since 2018. Scientometrics 2020, 124, 1691–1700. [Google Scholar] [CrossRef]
  31. Feddes, R.A.; Kowalik, P.; Kolinska-Malinka, K.; Zaradny, H. Simulation of field water uptake by plants using a soil water dependent root extraction function. J. Hydrol. 1976, 31, 13–26. [Google Scholar] [CrossRef]
  32. Wang, M.; Chai, L. Three new bibliometric indicators/approaches derived from keyword analysis. Scientometrics 2018, 116, 30. [Google Scholar] [CrossRef]
  33. Green, J.K.; Seneviratne, S.I.; Berg, A.M.; Findell, K.L.; Hagemann, S.; Lawrence, D.M.; Gentine, P. Large influence of soil moisture on long-term terrestrial carbon uptake. Nature 2019, 565, 476–479. [Google Scholar] [CrossRef] [PubMed]
  34. Guo, Y.; Peng, C.; Zhu, Q.; Wang, M.; Wang, H.; Peng, S.; He, H. Modelling the impacts of climate and land use changes on soil water erosion: Model applications, limitations and future challenges. J. Environ. Manag. 2019, 250, 109403. [Google Scholar] [CrossRef] [PubMed]
  35. Cheema, M.J.M.; Bastiaanssen, W.G.M.; Rutten, M.M. Validation of surface soil moisture from AMSR-E using auxiliary spatial data in the transboundary Indus Basin. J. Hydrol. 2011, 405, 137–149. [Google Scholar] [CrossRef]
  36. Dong, J.; Akbar, R.; Feldman, A.F.; Gianotti, D.S.; Entekhabi, D. Land Surfaces at the Tipping-Point for Water and Energy Balance Coupling. Water Resour. Res. 2023, 59, e2022WR032472. [Google Scholar] [CrossRef]
  37. Orduña Alegría, M.E.; Schütze, N.; Niyogi, D. Evaluation of Hydroclimatic Variability and Prospective Irrigation Strategies in the U.S. Corn Belt. Water 2019, 11, 2447. [Google Scholar] [CrossRef]
  38. Belder, P.; Bouman, B.A.M.; Cabangon, R.; Guoan, L.; Quilang, E.J.P.; Yuanhua, L.; Spiertz, J.H.J.; Tuong, T.P. Effect of water-saving irrigation on rice yield and water use in typical lowland conditions in Asia. Agric. Water Manag. 2004, 65, 193–210. [Google Scholar] [CrossRef]
  39. Ulrich, D.E.M.; Sevanto, S.; Ryan, M.; Albright, M.B.N.; Johansen, R.B.; Dunbar, J.M. Plant-microbe interactions before drought influence plant physiological responses to subsequent severe drought. Sci. Rep. 2019, 9, 249. [Google Scholar] [CrossRef]
  40. Chen, J.M.; Chen, X.; Ju, W.; Geng, X. Distributed hydrological model for mapping evapotranspiration using remote sensing inputs. J. Hydrol. 2005, 305, 15–39. [Google Scholar] [CrossRef]
  41. Hailin, Z.; Xiuyun, L.; Jun, Y.; Xiufeng, Y.; Tieniu, W.; Yi, H.; He, D.; Muxing, L.; Pei, T. Bibliometric Analysis of Research on Soil Water from 1934 to 2019. Water 2020, 12, 1631. [Google Scholar]
  42. Reichle, R.H. Data assimilation methods in the Earth sciences. Adv. Water Resour. 2008, 31, 1411–1418. [Google Scholar] [CrossRef]
  43. Karthikeyan, L.; Pan, M.; Wanders, N.; Kumar, D.N.; Wood, E.F. Four decades of microwave satellite soil moisture observations; Part 1, A review of retrieval algorithms. Adv. Water Resour. 2017, 109, 106–120. [Google Scholar] [CrossRef]
  44. Foody, G.M. Soil moisture content ground data for remote sensing investigations of agricultural regions. Int. J. Remote Sens. 1991, 12, 1461–1469. [Google Scholar] [CrossRef]
  45. Zhu, Q.; Liao, K.; Xu, Y.; Yang, G.; Wu, S.; Zhou, S. Monitoring and prediction of soil moisture spatial-temporal variations from a hydropedological perspective; a review. Soil Res. 2012, 50, 625–637. [Google Scholar] [CrossRef]
  46. McGuirk, S.L.; Cairns, I.H. Soil moisture prediction with multispectral visibal and nir remote sensing. ISPRS Ann. Photogramm. Remote Sens. Spat. Inf. Sci. 2022, V-3-2022, 447–453. [Google Scholar] [CrossRef]
  47. Gebremedhin, G.H.; Qiuhong, T.; Wenhong, L.; Xingcai, L.; Xuejun, Z. Drought: Progress in broadening its understanding. Wiley Interdiscip. Rev. Water 2020, 7, e1407. [Google Scholar]
  48. Al Bitar, A.; Leroux, D.; Kerr, Y.H.; Merlin, O.; Richaume, P.; Sahoo, A.; Wood, E.F. Evaluation of SMOS Soil Moisture Products Over Continental U.S. Using the SCAN/SNOTEL Network. IEEE Trans. Geosci. Remote Sens. 2012, 50, 1572–1586. [Google Scholar] [CrossRef]
  49. Chan, S.K.; Bindlish, R.; O’Neill, P.E.; Njoku, E.; Jackson, T.; Colliander, A.; Chen, F.; Burgin, M.; Dunbar, S.; Piepmeier, J.; et al. Assessment of the SMAP Passive Soil Moisture Product. IEEE Trans. Geosci. Remote Sens. 2016, 54, 4994–5007. [Google Scholar] [CrossRef]
  50. Hoffmann, L.; Gunther, G.; Li, D.; Stein, O.; Wu, X.; Griessbach, S.; Heng, Y.; Konopka, P.; Muller, R.; Vogel, B.; et al. From ERA-Interim to ERA5: The considerable impact of ECMWF’s next-generation reanalysis on Lagrangian transport simulations. Atmos. Chem. Phys. 2019, 19, 3097–3124. [Google Scholar] [CrossRef]
  51. Wang, H.; Zhao, R.; Zhao, D.; Liu, S.; Fu, J.; Zhang, Y.; Dai, N.; Song, D.; Ding, H. Microbial-Mediated Emissions of Greenhouse Gas from Farmland Soils: A Review. Processes 2022, 10, 2361. [Google Scholar] [CrossRef]
  52. Deng, C.; Li, R.; Xie, B.; Wan, Y.; Li, Z.; Liu, C. Impacts of the integrated pattern of water and land resources use on agricultural greenhouse gas emissions in China during 2006–2017: A water-land-energy-emissions nexus analysis. J. Clean Prod. 2021, 308, 127221. [Google Scholar] [CrossRef]
  53. Oertel, C.; Matschullat, J.; Zurba, K.; Zimmermann, F.; Erasmi, S. Greenhouse gas emissions from soils—A review. Geochemistry 2016, 76, 327–352. [Google Scholar] [CrossRef]
  54. Ji, D.; Zhou, M.; Wang, P.; Yang, Y.; Wang, T.; Sun, X.; Hermans, C.; Yao, B.; Wang, G. Deriving Temporal and Vertical Distributions of Methane in Xianghe Using Ground-based Fourier Transform Infrared and Gas-analyzer Measurements. Adv. Atmos. Sci. 2020, 37, 597–607. [Google Scholar] [CrossRef]
  55. Thompson, R.L.; Lassaletta, L.; Patra, P.K.; Wilson, C.; Wells, K.C.; Gressent, A.; Koffi, E.N.; Chipperfield, M.P.; Winiwarter, W.; Davidson, E.A.; et al. Acceleration of global N2O emissions seen from two decades of atmospheric inversion. Nat. Clim. Chang. 2019, 9, 993–998. [Google Scholar] [CrossRef]
  56. Cui, X.; Zhou, F.; Ciais, P.; Davidson, E.A.; Tubiello, F.N.; Niu, X.; Ju, X.; Canadell, J.G.; Bouwman, A.F.; Jackson, R.B.; et al. Global mapping of crop-specific emission factors highlights hotspots of nitrous oxide mitigation. Nat. Food 2021, 2, 886–893. [Google Scholar] [CrossRef] [PubMed]
  57. Tian, H.; Xu, R.; Canadell, J.G.; Thompson, R.L.; Winiwarter, W.; Suntharalingam, P.; Davidson, E.A.; Ciais, P.; Jackson, R.B.; Janssens-Maenhout, G.; et al. A comprehensive quantification of global nitrous oxide sources and sinks. Nature 2020, 586, 248–256. [Google Scholar] [CrossRef]
  58. Zhang, B.; Zhou, M.; Lin, H.; Ntacyabukura, T.; Wang, Y.; Zhu, B. Effects of different long-term crop straw management practices on ammonia volatilization from subtropical calcareous agricultural soil. Atmos. Ocean. Sci. Lett. Daqi-He-Haiyang-Kexue-Kuaibao 2020, 13, 232–239. [Google Scholar] [CrossRef]
  59. Sun, J.; Peng, H.; Chen, J.; Wang, X.; Wei, M.; Li, W.; Yang, L.; Zhang, Q.; Wang, W.; Mellouki, A. An estimation of CO2 emission via agricultural crop residue open field burning in China from 1996 to 2013. J. Clean. Prod. 2016, 112, 2625–2631. [Google Scholar] [CrossRef]
  60. Sun, D.; Tang, X.; Li, J.; Liu, M.; Hou, L.; Yin, G.; Chen, C.; Zhao, Q.; Klümper, U.; Han, P. Chlorate as a comammox Nitrospira specific inhibitor reveals nitrification and N2O production activity in coastal wetland. Soil Biol. Biochem. 2022, 173, 108782. [Google Scholar] [CrossRef]
  61. Wang, Q.; Zhao, X.; Chen, L.; Yang, Q.; Chen, S.; Zhang, W. Global synthesis of temperature sensitivity of soil organic carbon decomposition: Latitudinal patterns and mechanisms. Funct. Ecol. 2019, 33, 514–523. [Google Scholar] [CrossRef]
  62. Kellman, L.L.; Myette, A.A.; Beltrami, H.H. Depth-Dependent Mineral Soil CO2 Production Processes: Sensitivity to Harvesting-Induced Changes in Soil Climate. PLoS ONE 2015, 10, e0134171. [Google Scholar] [CrossRef]
  63. Voigt, C.; Lamprecht, R.E.; Marushchak, M.E.; Lind, S.E.; Novakovskiy, A.; Aurela, M.; Martikainen, P.J.; Biasi, C. Warming of subarctic tundra increases emissions of all three important greenhouse gases-carbon dioxide, methane, and nitrous oxide. Glob. Chang. Biol. 2017, 23, 3121–3138. [Google Scholar] [CrossRef] [PubMed]
  64. Derenne, S.; Quénéa, K. Analytical pyrolysis as a tool to probe soil organic matter. J. Anal. Appl. Pyrolysis 2015, 111, 108–120. [Google Scholar] [CrossRef]
  65. Li, Y.; Dong, S.; Liu, S.; Zhou, H.; Gao, Q.; Cao, G.; Wang, X.; Su, X.; Zhang, Y.; Tang, L.; et al. Seasonal changes of CO2, CH4 and N2O fluxes in different types of alpine grassland in the Qinghai-Tibetan Plateau of China. Soil Biol. Biochem. 2015, 80, 306–314. [Google Scholar] [CrossRef]
  66. Chen, H.; Yang, Z.; Chu, R.K.; Tolic, N.; Liang, L.; Graham, D.E.; Wullschleger, S.D.; Gu, B. Molecular Insights into Arctic Soil Organic Matter Degradation under Warming. Environ. Sci. Technol. 2018, 52, 4555–4564. [Google Scholar] [CrossRef]
  67. Mishra, A.K.; Singh, V.P. Drought modeling: A review. J. Hydrol. 2011, 403, 157–175. [Google Scholar] [CrossRef]
  68. Quiring, S.M. Developing Objective Operational Definitions for Monitoring Drought. J. Appl. Meteorol. Clim. 2009, 48, 1217–1229. [Google Scholar] [CrossRef]
  69. Yao, Y.; Chen, X.; Qian, J. Advance in Agricultural Drought Monitoring Using Remote Sensing Data. Spectrosc. Spectr. Anal. 2019, 39, 8. [Google Scholar]
  70. Allan, R.P.; Barlow, M.; Byrne, M.P.; Cherchi, A.; Douville, H.; Fowler, H.J.; Gan, T.Y.; Pendergrass, A.G.; Rosenfeld, D.; Swann, A.L.S.; et al. Advances in understanding large-scale responses of the water cycle to climate change. Ann. N. Y. Acad. Sci. 2020, 1472, 49–75. [Google Scholar] [CrossRef]
  71. Hatfield, J.L.; Dold, C. Water-Use Efficiency: Advances and Challenges in a Changing Climate. Front. Plant Sci. 2019, 10, 103. [Google Scholar] [CrossRef]
  72. Blum, A. Effective use of water (EUW) and not water-use efficiency (WUE) is the target of crop yield improvement under drought stress. Field Crops Res. 2009, 112, 119–123. [Google Scholar] [CrossRef]
  73. Badaluddin, N.A.; Lion, M.; Razali, S.M.; Khalit, S.I. Bibliometric Analysis of Global Trends on Soil Moisture Assessment Using the Remote Sensing Research Study from 2000 to 2020. Water Air Soil Pollut. 2021, 232, 271. [Google Scholar] [CrossRef]
Figure 1. Annual trend of global soil moisture publications from 2000 to 2022.
Atmosphere 14 01494 g001
Figure 2. Average citations per article and TCPP changes in soil moisture from 2000 to 2022.
Atmosphere 14 01494 g002
Figure 3. Major national cooperation networks in soil moisture.
Atmosphere 14 01494 g003
Figure 4. Number and proportion of articles published by the top 10 countries, 2000–2022.
Atmosphere 14 01494 g004
Figure 5. Number and proportion of articles published by the top 10 institutions.
Atmosphere 14 01494 g005
Figure 6. Cooperation network of main institutions in soil moisture.
Atmosphere 14 01494 g006
Figure 7. Number of articles published annually by the top 10 institutions.
Atmosphere 14 01494 g007
Figure 8. Papers published in the top 10 journals in different times.
Atmosphere 14 01494 g008
Figure 9. Keyword co-occurrence network map.
Atmosphere 14 01494 g009
Table 1. Top 10 journals in soil moisture.
RankSourcesTATCIFQuartileH-Index
1Journal of Hydrology155856,9986.4Q1104
2Remote Sensing137018,2225.0Q156
3Water Resources Research113356,1645.4Q1112
4Science of the Total Environment89917,2519.8Q157
5Hydrology and Earth System Sciences88033,5006.3Q187
6Agricultural Water Management87821,8356.7Q167
7Hydrological Processes78422,1743.2Q269
8Journal of Geophysical Research—Atmospheres77640,4754.4Q191
9Journal of Hydrometeorology75135,1973.8Q293
10Remote Sensing of the Environment73645,21813.5Q1103
Abbreviations: TA, total number of articles; TC, total number of citations; IF, impact factor for 2023; H-index, a measure that indicates that a journal’s H articles have each been cited at least H times.
Table 2. Top 20 keywords in soil moisture.
RankKeywordsFrequencyRankKeywordsFrequency
1Climate change205011Biomass671
2Evapotranspiration180112Soil organic matter572
3Drought165513Nitrogen513
4Remote sensing144614Water use efficiency490
5Precipitation99415Data assimilation478
6Soil temperature87216Yield449
7Soil respiration73117Vegetation432
8Temperature72518Nitrous oxide423
9Soil properties70719Hydrology419
10Irrigation68520Water stress410
Disclaimer/Publisher’s Note: The statements, opinions and data contained in all publications are solely those of the individual author(s) and contributor(s) and not of MDPI and/or the editor(s). MDPI and/or the editor(s) disclaim responsibility for any injury to people or property resulting from any ideas, methods, instructions or products referred to in the content.

