Article

Inequalities in PM2.5 and SO2 Exposure Health Risks in Terms of Emissions in China, 2013–2017

1
School of Resource and Environmental Sciences, Wuhan University, Wuhan 430079, China
2
School of Environmental Studies, China University of Geosciences, Wuhan 430074, China
3
Institute of Environmental Management and Policy, Zhongnan University of Economics and Law, Wuhan 430073, China
4
Hubei Key Laboratory of Petroleum Geochemistry and Environment, Wuhan 430100, China
5
College of Resources and Environment, Yangtze University, Wuhan 430100, China
*
Authors to whom correspondence should be addressed.
Atmosphere 2022, 13(9), 1422; https://doi.org/10.3390/atmos13091422
Submission received: 18 July 2022 / Revised: 30 August 2022 / Accepted: 31 August 2022 / Published: 2 September 2022
(This article belongs to the Special Issue Air Pollution, Air Quality and Human Health)

Abstract

:
Exploring the health risks of diseases attributed to PM2.5 and SO2 exposure and analyzing the differences in their distribution over emissions can provide useful insights for decision-makers to reduce premature mortality due to PM2.5 and SO2 exposure. This study used exposure-response functions, health risk inequality curve (HRICU, based on Lorenz curve), and the health risk inequality coefficient (HRICO, based on Gini coefficient) to estimate population health risks of PM2.5 and SO2 exposure in China from 2013 to 2017 based on a full-coverage, high-precision PM2.5 and SO2 concentration and emission dataset. The inequality in the distribution of premature mortality was explored in terms of pollutant emissions. The results showed that (1) premature mortalities from cardiovascular disease (CVD) and respiratory disease (RD) due to PM2.5 and SO2 exposure decreased by 21% and 54%, respectively, from 2013 to 2017. (2) At a national scale, the HRICO value for the distribution of PM2.5 and SO2 health risks on emissions were lower than 0.10 and 0.20, respectively. (3) More than 20% of provinces had HRICO values above 0.1 for PM2.5 or SO2. The provinces near the national borders generally had higher HRICO for PM2.5, while the province with the most severe inequity in the distribution of SO2 health risks on emissions appeared in Xinjiang Uygur Autonomous Region, Ningxia Hui Autonomous Region, and Hainan Province.

1. Introduction

Several advances have been made on environmental justice issues in China [1,2], with inequitable health risks due to air pollutants being a topic of considerable interest for research in recent years. Inequalities in exposure to air pollutants can be influenced by socioeconomic status, population subgroups (age, gender, and education level), and the distribution of public resources [3,4,5]. For example, it has been suggested that people with different economic statuses are exposed to different levels of air pollution, with people of low socioeconomic status bearing the worst consequences [6,7,8]. In addition, owing to differences in population health, concentration of pollutants in the environment etc., exposure inequalities can arise between different population subgroups, even within the same city [9]. Son et al. [10] noted that PM2.5 poses a higher risk of death for older adults. It has also been shown that differences in air pollutant concentrations contribute to exposure inequalities [11]. However, studies on the health disparities in terms of pollutant emissions are currently lacking. Previous studies have primarily measured inequality using the Atkinson index [9], the Theil index [12], and the Gini coefficient [3]. However, the Atkinson index considers people’s aversion to an inequality event, and this subjective parameter affects the value of the inequality coefficient; comparatively, the Theil index focuses more on the magnitude of inequality within and between groups. These applicability difference of these methods have led, especially in recent years, more and more scholars have begun to turn their attention to the application of the Gini coefficient to environmental inequality [13,14].
The Gini coefficient, which is a ratio between 0 and 1, was originally proposed by the Italian economist Gini in 1912 to measure the income inequality according to the Lorenz curve [15]. By altering how the index is plotted on the X and Y axes, the Gini coefficient has been extended to measure inequality in various other areas of interest, including energy consumption, and pollutant emissions [16,17]. Traditionally, the data for Gini coefficient calculations are usually sorted by Y/X; however, the expansion of data dimensions and the complexity of research needs have led to some methodological changes. For example, Soares et al. [17] used the CO2 emissions Gini coefficient to analyze inequalities in the distribution of environmental efficiency across 60 major countries by plotting GDP against CO2 emissions, ordered by research expenditure, and Liu et al. [3] used the environmental Lorenz curve to calculate a Gini coefficient to describe the inequality in national and interprovincial health outcomes by plotting premature deaths against population, ordered by GDP per capita. The Gini coefficient can thus be calculated in many different ways, including the direct calculation method, the fitted curve method and the grouping calculation method. The direct calculation method does not depend on the Lorenz curve, the fitted curve method may produce errors during the fitting process and the grouping calculation method is suitable for scattered data and is comparatively easy to calculate. Considering the simplicity and accuracy of calculating the Gini coefficient, in this study, we chose the previous extension method based on the traditional Gini coefficient to investigate the equity of the distribution of health risks in terms of emissions.
Climate change and greenhouse gas emissions are a topic of considerable interest for current research [18,19]. In China, coal combustion contributes a significant amount of greenhouse gas emissions [20,21]. At the same time, the process of burning coal produces a large number of air pollutants that can affect human health, among which PM2.5 and SO2 become important targets for prevention and control [22,23]. Data from the 2014 China Statistical Yearbook indicate that coal accounted for 66.0% of China’s total energy consumption in 2013. During the same year, the “Air Pollution Prevention and Control Action Plan” was implemented, and the proportion of coal consumption in China decreased, with correlated reductions in PM2.5 and SO2 pollution [24]. Studies have shown that long-term exposure to high concentrations of PM2.5 and SO2 can induce various diseases [25]. A study by Liang et al. [26] found an increased risk of cardiovascular disease (CVD) morbidity and mortality in association with chronic PM2.5 exposure in humans. According to world health statistics, CVD and respiratory diseases (RD) are the leading causes of death and disability worldwide [27].
Focusing on these risks, we aimed to explore the number of premature deaths caused by PM2.5 and SO2 and the inequitable distribution of premature deaths in terms of emissions. Specifically, we quantified the premature deaths due to CVD and RD that were attributable to PM2.5 and SO2 exposure at national and provincial scales using exposure-response functions based on national population data, PM2.5 and SO2 concentrations, and emission data. We applied the health risk inequality curve (HRICU, based on the Lorenz curve) and health risk inequality coefficient (HRICO, based on the Gini coefficient) to measure the inequity in the distribution of premature deaths in terms of pollutant emissions. Our specific aims were to identify: (1) the spatial and temporal evolution of health risks associated with PM2.5 and SO2 exposure in China from 2013 to 2017; (2) how the health risks associated with PM2.5 and SO2 exposure are distributed among populations with different emission levels. (3) The possible reasons for the inequitable distribution of premature mortality in typical regions of China in terms of per capita PM2.5 and SO2 emissions.

2. Data and Methods

2.1. Data Sources and Pre-Processing

2.1.1. Data Sources

Annual average PM2.5 concentration data with a spatial resolution of 0.01° × 0.01° for the period 2013–2017 were obtained from China Regional Estimates (V4.CH.03) (https://sites.wustl.edu/acag/datasets/surface-pm2-5/, data range 2000–2018, accessed on 20 December 2021). Annual average SO2 concentration data for the same period were obtained from the Chinese ground-level air pollutant dataset (https://doi.org/10.5281/zenodo.4641538, data range 2013–2020, accessed on 21 December 2021) with a spatial resolution of 0.1° × 0.1°. These data have been widely used for assessments of spatial and temporal patterns, drivers, and exposure risk [28,29,30].
Annual PM2.5 and SO2 emissions data of 0.25° × 0.25° from 2013 to 2017 were obtained from the multi-scale emission inventory reanalysis and data sharing platform developed by the MEIC team at Tsinghua University (http://meicmodel.org/?page_id=541&lang=en, data range 2008–2017, accessed on 23 December 2021). These data are mainly used in air pollutant simulation studies and for the spatial and temporal characterization of pollutant emissions [31]. The 1 km × 1 km population dataset for the period 2013–2017 was obtained from the Worldpop project at the University of South Hampton (https://www.worldpop.org/, data range 2000–2020, accessed on 23 December 2020). This dataset has been widely used in spatial population studies and population density model optimization experiments [32,33].
Owing to a lack of data for Hong Kong, Macao, and Taiwan Provinces, these regions were excluded from our analysis to ensure the accuracy of the results. As the monitoring of atmospheric SO2 and PM2.5 China started in 2013, and given the lack of emission data prior to this, we specifically focused on PM2.5 and SO2 exposure during the implementation period of the “Air Pollution Prevention and Control Action Plan” (2013–2017).

2.1.2. Data Pre-Processing

To calculate the health risks due to PM2.5 and SO2 exposure in China, we first used the conversion tool in ARC GIS10.6 software [34] to spatially match and convert PM2.5 (SO2 concentrations) and population data to the same scale for subsequent analyses. The raster calculator tool was then used to calculate the number of premature deaths due to PM2.5 or SO2 exposure in each raster based on the exposure-response function. The spatial linkage tool was then used to link the population data, emissions data, premature deaths, and provinces in terms of the spatial location. After doing so, HRICO was then calculated as a measure of equitability considering the distribution of premature deaths in terms of emissions.

2.2. Methods

2.2.1. Inequality Analysis

We estimated the values of both emissions and environmental inequality. We modified the traditional Lorenz curve to describe the inequitable distribution of premature mortality across populations with different pollutant emissions, based on the study by Liu et al. [3] on the distribution of premature mortality across populations with different income levels [3,28], and we defined it as the health risk inequality curve (HRICU).The HRICU arranges people from the lowest emission population to the highest emission population according to the emission level borne by people, and shows the distribution of corresponding disease mortality rates from the lowest emission population to the highest emission population. In contrast to the traditional Lorenz curve, from the results of Liu et al. [3], HRICU can be presented as concave or convex or concave-convex together. A concave HRICU plot (either wholly or partially) indicates that the high-emitting population has a relatively high premature mortality rate (the derivative of HRICU at this point) on this segment of the emission population (or the whole population or partially); and a convex HRICU plot (either wholly or partially) indicates that the high-emitting population has a relatively low premature mortality rate on this segment of the emission population (the whole population or partially) instead. Both concave and convex present as premature mortality is inequitably distributed over different emission populations (see Supplementary Materials file for details). We build on this concept in order to characterize the distribution of PM2.5 and SO2 attributable premature mortality. To do so, the population and excess premature mortality in each pixel were first ranked by PM2.5 and SO2 emissions per capita. The cumulative share of mortality was then plotted against the cumulative share of population, ranked by emissions per capita (see Figure S1). We also created HRICU at the provincial scale to assess the distribution of mortality within each province as a measure of provincial inequality.
In a traditional Lorenz curve, the Gini coefficient, as the measure of inequality, is calculated by dividing the area of A by 0.5 (equivalent to A + B in Figure S1a). The smaller the Gini coefficient, the smaller the area between the Lorenz curve and the ideal equality line. Thus, a lower Gini coefficient reflects greater equality. In this study, based on the calculation of the traditional Gini coefficient, we established the calculation of the health risk inequality coefficient (HRICO) to measure inequity in the distribution of premature mortality over different emission populations (see Supplementary Materials file for details). The HRICO was calculated as follows:
H R I C O j = 1 i = 1 n x j , i x j , i 1 y j , i + y j , i 1
where HRICOj is the HRICO of province j, n represents the number of participating rasters in province j; x j , i is the cumulative share of population in the i-th raster of province j; and y j , i is the cumulative share of health risk in the i-th raster of province j. The HRICO value for national health risk were calculated in the same way. By calculating HRICO values, we measure the distribution and inequality of premature mortality caused by PM2.5 and SO2 exposure in China on the low-emission and high-emission populations. Although limited by PM2.5 data, we were only able to consider inequalities in primary PM2.5 emissions, Chuai et al. [35] confirmed that PM2.5 emissions and concentrations are strongly correlated in both time and space.

2.2.2. Health Risk Evaluation

We used exposure-response functions to estimate the number of premature deaths due to PM2.5 and SO2 exposure (including CVD and RD). When PM2.5 and SO2 concentrations exceed the safe concentration limit X0, the relative risk index (RR) for diseases can be calculated based on the results of epidemiological surveys and the current concentration of pollutants in the atmosphere as follows.
R R = exp β X X 0
where X0 is the highest annual average concentration of PM2.5 or SO2 without health damage, X is the current annual average concentration of PM2.5 or SO2, and β is the health effect assessment parameter for PM2.5 or SO2. The number of premature deaths caused by CVD and RD associated with air pollution is denoted as ΔMort, calculated as follows:
Δ M o r t = y 0 × R R 1 R R × P o p
where y0 is the mortality rate of the calculation region, which obtained from the China Statistical Yearbook, and Pop is the total resident population in the calculated area.
As there are still no definitive studies confirming the magnitude of health effects resulting from PM2.5 and SO2 exposure, different maximum annual average concentrations without health damage (X0) have been applied previously [13,36,37,38,39]. Here, the PM2.5 concentrations without health damage was selected from the WHO recommended concentration limit for health risk calculation (5 μg/m3). As the WHO standard does not recommend a safe concentration limit for long-term exposure to SO2, the X0 for SO2 was selected as the lowest concentration (2.09 ppb) used in previous health risk studies [40]. The value of β was taken from the results of existing domestic and international studies as well as the epidemiological findings on air pollution that are widely used and applicable to China. The β for PM2.5 was selected from the summary of 57 research results conducted by Liu et al. [41] on 127 cities in China, corresponding to 0.0006280 (95% CI: 0.0003493~0.0009059) and 0.0007472 (95% CI: 0.0003892~0.0011039) for CVD and RD, respectively. For SO2, β was selected from the summary of health load caused by air pollutant concentration in 338 cities in China. [42], corresponding to 0.0006976 (95% CI: 0.0004988~0.0007968) and 0.0011929 (95% CI. 0.0008960~0.0015373) for CVD and RD, respectively.

3. Results

3.1. Health Risk Assessment

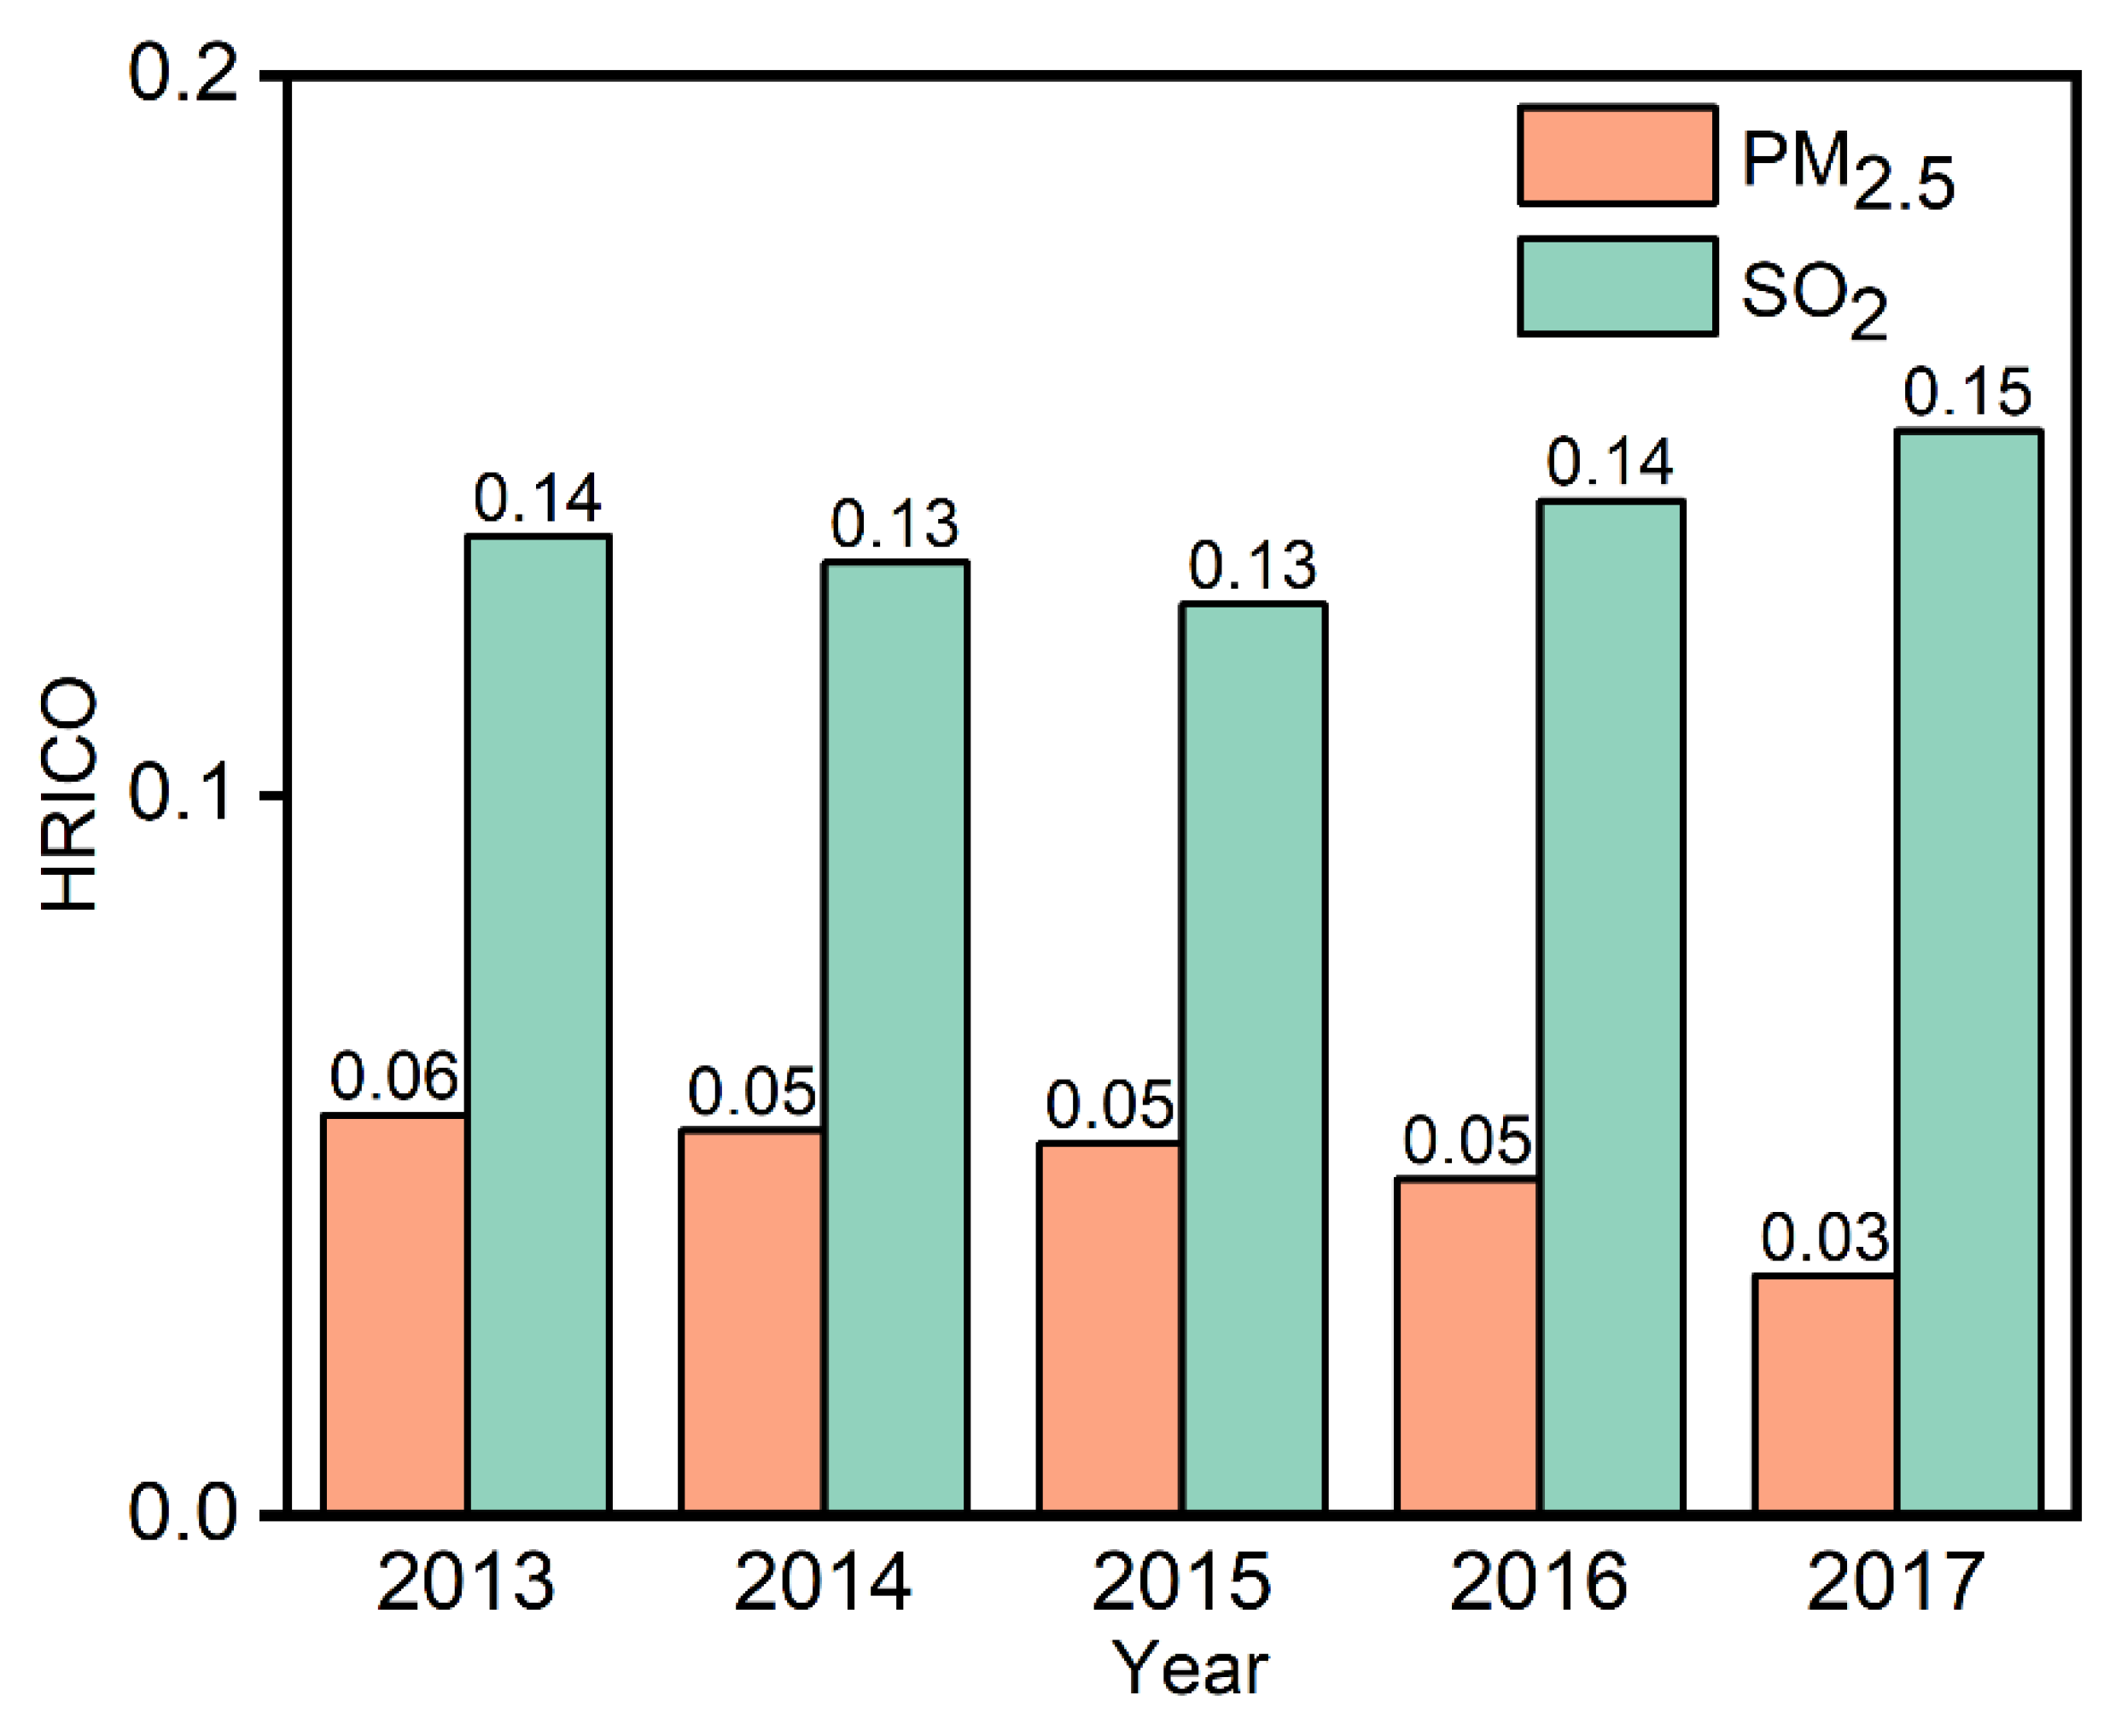
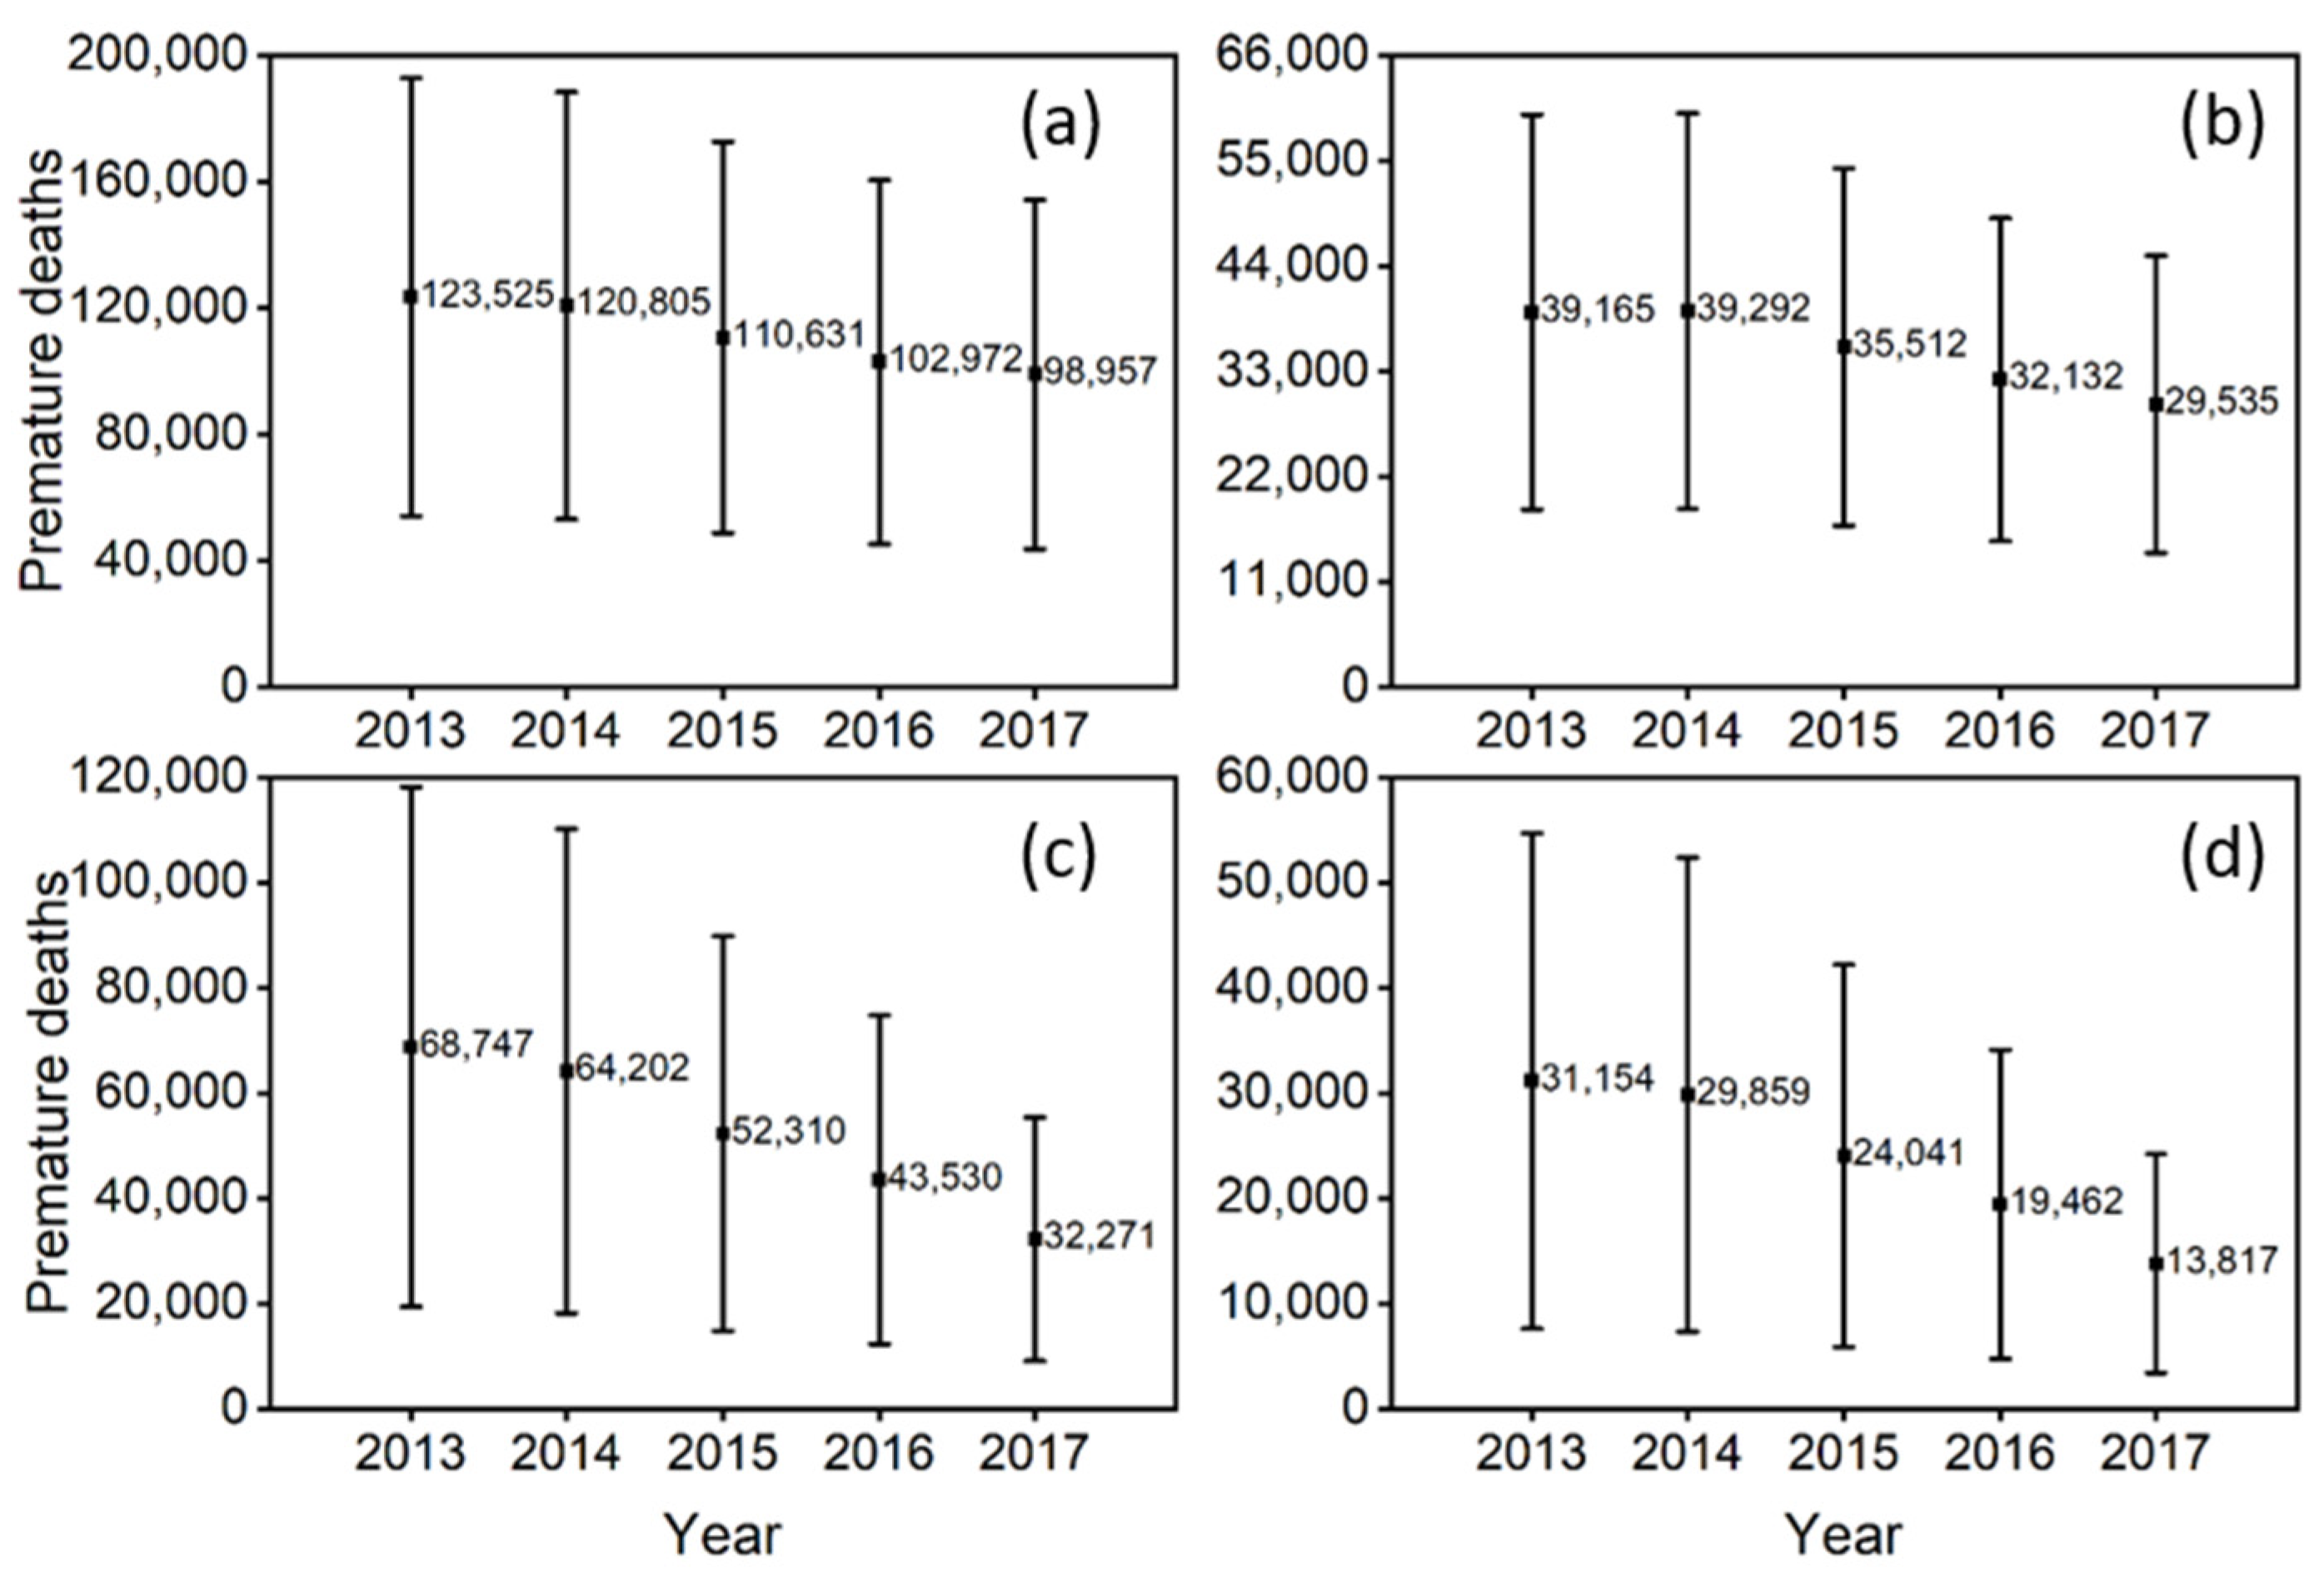
3.1.1. Characteristics of the Health Risk Variation with Time in National Scale

Between 2013 and 2017, the number of premature deaths caused by CVD and RD due to PM2.5 and SO2 exposure in China decreased by 21% and 54%, respectively (Figure 1). The number of premature deaths caused by CVD due to PM2.5 and SO2 exposure decreased from 123,525 and 68,747 in 2013 to 98,957 and 32,271 in 2017, corresponding reductions of 20% and 53%, respectively. For the same years, the number of premature deaths caused by RD due to PM2.5 and SO2 exposure decreased from 39,165 and 31,154 to 29,535 and 13,817 corresponding to decreases of 25% and 56%, respectively. Notably, premature deaths associated with PM2.5 declined relatively rapidly between 2014 and 2016. During these five years, the number of premature deaths associated with SO2 declined sharply, with the number of reductions in both CVD premature deaths and RD premature deaths more than halving. This suggests that SO2 pollution control in China improved during the years considered.

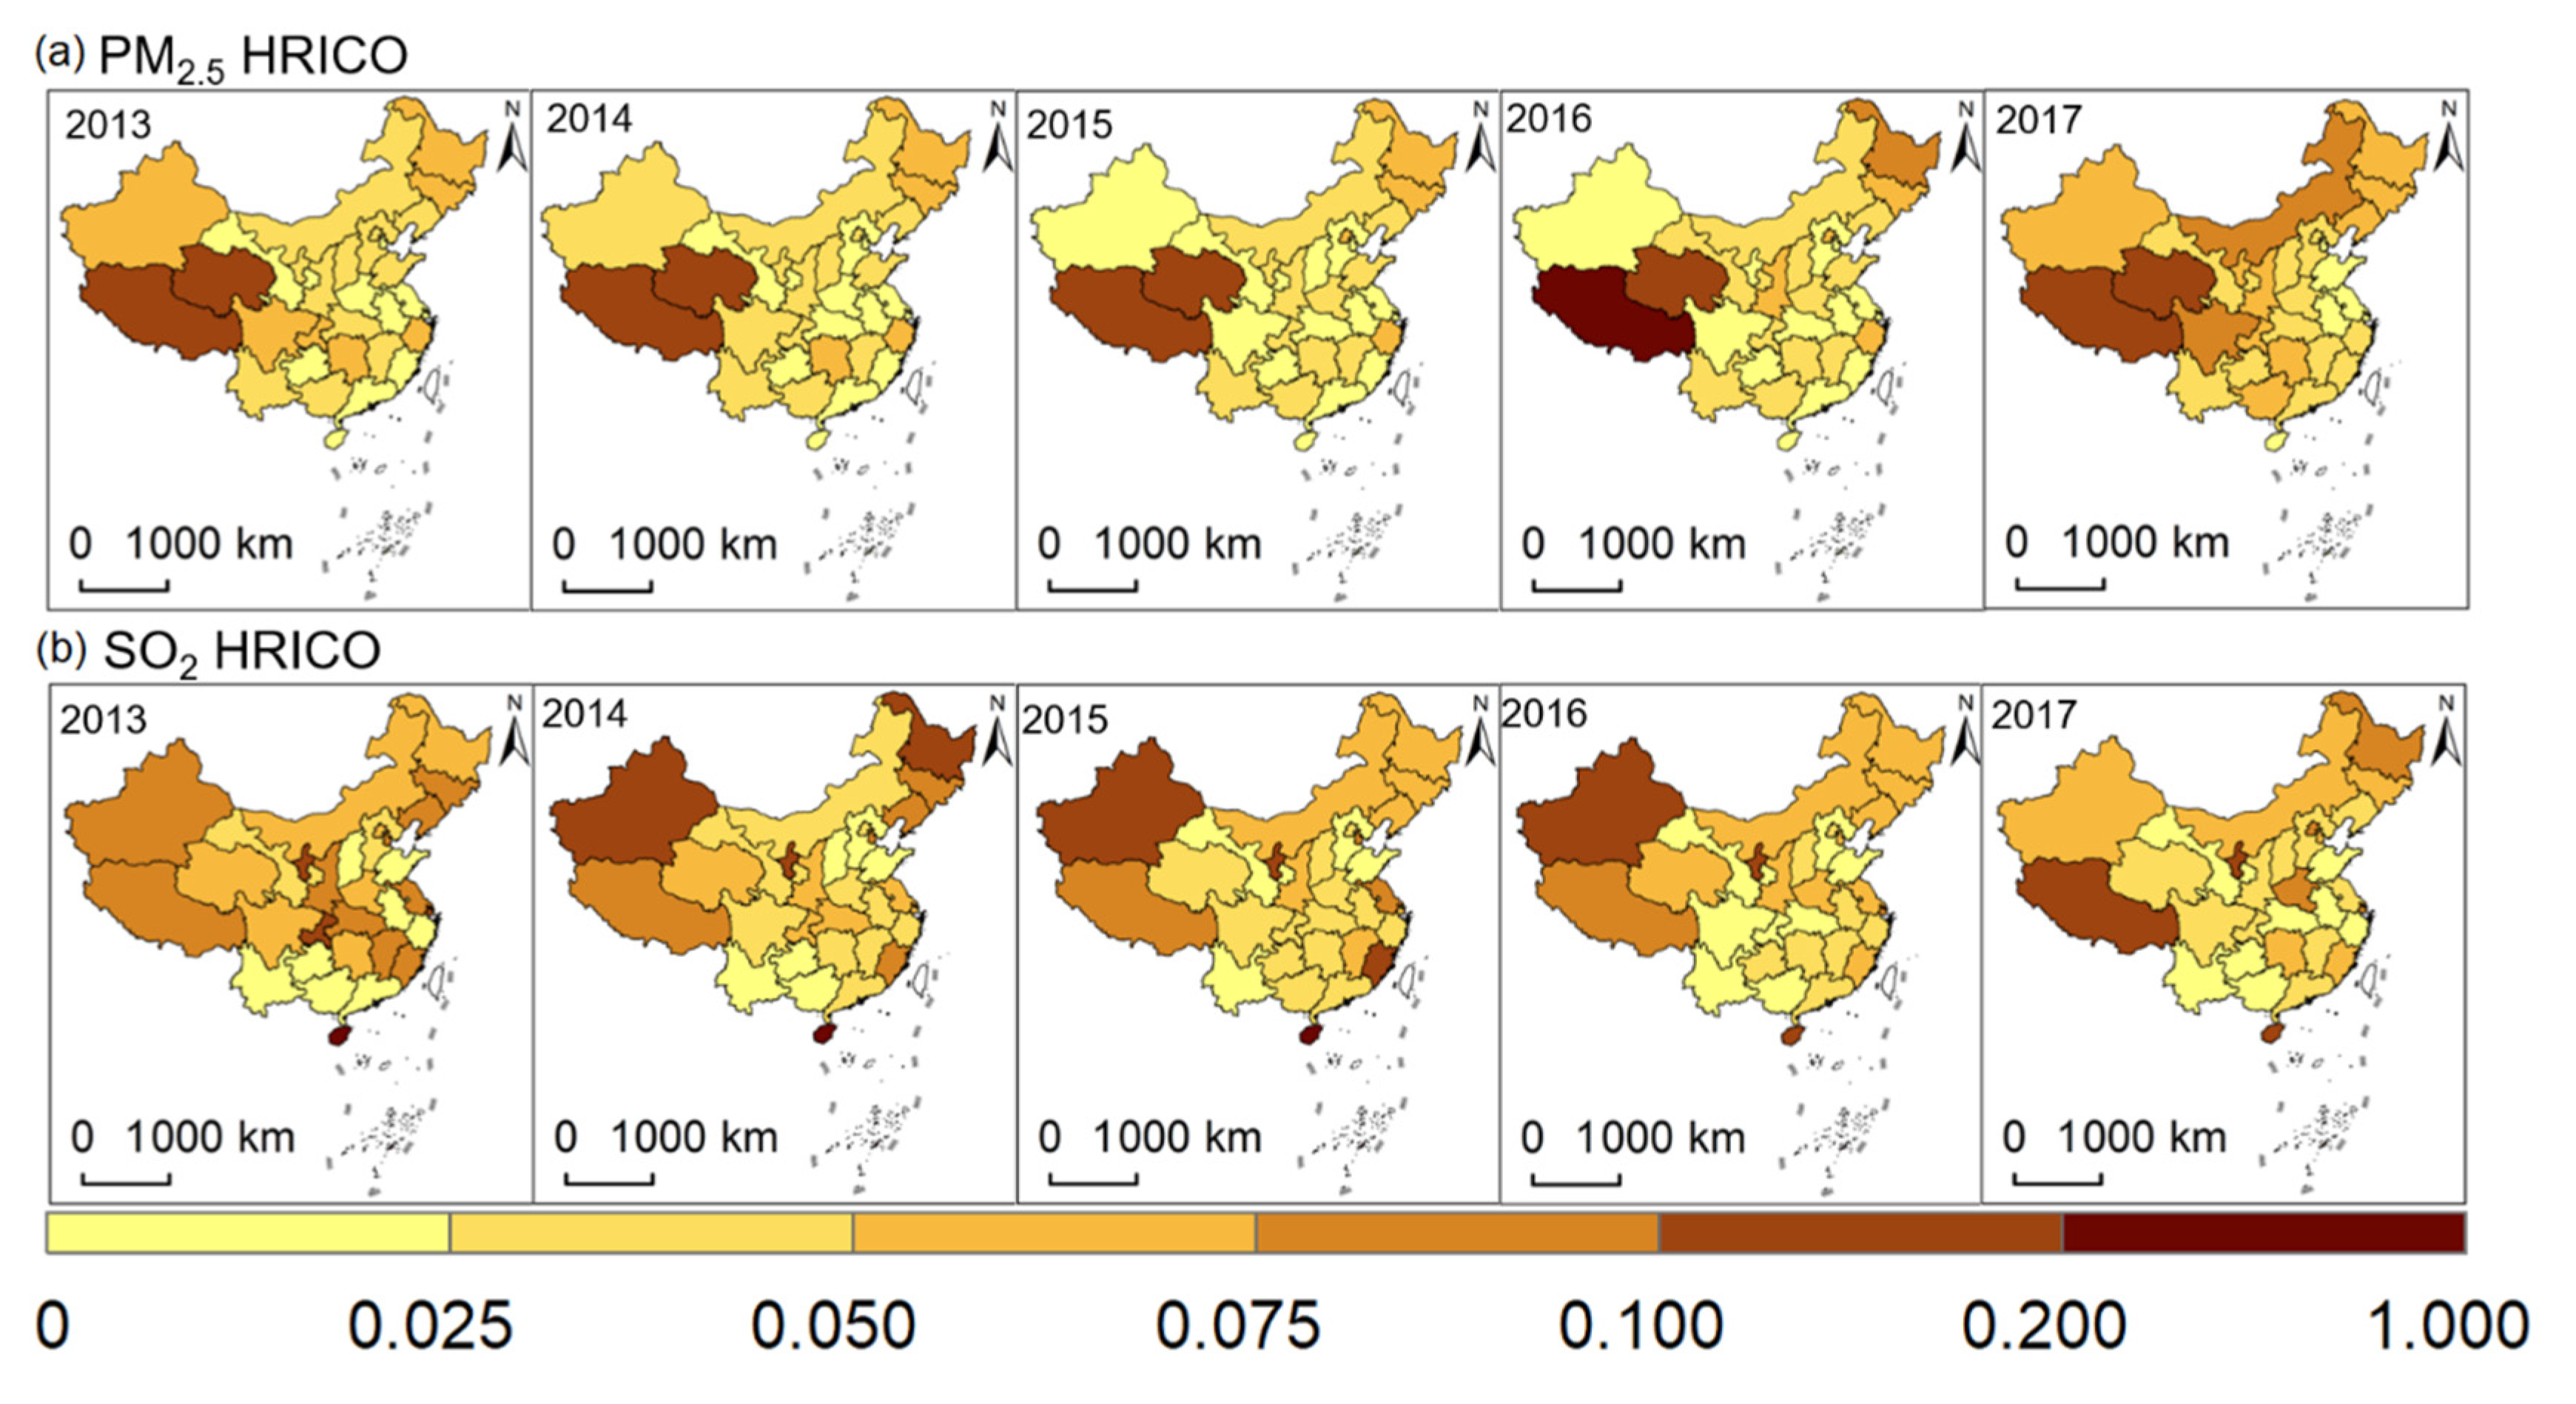
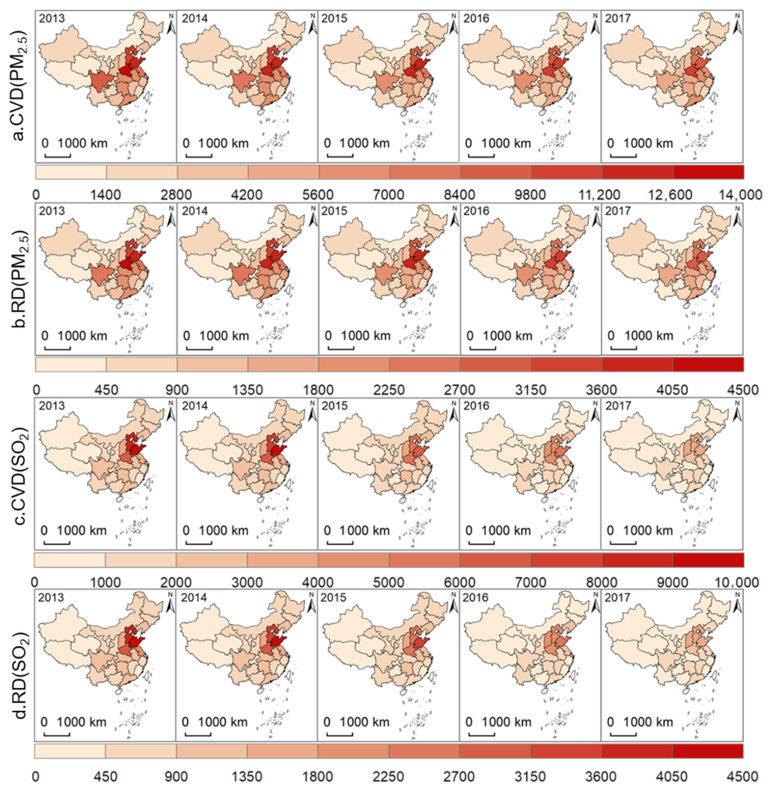
3.1.2. Characteristics of Temporal and Spatial Distribution of Health Risk in Provincial Scale

The distribution of premature deaths caused by CVD and RD attributed to PM2.5 in China showed an obvious spatial aggregation during the study period in Henan, Hebei, and Shandong provinces (Figure 2a,b). The corresponding five-year average number of premature deaths due to CVD and RD in these provinces were 11,721 and 3693, 9360 and 2950, 10,808 and 3408, respectively. Tibet had the lowest number of premature deaths caused by CVD and RD due to PM2.5 exposure. Despite a decline between 2013 and 2017, Henan Province still had the highest number of premature deaths in China. From 2013 to 2017, the premature deaths due to CVD caused by PM2.5 exposure in Henan province were 13,984, 12,149, 11,708, 10,716, and 10,048, respectively, and those due to RD caused by PM2.5 were 4428, 3948, 3754, 3341, and 2997, respectively.
The distribution of premature deaths due to CVD and RD attributed to SO2 exposure also showed significant temporal variability and spatial aggregation (Figure 2c,d), being the highest in Shandong Province, followed by Hebei, Henan, and Shanxi provinces between 2013 and 2014. After 2014, the number of premature deaths due to CVD and RD caused by SO2 exposure declined in Shandong and Hebei provinces. From 2013 to 2017, the number of premature deaths due to CVD and RD caused by SO2 exposure in Shandong province decreased by more than 63%, while those in Hebei province decreased by more than 60% from 2013 to 2017. In contrast, Shandong province had 9833, 9316, 6939, 5384 and 3592 premature deaths due to CVD caused by SO2 exposure from 2013 to 2017, which is one of the provinces with the largest number of premature deaths due to CVD and RD caused by SO2 exposure in China. Although the number of premature deaths due to CVD and RD caused by SO2 exposure in Shandong Province showed an overall downward trend, the number was still high in 2017.

3.2. Inequality Analysis

From 2013 to 2017, HRICO value of the distribution of premature deaths due to PM2.5 exposure on emissions per capita was less than 0.10 (Figure 3), indicating that the distribution of premature deaths due to PM2.5 exposure on emissions per capita in China was close to the absolute equity state. Notably, there was a significant downward trend in HRICO during the study period, especially between 2015 and 2017. This indicates an overall improvement in the fairness of the distribution of premature deaths due to PM2.5 exposure on emissions per capita in China. From 2013 to 2017, HRICO value of the distribution of premature death due to SO2 exposure on emissions per capita was less than 0.20, but all are well above the HRICO value of PM2.5, indicating that the equity of the distribution of premature deaths due to SO2 exposure on emissions per capita was much lower than that for PM2.5. Different from PM2.5, the change of the HRICO value of SO2 does not show a single upward or downward trend. In 2017, the HRICO reached the maximum of 0.15, while in 2015, it reached the minimum of 0.13, showing a fluctuating trend of “decline, rise”. The HRICU of PM2.5 and SO2 from 2013 to 2017 are shown in Figure S2, and both show a concave pattern in general, indicating that high premature mortality caused by PM2.5 and SO2 exposure is usually found in the population with high emissions, creating an inequitable distribution of premature mortality. However, in the population with high PM2.5 emissions, a convex pattern of HRICU may be observed, suggesting that in this population, high premature mortality due to PM2.5 exposure may occur in the population with relatively low emissions.
Based on Figure 4a and Table S1, the HRICO values of PM2.5 were generally higher in the national border regions relative to those in inland provinces. In 2013, the Tibet Autonomous Region and Qinghai Province experienced much higher inequity in the distribution of premature deaths due to PM2.5 exposure in terms of emissions. In 2014 and 2015, although HRICO values decreased in most regions of China, inequity was still observed in many provinces. By 2016 and 2017, HRICO values increased significantly in some provinces, notably in the Tibet Autonomous Region, exceeding 0.2 in 2016. During 2013–2017, the HRICO values for PM2.5 remained below 0.10 during the study period in all provinces other than the Tibet Autonomous Region and Qinghai Province. This clearly indicates that in these five years, the other provinces had a relatively more even distribution of premature deaths due to PM2.5 exposure in terms of emissions.
Figure 4b and Table S2 show the spatial distribution of the HRICO values of SO2 in China between 2013 and 2017. In this case, most regions had values less than 0.1, indicating almost absolute equity. In 2013, the Ningxia Hui Autonomous Region, Chongqing Municipality and Hainan Province had values above 0.1, with Hainan Province showing the greatest level of inequality. In 2014, the Xinjiang Uygur Autonomous Region, Heilongjiang Province, Ningxia Hui Autonomous Region, and Hainan Province had values above 0.1. By 2015, relatively high HRICO values persisted in the Ningxia Hui Autonomous Region, Fujian Province and most notably, in the Xinjiang Uyghur Autonomous Region (0.20) and Hainan Province (0.27). In 2016, only the Xinjiang Uyghur Autonomous Region, Hainan Province and Ningxia Hui Autonomous Region had HRICO values above 0.1, with the largest HRICO value in Ningxia Hui Autonomous Region (0.17). Between 2014 and 2016, the HRICO values for the Xinjiang Uyghur Autonomous Region exceeded 0.1, but in 2017, most provinces in China experienced a significant decrease in HRCIO values.

4. Discussion

4.1. Health Risk Analysis

Compared with that in 2013, the number of premature deaths due to CVD and RD attributed to PM2.5 exposure in China decreased significantly by 2017. This was likely mainly because of the implementation of the “Air Pollution Prevention and Control Action Plan” (2013–2017), which significantly reduced the use of solid fuels in Chinese households [43] and rapidly reduced the average annual concentration of PM2.5 nationally [24]. Consequently, there was a rapid reduction in the total number of premature deaths attributed to PM2.5 exposure in China [37,44]. Although the regulation of PM2.5 pollution in China has achieved some positive results, it is undeniable that health risks caused by PM2.5 pollution still exist [42]. Until 2017, the health risk situation caused by PM2.5 in Henan, Hebei, and Shandong provinces remained severe. Lu et al. [37] pointed out that the highest number of premature deaths caused by PM2.5 exposure in Henan, Hebei, and Shandong provinces was mainly due to the high concentration of PM2.5, not the population. From 2013 to 2014, Shandong, Hebei, Henan, and Shanxi provinces had the highest number of premature deaths due to CVD and RD attributed to SO2 exposure, which is closely related to their dense population [45] and excessive atmospheric SO2 concentrations [46]. Until 2017, the number of CVD- and RD-related premature deaths due to SO2 exposure had decreased to below 4000 and 1800, respectively, further suggesting the success of the implementation of the “Air Pollution Prevention and Control Action Plan” had achieved remarkable results in controlling SO2 concentration [42]. Zeng et al. [47] pointed out that even though the effectiveness of renewable energy policy is greater than that of emission reduction policies for controlling SO2 pollutants, in major coal consuming provinces in China (Shandong, Henan, and Shanxi provinces), controlling SO2 emissions remains a significant challenge [48].

4.2. Analysis of Inequality

The increasingly equitable distribution of premature deaths due to PM2.5 exposure across Chinese provinces in terms of emissions may be related to the mitigation of air pollution, the economic development of provinces, population migration and mobility, and the improvement of health and education [49], and the study of Liu et al. [3] had also confirmed this. Previous studies have shown that China’s sewage inequality is diminishing [50] and the sewage gap between cities in the Yangtze River Delta is narrowing. Importantly, a reduction in the pollutant emissions gap leads to the diminution of the inequality of health risks caused by pollutants [35,51,52]. From 2013 to 2017, the inequity in the distribution of premature deaths due to PM2.5 exposure in terms of emissions was generally higher in border provinces than that in inland provinces. This difference may be mainly caused by the interference of transboundary pollution due to atmospheric transmission of PM2.5 [53] alongside the distribution of local industrial pollution [54]. Similar conclusions were drawn by Chuai et al. [35]. PM2.5 emissions are an important factor contributing to health risks of PM2.5 exposure [55]. Guan et al. [56] point out that local pollutant emissions only form part of the air pollution problem, with regional pollutant concentrations affected by emissions from other nearby areas. Furthermore, the emission of precursor pollutants is an important factor affecting atmospheric PM2.5 concentrations [57]. In their study in Australia, Cooper et al. [58] also pointed out that areas with a poor social economy and a high proportion of ethnic minorities are likely exposed to higher PM2.5 concentrations. In China, as border or near-border provinces with a high proportion of ethnic minorities, the Tibet and Qinghai provinces may be exposed to higher atmospheric PM2.5 concentrations originating from exogenous sources. Therefore, there may be serious inequity in the distribution of premature deaths due to PM2.5 exposure in terms of emissions in these regions.
Premature deaths due to SO2 exposure in China are unevenly distributed in terms of emissions, with high HRICO values in the Xinjiang Uyghur Autonomous Region, Hainan Province, and Ningxia Hui Autonomous Region. Qian et al. [59] noted that the developed provinces in China bear a larger share of the responsibility for SO2 emissions. The outflow of SO2 emissions from developed provinces is greater than the inflow, and they are mainly outsourced to neighboring developing provinces with energy-intensive industries [35,59]. Thus, developing provinces, such as the Xinjiang Uyghur Autonomous Region, which are dominated by fossil energy industries, are responsible for excess SO2 emissions, as confirmed by Liang et al. [60] and Yang et al. [61]. In addition, as a coastal city, Hainan Province consumes a disproportionately high share of coal, although coal consumption has decreased overall [62], which may be one of the reasons for the high HRICO values and the decreasing HRICO trend in Hainan. Moreover, given its location, Hainan Province may be more prone to the migration of air pollutants compared with other provinces.

4.3. Uncertainties

The main limitation of this study derives from the spatial matching between population data, PM2.5 and SO2 concentrations, and emission data. Specifically, minor statistical biases may occur when matching population data with a spatial resolution of 1 km to 0.25° × 0.25°. The selection of pollutant exposure response coefficients may also be biased because of the complexity of clinical data acquisition [41,63] and the difficulty of verifying the number of deaths calculated by the coefficient with the actual number of deaths. In addition, as there are currently no definitive studies identifying a reasonable (unbiased) relationship between emissions and premature mortality, our results can only be considered to represent the relative magnitude of the distribution of premature deaths over emissions at different spaces or times.

5. Conclusions

Based on the exposure-response function, HRICU, and HRICO, we analyzed the spatial and temporal differences in health risks attributed to PM2.5 and SO2 exposure at national and provincial scales in China. We also evaluated the inequity in the distribution of premature mortality due to PM2.5 and SO2 exposure across the country and provinces in terms of emissions. Our results show that the total number of premature deaths due to RD and CVD attributed to PM2.5 and SO2 decreased significantly from 2013 to 2017. These premature deaths were mainly concentrated in Henan, Hebei, and Shandong provinces, and all showed significant temporal variations and spatial aggregation. From 2013 to 2017, the overall HRICO values for PM2.5 decreased to 0.03, compared with a slight increase for SO2 to 0.15. Provincial analysis showed that inequities in the distribution of premature deaths due to PM2.5 exposure in terms of emissions are mainly concentrated in the border provinces, while inequities for SO2 are mainly found in the Xinjiang Uyghur Autonomous Region, Ningxia Hui Autonomous Region, and Hainan Province. From 2013 to 2017, the range and degree of inequity in the distribution of premature deaths due to PM2.5 and SO2 exposure on emissions showed a decreasing trend at the provincial scale.

Supplementary Materials

The following supporting information can be downloaded at: https://www.mdpi.com/article/10.3390/atmos13091422/s1, Figure S1. Definition of HRICU and HRICO; Figure S2. National HRICU for PM2.5 and SO2 from 2013 to 2017; Table S1. The HRICO of PM2.5; Table S2. The HRICO of SO2. Reference [3] are cited in the supplementary materials.

Author Contributions

Conceptualization, L.Y.; Data curation, T.C.; Formal analysis, Z.Y. and Z.W.; Methodology, J.Z., S.H., X.N. and Q.W.; Resources, J.Z. and S.H.; Software, T.C., Z.Y. and C.H.; Writing—original draft, T.C.; Writing—review & editing, T.C. All authors have read and agreed to the published version of the manuscript.

Funding

This research received no external funding.

Institutional Review Board Statement

Not applicable.

Informed Consent Statement

Not applicable.

Data Availability Statement

Not applicable.

Conflicts of Interest

The authors declare no conflict of interest.

References

  1. Qi, H.; Wang, R.; Han, J.; Wei, G.; Wang, J.; Liu, J. Theoretical Model of Environmental Justice and Environmental Inequality in China’s Four Major Economic Zones. Sustainability 2019, 11, 5923. [Google Scholar] [CrossRef]
  2. Heffron, R.J.; McCauley, D.; Sovacool, B.K. Resolving Society’s Energy Trilemma through the Energy Justice Metric. Energy Policy 2015, 87, 168–176. [Google Scholar] [CrossRef]
  3. Liu, M.; Saari, R.K.; Zhou, G.; Li, J.; Han, L.; Liu, X. Recent Trends in Premature Mortality and Health Disparities Attributable to Ambient PM2.5 Exposure in China: 2005–2017. Environ. Pollut. 2021, 279, 116882. [Google Scholar] [CrossRef] [PubMed]
  4. Pun, V.C.; Kazemiparkouhi, F.; Manjourides, J.; Suh, H.H. Long-Term PM2.5 Exposure and Respiratory, Cancer, and Cardiovascular Mortality in Older US Adults. Am. J. Epidemiol. 2017, 186, 961–969. [Google Scholar] [CrossRef]
  5. Requia, W.J.; Adams, M.D.; Arain, A.; Papatheodorou, S.; Koutrakis, P.; Mahmoud, M. Global Association of Air Pollution and Cardiorespiratory Diseases: A Systematic Review, Meta-Analysis, and Investigation of Modifier Variables. Am. J. Public Health 2018, 108, S123–S130. [Google Scholar] [CrossRef]
  6. Bell, M.L.; Ebisu, K. Environmental Inequality in Exposures to Airborne Particulate Matter Components in the United States. Environ. Health Perspect. 2012, 120, 1699–1704. [Google Scholar] [CrossRef]
  7. Kazakos, V.; Taylor, J.; Luo, Z. Impact of COVID-19 Lockdown on NO2 and PM2.5 Exposure Inequalities in London, UK. Environ. Res. 2021, 198, 111236. [Google Scholar] [CrossRef]
  8. Kihal-Talantikite, W.; Legendre, P.; Le Nouveau, P.; Deguen, S. Premature Adult Death and Equity Impact of a Reduction of NO2, PM10, and PM2.5 Levels in Paris—A Health Impact Assessment Study Conducted at the Census Block Level. Int. J. Environ. Res. Public Health 2019, 16, 38. [Google Scholar] [CrossRef]
  9. Rosofsky, A.; Levy, J.I.; Zanobetti, A.; Janulewicz, P.; Fabian, M.P. Temporal Trends in Air Pollution Exposure Inequality in Massachusetts. Environ. Res. 2018, 161, 76–86. [Google Scholar] [CrossRef]
  10. Son, J.-Y.; Lane, K.J.; Miranda, M.L.; Bell, M.L. Health Disparities Attributable to Air Pollutant Exposure in North Carolina: Influence of Residential Environmental and Social Factors. Health Place 2020, 62, 102287. [Google Scholar] [CrossRef]
  11. Boulanger, G.; Bayeux, T.; Mandin, C.; Kirchner, S.; Vergriette, B.; Pernelet-Joly, V.; Kopp, P. Socio-Economic Costs of Indoor Air Pollution: A Tentative Estimation for Some Pollutants of Health Interest in France. Environ. Int. 2017, 104, 14–24. [Google Scholar] [CrossRef] [PubMed]
  12. Azimi, M.; Feng, F.; Zhou, C. Air Pollution Inequality and Health Inequality in China: An Empirical Study. Environ. Sci. Pollut. Res. 2019, 26, 11962–11974. [Google Scholar] [CrossRef]
  13. Yuan, Q.; McIntyre, N.; Wu, Y.; Liu, Y.; Liu, Y. Towards Greater Socio-Economic Equality in Allocation of Wastewater Discharge Permits in China Based on the Weighted Gini Coefficient. Resour. Conserv. Recycl. 2017, 127, 196–205. [Google Scholar] [CrossRef]
  14. Li, Y.; Zhong, R.; Wang, Z.; Yu, M.; Wu, Y.; Irfan, M.; Hao, Y. Would the Inequality of Environmental Quality Affect Labor Productivity and the Income Gap? Evidence from China. J. Environ. Plan. Manag. 2022, 1–34. [Google Scholar] [CrossRef]
  15. Bosi, S.; Seegmuller, T. Optimal Cycles and Social Inequality: What Do We Learn from the Gini Index? Res. Econ. 2006, 60, 35–46. [Google Scholar] [CrossRef]
  16. Duan, C.; Chen, B. Analysis of Global Energy Consumption Inequality by Using Lorenz Curve. Energy Procedia 2018, 152, 750–755. [Google Scholar] [CrossRef]
  17. Soares, T.C.; Fernandes, E.A.; Toyoshima, S.H. The CO2 Emission Gini Index and the Environmental Efficiency: An Analysis for 60 Leading World Economies. EconomiA 2018, 19, 266–277. [Google Scholar] [CrossRef]
  18. Zaręba, M.; Danek, T. Analysis of Air Pollution Migration during COVID-19 Lockdown in Krakow, Poland. Aerosol Air Qual. Res. 2022, 22, 210275. [Google Scholar] [CrossRef]
  19. Khan, S.; Dahu, B.M.; Scott, G.J. A Spatio-Temporal Study of Changes in Air Quality from Pre-COVID Era to Post-COVID Era in Chicago, USA. Aerosol Air Qual. Res. 2022, 22, 220053. [Google Scholar] [CrossRef]
  20. Nie, W.; Liu, C.; Zhang, H.; Wang, H.; Jin, H.; Yan, J.; Liu, Q. The Preparation of a Novel Hydrogel Based on Crosslinked Polymers for Suppressing Coal Dusts. J. Clean. Prod. 2020, 249, 119343. [Google Scholar]
  21. Wang, J. Life Cycle Assessment and Environmental Cost Accounting of Coal-Fired Power Generation in China. Energy Policy 2018, 115, 374–384. [Google Scholar] [CrossRef]
  22. Xu, B. Regional Differences of Pollution Emissions in China: Contributing Factors and Mitigation Strategies. J. Clean. Prod. 2016, 112, 1454–1463. [Google Scholar] [CrossRef]
  23. Xu, C. Pollution Haven or Halo? The Role of the Energy Transition in the Impact of FDI on SO2 Emissions. Sci. Total Environ. 2021, 763, 143002. [Google Scholar] [CrossRef] [PubMed]
  24. Feng, Y.; Ning, M.; Lei, Y.; Sun, Y.; Liu, W.; Wang, J. Defending Blue Sky in China: Effectiveness of the “Air Pollution Prevention and Control Action Plan” on Air Quality Improvements from 2013 to 2017. J. Environ. Manag. 2019, 252, 109603. [Google Scholar] [CrossRef] [PubMed]
  25. Chen, Y.; Zang, L.; Du, W.; Xu, D.; Shen, G.; Zhang, Q.; Zou, Q.; Chen, J.; Zhao, M.; Yao, D. Ambient Air Pollution of Particles and Gas Pollutants, and the Predicted Health Risks from Long-Term Exposure to PM2.5 in Zhejiang Province, China. Environ. Sci. Pollut. Res. 2018, 25, 23833–23844. [Google Scholar] [CrossRef] [PubMed]
  26. Liang, F.; Liu, F.; Huang, K.; Yang, X.; Li, J.; Xiao, Q.; Chen, J.; Liu, X.; Cao, J.; Shen, C.; et al. Long-Term Exposure to Fine Particulate Matter and Cardiovascular Disease in China. J. Am. Coll. Cardiol. 2020, 75, 707–717. [Google Scholar] [CrossRef]
  27. Roth, G.A.; Mensah, G.A.; Johnson, C.O.; Addolorato, G.; Ammirati, E.; Baddour, L.M.; Barengo, N.C.; Beaton, A.Z.; Benjamin, E.J.; Benziger, C.P.; et al. Global Burden of Cardiovascular Diseases and Risk Factors, 1990–2019. J. Am. Coll. Cardiol. 2020, 76, 2982–3021. [Google Scholar] [CrossRef]
  28. Hammer, M.S.; van Donkelaar, A.; Li, C.; Lyapustin, A.; Sayer, A.M.; Hsu, N.C.; Levy, R.C.; Garay, M.J.; Kalashnikova, O.V.; Kahn, R.A.; et al. Global Estimates and Long-Term Trends of Fine Particulate Matter Concentrations (1998–2018). Environ. Sci. Technol. 2020, 54, 7879–7890. [Google Scholar] [CrossRef]
  29. He, Y. Analysis on the Spatial and Temporal Pattern of PM2.5 and Its Influencing Factors in Shaanxi Province. Master’s Thesis, Northwest Normal University, Lanzhou, China, 2021. [Google Scholar]
  30. Weiguang, F.; Pingyu, Z.; Lianjun, T.; Chenggu, L.; Xin, L.; Jing, L.; Zuopeng, M. Green Development for Supporting Sustainability of Northeast China: Performance Quantification, Spatio-Temporal Dynamics and Implica- Tions. Chin. Geogr. Sci. 2022, 32, 13. [Google Scholar]
  31. Zheng, B.; Tong, D.; Li, M.; Liu, F.; Hong, C.; Geng, G.; Li, H.; Li, X.; Peng, L.; Qi, J.; et al. Trends in China’s Anthropogenic Emissions since 2010 as the Consequence of Clean Air Actions. Atmos. Chem. Phys. 2018, 18, 14095–14111. [Google Scholar] [CrossRef]
  32. Lloyd, C.T.; Chamberlain, H.; Kerr, D.; Yetman, G.; Pistolesi, L.; Stevens, F.R.; Gaughan, A.E.; Nieves, J.J.; Hornby, G.; MacManus, K.; et al. Global Spatio-Temporally Harmonised Datasets for Producing High-Resolution Gridded Population Distribution Datasets. Big Earth Data 2019, 3, 108–139. [Google Scholar] [CrossRef]
  33. Wang, Q.-Y.; Zheng, K.-D.; Han, X.-S.; He, F.; Zhao, X.; Fan, P.-F.; Zhang, L. Site-Specific and Seasonal Variation in Habitat Use of Eurasian Otters (Lutra lutra) in Western China: Implications for Conservation. Zool. Res. 2021, 42, 824–832. [Google Scholar] [CrossRef]
  34. Environmental Systems Research Institute (ESRI). ArcGISDesktop; Environmental Systems Research Institute (ESRI): Redlands, CA, USA, 2018. [Google Scholar]
  35. Chuai, X.; Lu, Y.; Xie, F.; Yang, F.; Zhao, R.; Pang, B. A New Approach to Evaluate Regional Inequity Determined by PM2.5 Emissions and Concentrations. J. Environ. Manag. 2021, 277, 111335. [Google Scholar] [CrossRef]
  36. Zhu, F.; Chen, L.; Qian, Z.; Liao, Y.; Zhang, Z.; McMillin, S.E.; Wang, X.; Lin, H. Acute Effects of Particulate Matter with Different Sizes on Respiratory Mortality in Shenzhen, China. Environ. Sci. Pollut. Res. 2021, 28, 37195–37203. [Google Scholar] [CrossRef]
  37. Lu, X.; Lin, C.; Li, W.; Chen, Y.; Huang, Y.; Fung, J.C.H.; Lau, A.K.H. Analysis of the Adverse Health Effects of PM2.5 from 2001 to 2017 in China and the Role of Urbanization in Aggravating the Health Burden. Sci. Total Environ. 2019, 652, 683–695. [Google Scholar] [CrossRef]
  38. Chen, L.; Shi, M.; Gao, S.; Li, S.; Mao, J.; Zhang, H.; Sun, Y.; Bai, Z.; Wang, Z. Assessment of Population Exposure to PM2.5 for Mortality in China and Its Public Health Benefit Based on BenMAP. Environ. Pollut. 2017, 221, 311–317. [Google Scholar] [CrossRef]
  39. Cai, J.; Peng, C.; Yu, S.; Pei, Y.; Liu, N.; Wu, Y.; Fu, Y.; Cheng, J. Association between PM2.5 Exposure and All-Cause, Non-Accidental, Accidental, Different Respiratory Diseases, Sex and Age Mortality in Shenzhen, China. Int. J. Environ. Res. Public Health 2019, 16, 401. [Google Scholar] [CrossRef]
  40. Kim, H.; Byun, G.; Choi, Y.; Kim, S.; Kim, S.-Y.; Lee, J.-T. Effects of Long-Term Exposure to Air Pollution on All-Cause Mortality and Cause-Specific Mortality in Seven Major Cities of South Korea: Korean National Health and Nutritional Examination Surveys with Mortality Follow-Up. Environ. Res. 2021, 192, 110290. [Google Scholar] [CrossRef]
  41. Lu, F.; Xu, D.; Cheng, Y.; Dong, S.; Guo, C.; Jiang, X.; Zheng, X. Systematic Review and Meta-Analysis of the Adverse Health Effects of Ambient PM2.5 and PM10 Pollution in the Chinese Population. Environ. Res. 2015, 136, 196–204. [Google Scholar] [CrossRef]
  42. Zhao, H.; Chen, K.; Liu, Z.; Zhang, Y.; Shao, T.; Zhang, H. Coordinated Control of PM2.5 and O3 Is Urgently Needed in China after Implementation of the “Air Pollution Prevention and Control Action Plan”. Chemosphere 2021, 270, 129441. [Google Scholar] [CrossRef]
  43. Zhao, B.; Zheng, H.; Wang, S.; Smith, K.R.; Lu, X.; Aunan, K.; Gu, Y.; Wang, Y.; Ding, D.; Xing, J.; et al. Change in Household Fuels Dominates the Decrease in PM2.5 Exposure and Premature Mortality in China in 2005–2015. Proc. Natl. Acad. Sci. USA 2018, 115, 12401–12406. [Google Scholar] [CrossRef] [PubMed]
  44. Xue, T.; Liu, J.; Zhang, Q.; Geng, G.; Zheng, Y.; Tong, D.; Liu, Z.; Guan, D.; Bo, Y.; Zhu, T.; et al. Rapid Improvement of PM2.5 Pollution and Associated Health Benefits in China during 2013–2017. Sci. China Earth Sci. 2019, 62, 1847–1856. [Google Scholar] [CrossRef]
  45. Liu, H.; Liu, S.; Xue, B.; Lv, Z.; Meng, Z.; Yang, X.; Xue, T.; Yu, Q.; He, K. Ground-Level Ozone Pollution and Its Health Impacts in China. Atmos. Environ. 2018, 173, 223–230. [Google Scholar] [CrossRef]
  46. Kuerban, M.; Waili, Y.; Fan, F.; Liu, Y.; Qin, W.; Dore, A.J.; Peng, J.; Xu, W.; Zhang, F. Spatio-Temporal Patterns of Air Pollution in China from 2015 to 2018 and Implications for Health Risks. Environ. Pollut. 2020, 258, 113659. [Google Scholar] [CrossRef]
  47. Zeng, J.; Liu, T.; Feiock, R.; Li, F. The Impacts of China’s Provincial Energy Policies on Major Air Pollutants: A Spatial Econometric Analysis. Energy Policy 2019, 132, 392–403. [Google Scholar] [CrossRef]
  48. Bai, X.; Tian, H.; Liu, X.; Wu, B.; Liu, S.; Hao, Y.; Luo, L.; Liu, W.; Zhao, S.; Lin, S.; et al. Spatial-Temporal Variation Characteristics of Air Pollution and Apportionment of Contributions by Different Sources in Shanxi Province of China. Atmos. Environ. 2021, 244, 117926. [Google Scholar] [CrossRef]
  49. Liu, Q.; Zhang, Z.; Shao, C.; Zhao, R.; Guan, Y.; Chen, C. Spatio-Temporal Variation and Driving Factors Analysis of PM2.5 Health Risks in Chinese Cities. Ecol. Indic. 2021, 129, 107937. [Google Scholar] [CrossRef]
  50. Cao, L.; Wu, Y. Inequality of Pollutant Discharge in an Urban Agglomeration and Nonurban Agglomeration—Evidence from a New Theil-DEA Model. Environ. Sci. Pollut. Res. 2022, 29, 21876–21890. [Google Scholar] [CrossRef]
  51. Zhang, L. Exploration and Analysis on the Proportionality of Green Development Capability in Yangtze River Delta Region Based on Geordie Coefficient Method. Environ. Sustain. Dev. 2021, 46, 102–108. [Google Scholar]
  52. Tessum, C.W.; Paolella, D.A.; Chambliss, S.E.; Apte, J.S.; Hill, J.D.; Marshall, J.D. PM2.5 Polluters Disproportionately and Systemically Affect People of Color in the United States. Sci. Adv. 2021, 7, eabf4491. [Google Scholar] [CrossRef]
  53. Chen, L.; Lin, J.; Martin, R.; Du, M.; Weng, H.; Kong, H.; Ni, R.; Meng, J.; Zhang, Y.; Zhang, L.; et al. Inequality in Historical Transboundary Anthropogenic PM2.5 Health Impacts. Sci. Bull. 2022, 67, 437–444. [Google Scholar] [CrossRef]
  54. Guo, S.; Zheng, S.; Hu, Y.; Hong, J.; Wu, X.; Tang, M. Embodied Energy Use in the Global Construction Industry. Appl. Energy 2019, 256, 113838. [Google Scholar] [CrossRef]
  55. Zhong, Q.; Ma, J.; Shen, G.; Shen, H.; Zhu, X.; Yun, X.; Meng, W.; Cheng, H.; Liu, J.; Li, B.; et al. Distinguishing Emission-Associated Ambient Air PM2.5 Concentrations and Meteorological Factor-Induced Fluctuations. Environ. Sci. Technol. 2018, 52, 10416–10425. [Google Scholar] [CrossRef] [Green Version]
  56. Guan, Y.; Huang, G.; Liu, L.; Zhai, M.; Xu, X. Measurement of Air-Pollution Inequality through a Three-Perspective Accounting Model. Sci. Total Environ. 2019, 696, 133937. [Google Scholar] [CrossRef] [PubMed]
  57. Yang, J.; Liu, P.; Song, H.; Miao, C.; Wang, F.; Xing, Y.; Wang, W.; Liu, X.; Zhao, M. Effects of Anthropogenic Emissions from Different Sectors on PM2.5 Concentrations in Chinese Cities. Int. J. Environ. Res. Public Health 2021, 18, 10869. [Google Scholar] [CrossRef]
  58. Cooper, N.; Green, D.; Knibbs, L.D. Inequalities in Exposure to the Air Pollutants PM2.5 and NO2 in Australia. Environ. Res. Lett. 2019, 14, 115005. [Google Scholar] [CrossRef]
  59. Qian, Y.; Behrens, P.; Tukker, A.; Rodrigues, J.F.D.; Li, P.; Scherer, L. Environmental Responsibility for Sulfur Dioxide Emissions and Associated Biodiversity Loss across Chinese Provinces. Environ. Pollut. 2019, 245, 898–908. [Google Scholar] [CrossRef]
  60. Liang, H.; Dong, L.; Luo, X.; Ren, J.; Zhang, N.; Gao, Z.; Dou, Y. Balancing Regional Industrial Development: Analysis on Regional Disparity of China’s Industrial Emissions and Policy Implications. J. Clean. Prod. 2016, 126, 223–235. [Google Scholar] [CrossRef]
  61. Yang, X.; Feng, K.; Su, B.; Zhang, W.; Huang, S. Environmental Efficiency and Equality Embodied in China’s Inter-Regional Trade. Sci. Total Environ. 2019, 672, 150–161. [Google Scholar] [CrossRef]
  62. Qin, Q.; Li, X.; Li, L.; Zhen, W.; Wei, Y.-M. Air Emissions Perspective on Energy Efficiency: An Empirical Analysis of China’s Coastal Areas. Appl. Energy 2017, 185, 604–614. [Google Scholar] [CrossRef]
  63. Yao, M.; Wu, G.; Zhao, X.; Zhang, J. Estimating Health Burden and Economic Loss Attributable to Short-Term Exposure to Multiple Air Pollutants in China. Environ. Res. 2020, 183, 109184. [Google Scholar] [CrossRef] [PubMed]
Figure 1. Trends in premature deaths attributable to PM2.5 and SO2 exposure (the vertical line is the 95% confidence interval). Premature deaths due to cardiovascular disease (CVD) and respiratory disease (RD) attributable to PM2.5 (a,b), and SO2 (c,d).
Atmosphere 13 01422 g001
Figure 2. Spatial distribution of health risks in China for the period 2013–2017. Premature deaths caused by CVD and RD attributed to PM2.5, (a,b) and SO2, (c,d).
Atmosphere 13 01422 g002
Figure 3. National HRICO values for the inequitable distribution of premature deaths due to PM2.5 and SO2 exposure on the emission per capita from 2013 to 2017.
Atmosphere 13 01422 g003
Figure 4. Spatial distribution of PM2.5 (a) and SO2 (b) HRICO from 2013 to 2017.
Atmosphere 13 01422 g004
Publisher’s Note: MDPI stays neutral with regard to jurisdictional claims in published maps and institutional affiliations.

