Article

Changes in Extreme Temperature Events and Their Contribution to Mean Temperature Changes during Historical and Future Periods over Mainland China

1
College of Geographical Science, Inner Mongolia Normal University, Hohhot 010022, China
2
Inner Mongolia Key Laboratory of Remote Sensing and Geographic Information Systems, Inner Mongolia Normal University, Hohhot 010022, China
*
Author to whom correspondence should be addressed.
Atmosphere 2022, 13(7), 1127; https://doi.org/10.3390/atmos13071127
Submission received: 5 June 2022 / Revised: 8 July 2022 / Accepted: 12 July 2022 / Published: 17 July 2022
(This article belongs to the Special Issue Meteorological Extremes in China)

Abstract

:
Extreme climate events undoubtedly have essential impacts on terrestrial ecosystems, but the spatiotemporal patterns of extreme climate events at regional scales are unclear. In this study, based on observations and 14 CMIP6 global climate models, we analyzed the spatiotemporal changes in extreme temperature events at the mainland China scale and different basin scales in historical and future periods, and their relative importance for the changes in mean temperature (Tmean). The results show that at the mainland China scale in the historical period, extreme cold days and extreme cold nights significantly decreased, while Tmean, extreme warm days, and extreme warm nights significantly increased. However, the rates of increase in Tmean and extreme temperature events in the Continental Basin, Southwest Basin and Yellow River Basin are higher than that at the mainland China scale. The multi-model ensemble is the best model for simulating extreme temperature events in mainland China. At the mainland China scale in the future, the trends of Tmean and extreme temperature events are slow, rapid, and extremely rapid under SSP1-2.6, SSP2-4.5 and SSP5-8.5, respectively. In addition, the changes in the Continental Basin and Songhua and Liaohe River Basin are larger than those at the mainland China scale. In the historical and future periods, the extreme temperature events that have a great influence on the Tmean at the Chinese mainland scale and different basin scales are all related to the minimum temperature. The findings from this study can provide references for formulating scientific and reasonable regional-scale climate change policies.

1. Introduction

The Intergovernmental Panel on Climate Change (IPCC) Assessment Report 6 (AR6) report points out that the impact of human activities has doubtless caused warming of the atmosphere, oceans, and land [1]. The global mean temperatures (Tmean) from 2001–2020 and 2011–2020 were 0.99 °C and 1.09 °C higher, respectively, than the Tmean between 1850–1900 [1]; among them, 1980–2012 in the Northern Hemisphere may have been the hottest 30 years in the past 1400 years [2]. With the continuous increase in temperature, the frequency, intensity, and duration of extreme temperature events are also increasing [3,4,5,6], and the destructive impact of extreme temperature events on human society and the natural environment is greater than the gradual change in temperature [7,8]. According to the statistics from the United Nations, 1991–2000, the number of people affected by climate anomalies was seven times the number of people affected by wars worldwide each year, the average number could reach 211 million, and the economic loss increased by nearly 10 times over the previous 40 years [9]. Therefore, extreme temperature events on different temporal and spatial scales have attracted widespread attention from scholars around the world.
The Expert Team on Climate Change Detection and Indicators (ETCCDI) can detect extreme climate events well by applying the extreme climate indices defined by the threshold method [10], which is widely used in the study of extreme climate events at different spatiotemporal scales [11,12]. More than 70% of the world’s land areas have shown a decreasing trend of extreme climate events related to the minimum temperature (Tmin), while extreme climate events related to the maximum temperature (Tmax) have shown a significant increasing trend in the past 50 years [13]. For example, Canada [14], eastern Europe [15], northwestern Africa [16], Serbia [15], Indonesia [17], and Australia [18] have increasing trends of extreme warm events and decreasing trends of extreme cold events. However, warm nights in the northwestern and southwestern United States have decreasing trends at both annual and seasonal scales, while cold nights have an increasing trend on an annual scale and in the spring and autumn [19]. From 1948 to 2012, the warm days of most of the southern states of the U.S. showed decreasing trends in different seasons. Among them, the states of Arkansas and Mississippi showed larger decreasing trends [20]. This indicates that due to the influence of the natural geographical environment and atmospheric general circulation model, there are great differences in the response of different regions to increasing radiative forcing [21], and that the frequency of extreme temperature events has large spatial heterogeneity at the regional scale. To better realize data sharing and model comparison, the World Climate Research Program (WCRP) started the Coupled Model Intercomparison Project (CMIP), which has developed to the sixth stage (CMIP6) and has provided the most extensive model database for the study of climate models [22]. CMIP5 provides future climate scenario data with a representative concentration path (RCP) [23], while CMIP6 employs a combination of shared socioeconomic pathway (SSP) scenarios and RCPs [24], and improves multiple parameters [25]. Kim et al. found that compared with CMIP5, CMIP6 can better reflect the pattern of change in global and regional extreme temperature events [26,27]. There are differences in the simulation of total precipitation between China [28] and the U.S. [29], and the simulation of drought in China [30] and local areas [31] is better. The climate trends simulated by different CMIP6 models are quite different, so it is necessary to sort the simulation capabilities of each model and select the best model to simulate climate change at the regional scale.
Consistent with global climate trends, the annual Tmean in China has increased by 1.1 °C at a rate of 0.22 °C/10a in the last 50 years [32], which is higher than the global scale (0.20 °C/10a). The increase in temperature directly affects the changes in extreme temperature and then leads to increases in the frequency and intensity of extreme temperature events, such as high temperatures and heat waves. For example, during 1951–1990, the daily Tmin in China showed a warming trend, which was most obvious at high latitudes, and the daily Tmin generally showed a warming trend west of 95°E and north of the Yellow River, but it showed a cooling trend south of the Yellow River [33]. In addition, the degrees of change in extreme temperature events in Inner Mongolia [34], the Three River headwater regions [35], the Tibetan Plateau [36], the Loess Plateau [37], and northeastern China [38] are quite different. The responses of extreme temperature events in different regions of China to global warming are heterogeneous. This is not only related to the regional vegetation type, but also has a strong relationship with the climatic zones and watershed to which it belongs.
However, there is a lack of research on the temporal and spatial changes in future extreme climate events at the mainland China scale and at different basin scales based on CMIP6 and their relative importance for changes in the Tmean. The purposes of this study are as follows: (1) based on historical observations, the effectiveness of CMIP6 models for simulating extreme climate events in mainland China is evaluated, and the optimal climate model for simulating extreme temperature events in mainland China is obtained; (2) based on the historical data and the optimal climate model, the temporal and spatial variation characteristics of extreme temperature events in different basins of mainland China in the historical and future periods are analyzed, and (3) the extreme temperature events that have the greatest influence on the Tmean at mainland China scale and basin scales are determined. This study is helpful to develop a clear understanding of the variation characteristics of mean temperature and extreme temperature events at both the mainland China scale and basin scales within the context of climate change. It also provides a reference for decision makers in managing and preventing disaster risks caused by climate change.

2. Materials and Methods

2.1. Material Sources

2.1.1. Historical Observation Data

The observation grid data of the daily Tmean, Tmin, and Tmax in mainland China from 1961 to 2013 used in this paper were obtained from the China Meteorological Data Network (http://data.cma.cn, accessed on 1 June 2022). The dataset was interpolated based on the temperature observation results of more than 2000 national climate stations in mainland China. On the basis of the thin plate spline (TPS), digital elevation data were introduced into the dataset to reduce the influence of unique and complex terrain in China on the accuracy of the spatial interpolation results. After interpolation, the grid data, with a spatial resolution of 0.5° × 0.5°, underwent strict quality inspection and control, such as deleting and correcting outliers far from the actual climate state or surrounding stations. This dataset has been widely used in the study of extreme climate indices, and its reliability has been proven [39,40].

2.1.2. Future Climate Scenario Data

In this study, CMIP6 model scenario MIP data are used as the climate projections data for future climate scenarios. Data from three scenarios of CMIP6 models, namely SSP1-2.6, SSP2-4.5 and SSP5-8.5, were selected to explore the trends of future Tmean and extreme temperature events in mainland China. They represent sustainable development, moderate development, and social development paths driven by traditional fossil fuels [23] and correspond to the RCP2.6 (low), RCP4.5 (medium), and RCP8.5 (high) emission scenarios of CMIP5, respectively. Fourteen models were selected (Table 1) on the condition that four kinds of daily temperature data, historical, SPS1-2.6, SSP2-4.5, and SPSP 5-8.5, could be output at the same time. In this study, we resampled the spatial resolution of all models to 0.5° × 0.5°.

2.2. Methods

2.2.1. Extreme Temperature Indices

In this study, we selected four extreme temperature indices provided by ETCCDI to characterize extreme temperature events (Table 2).

2.2.2. Multi-Model Evaluation Method

In this study, a Taylor diagram is used to quantitatively evaluate the simulation ability of CMIP6 multi-model extreme temperature indices in the historical period. The Taylor diagram is a method that was proposed by Karl E. Taylor to compare and evaluate multi-models, which can intuitively evaluate the simulation ability of a multi-model [41]. Taylor’s diagram evaluates the difference between simulated values and observed values of multi-models through three specific statistics (correlation coefficient—R, standard deviation—STD, and root mean squared error—RMSE).

2.2.3. Trend Analysis

In this study, the temporal trends of Tmean and extreme temperature events at the mainland China scale were analyzed by using linear regression, and Sen’s + Mann–Kendall’s tests were used to analyze the spatial trends of Tmean and extreme temperature events. Sen’s slope can effectively avoid the interference of outliers, so it is widely used in the analysis of long time-series to detect the order of trends. The Mann–Kendall nonparametric test method does not need time series data to obey a normal distribution, and the results are not affected by a few outliers, so it is widely used in time series trend analysis of meteorological and hydrological factors [42].

2.2.4. Multiple Linear Regression Analysis

In this study, the standard regression coefficient from multiple linear regression analysis was used to determine the relative importance of extreme temperature events on Tmean at the mainland China and basin scales. Because the units of the dependent variable and independent variable are different (for example, the unit of Tmean is °C, while the unit of extreme temperature events is days), the coefficient of the independent variable in multivariate linear regression cannot explain the relative importance of this factor, so it is necessary to transform each independent variable into a unified expression. In this study, the Tmean and extreme temperature indices are standardized. We used the standard deviation normalization method, and the formula is as follows:
y i = x i x ¯ σ
where y i represents the standardized variable, x i represents the original variable, and x ¯ represents the mean of the original variable, and σ represents the standard deviation of the original variable. The standardized variables range from −1 to 1, the mean value is 0, and the standard deviation is 1.
The regression coefficient obtained at this time can reflect the relative importance of the corresponding independent variable. This regression equation is called the standard regression equation, and the regression coefficient is called the standard regression coefficient, which is expressed as follows:
y = b 1 x 1 + b 2 x 2 + b 3 x 3 + + b n x n
where y is the dependent variable (Tmean), x is the independent variable (extreme temperature events), n is the number of variables, and bj (j = 1, 2, …, n) is the regression coefficient; the larger the absolute value of the standard regression coefficient, the more important the variable is.

3. Results

3.1. Temporal and Spatial Variations in Tmean and Extreme Temperature Events in Mainland China during Historical Periods

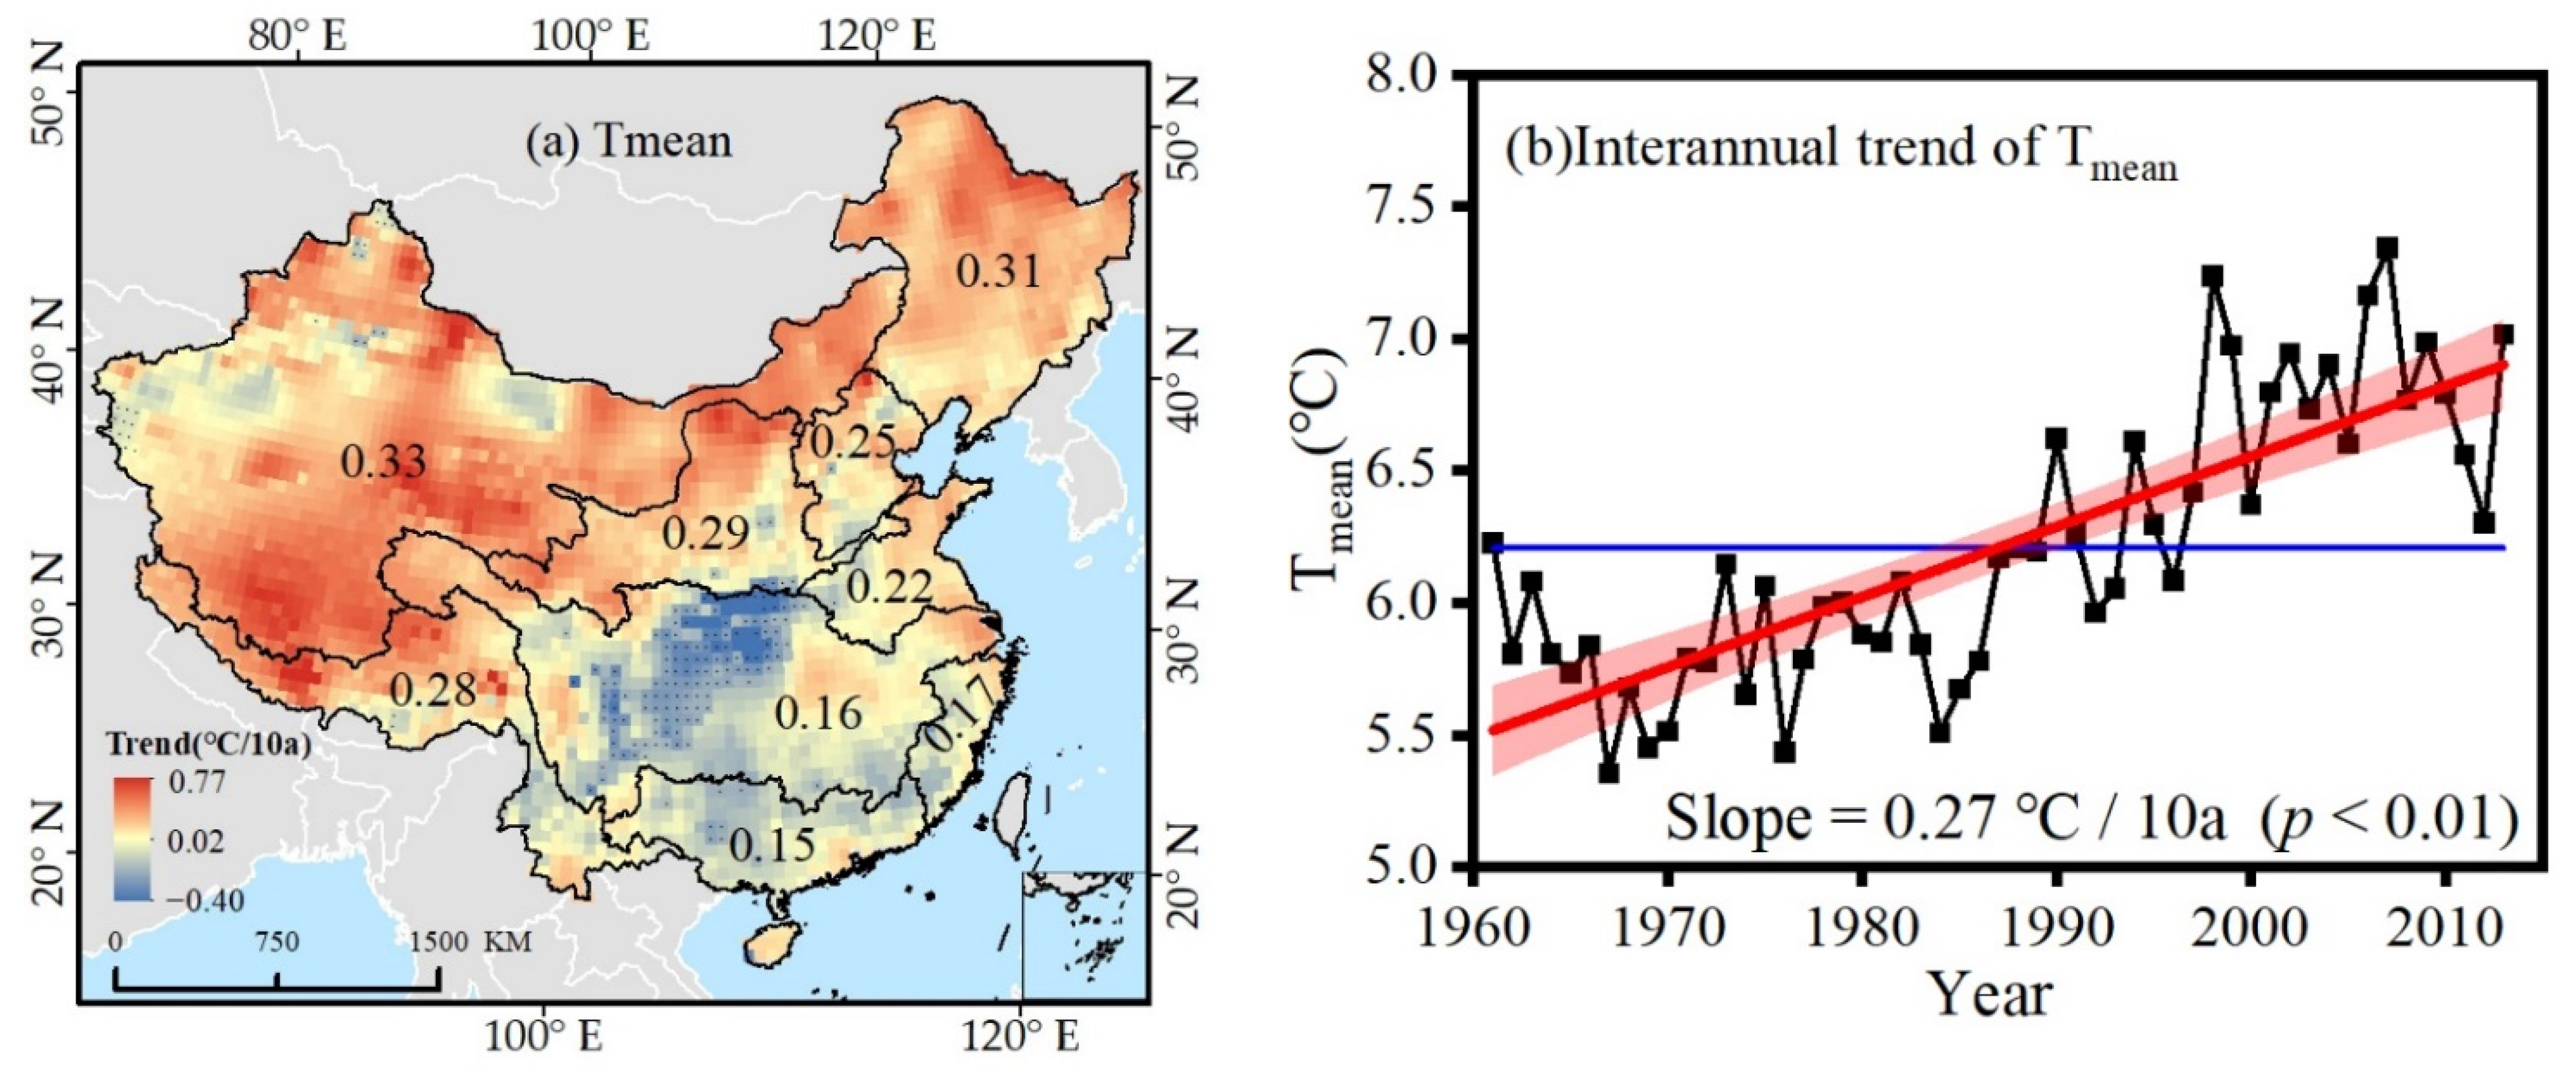
3.1.1. Temporal and Spatial Variations in Tmean during Historical Periods

Figure 1a illustrates the trend of the Tmean in mainland China from 1961 to 2013 based on the observed data ranged from −0.4 °C to 0.77 °C/10a, and there is significant warming in all regions, except for a small part of the central region where the change is not significant. The larger increase trend appeared in the Continental Basin, Songhua and Liaohe River Basin, Yellow River Basin, and the northern Southwest Basin. Among them, the Continental Basin has the largest change range (0.33 °C/10a), while smaller increasing trends appear mainly in the Yangtze River Basin, Pearl River Basin, and Southeast Basin, and the Pearl River Basin has the smallest range of change (0.15 °C/10a). Figure 1b shows that the Tmean in mainland China was 6.2 °C from 1961 to 2013, with a trend of 0.27 °C/10a, with the lowest Tmean in 1967 and the highest Tmean in 2007. Before 1990, the Tmean in mainland China was lower than 6.21 °C (mean value), and after 1990, the temperature in most years was higher than the mean value. This indicates that the Tmean in mainland China has risen sharply since the 1990s, and in the last 50 years, the Tmean in the Continental Basin, Songhua and Liaohe River Basin, Yellow River Basin, and Southwest Basin has increased faster than that at the mainland China scale.

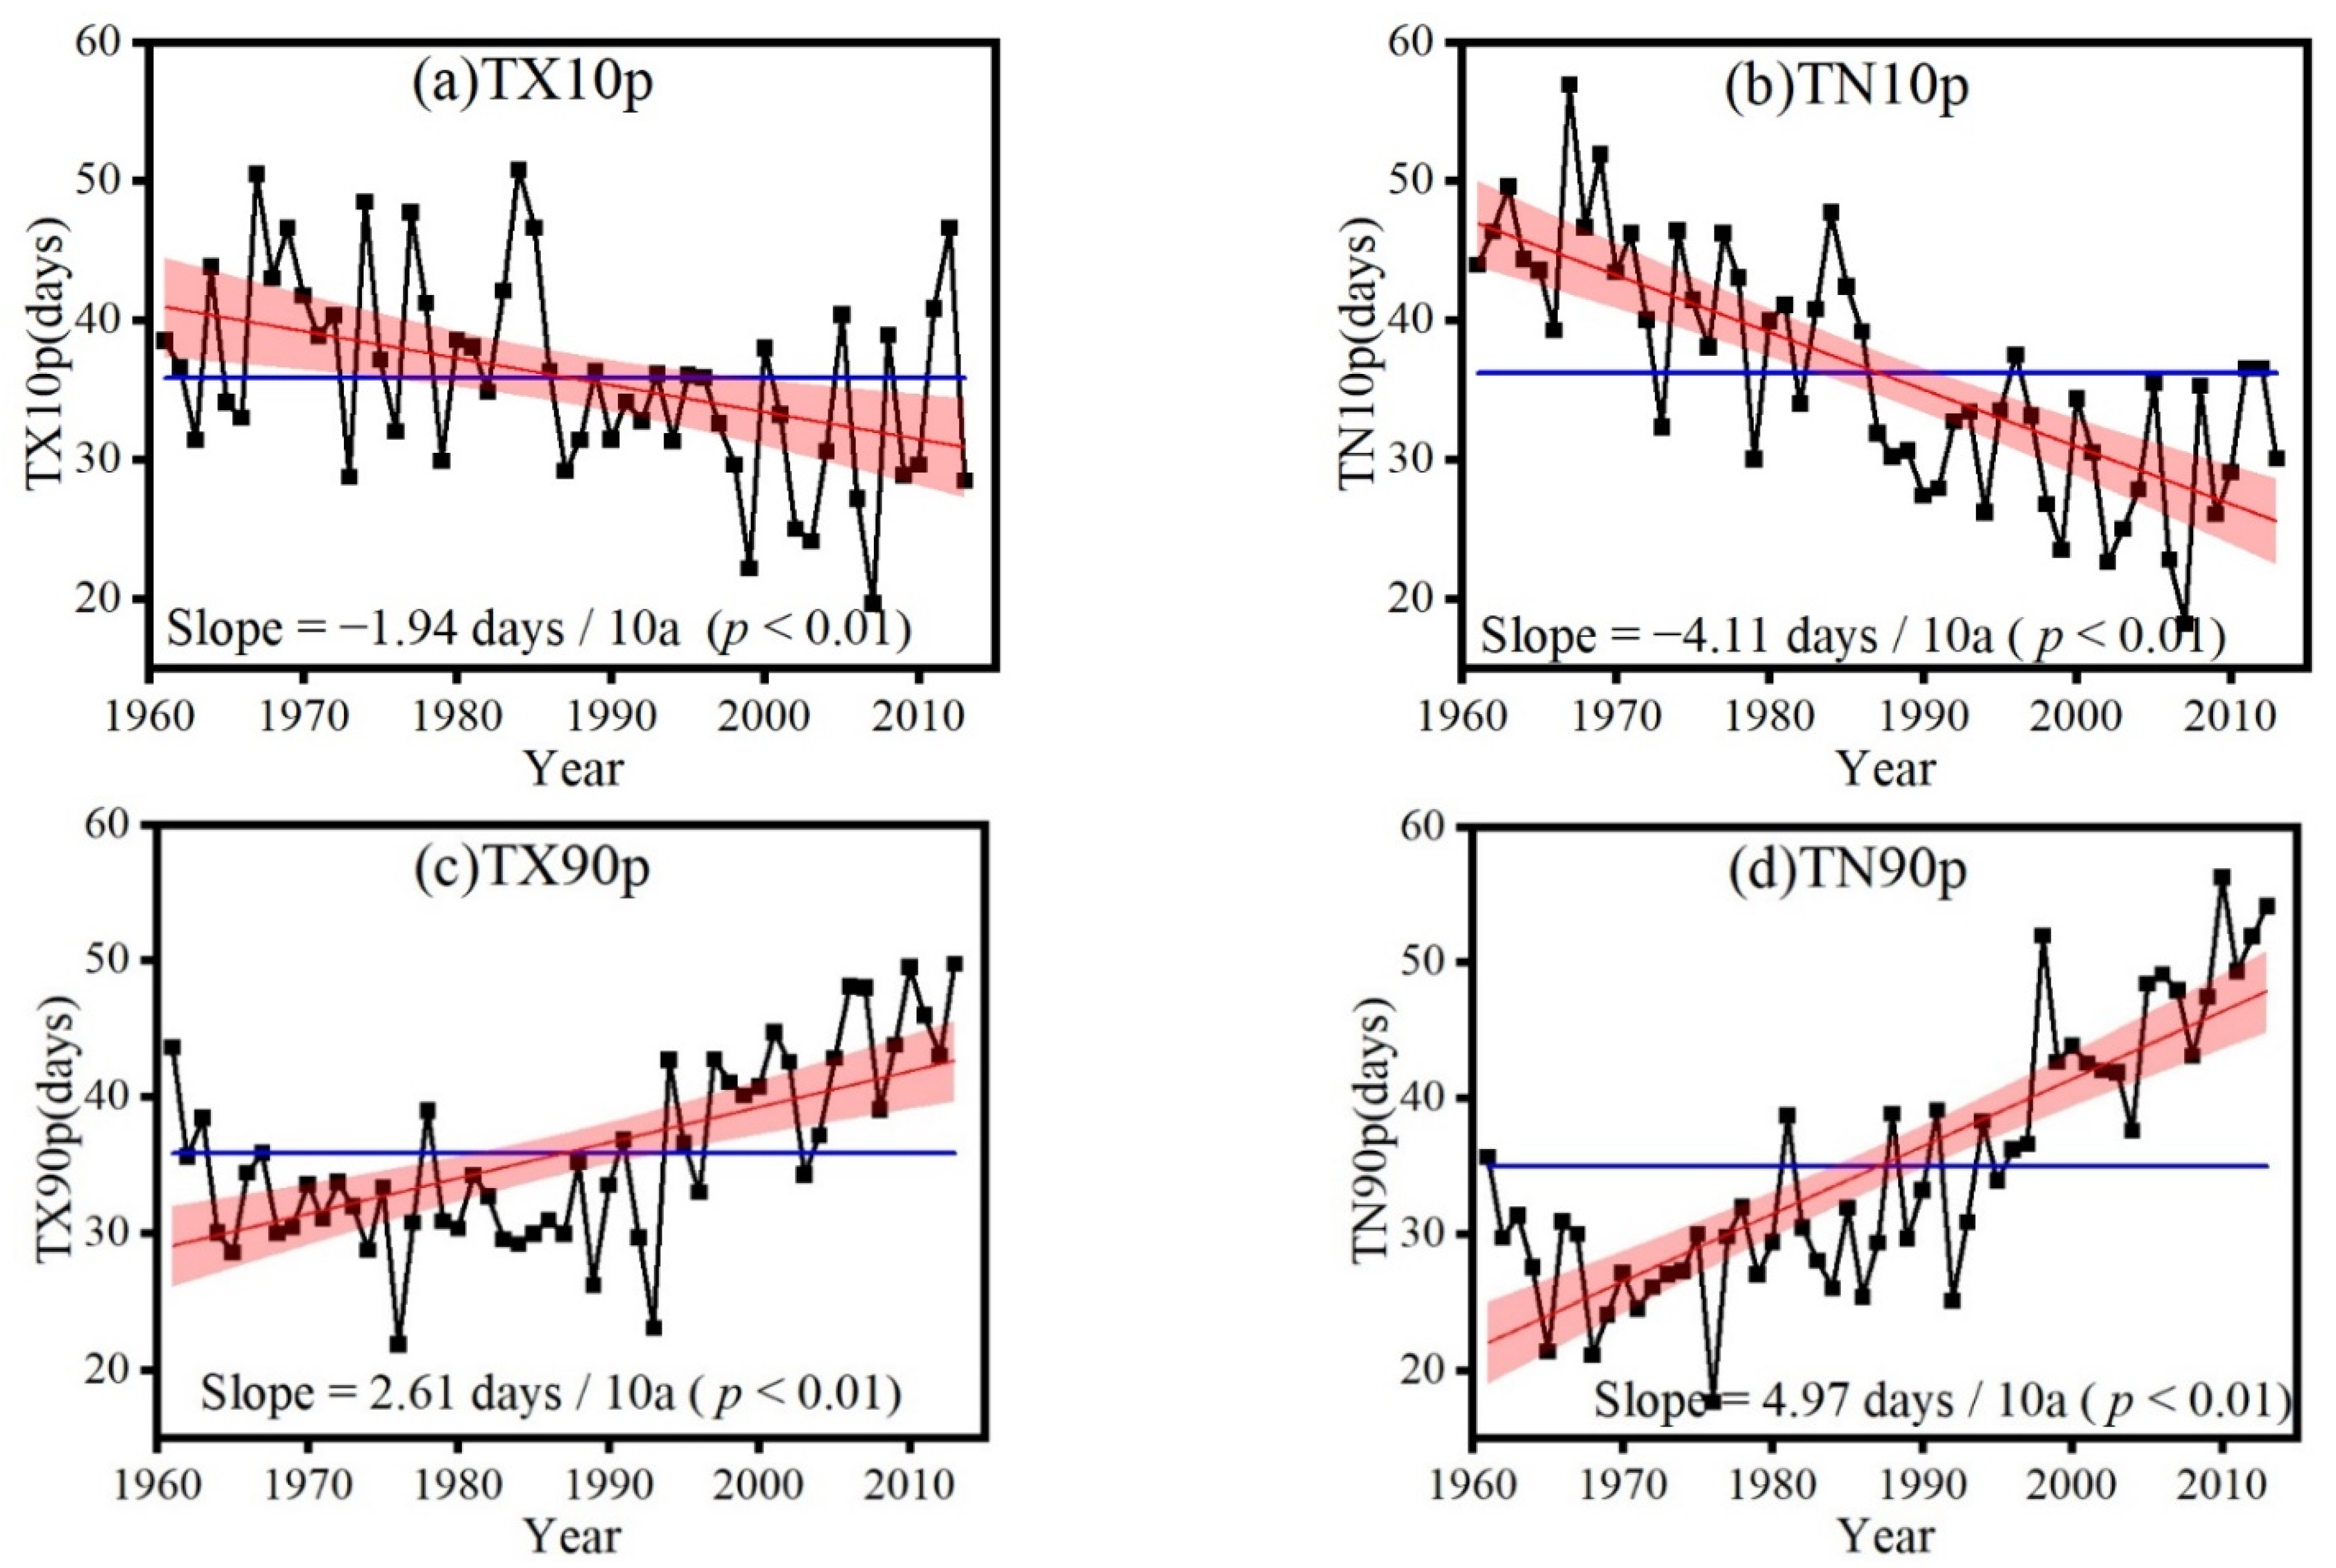
3.1.2. Temporal Variations in Extreme Temperature Events during Historical Periods

Figure 2 shows that extreme cold events (TX10p and TN10p) show significant decreasing trends at rates of −1.94 days/10a (Figure 2a) and −4.11 days/10a (Figure 2b), respectively. The mean value of TN10p was 36.2 days; the TN10p in mainland China was lower than the mean value after 1987; the maximum values appeared in 1984 (50.8 days) and 1967 (56.9 days); and the minimum values appeared in 2007 (19.7 days and 18.2 days). The mean value of TX10p was 35.9 days, and its change fluctuated widely after 2000, which indicates that the decrease in cool nights has been more direct and severe. Contrary to extreme cold events, extreme warm events (TX90p and TN90p) showed a significant increasing trend during 1961–2013, and the increasing trends were 2.61 days/10a (Figure 2c) and 4.97 days/10a (Figure 2d), respectively, which indicates that the number of warm nights has increased much more than that of warm days. The maximum values of TX90p and TN90p appeared in 2013 and 2010, respectively, while the minimum values appeared in 1976. In addition, both TX90P and TN90p were lower than the mean value (35.8 days and 34.9 days) before 1993 and then higher than the mean value, which indicated that the temperature increased significantly after the 1990s. These results show that the rate of increase in extreme warm events is much higher than that of extreme cold events, and the rate of change at night is higher than that during the day; that is, the rate of increase in Tmin is higher than that of Tmax.

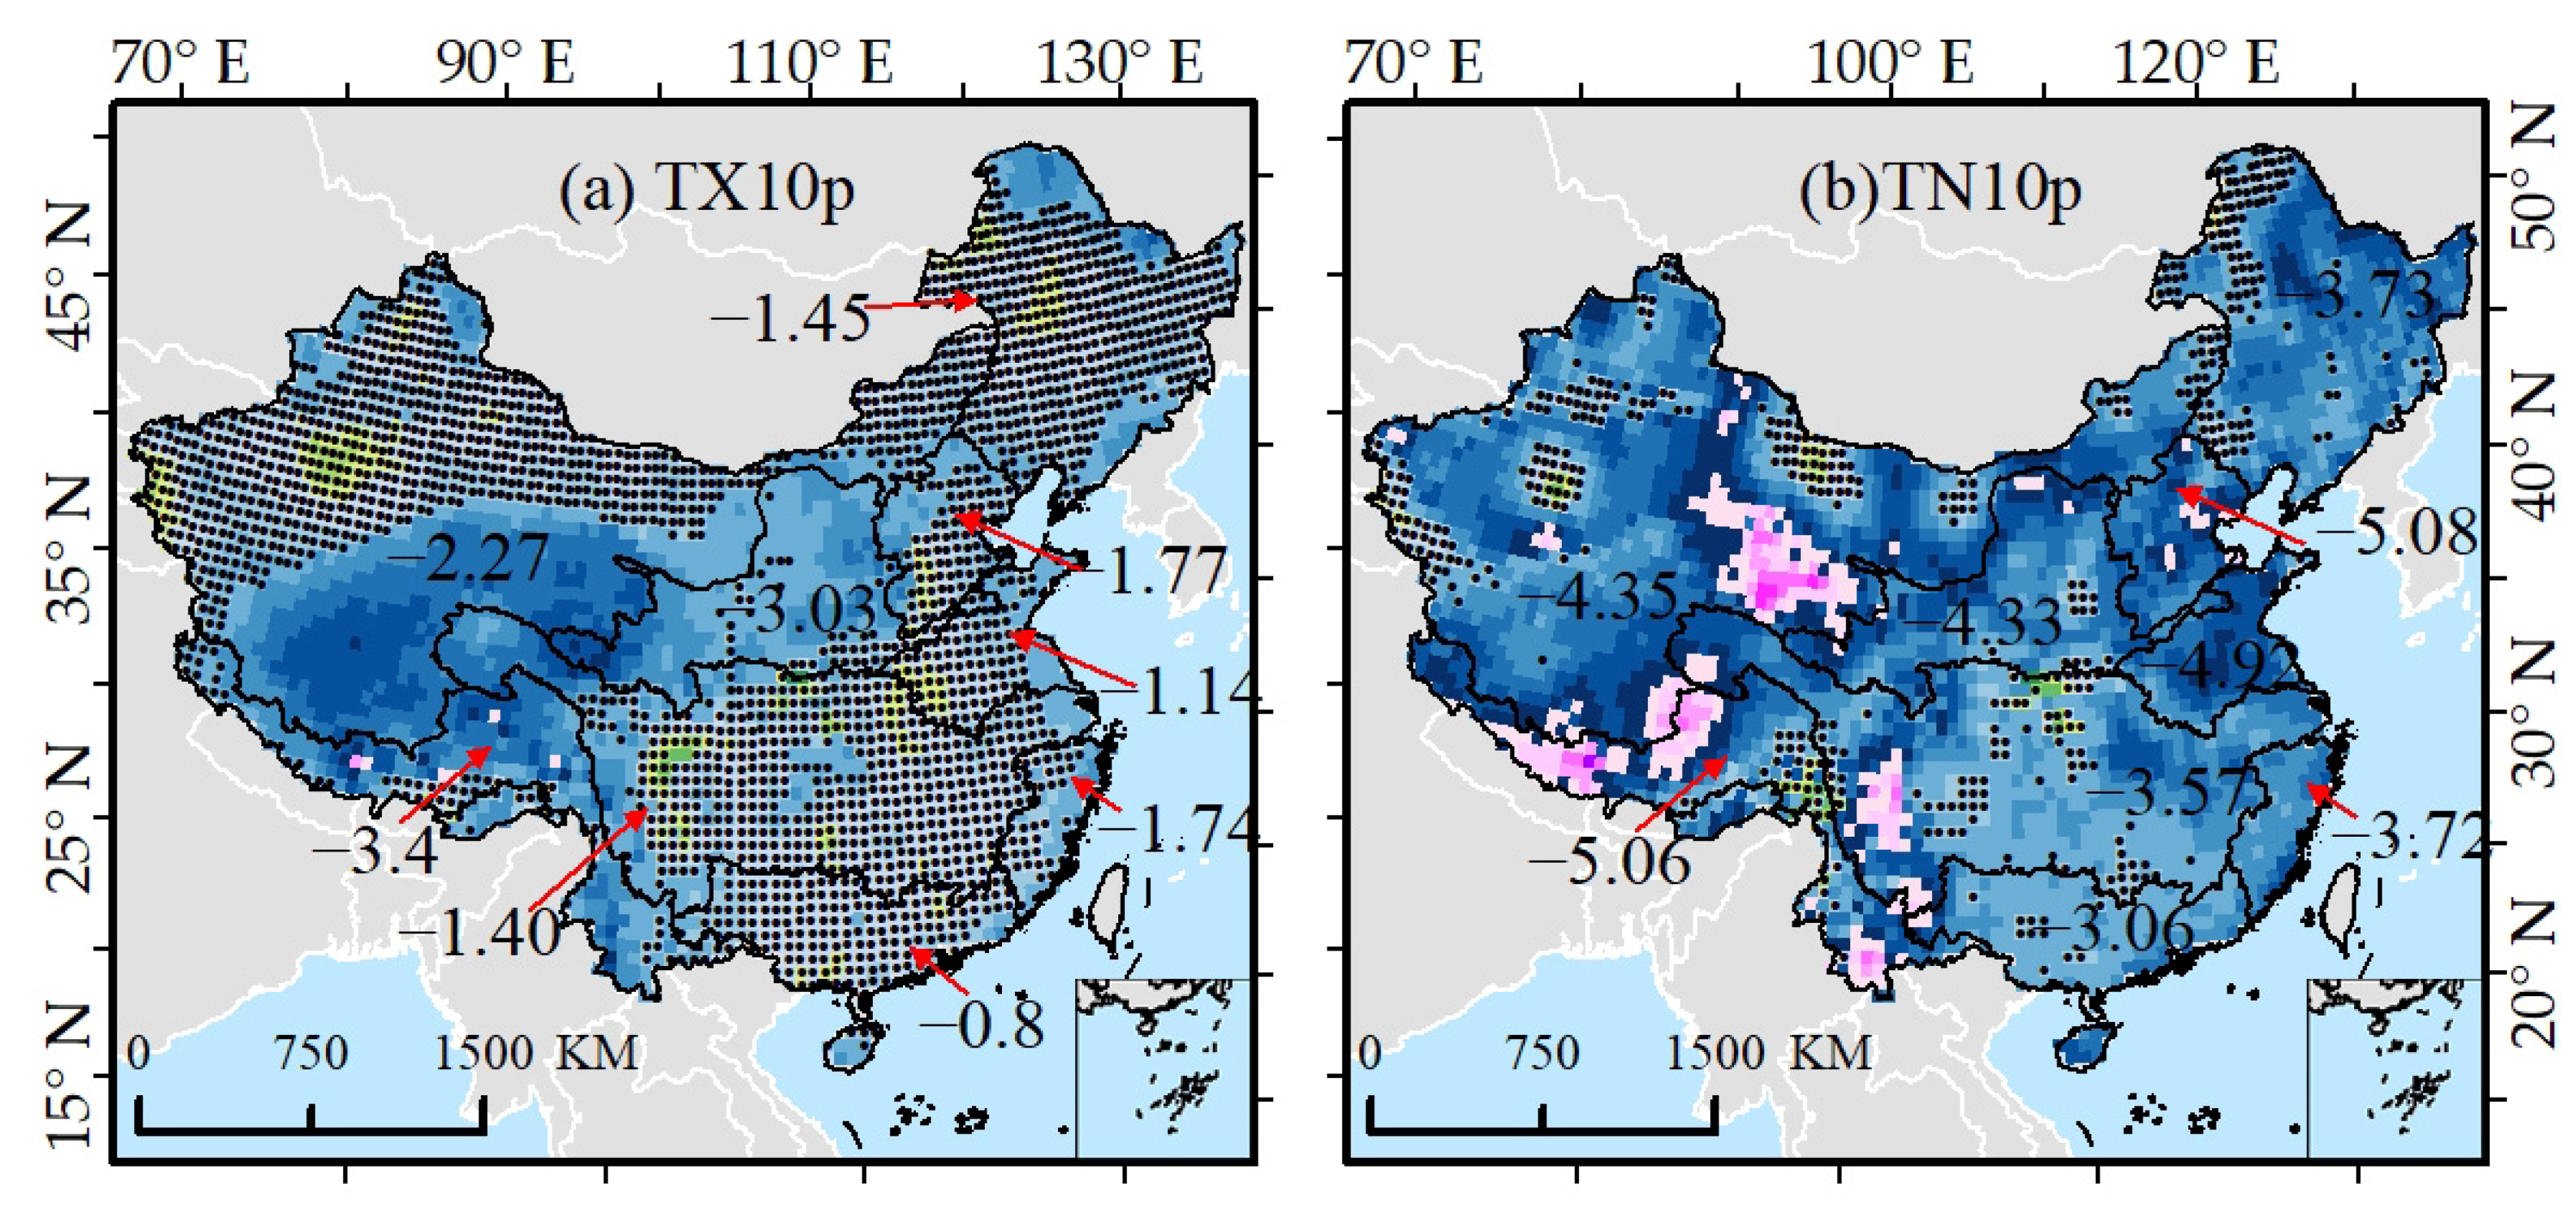
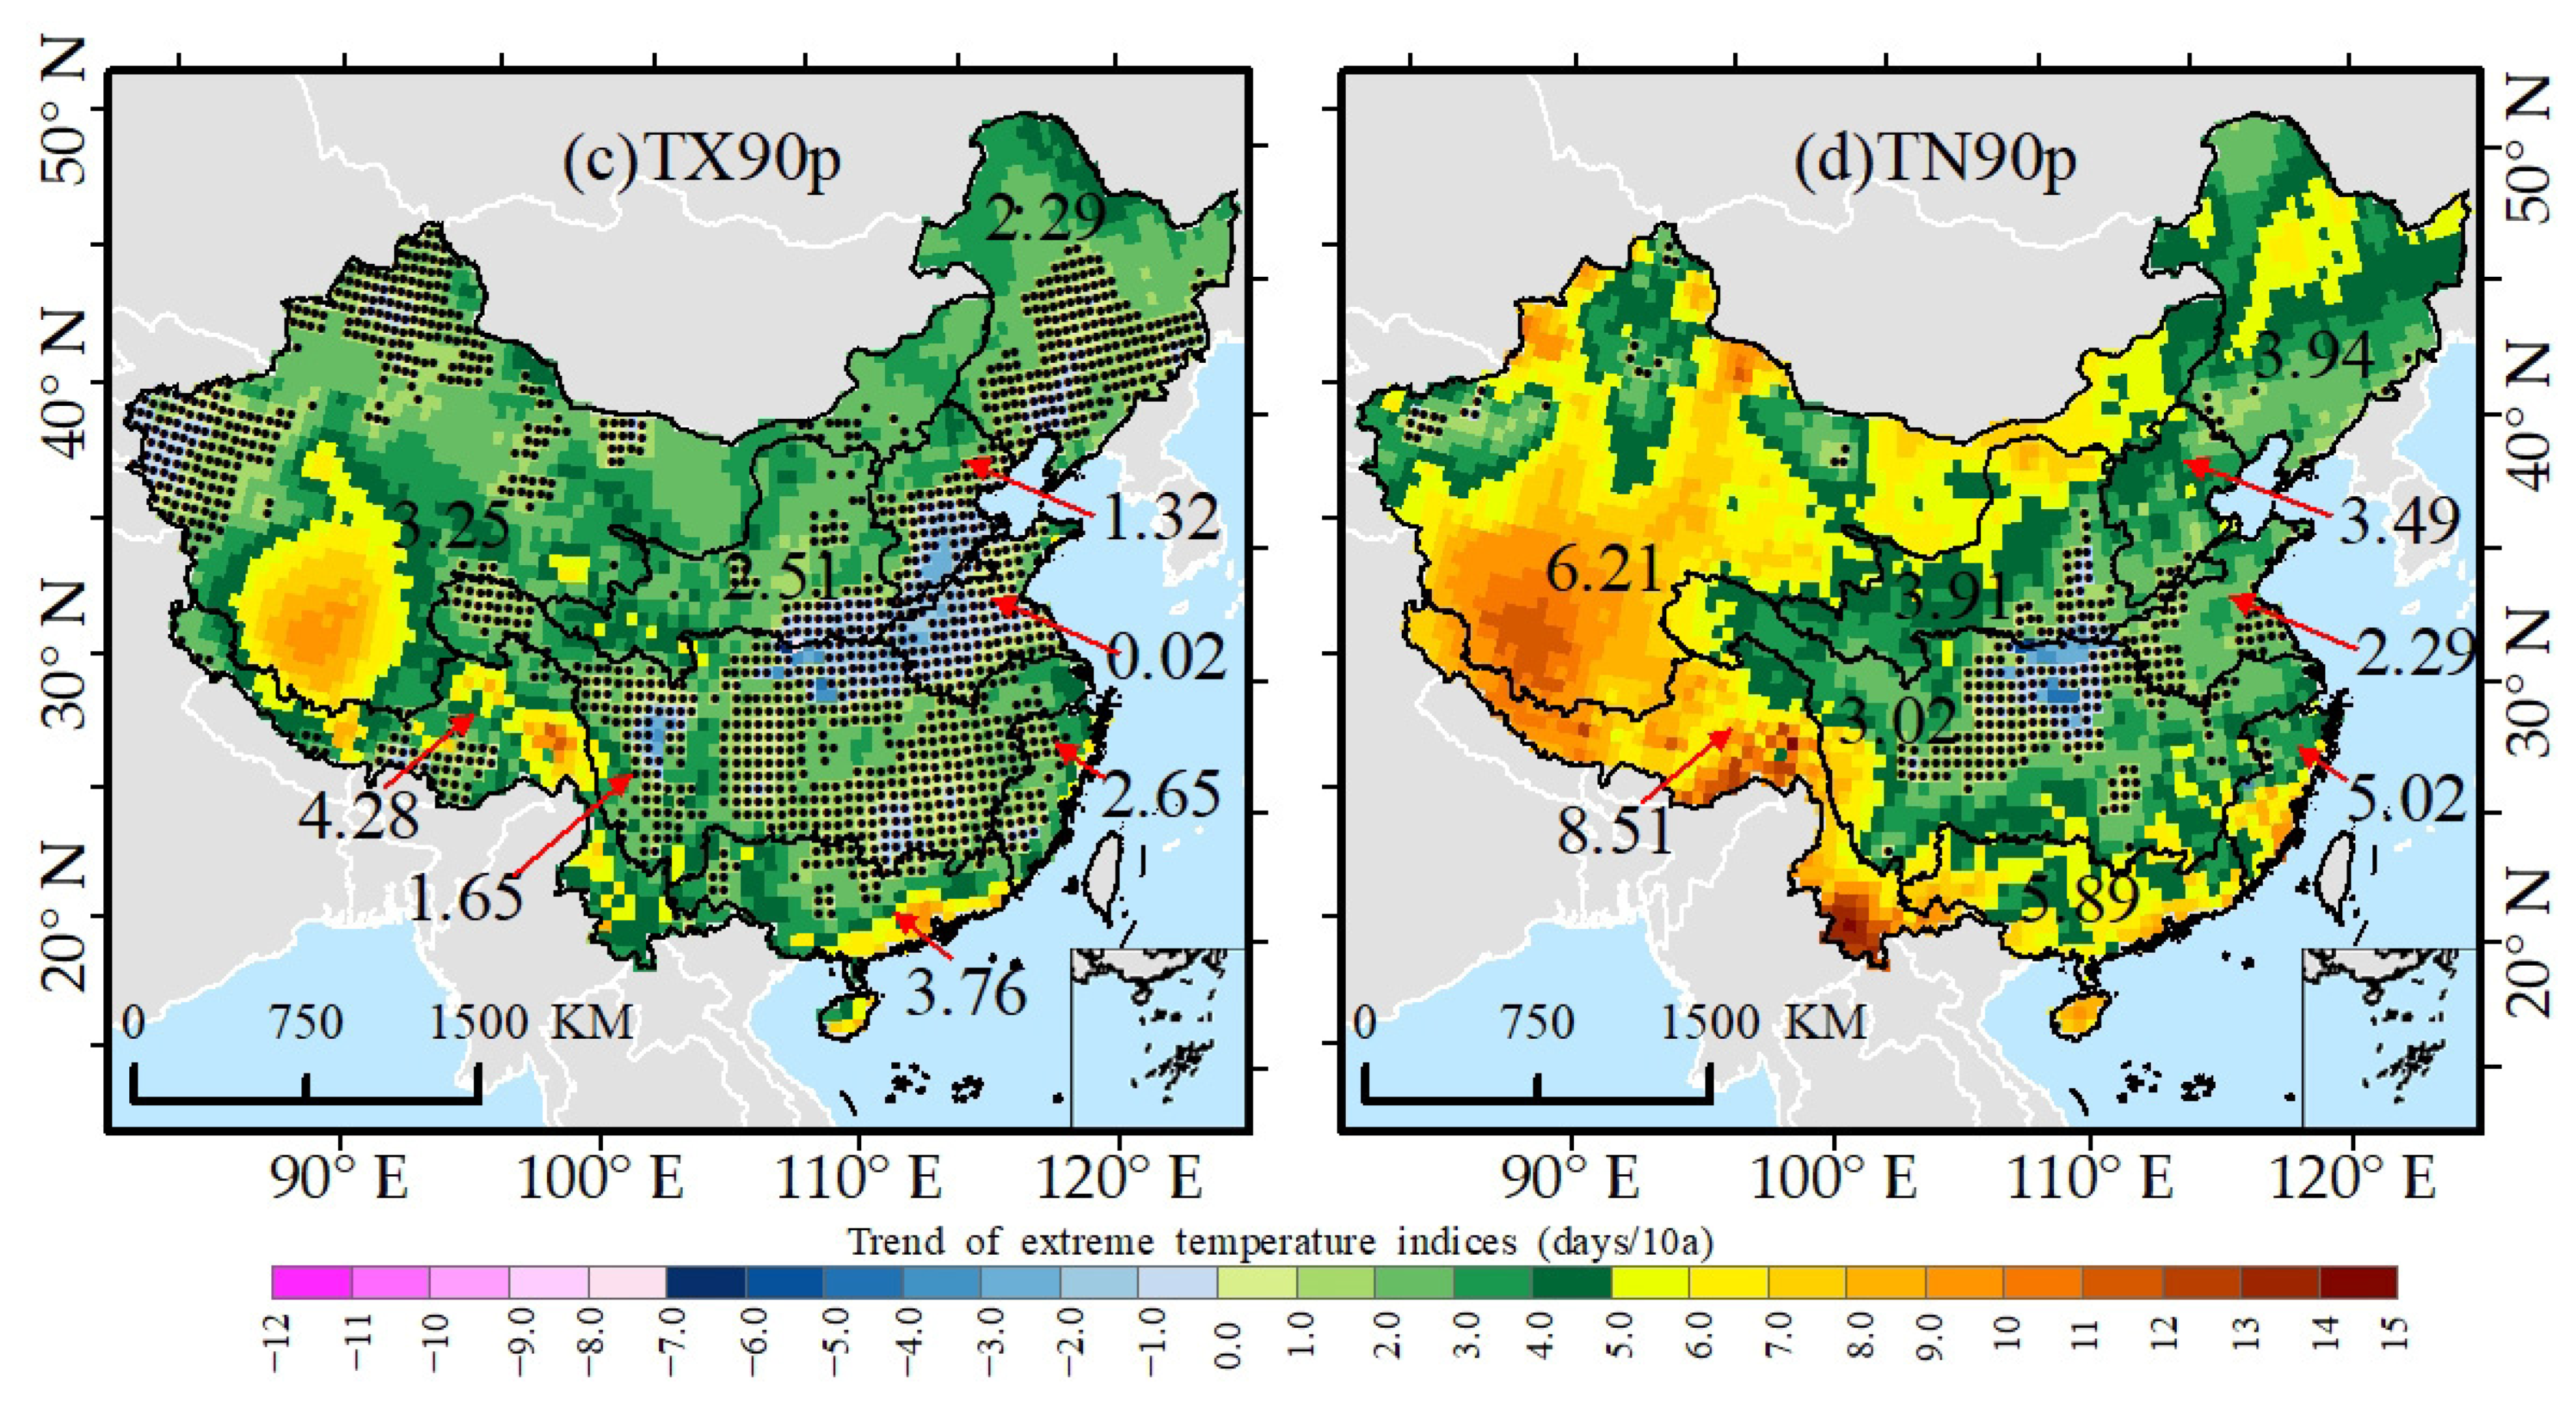
3.1.3. Spatial Variations in Extreme Temperature Events during Historical Periods

Figure 3 shows the spatial distribution of extreme temperature event trends based on observed data from 1961 to 2013. Figure 3a illustrates that extreme cold events show a decreasing trend throughout mainland China, but the changes between basins are quite different. The decreasing trend of TX10p is the largest in the Southwest Basin (−3.4 days/10a), followed by the Yellow River Basin (−3.03 days/10a) and Continental Basin (−2.27 days/10a). Moreover, the rate of decrease in TX10p in these three basins is greater than that at the mainland China scale. TN10p has a significant decreasing trend in many basins (Figure 3b), among which the rates of decrease in the Haihe River Basin and Southwest Basin are −5.08 days/10a and −5.06 days/10a, respectively, and the decreasing trend of the Haihe River Basin, Continental Basin and Yellow River Basin is −4.92 days/10a, −4.35 days/10a and −4.33 days/10a, respectively; these numbers also indicate that the decreasing trends of TN10p in most regions of China are greater than the change at the mainland China scale. In addition, the rate of decrease in TN10p in each basin is greater than that of TX10p, and the difference between TN10p and TX10p is the largest in the Haihe River Basin (3.31 days/10a).
Extreme events are increasing in all watersheds; among them, the rate of increase in TX90p in the Southwest Basin is the largest (4.28 days/10a), followed by the Pearl River Basin (3.76 days/10a) and Continental Basin (3.25 days/10a) (Figure 3c). TN90p increased the most in the Southwest Basin (8.51 days/10a), followed by the Continental Basin (6.24 days/10a) and the Pearl River Basin (5.89 days/10a). In addition, the rate of increase in TN90p in each watershed is higher than that of TX90p, and the difference between TN90p and TX90p is the largest in the Southwest Basin (4.23 days/10a). In general, the decrease in extreme cold events in West China is relatively large, while the increases in extreme warm events in the western and southern regions are greater than those in eastern and central regions, and the rate of change in extreme temperature events in the western basins is greater than that at the mainland China scale.

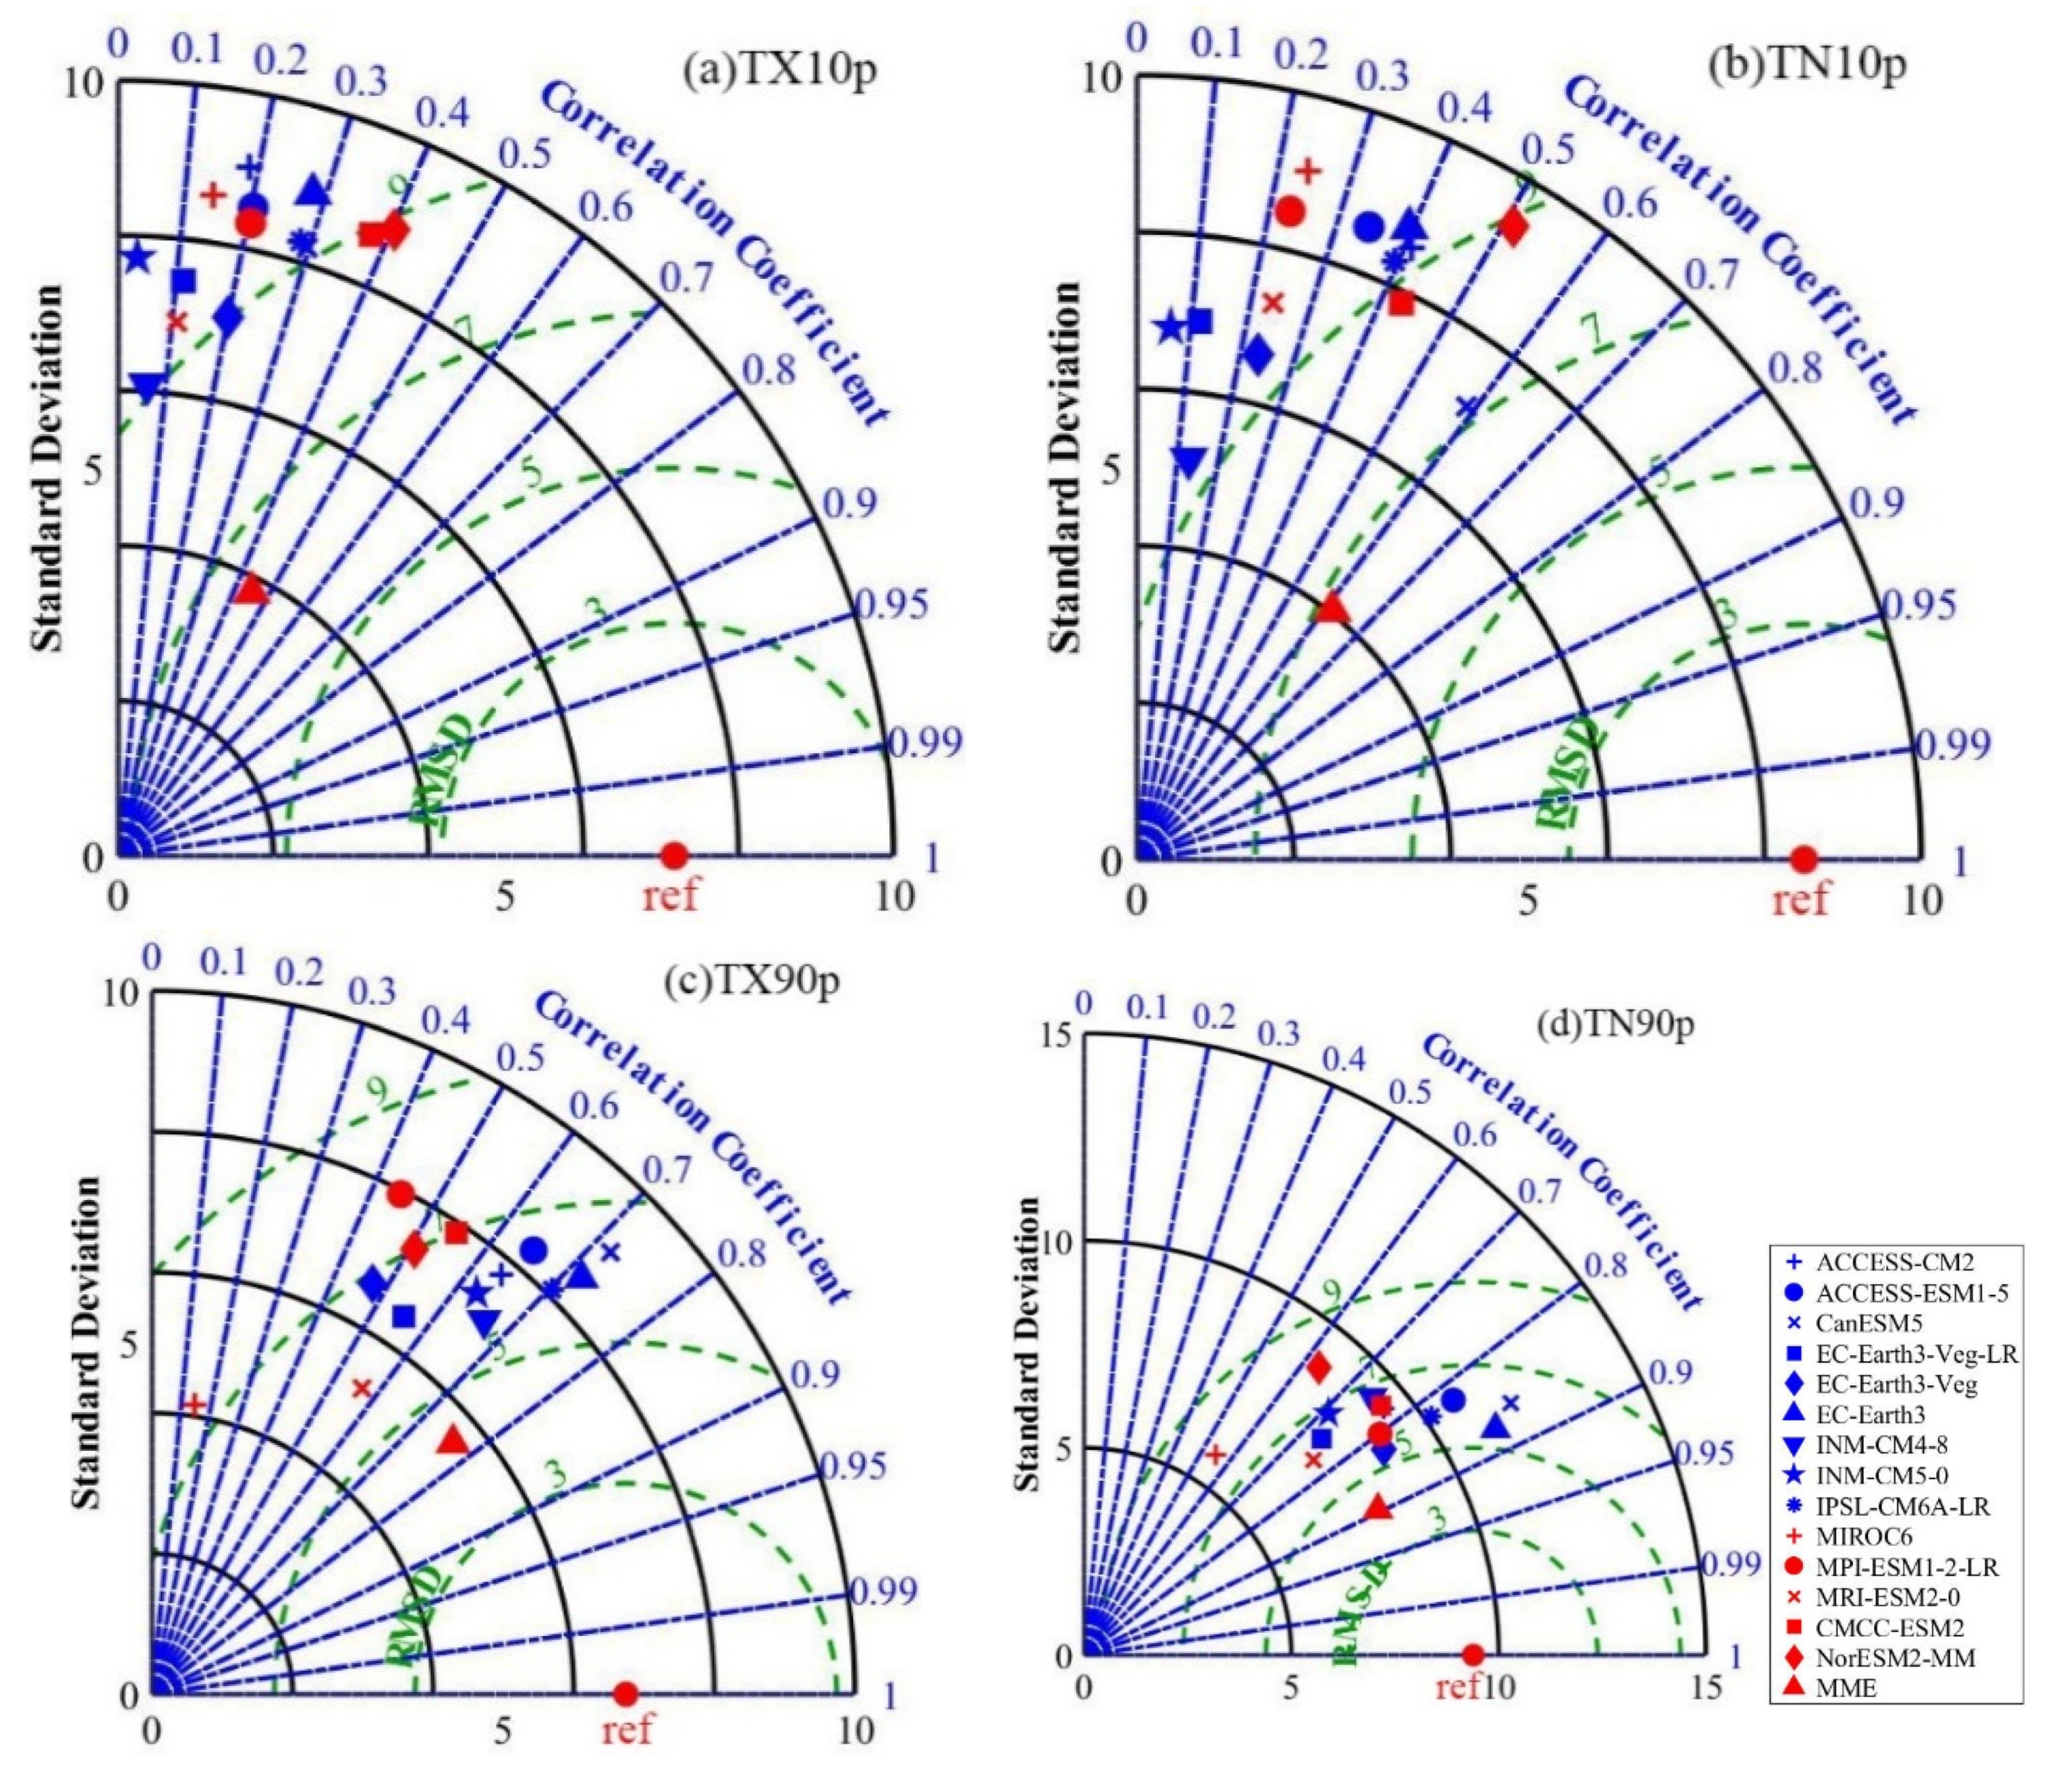
3.2. Effectiveness Evaluation of Historical Climate Models of CMIP6

Figure 4 shows the evaluation results of historical multiple CMIP6 climate models, based on historical observed data, and reveals that different models have great differences when it comes to simulating extreme climate indices. In general, the extreme temperature indices of mainland China simulated by the multi-model ensemble (MME) of 14 CMIP6 models are the closest to the extreme temperature indices calculated from the observed data during historical periods. In this study, MME was selected as the best model for extreme weather events at the mainland China scale. Therefore, in the following study, we analyzed the temporal and spatial trends of the mean temperature and extreme temperature events in mainland China from 2021 to 2100 based on MME.

3.3. Temporal and Spatial Variations in Tmean and Extreme Temperature Events Based on MME in Mainland China during Future Periods

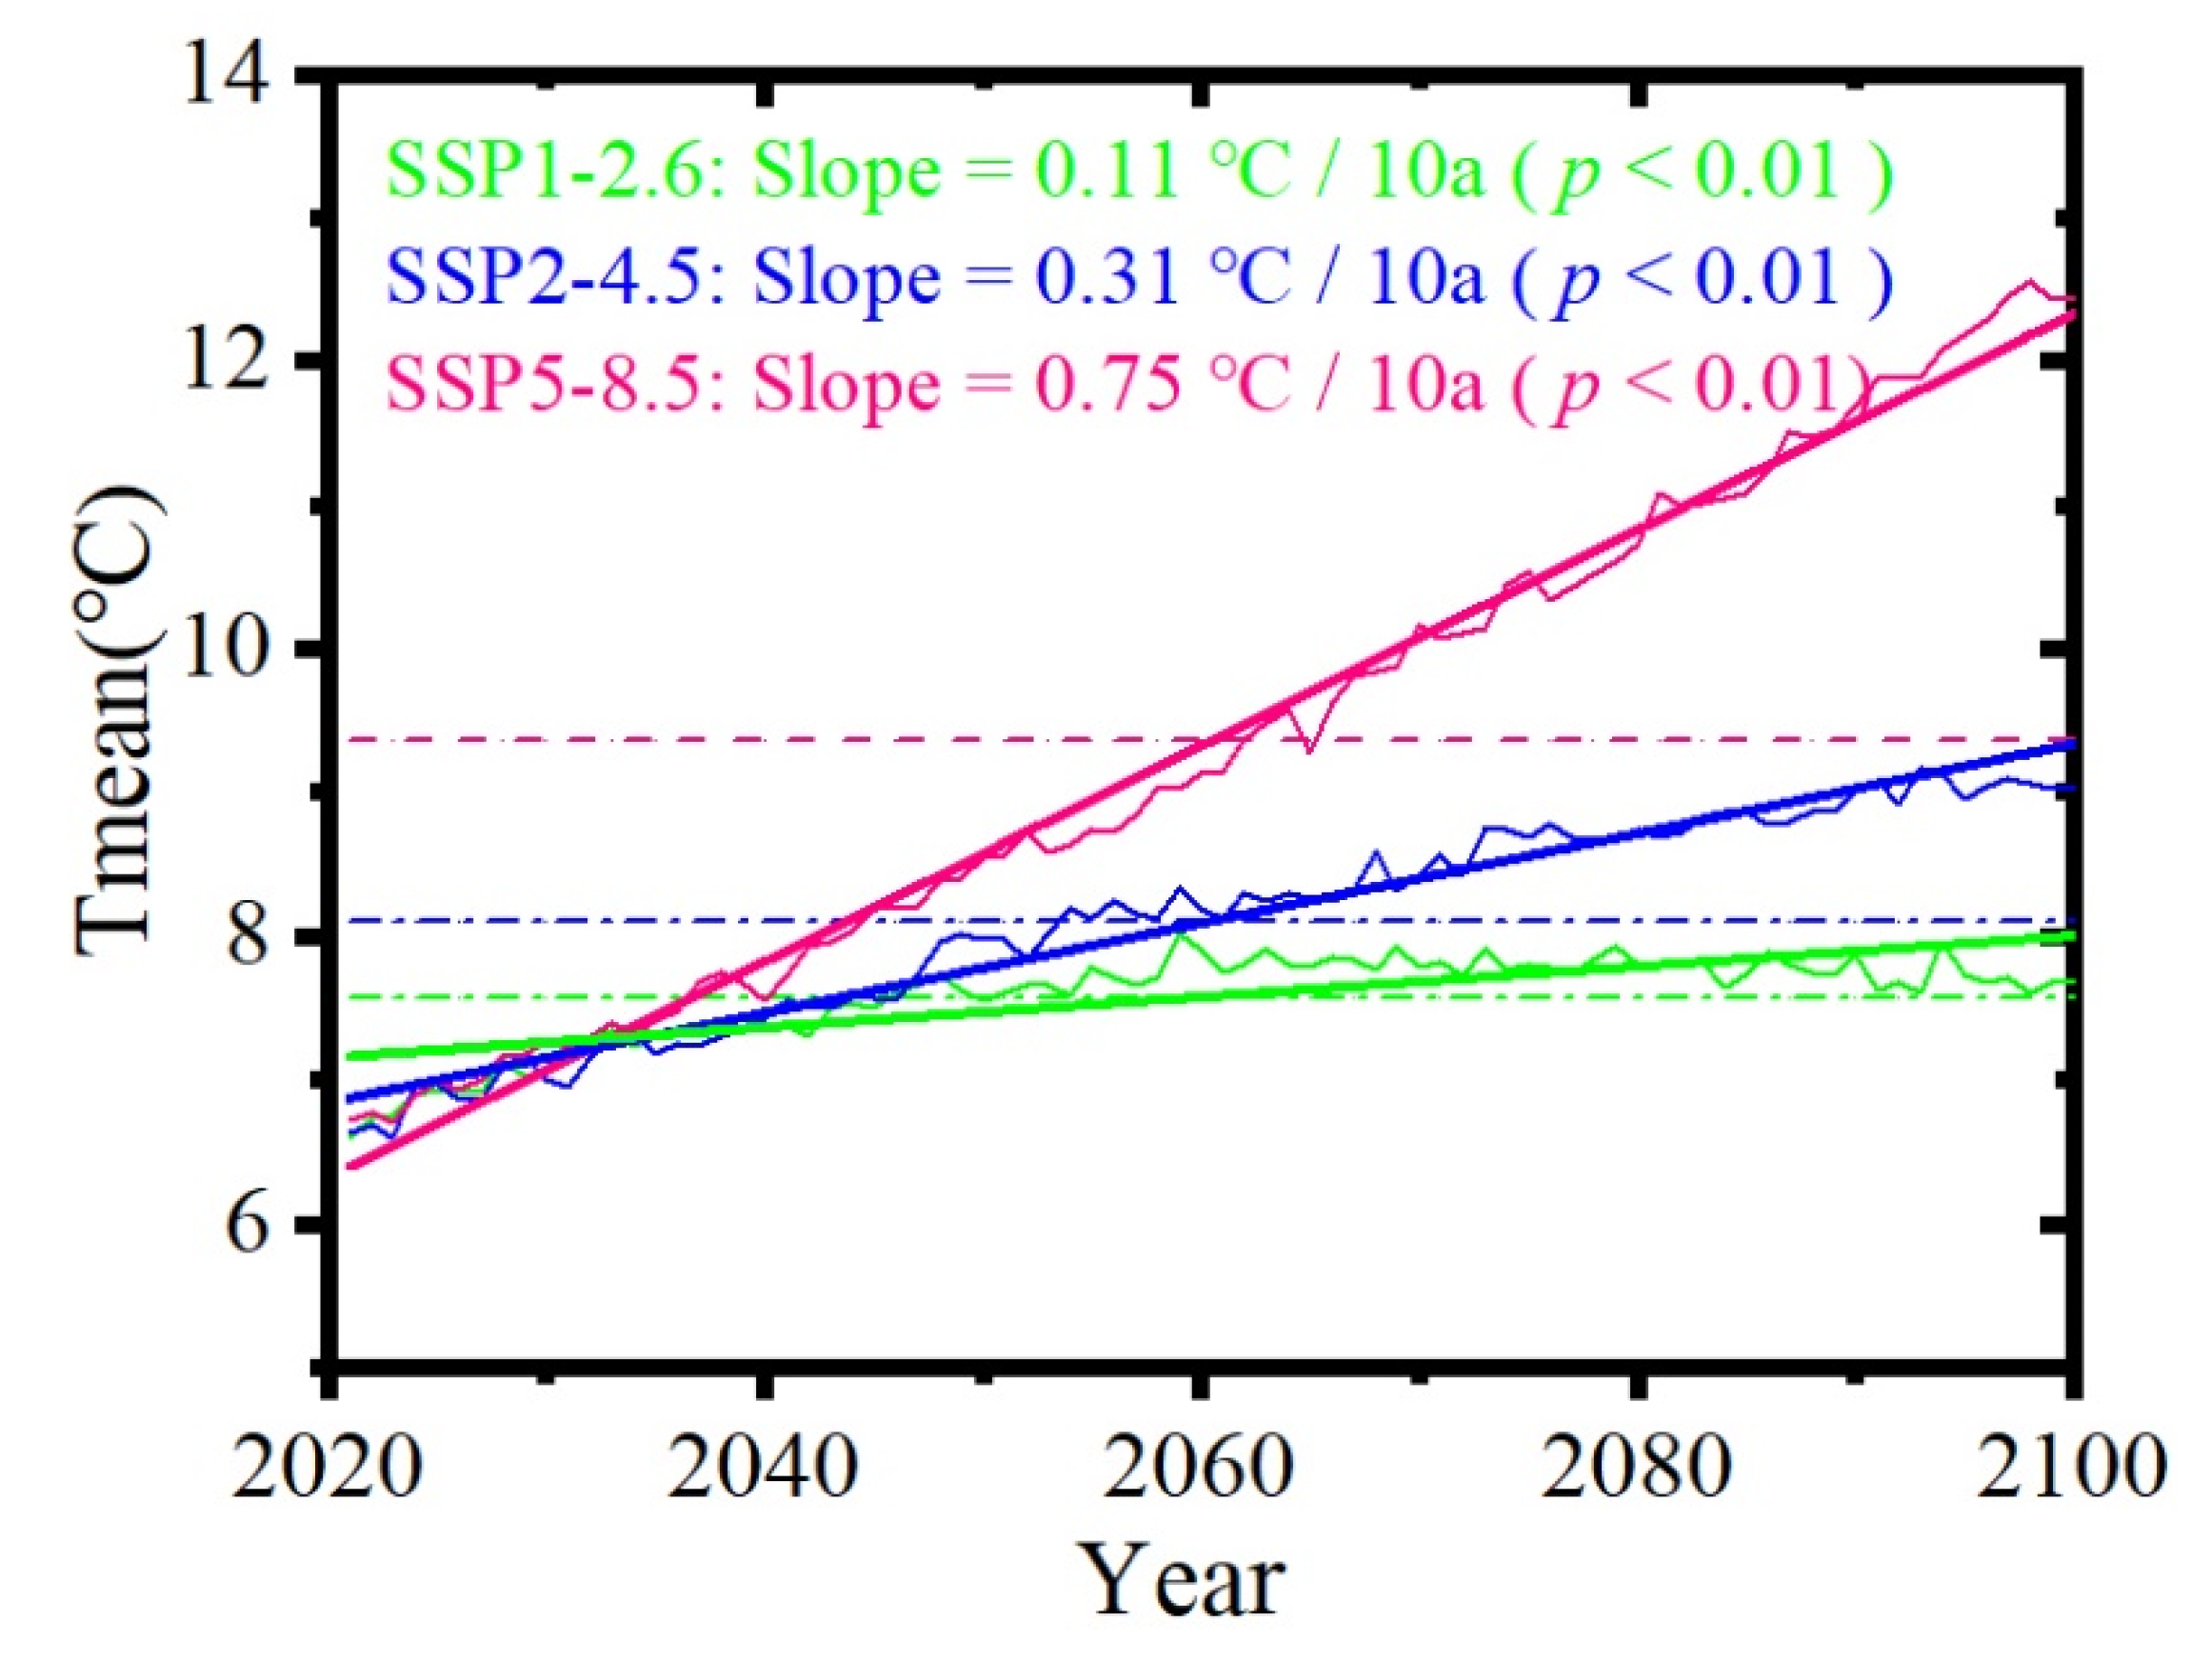
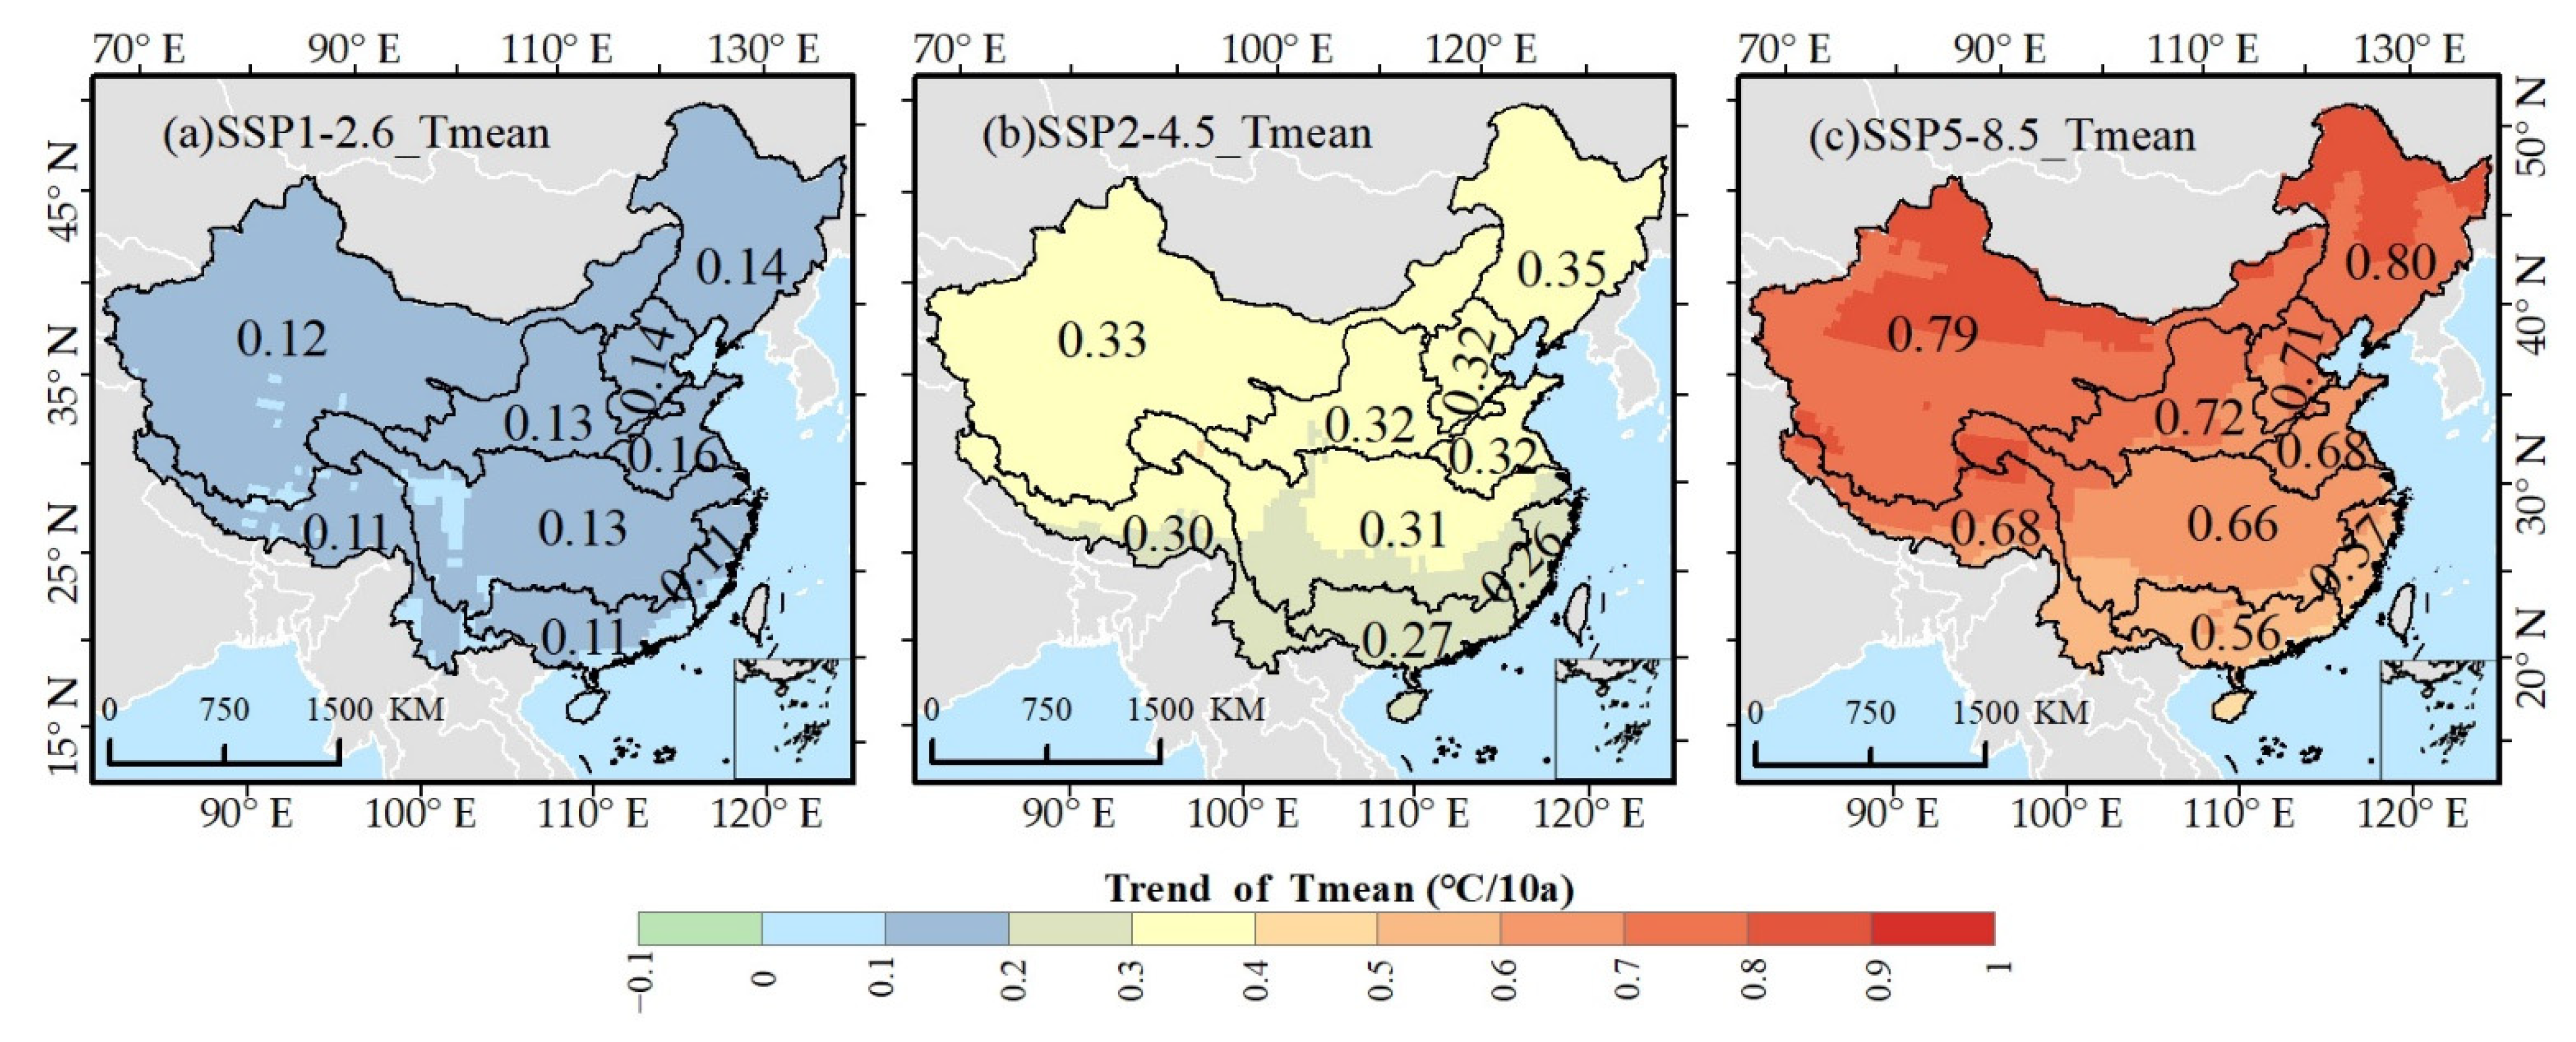
3.3.1. Temporal and Spatial Variations in Tmean during Future Periods

The Tmean for the SSP1-2.6, SSP2-4.5 and SSP5-8.5 scenarios is still obtained from the above 14 CMIP6 climate models, i.e., the average of the 14 models. Figure 5 shows the temporal trends of Tmean at the mainland China scale in different SSP scenarios, from 2021 to 2100. The Tmean in mainland China increases under the SSP1-2.6, SSP2-4.5, and SSP5-8.5 scenarios, with trends of 0.11 °C/10a, 0.31 °C/10a, and 0.75 °C/10a, respectively. The rate of increase is relatively slow under the SSP1-2.6 scenario and relatively fast under the SSP5-8.5 scenario. The mean values of the Tmean at the mainland China scale in the next 80 years are 7.58 °C, 8.1 °C, and 9.36 °C under the three SSP scenarios, which further indicates that the temperature will continue to rise. In addition, the Tmean will increase continuously beyond the mean value after approximately 2060 in all three SSP scenarios, indicating that 2060 is very likely to be a turning point of climate change.
Figure 6 shows that the Tmean in each basin has a significant increasing trend under the three emission scenarios. Under the SSP1-2.6 scenario, the range of increase in the Tmean in most basins is 0.1–0.2 °C/10a, among which the increase rate in the Huahe River basin is the largest (0.16 °C/10a), followed by the Haihe River Basin and the Songhua and Liaohe River Basin (0.14 °C/10a). However, the rate of warming in the Southwest Basin, Southeast Basin, and Pearl River Basin is relatively small (0.11 °C/10a) (Figure 6a). Under the SSP2-4.5 scenario (Figure 6b), the warming range of each basin in mainland China is 0.2–0.4 °C/10a, among which the increase range in the southern region is 0.2–0.3 °C/10a, the smallest change is in the Southeast Basin, and the Continental Basin and Songhua and Liaohe River Basin have relatively large warming, with change rates of 0.33 °C/10a and 0.35 °C/10a, respectively. Under the SSP5-8.5 scenario (Figure 6c), the warming range of each basin in mainland China is 0.5–0.9 °C/10a. In the southern basins, the change range is small (0.5–0.7 °C/10a), and the change rate of the Pearl River Basin is the smallest (0.56 °C/10a). In the northern region, the warming range is 0.7–0.9 °C/10a, which is still the most significant in the Continental Basin (0.79 °C/10a) and Songhua and Liaohe River Basin (0.80 °C/10a). In addition, under the three emission scenarios, the warming range of the northern basin is greater than that at the mainland China scale, and the Continental Basin has the greatest difference under the three SSP scenarios.

3.3.2. Temporal Variations in Extreme Temperature Events during Future Periods

Figure 7a,b shows that extreme cold events (TX10P and TN10P) have a small change range under the SSP1-2.6 scenario, and generally show downward trends of −1.12 days/10a and −1.03 days/10a, respectively. Under the SSP2-4.5 scenario, the trends are −2.89 days/10a and −3.08 days/10a, respectively, while under the SSP5-8.5 scenario, the trends are −6.42 days/10a and −7.01 days/10a, respectively. The lowest values appear after 2098, and they are 6.9 days and 3.8 days, respectively.
The extreme warm events (TX90p and TN90p) show increasing trends under the three SSP scenarios, and the trends of TX90P in the SSP1-2.6, SSP2-4.5 and SSP5-8.5 scenarios are 1.7 days/10a, 4.4 days/10a and 9.3 days/10a, respectively (Figure 7c). The trends of TN90P under the SSP1-2.6, SSP2-4.5, and SSP5-8.5 scenarios are 1.88 days/10a, 5.3 days/10a, and 11.1 days/10a, respectively (Figure 7d). In addition, under the SSP1-2.6 scenario, the extreme warm events show a slowly increasing trend before 2060. However, they display extremely fast increasing trends under the SSP2-4.5 and SSP5-8.5 scenarios, with the highest values appearing after 2090. Under the three SSP scenarios, the range of change in TN90P is larger than that of TX90p, which indicates that the temperature increase at night will be greater than that during the day in the future, but the difference in mean values is small. In general, extreme temperature events associated with Tmin increase faster than those associated with Tmax.

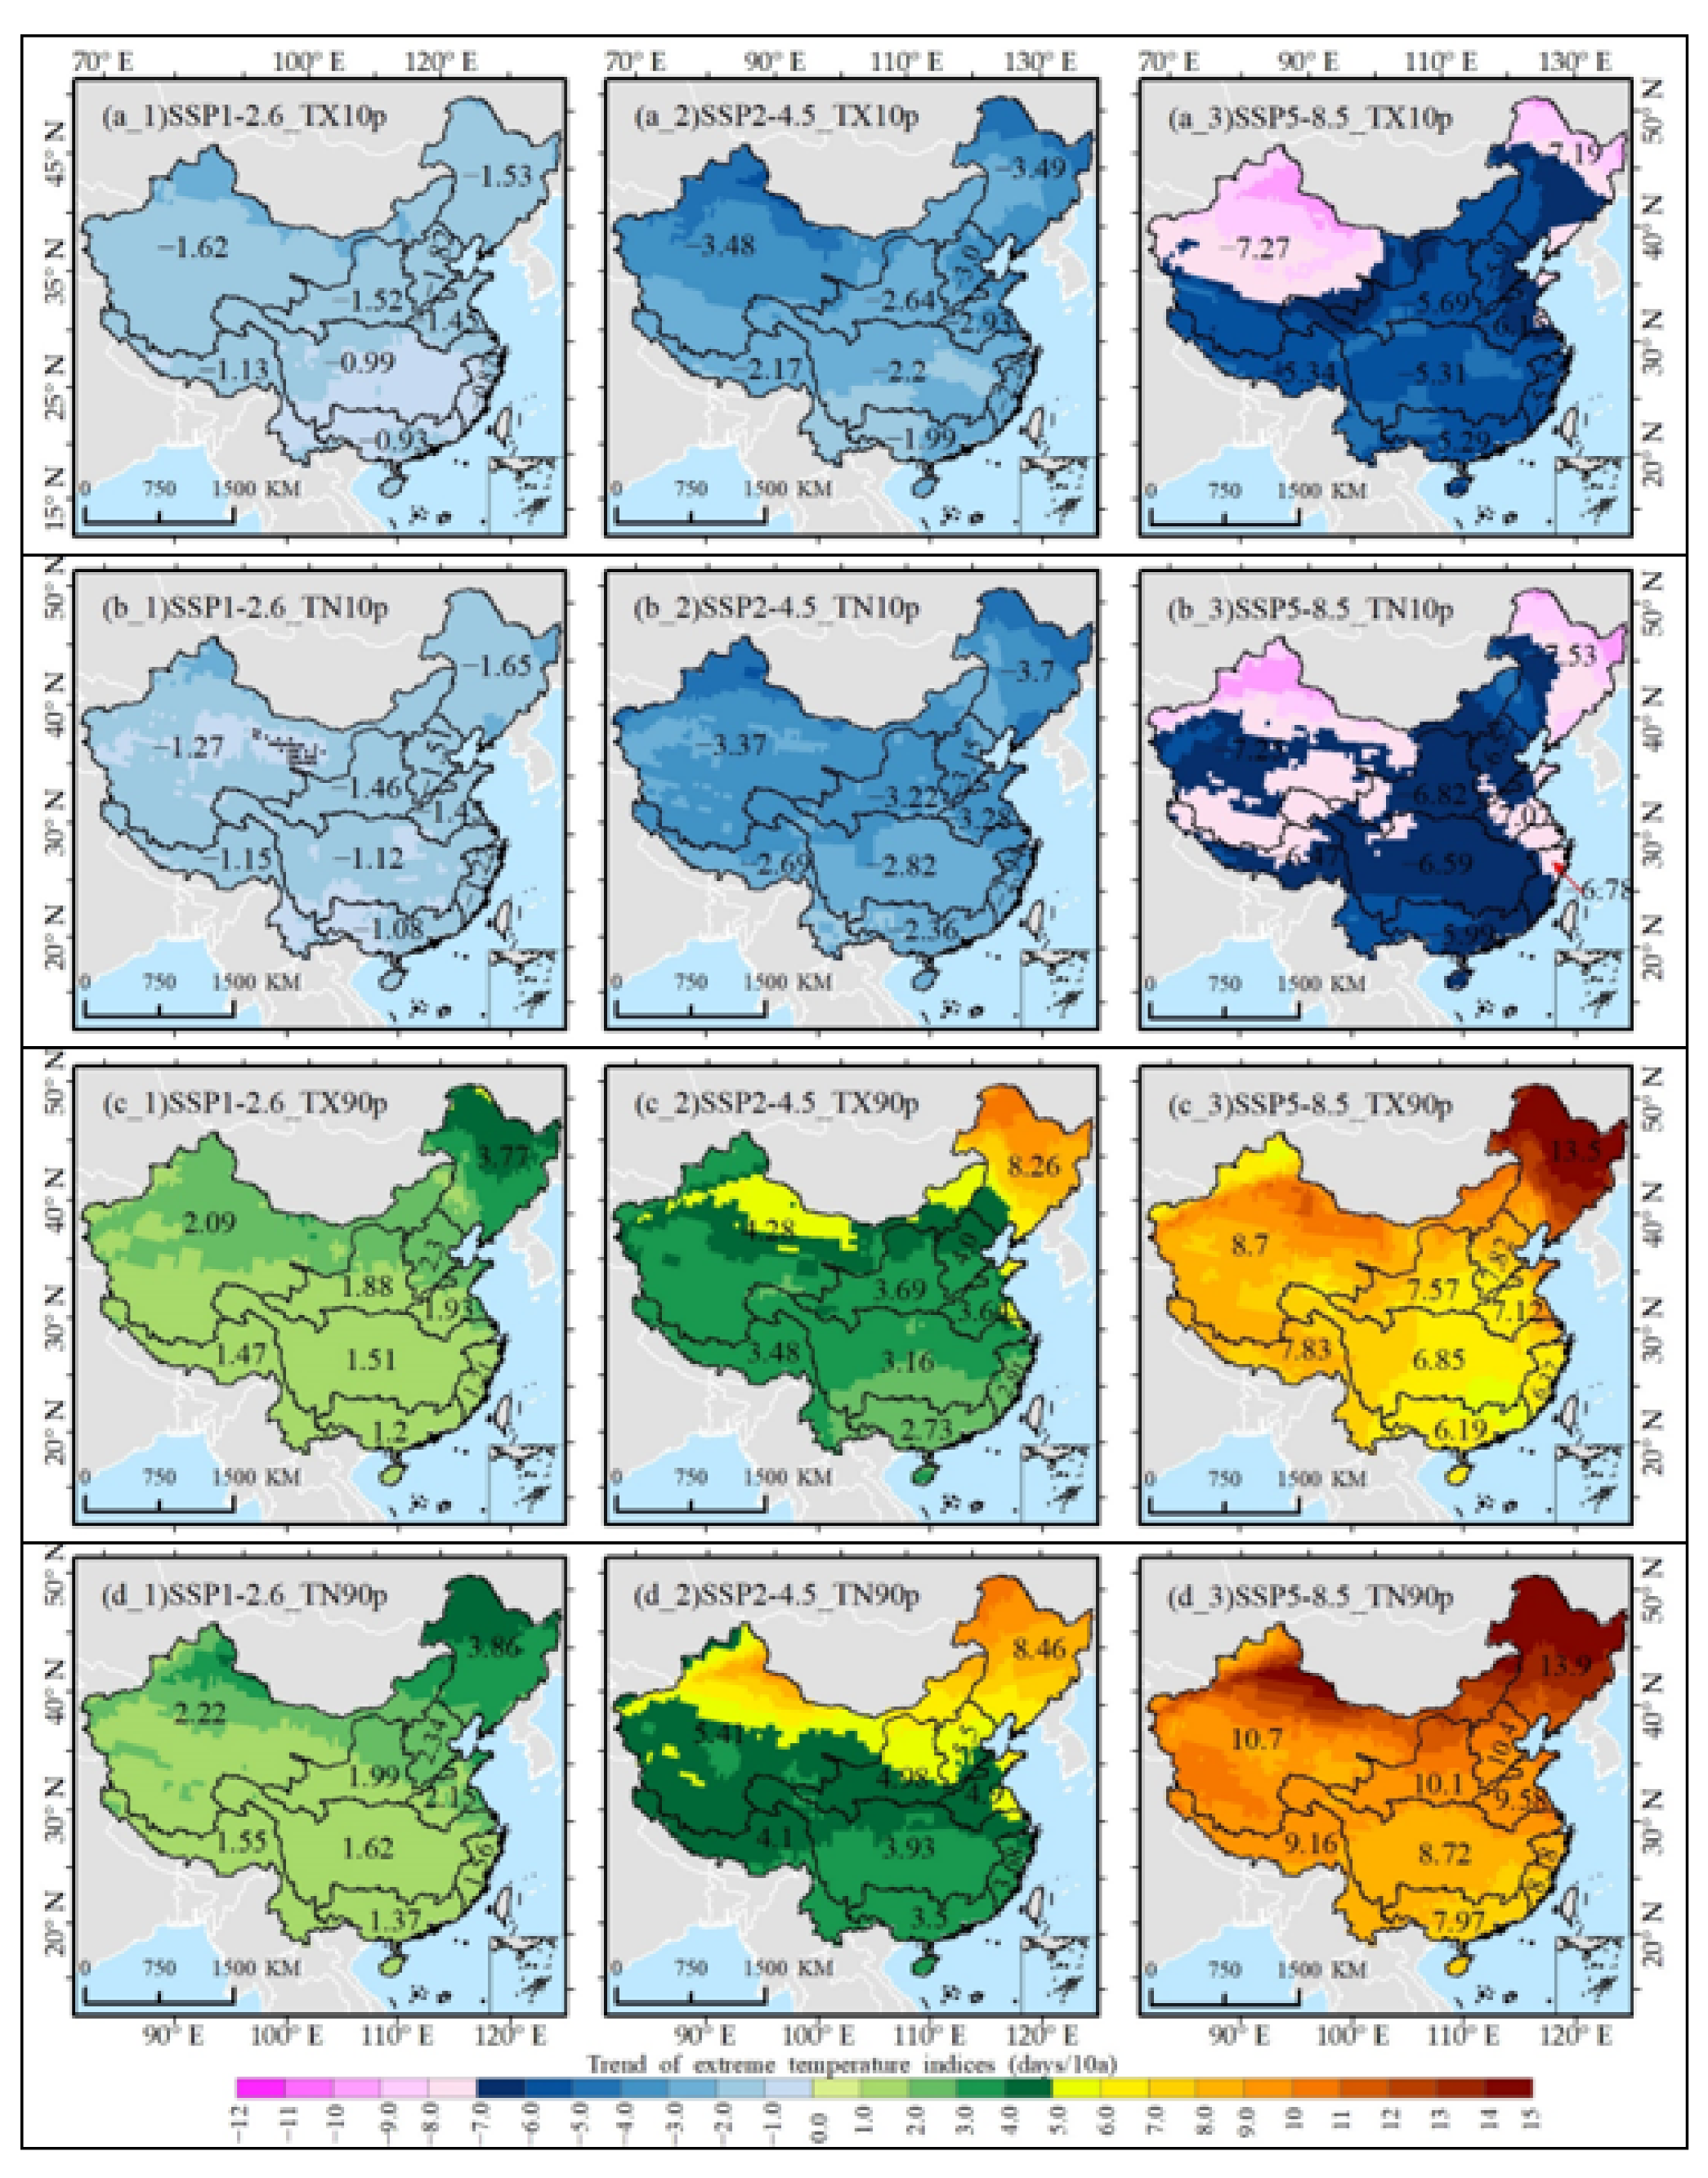
3.3.3. Spatial Variations in Extreme Temperature Events during Future Periods

Figure 8 shows the spatial distribution of the change trends of extreme temperature events in mainland China in multiple future scenarios. TX10p and TN10p decrease significantly in SSP1-2.6, and the rate of decrease in TX10p in the northern region is higher than that of TN10p, while the decrease rate in the southern and eastern regions is the opposite (Figure 8a-1,b-1). However, the decreasing trend gradually becomes larger under SSP2-4.5 and SSP5-8.5. Among them, the largest decrease in TX10p occurs in the Songhua and Liaohe River Basin, and the trends are −3.49 days/10a and −7.19 days/10a, respectively, followed by the Continental Basin, and the smallest decreasing trends occur in the Southeast Basin and Pearl River Basin (Figure 8a-2,a-3). TN10p still exhibits the most obvious decrease in the Songhua and Liaohe River Basin, with decreasing trends of −3.7 days/10a and −7.53 days/10a, respectively, followed by the Continental Basin, with decreasing trends of −3.37 days/10a and −7.25 days/10a, respectively (Figure 8b-2,b-3). In addition, under the three SSP scenarios, the reduction in extreme cold events in the central and northern basins of China is much higher than that in the southern basins, among which the Continental Basin and the Songhua and Liaohe River Basin have the largest reductions.
The trends of extreme warm events (TX90p and TN90p) under the three SSP scenarios are the same, but the variation ranges are quite different. TX90p and TN90p still change the most in the Continental Basin and Songhua and Liaohe River Basin, but unlike extreme cold events, extreme warm events change the most in the Songhua and Liaohe River Basin (3.77 days/10a and 3.86 days/10a), followed by the Continental Basin (2.09 days/10a and 2.22 days/10a) under SSP1-2.6 (Figure 8c-1,d-1). Under SSP2-4.5 and SSP5-8.5, TX90p and TN90p still increase most obviously in the Songhua and Liaohe River Basin, with trends of 8.26 days/10a and 8.46 days/10a, 13.5 days/10a and 13.9 days/10a, respectively (Figure 8c-2,d-2,c-3,d-3), followed by the Continental Basin, with trends of 4.28 days/10a and 5.41 days/10a, 8.7 days/10a, and 10.7 days/10a, respectively. Generally, for extreme warm events, the increases in the northern and western basins are much higher than those in the southern basins.

3.4. The Relative Importance of Extreme Temperature Events to the Change in Tmean

Table 3 shows that TN10p values in basins such as the Yangtze River, Haihe River, Huahe River, Yellow River, Continental, Songhua and Liaohe River, and Southwest River are the most important to the change in the Tmean in these areas. The absolute values of the standard regression coefficients are 0.33, 0.54, 0.56, 0.53, 0.34, 0.7, and 0.4, respectively, all of which were significant at the level of p < 0.05. In addition, according to this ranking of importance, the increase in the Tmean in these regions is related mainly to the decrease in the number of cold nights in this region. For the Pearl River Basin, TX10p is the most important (0.5) for the change in the Tmean. The extreme temperature event with the greatest influence on the Southeast Basin Tmean is TN90p (0.4), which indicates that the increase in Tmean in this area has a strong relationship with the increase in warm nights. Although the changes in the Tmean in most basins are affected by extreme cold events, TN90p has the greatest influence on the change in the Tmean at the mainland China scale (0.48), which indicates that the size of the spatial scale is particularly important for regional research.
Table 4 shows that the standard regression coefficients of the Tmean and TN90p in Yangtze River, Southeast Basin, Yellow River Basin and Pearl River Basin are the largest under the three SSP scenarios, and the values are significant at the level of p < 0.05. This means that the Tmean in these basins will be most affected by TN90p in the future, indicating that the Tmean in these areas will be most affected by the minimum temperature continuously in the future; unlike the historical period, the continuous increase in warm nights in the future will have an important impact on these areas. The future Tmean of the Haihe River Basin is continuously affected by extreme cold events under the SSP1-2.6 scenario, but unlike in the historical period, TX10p is the most influential factor. However, when the climate scenarios change to SSP2-4.5 and SSP5-8.5, the Tmean of this basin is most affected by TN90p. The Tmean of the Huaihe River Basin is influenced by TN90p under SSP1-2.6, while TX90p is the most affected under SSP2-4.5 and SSP5-8.5. Under the SSP1-2.6 scenario, the Tmean of the Continental Basin and Songhua and Liaohe River Basin is most affected by TN90p, and all are most affected by TX90p under SSP5-8.5. However, there is a large difference in SSP2-4.5. The Tmean of the Continental Basin is mainly influenced by TX10, while those of the Songhua and Liaohe River Basin are mainly influenced by TN10p, which further proves the importance of TN10p to the change in the Tmean in these two basins. The Southwest Basin is most affected by TX90p and TN90p under SSP1-2.6 and SSP2-4.5, respectively. However, when the climate scenario changes to SSP5-8.5, the change in the Tmean is still most affected by the decrease in TN10p, which indicates that the change in the Tmean is always most affected by TN10p, whether in the past or in the future. The Tmean at the mainland China scale is mainly affected by TN10p under the SSP1-2.6 scenario, while it is affected by TX90p under the SSP2-4.5 and SSP5-8.5 scenarios. This also shows that, with the increase in emission scenarios, the scale means of different river basins and mainland China are mainly affected by the increase in warm nights. These results also show that, with the increase in emission scenarios, Tmean values at the mainland China scale and different basin scales are mainly affected by the increase in warm nights.
Generally, during the historical period (1961–2013), the increase in Tmean at the mainland China scale and at different basin scales was mainly affected by the decrease in cold nights. However, with the gradual increase in emission scenarios in the future, the extreme temperature events that have the greatest influence on the increase in the Tmean in many basins will change from cold nights to warm nights, which indicates that the extreme temperature events that have the greatest influence on Tmean at the mainland China scale and different basin scales under different emission scenarios are quite different and further emphasized, and the importance of the spatial scale is further emphasized.

4. Discussion

During the past few decades, global warming has exerted great influence on the ecological environment at different regional scales, especially in the middle and high latitudes of the Northern Hemisphere [43,44]. In this study, we analyzed the temporal and spatial changes in Tmean and extreme temperature events at the mainland China scale and at different basin scales in the past (1961–2013) and future (2021–2100). In the past 53 years, the Tmean at the mainland China scale and different basin scales showed increasing trends, but the ranges of increase were quite different. The Tmean increases in basins located in the northeastern and northwestern regions are larger than that at the mainland China scale. The extreme cold events at the mainland China scale and different basin scales are decreasing, while the extreme warm events are increasing, and the changes are more significant in the northwestern and northeastern regions, which confirms that climate warming is more serious in arid, semiarid, grassland, and desert regions than in other regions [45,46,47]. The trends of extreme temperature events at the mainland China scale during the historical period are broadly similar to those observed globally, and the magnitude of change is significantly greater than that at the global scale [48]. In addition, the rate of increase in extreme warm events in mainland China is greater than the rate of decrease in extreme cold events, and the rates of change for warm nights and cold nights are much greater than those for in cold days and warm days. This indicates that the temperature increase in mainland China at nighttime is greater than that in daytime; that is, the rate of increase in Tmin is much higher than that of Tmax, which is consistent with the changes in the world [48] and many Asian countries [11,49], but larger than the global average change [48].
The outputs of CMIP6 are always biased and unable to project future climate changes and trends with great accuracy [50]. However, the multi-model mean is considered to avoid the disadvantages of single model simulation and, ultimately, to achieve the best climate and extreme climate projection at the regional scale [51,52]. A comparison of the Taylor diagrams reveals that there are significant differences in the simulation of extreme temperature events in mainland China among the 14 CMIP6 global climate models we selected, and that the best model for simulating extreme temperature events in mainland China is MME, which is consistent with previous research results [53]. The temporal and spatial variations in extreme temperature events in mainland China based on MME show that extreme cold events will continue to decrease, while extreme warm events will continue to increase in the future, and the ranges of change under SSP1-2.6, SSP2-4.5 and SSP5-8.5 are slow, fast, and extremely fast, respectively, which is different from the low (RCP2.6), medium (RCP4.5), and high (RCP8.5) scenarios of CMIP5 result [54]. The Tmean will continue to increase, and the frequency of extreme temperature events will also continue to increase, regardless of the emission scenario in the future. The change in Tmin-related extreme temperature events is still greater than that in Tmax-related extreme temperature events, indicating that the future will still be dominated by nighttime values, and that the warming rate will be much higher than that during the daytime. However, the differences between TN10p (TN90p) and TX10p (TX90p) under the three scenarios are smaller than in the past, which also shows that Tmin increases faster than Tmax in the historical period compared with the future. The same trend is seen for future extreme temperature events in Pakistan [55] and India [56], which are China’s neighbors. The extreme temperature events at the basin scale and at the mainland China scale are quite different. The variation range of the northern basins is larger than that at the mainland China scale, while the variation range of the southern basins is smaller than that at the mainland China scale. This difference may occur because most basins in the north are located in arid and semiarid areas, which are more vulnerable to climate change than humid areas in the south. The frequency of extreme temperature events in mainland China has been decreasing from north to south in the past and future, which also indicates that drought will continue in the future and that dry areas will continue to be dry in the future. The areas with the highest frequency of extreme temperature events in the future will be the Songhua and Liaohe River Basin in the northeast. This area should do a good job coping with climate change and reduce the losses caused by extreme temperature events, because this region is the main grain-producing area in China.
The extreme temperature event that played a major role in the Tmean in most basins was TN10p in the historical stage, while at the mainland China scale, TN90p had the greatest influence on the Tmean, which also emphasized the importance of spatial scale to regional research. However, the extreme temperature events that have an important impact on the Tmean in most basins will change from extreme cold events to extreme warm events under different emission scenarios in the future. At the mainland China scale, with the increasingly severe climate scenario, the extreme temperature events that have an important impact on the Tmean will change from TN10p to TN90p. This shows that the changes in Tmean at the mainland China scale and most basins in the past and future are mainly influenced by extreme temperature events related to Tmin.
Although the MME is considered to be the best in the study of regional climate change, we believe that there is still some uncertainty in this study. Various climate models are provided for many countries in CMIP6, and we apply only 14 models with historical data for the same years under SSP1-2.6, SSP2-4.5, and SSP5-8.5, which may also reduce the accuracy of the MME results. The spatial resolution of historical observation data used by us is 0.5° × 0.5°, which has limitations on the spatiotemporal trends of Tmean and extreme temperature event in small areas. Moreover, the production organization and resolution of each model are different. To match the model with the observation data, the resolution of all models is resampled to 0.5° × 0.5°, which may underestimate or overestimate the mean value at the mainland China scale.

5. Conclusions

In this study, we used mainland China observations of Tmax and Tmin, and 14 CMIP6 global climate models to analyze the temporal and spatial changes in extreme temperature events at the mainland China scale and different basin scales in the historical (1961–2013) and future periods (2021–2100). The extreme temperature events that played a leading role in the changes in Tmean at the mainland China scale and different basin scales in the historical and future periods were determined. The main conclusions are as follows:
(1)
Spatial scale is particularly important for regional research. From 1961 to 2013, Tmean showed an increasing trend at a rate of 0.27 °C/10a at the mainland China scale. TX10p and TN10p showed significant decreases at rates of −1.94 days/10a and −4.11 days/10a at the mainland China scale, while TX90p and TN90p showed significant increases at rates of 2.61 days/10a and 4.97 days/10a, respectively. The rate of increase in Tmean and extreme temperature events in the Continental Basin, Southwest Basin and Yellow River Basin were higher than those at the mainland China scale.
(2)
The MME is the best model for simulating extreme temperature events in mainland China. For the CMIP6 simulation of extreme temperature events in mainland China, among the single CMIP6 global climate models, the simulation with MME is the closest to the observed value.
(3)
Climate change in mainland China will continue to intensify in the future. Under the SSP1-2.6, SSP2-4.5, and SSP5-8.5 scenarios, Tmean at the mainland China scale will continue to increase at rates of 0.11 °C/10a, 0.31 °C/10a and 0.75 °C/10a, and the changes in the Continental Basin and Songhua and Liaohe River Basin will be larger than those at the mainland China scale. Extreme cold events will continue to decrease, while extreme warm events will continue to increase, with the largest changes in the Songhua and Liaohe River Basin, followed by the Continental Basin.
(4)
The extreme temperature events related to Tmin have an important influence on the changes in the mainland China Tmean. The extreme temperature event that had an important influence on the Tmean at the mainland China scale and at different basin scales was TN10p in the historical period. Under different SSP scenarios in the future, the TN90p will have an important influence on the Tmean at the mainland China scale and at different basin scales.

Author Contributions

Conceptualization, methodology, software, validation, H.Y.; data curation, writing—original draft preparation, and writing—review, Y.S.; visualization, supervision, project administration, Y.B. All authors have read and agreed to the published version of the manuscript.

Funding

This research was funded by [the Natural Science Foundation of Inner Mongolia Autonomous Region] grant number [2022LHQN04001], [the Science and Technology Projects in Inner Mongolia Autonomous Region] grant number [2022YFSH0027], and [the high-level talent introduction project of Inner Mongolia Normal University] grant number [2021YJRC015]. And the APC was funded by [the Key Action Project of “Science and Technology Prospering Inner Mongolia] grant number [2020ZD0028].

Institutional Review Board Statement

Not applicable.

Informed Consent Statement

Not applicable.

Data Availability Statement

The data that support the findings of this study are available upon request from the corresponding author.

Conflicts of Interest

The authors declare no conflict of interest.

References

  1. Arias, P.; Bellouin, N.; Coppola, E.; Jones, C.; Krinner, G.; Marotzke, J.; Naik, V.; Plattner, G.-K.; Rojas, M.; Sillmann, J.; et al. Climate Change 2021: The Physical Science Basis; Contribution of Working Group I to the Sixth Assessment Report of the Intergovernmental Panel on Climate Change; Technical Summary; IPCC: Geneva, Switzerland, 2021. [Google Scholar]
  2. Ipcc; Stocker, T.; Qin, D.; Plattner, G.-K.; Tignor, M.; Allen, S.K.; Boschung, J.; Nauels, A.; Xia, Y.; Bex, V.; et al. The physical science basis. Contribution of Working Group I to the Fifth Assessment Report of the Intergovernmental Panel on Climate Change. In Climate Change 2013; IPCC: Geneva, Switzerland, 2013. [Google Scholar]
  3. Ly, M.; Traore, S.; Alhassane, A.; Sarr, B. Evolution of some observed climate extremes in the West African Sahel. Weather Clim. Extrem. 2013, 1, 19–25. [Google Scholar] [CrossRef] [Green Version]
  4. Murray, V.; Mcbean, G.M.; Bhatt, M.; Borsch, S.; Suarez, A. Managing the risks of extreme events and disasters to advance climate change adaptation. J. Clin. Endocrinol. Metab. 2012, 487–542. [Google Scholar] [CrossRef]
  5. New, M.; Hewitson, B.; Stephenson, D.; Tsiga, A.; Kruger, A.; Manhique, A.; Gomez, B.; Coelho, S.; Masisi, D.; Kululanga, E.; et al. Evidence of trends in daily climate extremes over southern and west Africa. J. Geophys. Res. 2006, 111. [Google Scholar] [CrossRef]
  6. De los Milagros Skansi, M.; Brunet, M.; Sigró, J.; Aguilar, E.; Groening, J.A.A.; Bentancur, O.J.; Geier, Y.R.C.; Amaya, R.L.C.; Jácome, H.; Ramos, A.M.; et al. Warming and wetting signals emerging from analysis of changes in climate extreme indices over South America. Glob. Planet. Change 2013, 100, 295–307. [Google Scholar] [CrossRef]
  7. Schiermeier, Q. Droughts, heatwaves and floods: How to tell when climate change is to blame. Nature 2018, 560, 20–22. [Google Scholar] [CrossRef] [Green Version]
  8. Chen, Y.; Zhou, B.; Zhai, P.; Moufouma-Okia, W. Half-a-Degree Matters for Reducing and Delaying Global Land Exposure to Combined Daytime-Nighttime Hot Extremes. Earth's Future 2019, 7, 953–966. [Google Scholar] [CrossRef]
  9. Easterling, D.; Evans, J.; Groisman, P.; Karl, T.R.; Kunkel, K.; Ambenje, P. Observed Variability and Trends in Extreme Climate Events: A Brief Review. Bull. Am. Meteorol. Soc. 2000, 81, 417–426. [Google Scholar] [CrossRef] [Green Version]
  10. Zhang, X.; Alexander, L.; Hegerl, G.C.; Jones, P.; Tank, A.K.; Peterson, T.C.; Trewin, B.; Zwiers, F.W. Indices for monitoring changes in extremes based on daily temperature and precipitation data. Wiley Interdiscip. Rev. Clim. Change 2011, 2, 851–870. [Google Scholar] [CrossRef]
  11. Dong, S.; Sun, Y.; Aguilar, E.; Zhang, X.; Peterson, T.; Song, L.; Zhang, Y. Observed changes in temperature extremes over Asia and their attribution. Clim. Dyn. 2018, 51, 339–353. [Google Scholar] [CrossRef] [Green Version]
  12. Xi, Y.; Miao, C.; Wu, J.; Duan, Q.; Li, M. Spatiotemporal Changes in Extreme Temperature and Precipitation Events in the Three-Rivers Headwater Region, China. J. Geophys. Res. Atmos. 2018, 123, 5827–5844. [Google Scholar] [CrossRef]
  13. Alexander, L.; Zhang, X.; Peterson, T.C.; Caesar, J.; Ba, G.; Tank, A.; Haylock, M.; Collins, D.; Trewin, B.; Rahimzadeh, F.; et al. Global Observed Changes in Daily Climate Extremes of Temperature and Precipitation. J. Geophys. Res. 2006, 111. [Google Scholar] [CrossRef] [Green Version]
  14. Vincent, L.A.; Mekis, é. Changes in Daily and Extreme Temperature and Precipitation Indices for Canada over the Twentieth Century. Atmos. -Ocean 2006, 44, 177–193. [Google Scholar] [CrossRef] [Green Version]
  15. Ruml, M.; Gregorić, E.; Vujadinović, M.; Radovanović, S.; Stojičić, D. Observed changes of temperature extremes in Serbia over the period 1961–2010. Atmos. Res. 2017, 183, 26–41. [Google Scholar] [CrossRef]
  16. Filahi, S.; Tanarhte, M.; Mouhir, L.; Morhit, M.E.; Tramblay, Y. Trends in indices of daily temperature and precipitations extremes in Morocco. Theor. Appl. Climatol. 2016, 124, 959–972. [Google Scholar] [CrossRef]
  17. Supari; Tangang, F.; Juneng, L.; Aldrian, E. Observed changes in extreme temperature and precipitation over Indonesia. Int. J. Climatol. 2017, 37, 1979–1997. [Google Scholar] [CrossRef]
  18. Wang, B.; Macadam, I.; Alexander, L.; Abramowitz, G.; Yu, Q. Multi-model ensemble projections of future extreme temperature change using a statistical downscaling method in south eastern Australia. Clim. Change 2016, 138, 85–98. [Google Scholar] [CrossRef]
  19. Mutiibwa, D.; Vavrus, S.J.; Mcafee, S.A.; Albright, T.P. Recent spatiotemporal patterns in temperature extremes across conterminous United States. J. Geophys. Res. Atmos. 2015, 120, 7378–7392. [Google Scholar] [CrossRef]
  20. Powell, E.J.; Keim, B.D. Trends in Daily Temperature and Precipitation Extremes for the Southeastern United States: 1948–2012. J. Clim. 2015, 28, 1592–1612. [Google Scholar] [CrossRef]
  21. Lewis, S.C.; King, A.D. Evolution of mean, variance and extremes in 21st century temperatures. Weather Clim. Extrem. 2016, 15, 1–10. [Google Scholar] [CrossRef]
  22. Veronika, E.; Sandrine, B.; M Ee Hl, G.A.; Senior, C.A.; Bjorn, S.; Stouffer, R.J.; Taylor, K.E. Overview of the Coupled Model Intercomparison Project Phase 6 (CMIP6) experimental design and organization. Geosci. Model Dev. 2016, 9, 1937–1958. [Google Scholar]
  23. Van Vuuren, D.P.; Riahi, K.; Moss, R.; Edmonds, J.; Thomson, A.; Nakicenovic, N.; Kram, T.; Berkhout, F.; Swart, R.; Janetos, A.; et al. A proposal for a new scenario framework to support research and assessment in different climate research communities. Glob. Environ. Change 2012, 22, 21–35. [Google Scholar] [CrossRef] [Green Version]
  24. Wehner, M.; Gleckler, P.; Lee, J. Characterization of long period return values of extreme daily temperature and precipitation in the CMIP6 models: Part 1, model evaluation. Weather Clim. Extrem. 2020, 30, 100283. [Google Scholar] [CrossRef]
  25. Eyring, V.; Cox, P.; Flato, G.; Gleckler, P.; Abramowitz, G.; Caldwell, P.; Collins, W.; Gier, B.; Hall, A.; Hoffman, F.; et al. Taking climate model evaluation to the next level. Nat. Clim. Change 2019, 9, 102–110. [Google Scholar] [CrossRef] [Green Version]
  26. Kim, Y.-H.; Min, S.-K.; Zhang, X.; Sillmann, J.; Sandstad, M. Evaluation of the CMIP6 multi-model ensemble for climate extreme indices. Weather Clim. Extrem. 2020, 29, 100269. [Google Scholar] [CrossRef]
  27. Zhai, J.; Mondalb, S.K.; Fischerc, T.; Wang, Y.; Su, B.; Huang, J.; Tao, H.; Wang, G.; Ullah, W.; Uddin, M.J. Future drought characteristics through a multi-model ensemble from CMIP6 over South Asia. Atmos. Res. 2020, 246, 105111. [Google Scholar] [CrossRef]
  28. Su, B.; Huang, J.; Monda, S.K.; Zhai, J.; Wang, Y.; Wen, S.; Gao, M.; Lv, Y.; Jiang, S.; Jiang, T.; et al. Insight from CMIP6 SSP-RCP scenarios for future drought characteristics in China-ScienceDirect. Atmos. Res. 2020, 250, 105375. [Google Scholar] [CrossRef]
  29. Akinsanola, A.A.; Kooperman, G.J.; Reed, K.A.; Pendergrass, A.G.; Hannah, W.M. Projected changes in seasonal precipitation extremes over the United States in CMIP6 simulations. Environ. Res. Lett. 2020, 15, 104078. [Google Scholar] [CrossRef]
  30. Tian, J.; Zhang, Z.; Ahmed, Z.; Zhang, L.; Jiang, T. Projections of precipitation over China based on CMIP6 models. Stoch. Environ. Res. Risk Assess. 2021, 35, 1–18. [Google Scholar] [CrossRef]
  31. Li, S.Y.; Miao, L.J.; Jiang, Z.H.; Wang, G.J.; Gnyawali, K.R.; Zhang, J.; Zhang, H.; Fang, K.; He, Y.; Li, C. Projected drought conditions in Northwest China with CMIP6 models under combined SSPs and RCPs for 2015–2099. EconStor Open Access Artic. 2020, 11, 210–217. [Google Scholar] [CrossRef]
  32. Yihui, D.; Guoyu, R.; Guangyu, S.; Peng, G.; Xunhua, Z.; Panmao, Z. China’s National Assessment Report on Climate Change (I): Climate change in China and the future trend. Clim. Change Res. 2007, 3, 1–05. [Google Scholar]
  33. Ren, G.; Feng, G.; Yan, Z. Progresses in observation studies of climate extremes and changes in mainland China. Clim. Environ. Res. 2010, 15, 337–353. [Google Scholar]
  34. Ying, H.; Zhang, H.; Zhao, J.; Shan, Y.; Deng, G. Effects of spring and summer extreme climate events on the autumn phenology of different vegetation types of Inner Mongolia, China, from 1982 to 2015. Ecol. Indic. 2020, 111, 105974. [Google Scholar] [CrossRef]
  35. Ding, Z.; Wang, Y.; Lu, R. An analysis of changes in temperature extremes in the Three River Headwaters region of the Tibetan Plateau during 1961–2016. Atmos. Res. 2018, 209, 103–114. [Google Scholar] [CrossRef]
  36. You, Q.; Kang, S.; Aguilar, E.; Pepin, N.; Flügel, W.-A.; Yan, Y.; Xu, Y.; Zhang, Y.; Huang, J. Changes in daily climate extremes in China and their connection to the large scale atmospheric circulation during 1961–2003. Clim. Dyn. 2011, 36, 2399–2417. [Google Scholar] [CrossRef]
  37. Sun, W.; Mu, X.; Song, X.; Wu, D.; Cheng, A.; Qiu, B. Changes in extreme temperature and precipitation events in the Loess Plateau (China) during 1960-2013 under global warming. Atmos. Res. 2016, 168, 33–48. [Google Scholar] [CrossRef]
  38. Yu, Z.; Li, X. Recent trends in daily temperature extremes over northeastern China (1960–2011). Quat. Int. 2014, 380, 35–48. [Google Scholar] [CrossRef]
  39. Jiang, Z.; Song, J.; Li, L.; Chen, W.; Wang, Z.; Wang, J. Extreme climate events in China: IPCC-AR4 model evaluation and projection. Clim. Change 2012, 110, 385–401. [Google Scholar] [CrossRef]
  40. You, Q.; Min, J.; Zhang, W.; Pepin, N.; Kang, S. Comparison of multiple datasets with gridded precipitation observations over the Tibetan Plateau. Clim. Dyn. 2014, 45, 791–806. [Google Scholar] [CrossRef]
  41. Taylor, K. Summarizing multiple aspects of model performance in a single diagram. J. Geophys. Res. 2001, 106, 7183–7192. [Google Scholar] [CrossRef]
  42. Sen; Kumar, P. Estimates of the Regression Coefficient Based on Kendall's Tau. Publ. Am. Stat. Assoc. 1968, 63, 1379–1389. [Google Scholar] [CrossRef]
  43. Bao, G.; Jin, H.; Tong, S.; Chen, J.; Huang, X.; Bao, Y.; Shao, C.; Mandakh, U.; Chopping, M.; Du, L. Autumn Phenology and Its Covariation with Climate, Spring Phenology and Annual Peak Growth on the Mongolian Plateau. Agric. For. Meteorol. 2021, 298–299, 108312. [Google Scholar] [CrossRef]
  44. Zhao, J.; Zhang, H.; Zhang, Z.; Guo, X.; Li, X.; Chen, C. Spatial and Temporal Changes in Vegetation Phenology at Middle and High Latitudes of the Northern Hemisphere over the Past Three Decades. Remote Sens. 2015, 7, 10973–10995. [Google Scholar] [CrossRef] [Green Version]
  45. Shen, X.; Liu, Y.; Liu, B.; Zhang, J.; Wang, L.; Lu, X.; Jiang, M. Effect of shrub encroachment on land surface temperature in semi-arid areas of temperate regions of the Northern Hemisphere. Agric. For. Meteorol. 2022, 320, 108943. [Google Scholar] [CrossRef]
  46. Shen, X.; Liu, B.; Henderson, M.; Wang, L.; Jiang, M.; Lu, X. Vegetation greening, extended growing seasons, and temperature feedbacks in warming temperate grasslands of China. J. Clim. 2022, 35, 5103–5117. [Google Scholar] [CrossRef]
  47. Liu, X.; Ma, Q.; Yu, H.; Li, Y.; Li, L.; Qi, M.; Wu, W.; Zhang, F.; Wang, Y.; Zhou, G.; et al. Climate warming-induced drought constrains vegetation productivity by weakening the temporal stability of the plant community in an arid grassland ecosystem. Agric. For. Meteorol. 2021, 307, 108526. [Google Scholar] [CrossRef]
  48. Donat, M.G.; Alexander, L.V.; Yang, H.; Durre, I.; Vose, R.; Dunn, R.J.H.; Willett, K.M.; Aguilar, E.; Brunet, M.; Caesar, J.; et al. Updated analyses of temperature and precipitation extreme indices since the beginning of the twentieth century: The HadEX2 dataset. J. Geophys. Res. 2013, 118, 2098–2118. [Google Scholar] [CrossRef]
  49. Choi, G.; Collins, D.; Ren, G.; Trewin, B.; Baldi, M.; Fukuda, Y.; Karori, M.; Pianmana, T.; Gomboluudev, P.; Huong, P.; et al. Changes in means and extreme events of temperature and precipitation in the Asia-Pacific Network region, 1955-2007. Int. J. Climatol. 2009, 29, 1906–1925. [Google Scholar] [CrossRef]
  50. Lafon, T.; Dadson, S.; Buys, G.; Prudhomme, C. Bias correction of daily precipitation simulated by a regional climate model: A comparison of methods. Int. J. Climatol. 2013, 33, 1367–1381. [Google Scholar] [CrossRef] [Green Version]
  51. Li, T.; Jiang, Z.; Treut, H.; Li, L.; Zhao, L.; Ge, L. Machine learning to optimize climate projection over China with multi-model ensemble simulations. Environ. Res. Lett. 2021, 16, 094028. [Google Scholar] [CrossRef]
  52. Song, Z.; Xia, J.; She, D.; Li, L.; Hu, C.; Hong, S. Assessment of meteorological drought change in the 21st century based on CMIP6 multi-model ensemble projections over mainland China. J. Hydrol. 2021, 601, 126643. [Google Scholar] [CrossRef]
  53. Han, J.; Miao, C.; Duan, Q.; Wu, J.; Lei, X.; Liao, W. Variations in start date, end date, frequency and intensity of yearly temperature extremes across China during the period 1961–2017. Environ. Res. Lett. 2020, 15, 045007. [Google Scholar] [CrossRef]
  54. Li, L.; Yao, N.; Li, Y.; Liu, D.L.; Wang, B.; Ayantobo, O.O. Future projections of extreme temperature events in different sub-regions of China. Atmos. Res. 2019, 217, 150–164. [Google Scholar] [CrossRef]
  55. Ali, S.; Eum, H.-I.; Cho, J.; Dan, L.; Khan, F.; Dairaku, K.; Shrestha, M.L.; Hwang, S.; Nasim, W.; Khan, I.A.; et al. Assessment of climate extremes in future projections downscaled by multiple statistical downscaling methods over Pakistan. Atmos. Res. 2019, 222, 114–133. [Google Scholar] [CrossRef]
  56. Dash, S.K.; Saraswat, V.; Panda, S.K.; Pattnayak, K.C. Temperature extremes and their future projections in selected Indian cities along with their meteorological subdivisions and temperature homogeneous zones. Urban Clim. 2022, 41, 101057. [Google Scholar] [CrossRef]
Figure 1. Spatial distribution of the Tmean trend in mainland China (a) and interannual trend of Tmean in mainland China (b) from 1961 to 2013. (The letters in figure (a): A—Songhua and Liaohe River basin, B—Haihe River basin, C—Huaihe River basin, D—Yellow River basin, E—Yangtze River basin, F—Pearl River basin, G—Southeast basin, H—Southwest basin, I—Continental basin. The numbers in map (a) are the average values of all pixels in the corresponding basin and represent the mean trend of Tmean in the corresponding basin, while black dots mean that the trends are not significant, i.e., p > 0.05. The black line in (b) represents the Tmean series, and it is the average values of all pixels in mainland China; the red line represents the trend; the transparent red band indicates the 95% confidence interval; the blue line represents the mean value.
Atmosphere 13 01127 g001
Figure 2. Interannual trends of (a) TX10p, (b) TN10p, (c) TX90p, (d) TN90p in mainland China from 1961 to 2013. The black line represents the extreme temperature indices series, the red line represents the trend, the transparent red band indicates a 95% confidence interval, and the blue line represents the mean value.
Atmosphere 13 01127 g002
Figure 3. Spatial distribution of linear trend of (a) TX10p, (b) TN10p, (c) TX90p, (d) TN90p in mainland China during 1961–2013. The numbers in the map represent the trends of extreme temperature events in the corresponding basins, while black dots indicate that the trends are not significant, i.e., p > 0.05.
Atmosphere 13 01127 g003aAtmosphere 13 01127 g003b
Figure 4. Taylor diagrams of TX10p (a), TN10p (b), TX90p (c), and TN90p (d) (ref is the extreme climate index calculated from historical observed values; MME represents the mean of 14 CMIP6 climate models).
Atmosphere 13 01127 g004
Figure 5. The interannual trends of Tmean at the mainland China scale under different SSP scenarios from 2021 to 2100 based on MME. The curves represent time series values, straight lines represent trends, dotted lines represent mean values, and green, blue, and purple represent SSP1-2.6, SSP2-4.5, and SSP5-8.5, respectively.
Atmosphere 13 01127 g005
Figure 6. Spatial distribution of the trend of Tmean in mainland China under (a) SSP1-2.6, (b) SSP2-4.5, (c) SSP3-8.5 scenarios from 2021 to 2100 based on MME.
Atmosphere 13 01127 g006
Figure 7. The interannual trends of (a) TX10p, (b) TN10p, (c) TX90p, (d) TN90p in mainland China in different SSP scenarios from 2021 to 2100 based on MME. (The curves represent time series values, which are the average values of all pixels in mainland China, straight lines represent trends, dotted lines represent mean values, and green, blue, and purple represent SSP1-2.6, SSP2-4.5 and SSP5-8.5, respectively).
Atmosphere 13 01127 g007aAtmosphere 13 01127 g007b
Figure 8. Spatial distribution of the trend of (a_1) SSP1-2.6_TX10p, (a_2) SSP2-4.5_TX10p, (a_3) SSP5-8.5_TX10p, (b_1) SSP1-2.6_TN10p, (b_2) SSP2-4.5_TN10p, (b_3) SSP5-8.5_TN10p, (c_1) SSP1-2.6_TX90p, (c_2) SSP2-4.5_TX90p, (c_3) SSP5-8.5_TX90p, (d_1) SSP1-2.6_TN90p, (d_2) SSP2-4.5_TN90p, (d_3) SSP5-8.5_TN90p in mainland China under three SSP scenarios from 2021 to 2100 based on MME. The numbers in maps represent the extreme temperature events in the corresponding basin, while black dots indicate that the trends are not significant, i.e., p > 0.05).
Atmosphere 13 01127 g008
Table 1. Basic information of the 14 selected models in the CMIP6.
ModelModeling Center (or Group), CountryResolution (Lon × Lan)
ACCESS-CM2Commonwealth Scientific and Industrial Research Organisation, Australia192 × 144
ACCESS-ESM1-5
CanESM2Canadian Centre for Climate Modelling and Analysis, Canada128 × 64
EC-Earth3Agencia Estatal de Meteorología, Spain; The Swedish Meteorological and Hydrological Institute, Sweden and 30 other institutes512 × 256
EC-Earth3-Veg
EC-Earth3-Veg-LR
FGOALS-G2Institute of Atmospheric Physics, Chinese Academy of Sciences, China180 × 80
INM-CM4-8Institute for Numerical Mathematics, Russian180 × 120
INM-CM5-0
IPSL-CM6A-LRInstitut Pierre Simon Laplace, France144 × 143
MIROC6Japan Agency for Marine-Earth Science and Technology, Atmosphere and Ocean Research Institute, and National Institute for Environmental Studies, Japan256 × 128
MPI-ESM1-2-HRMax Planck Institute for Meteorology, Germany384 × 192
MPI-ESM1-2-LR
MRI-ESM2-0Meteorological Research Institute, Japan320 × 160
Table 2. Extreme temperature indices selected for this study, with the indicator names, definitions, and units.
IndicesNameDescriptionUnit
TX10pCool daysNumber of days when Tmax < 10th percentiled (Days)
TN10pCool nightsNumber of days when Tmin < 10th percentiled (Days)
TX90pWarm daysNumber of days when Tmax > 90th percentiled (Days)
TN90pWarm nightsNumber of days when Tmin > 90th percentiled (Days)
Table 3. Standard regression coefficient between extreme temperature events and Tmean in different basins in mainland China from 1961 to 2013 based on observation data.
AreaTX10PTN10PTX90PTN90P
Yangtze River Basin−0.3 **−0.33 **0.29 **0.29 **
Southeast Basin−0.33 **−0.35 **0.160.42 **
Haihe River Basin−0.13−0.54 **0.28 **0.22 *
Huaihe River Basin−0.17 *−0.56 **0.22*0.30 **
Yellow River Basin−0.08−0.53 **0.33 **0.22 **
Continental Basin−0.19 *−0.34 **0.30 **0.33 **
Songhua and Liaohe River Basin−0.03−0.7 **0.110.29 *
Southwest Basin−0.24 **−0.40 **0.17 *0.32 **
Pearl River Basin−0.5 **−0.27 **0.23 *0.33 **
China−0.01−0.350.060.48 **
Note: Bold means the absolute value of the standard regression coefficient is the largest, ** indicates that the coefficient is significant at p < 0.01, and * indicates that the coefficient is significant at p < 0.05.
Table 4. Standard regression coefficient between extreme temperature events and Tmean in different basins in mainland China from 2021 to 2100 based on MME.
AreaSSP1-2.6SSP2-4.5SSP5-8.5
TX10PTN10PTX90PTN90PTX10PTN10PTX90PTN90PTX10PTN10PTX90PTN90P
Yangtze River Basin−0.39 *0.10.070.65 **−0.04−0.31 *0.130.53 **0.12−0.39 **0.230.5 **
Southeast Basin−0.19−0.17−0.060.69 **−0.01−0.35−0.080.71 **0.11−0.40 **−0.010.71 **
Haihe River Basin0.50 **−0.060.23 *0.22 *−0.22 **−0.170.070.68 **−0.27 **−0.26 **0.22 **0.27 **
Huaihe River Basin−0.190.180.080.57 **−0.24 *−0.150.6 **0.02−0.19−0.130.38 **0.31 *
Yellow River Basin−0.33 **−0.10.22 **0.38 **−0.17 **−0.24 **0.17 **0.73 **−0.20 **−0.21 **0.28 **0.31 **
Continental Basin0.06−0.34 *0.260.44 **−0.54 **0.120.260.34 *−0.22−0.160.4 **0.23
Songhua and Liaohe River Basin0.42−0.71−0.170.760.66−0.93 *−0.070.780.09−0.610.780.29
Southwest Basin−0.310.320.430.060.14−0.32 *−0.130.94 **0.32 **−0.57 **0.42 *0.33
Pearl River Basin−0.6 **0.380.040.68 **0.05−0.32−0.120.79 **0.12−0.37−0.240.95 **
China0.09−0.45 **0.20.44 **−0.27 *−0.150.31 **0.27−0.28 *−0.180.54 **0.00
Note: Bold means the absolute value of the standard regression coefficient is the largest, ** indicates that the coefficient is significant at p < 0.01, and * indicates that the coefficient is significant at p < 0.05.
Publisher’s Note: MDPI stays neutral with regard to jurisdictional claims in published maps and institutional affiliations.

