Abstract
Based on hourly precipitation data from 2413 national ground observation stations in China and ERA5 (0.25° × 0.25°), this study analyzes the characteristics and causes of extreme rainfall and snow in northeast China from 17–19 November 2020. The results show that extreme precipitation is mainly attributed to the abnormally strong large-scale low vortex and ground cyclone. The significant high-level and low-level coupling in areas with strong rain and snow is conducive to the continuous upward motion, which provides favorable dynamic conditions for the generation and development of extreme precipitation. The frontogenesis effect below the 850 hPa level is obvious, and the extreme precipitation period corresponds to the meeting of the north and south front areas. The symmetrical unstable atmosphere of 925 hPa~700 hPa is forced by the frontogenesis, which strengthens the oblique rising of the low layer and increases the instability, leading to the strengthened development of precipitation. For heavy rainfall and snow in early winter in China, water vapor transport is crucial. The extremely strong low-level jet also provides extremely strong water vapor conditions for the occurrence of heavy rain and snow. The analysis of the extreme rain and snow characteristics and formation mechanism of this weather process can deepen the understanding of extreme weather processes, and provide a useful reference for the research and prediction of extreme precipitation processes.
1. Introduction
Snow in northeast China occurs in all seasons except summer. Blizzard weather often has a serious impact on transportation, as well as agricultural and animal husbandry production. Currently, researchers in China have conducted many studies on winter snow in northeast China. Based on the winter half-year blizzard data of 50 meteorological stations north of 40° N in China for 21 years (1980–2000), Hu [1] analyzed the temporal and spatial distribution of winter half-year snow in middle and high latitudes statistically, and found that early winter and early spring were the frequent periods of blizzards in northern China. There are relatively few blizzards in the middle of winter. The Changbai mountain area is one of the main places where blizzards occur in northern China. Dong et al. [2] analyzed the spatial and temporal distribution characteristics of blizzards in northeast China from 1958–2007, and found that spring (March–April) and autumn (October–November) were the main blizzard periods. According to the spatial distribution of blizzards in northeast China, it mainly occurs in the Changbai mountain area in the southeast, Liaodong Peninsula in the south, and Daxing’an mountain area in the northwest.
Extratropical cyclones are a very important weather system that causes blizzards in northeast China (Zhao [3], Yan et al. [4], Fu et al. [5]). Due to its long duration and wide range, extreme snowfall usually causes severe disasters. For example, the extremely heavy blizzard weather in many places in northeast China from 3–5 March 2007, and the extremely heavy blizzard weather in Heilongjiang province on 24–26 November 2013 were all caused by the development of the northbound Jianghuai cyclone. Winter blizzard conditions in Europe and the United States are also usually closely related to extratropical cyclones. Martin [6,7] showed that the structure and causes of the warm prison layer and the middle layer of the troposphere to the ground was opposite to the typical prison front formation process. Grim Class [8] analyzed the two different in-situ and high-level structures in winter, which are different from the classical cyclone. Sheng et al. [9] and Wang et al. [10] showed that symmetrical asymmetric develops in extratropical cyclonic snowfall. Yang et al. [11] analyzed the large-scale rain and snow weather in north China from 3–4 November 2012 and found that the conditionally symmetrical and unstable atmosphere junction in the blizzard zone, and the front effect is more conducive to the generation of blizzards. Wang et al. [12] did the characteristic analysis of an extreme snowfall process in northeastern Inner Mongolia, and found that the intersection of water vapor transport from multiple different sources had an important impact on the occurrence and maintenance of blizzards. Wang et al. [13] also found that water vapor from the east China sea and Bohai sea provided water vapor conditions for blizzard production in northeast China. Liu et al. [14] showed that the terrain forced uplift and the middle- and low-layer fronts promote blizzard production. Extratropical cyclone snowfall phase is complex, and rain and snow phases often change in the precipitation process [15,16,17].
From 17–19 November 2020, under the joint influence of low vortex, ground cyclones, and southwest rapids, heavy rain and snow occurred in northeast China; heavy snow occurred in Heilongjiang and Jilin; freezing rain in Jilin; and heavy rain in Liaoning. The rain and snowfall had the following characteristics: a wide influence range, strong intensity, deep-new-snow depth, a complex precipitation phase; additionally, this was historically rare in the same period, and had a heavy impact on transportation, power and communication, energy supply, facility agriculture, animal husbandry and so on. From 18–19 November, Inner Mongolia, Heilongjiang, Liaoning, Jilin and other places suffered from snow disasters, storms, and low-temperature freezing disasters, resulting in the death of some livestock, the destruction of some houses and infrastructure to varying degrees, and the suspension of classes for primary and secondary school students in many places. The freezing rain caused damage to the power facilities in Jilin Province and the interruption of communication service base stations in many places. It led to the overall closure of highways in Jilin Province and the shutdown of most passenger and tourism charters. Heilongjiang Harbin airport was closed, and more than 200 flights were canceled. The freezing rain also caused the overall closure of highways in Jilin Province, and most of the passenger and tourist charters on the lines were out of service. The extreme characteristics of precipitation in this weather process are prominent; the phase of rain and snow is complex, and blizzards, rainstorms, and freezing rain coexist, so it is difficult to predict. It is hoped that by analyzing the extreme rain and snow characteristics and formation mechanism of this weather process, we can enhance our understanding of this kind of weather process, and provide a useful reference for the research and prediction of extreme heavy precipitation processes.
This paper analyzes the extreme rain and snow weather process in northeast China from 17–19 November 2020, focusing on the dynamic and water vapor conditions of extreme precipitation under the background of synoptic scale circulation.
2. Data and Method
2.1. Data
The data include: the hourly precipitation of 2413 national ground observation stations in China, which is used to calculate the distribution of cumulative precipitation; ECMWF Reanalysis v5 (ERA5) data covering the period from January 1950 to present and the earth on a 25 km grid, and resolve the atmosphere using 137 levels from the surface up to a height of 80 km. It is used to analyze large-scale circulation, environmental conditions, and extreme characteristics.
2.2. Method
Calculate extreme characteristics using the standardized abnormality method. The expression of standardized abnormality (SD) is
SD = (F − M)/σ
In the Formula (1): F is a variable value at a certain time (such as 850 hPa water vapor flux); M is the climate average value of 30 years of variable field; and σ is the climatic standard deviation of 30 years of the variable field. Climate field is calculated with ERA5 (0.25° × 2.5°) data from 1990 to 2019, and 21 days moving average was carried out.
3. The Extreme Characteristics of Rain, Snow and Freezing
Snow, sleet, or rain occurred in most parts of Heilongjiang, Jilin, and Liaoning provinces on Monday. Heavy snow and blizzard occurred in the east and south of Heilongjiang province and the northwest of Jilin province (Figure 1), the cumulative snowfall in Harbin, Mudanjiang, Qitaihe and Jixi of Heilongjiang province was 20~55 mm. Rain, sleet, or rain-to-snow occurred in the middle-east of Jilin and the middle-east of Liaoning, with a cumulative precipitation of 25~80 mm; the maximum cumulative precipitation in Kuandian of Liaoning province was 141.2 mm. The total number from related national meteorological observation stations in Heilongjiang, Jilin, and Liaoning province was 124 mm, which exceeded the historical extreme value of November since the meteorological record. From the 18th to 19th, the depth of newly added snow in the south of Heilongjiang province, and west and middle of Jilin province exceeded 10 cm; in some areas it exceeded 20 cm.
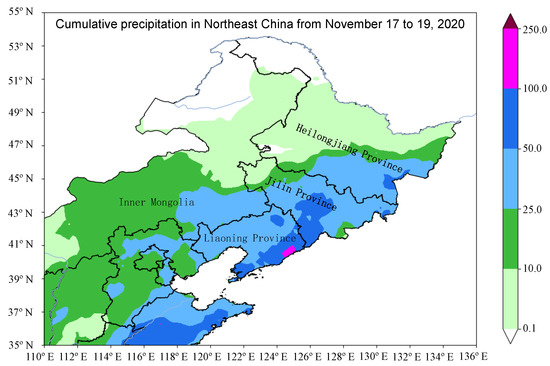
Figure 1.
Cumulative precipitation in northeast China from 17 to 19 November 2020 (fill color, unit: mm).
Regarding the daily evolution of the rain and snow boundary, on the 17th, the rain and snow boundary was located in the south of Heilongjiang, the west of Jilin, and the southeast of Inner Mongolia. On the 18th, the rain and snow boundary moved eastwards, from the middle of Jilin to the middle of Liaoning. On the 19th, most of the three northeastern provinces turned to snow, and the rain and snow boundary was located from the east of Jilin to the east of Liaoning. From the perspective of the whole process, the southeast of Heilongjiang and the west of Jilin mainly experienced snowfall, the central part of Jilin was covered with snow, sleet, or rain-to-snow, and some parts of Jilin also had freezing rain; other areas mainly experienced rainfall.
The precipitation phase of some central and western parts of Jilin in the process is particularly complex. Yang et al. [18] showed that the transition of the precipitation phase depended on the temperature status of the entire tropospheric low layer (850–950 hPa). Take Changchun as an example: the rain began on the evening of the 17th, freezing rain occurred around 17:00 on the 18th, the ground temperature was −0.7 °C, sleet occurred at 20:00 on the 18th, sleet then turned to pure snow (heavy snow) around 04:00, the ground temperature dropped from −0.7 °C to −2.7 °C then to −5.1 °C later between 02:00 to 08:00 on the 19th, and the snow ended at 05:00 on the 20th. At 11:00 on the 18th, the wind field below 925 hPa was strengthened, and the freezing layer temperature dropped to −2 °C. At 17:00, the layer of −2 °C was very shallow, which changed from rainfall to freezing rain, then 850–925 hPa wind speed increased and exceeded 16 m/s, and the temperature and thickness of the freezing layer turned to sleet. At 02:00 on the 19th, the ground temperature dropped sharply, the freezing layer thickness and temperature decreased further, and sleet turned to snow until the morning of 20th. According to the above analysis, the thickness and temperature of the freezing layer below 925 hPa are the main factors that determine the coexistence of freezing rain and sleet.
4. Analysis of the Causes of Extreme Precipitation
The extreme precipitation occurred under the synoptic scale circulation background of the lower tropospheric vortex and surface cyclone in front of the short wave trough in the middle troposphere. There was a significant wind convergence and southwest jet in front of the low vortex and the surface cyclone, which provided good conditions for dynamic uplift and water vapor transport for the extreme precipitation.
4.1. Atmospheric Circulation Background
From 1 to 15 November, the AO index in 1000 hPa height field was in the positive phase, corresponding to the weak large trough in East Asia, Siberia, and high latitudes, and the cold air force affecting northern China was also weak. At this time, the temperature in northeast China was significantly higher than is typical for that time of the year. After the 16th, the middle- and high-level circulation situation began to turn around, the west wind index was lower than the average climate value; the adjustment of the circulation from latitudinal to radial was conducive to the cold southward air affecting northeast China. In addition, it can be seen from the MJO observation that it was located in the secondary and tertiary quadrant, which was conducive to the development and deepening in the eastward migration of the south trough. After being superimposed with the mid-latitude westerly trough, the water vapor from the tropics was transported to the northeast region, which was conducive to the occurrence of heavy precipitation.
At 08:00 on November 18, the high-level trough was located from the east of northwest China to the east of Sichuan Basin, and the south of northeast China was in the southwest air flow in front of the high-level trough. There is a low vortex in the south of north China at 850 hPa, and the southwest jet on the right side of the low vortex had the strongest intensity, reaching 24 m/s. The center of the surface cyclone is located near the northwest of Shandong. The low vortex and surface cyclone move towards the northeast under the guidance of the southwest air flow in front of the high trough (Figure 2). At 08:00 on the 19th, the surface cyclone was located in the east of Jilin. At 11:00 on the 19th, it moved to the sea southwest of the sea of Japan, and the precipitation process ended.
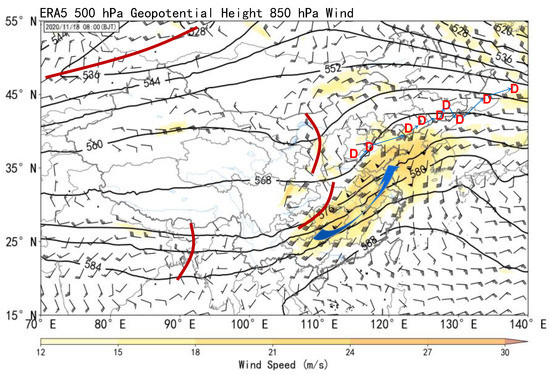
Figure 2.
500 hPa height field (black isoline, brown line is trough line) and 850 hPa wind field at 08:00 on 18 November, the blue arrow line is 850 hPa jet core, “D” is the center of ground low pressure every 6 h from 08:00 on 18 November to 08:00 on 20 November.
The standardized abnormality of the height field and sea-level air pressure fields were analyzed. At 20:00 on the 18th, 850 hPa, 925 hPa, and ground pressure fields showed significant negative abnormalities from Liaoning to the south of Jilin, reaching −2 σ to −4 σ (Figure 3a–c), and from 08 to −4 σ in the pressure near the ground cyclone center on the 18th to nearly 24 h (Figure 3d). In addition, the ground cyclone rapidly dropped to 997.5 hPa, with a central pressure, from 1005 hPa within 24 h before and after passing through the Bohai Sea. The unusual bias strength of low-layer low vortex and ground cyclones, and the rapid enhancement of ground cyclones both provide favorable conditions for the rising motion.
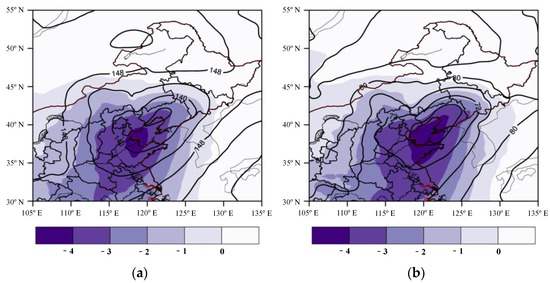
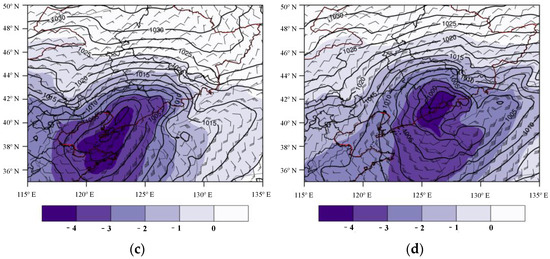
Figure 3.
(a) 850 hPa height field (isoline) and standardized abnormality (coloring) at 20:00 on 18 November, (b) 925 hPa height field (isoline) and standardized abnormality (coloring) at 20:00 on 18 November, (c) sea level pressure field (isoline) and standardized abnormality (coloring) at 20:00 on 18 November, (d) sea level pressure field (isoline) and standardized abnormality (coloring) at 08:00 on 19 November.
4.2. Dynamic Conditions Analysis
During the strong rain and snow, the northeast region was located in the divergence area on the right side of the 200 hPa jet inlet area and the convergence area on the left side of the low-level jet exit area. The high- and low-altitude coupling is conducive to producing continuous large-scale vertical motion. Taking the profiles of considerable temperature, horizontal divergence, absolute vorticity, wind field, and terrain along the rainstorm area, it is obvious that the cold air in the low and near strata is inserted into the warm air bottom from the west side, raising the warm air to about 700 hPa, and subsequently producing a strong convergence rise motion (Figure 4). The terrain also lifts the warm air.
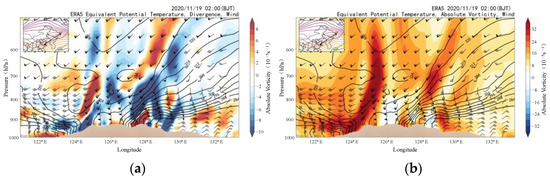
Figure 4.
(a) equivalent temperature (contour), divergence (color) and profile wind at 02:00 on 19 November, (b) equivalent temperature (contour), absolute vorticity (color) and profile wind at 02:00 on 19 November.
The vertical distribution of frontogenesis functions showed that the frontogenesis zone was mainly located below 925 hPa. According to the 925 hPa frontogenesis function, there were two obvious frontogenesis areas at 07:00 (Figure 5a), and the precipitation was mainly located in the southern frontogenesis area. The two areas then gradually approached and merged in western Liaoning (Figure 5b) at night on the 18th, and the frontal intensity gradually developed to the northeast. At 00:00 (Figure 5c), the frontogenesis area was located in the north of Liaoning, then continued to move to the northeast, the intensity gradually weakened, and the precipitation also gradually weakened. The temperature profile of 123° E also shows the characteristics of the merger and strengthening, and the frontal development is mainly located below 925 hPa (Figure 5d).
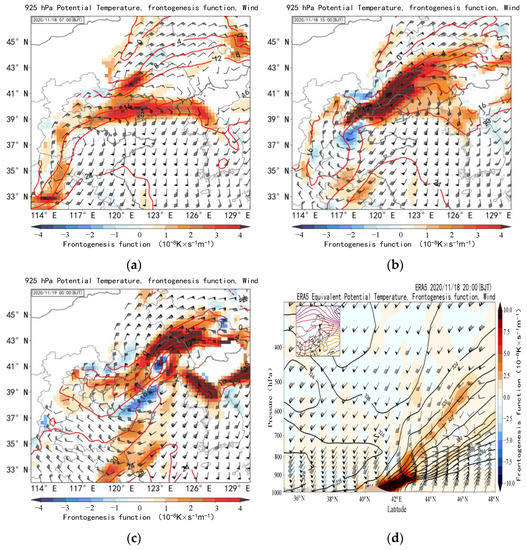
Figure 5.
(a) 925 hPa wind field and frontogenesis function (color) at 07:00 on 18 November, (b) 925 hPa wind field and frontogenesis function (color) at 15:00 on 18 November, (c) 925 hPa wind field and frontogenesis function (color) at 00:00 on 19 November, (d) the altitude and latitude profile of the wind field and frontogenesis function (color) along 123° E.
In addition, previous analysis indicates that the rain and snow process is mainly formed when the warm wet air slopes along the cold air under the lifting of low cold air, so the wet oblique pressure term (MPV2) in the wet vortex is introduced. The expression for MPV2 is as follows:
The value of MPV2 is determined by the vertical shear of the horizontal wind and the horizontal gradient of the false equivalent temperature, which causes the tilt of the wet isoentropy surface, thus enhancing the vertical vorticity and benefiting the generation of heavy precipitation. MPV2 < 0 indicates that the atmosphere is conditionally symmetrically unstable.
We selected two heavy precipitation moments at 14:00 and 23:00 on the 18th, and created MPV2 radial and height profiles along the latitude direction to analyze the atmospheric stability of oblique pressure. The temperature at 14:00 on the 18th at 42° N is shown in Figure 6a. The vertical gradient dense area extends from about 800 hPa to the ground. The east corresponds to the MPV2 negative value area, but the negative value is small. The west is mainly northerly and northeast wind, corresponding to the MPV2, and the front uplift increases the atmospheric instability, which is conducive to the development of precipitation. At 23:00 on the 18th at 43° N section (Figure 6b), the false equivalent temperature-dense area was located between 925 hPa and 850 hPa in the east-west horizontal direction, with the northeast wind below the dense area, corresponding to the second positive area. 850–700 hPa is a southwest and southerly wind, and the second negative value area, indicating that the frontal uplift increases the atmospheric instability at this level and is conducive to the development of precipitation.
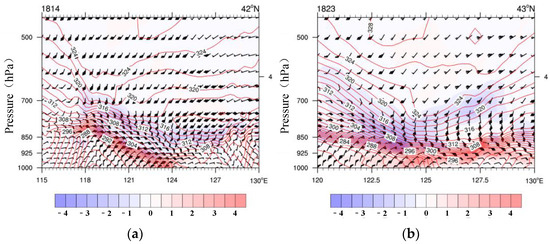
Figure 6.
(a) the altitude and longitude profile of the false equivalent potential temperature (isoline), the second term of wet potential vorticity (color) and the wind field along 42° N at 14:00 on 18 November, (b) the altitude and longitude profile of the false equivalent potential temperature (isoline), the second term of wet potential vorticity (color) and the wind field along 43° N at 23:00 on 18 November.
Through analysis of frontogenesis and MPV2, heavy precipitation is the result of a weak conditionally symmetric unstable atmosphere forcibly lifted by frontogenesis.
4.3. Extreme Characteristic Analysis of Water Vapor Transport
The rain and snow process occurs in early winter, and water vapor transport is crucial to northeast China. In 850 hPa, there are two main sources of water vapor (Figure 7). One is from the South China Sea, and the other from the Yellow Sea and Bohai Sea. Water vapor is mainly transported northward through the low-layer southwest rapids. The low-layer southwest torrent strength, water vapor flux, and the available precipitation of the whole layer all reached or exceeded three standard deviations in the main period of precipitation (Figure 8), which is significantly higher than the historical period, indicating that the abnormally strong water vapor conditions were also an important reason for the extremely strong rain and snow.
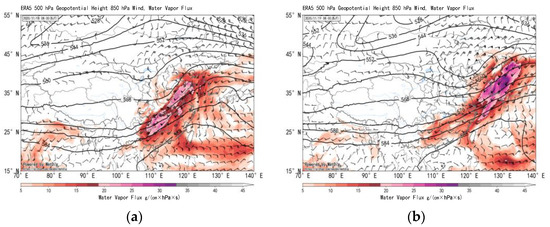
Figure 7.
(a) 850 hPa water vapor flux (color) and wind field (arrow) at 08:00 on 18 November, (b) 850 hPa water vapor flux (color) and wind field (arrow) at 08:00 on 19 November.
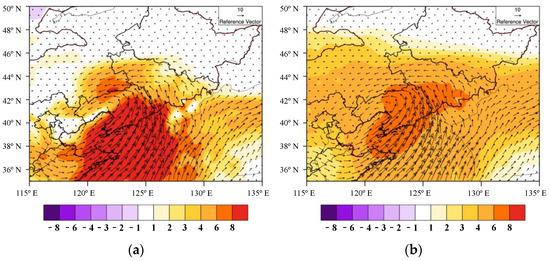
Figure 8.
(a) 850 hPa wind field (arrow) and standardized abnormality of water vapor flux (color) at 20:00 on 18 November, (b) 850 hPa wind field(arrow) and standardized abnormality value of whole layer precipitable water(coloring) at 20:00 on 18 November.
By analyzing the vertical profile of two precipitation zones (Figure 9), we observed that the area of 6 to 8 g/kg extends above 700 hPa, and 10 to 12 g/kg below 900 hPa. In eastern Jilin, the area of 6 to 8 g/kg also extends above 700 hPa. At the same time, it can be seen that in the above two areas, the specific humidity mainly rises along the dense area of equivalent potential temperature, and the lifting position cooperates well with the higher terrain, indicating that the bottom front has an obvious lifting effect on the low layer and high wet area in the terrain.
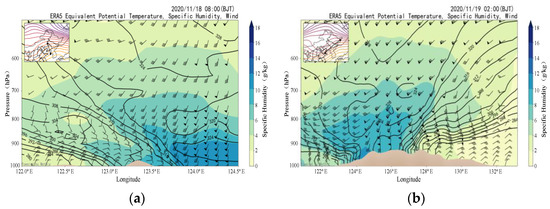
Figure 9.
(a) the altitude and longitude profile of equivalent potential temperature (line), absolute humidity (coloring) and profile wind at 08:00 on 18 November, (b) the altitude and longitude profile of equivalent potential temperature (line), absolute humidity (coloring) and profile wind at 08:00 on 18 November (wind) at 02:00 on 19 November.
5. Conclusions
This paper analyzed the process of extreme rainfall and snow in northeast China during 17–19 November 2020, focusing on the characteristics and causes of extreme precipitation. The following conclusions were obtained:
- (1)
- Large-scale low vortex and ground cyclones were the main influence systems of this process, and the abnormally strong low vortex and ground cyclone are important reasons for extreme rain and snow. The area of strong rain and snow is located in the divergence area on the right side of the 200 hPa jet inlet, and the convergence area on the left side of the low-level jet outlet.
- (2)
- The strong rain and snow process occurs in the early winter season, and the extremely strong water vapor transport is very important. The extremely strong low-level jet continues to transport water vapor from the southern sea surface of northeast China to the north, increasing both the water vapor flux and the available precipitation of the whole atmosphere, and providing extremely strong water vapor conditions for the occurrence of strong rain and snow, which is the main cause of extreme precipitation.
- (3)
- During the precipitation process, the frontogenesis effect of heights below 850 hPa is obvious. The analysis indicates that the vertical motion of the 925 hPa~700 hPa symmetrical unstable atmosphere is forced by the frontogenesis, strengthening the low oblique rise movement, increasing instability, and leading to the intensification of the development of precipitation.
- (4)
- During the process of rain and snow, a complex phase transition of precipitation occurred in some areas of central and western Jilin. The analysis showed that the change of the precipitation phase is closely related to the thickness and temperature change of the frozen layer.
- (5)
- The freezing rain disaster in this extreme precipitation process is relatively serious, but the analysis of precipitation phase changes is not detailed in this research. In the future, we intend to make an in-depth analysis of the causes of precipitation phase changes and the focus of freezing rain predictions.
Author Contributions
Conceptualization, C.Y., H.Z. and Y.G.; methodology, C.Y., N.H. and L.H.; software, Y.G. and M.W.; validation, T.C. and M.W.; formal analysis, C.Y.; investigation, F.Z.; resources, H.Z.; data curation, N.H.; writing—original draft preparation, F.Z. and F.Z.; writing—review and editing, C.Y. and F.Z.; visualization, Y.G.; supervision, F.Z.; project administration, F.Z.; funding acquisition, F.Z. All authors have read and agreed to the published version of the manuscript.
Funding
This work was supported jointly by the National Key R&D Program of China (Grants 2019YFC1510400).
Institutional Review Board Statement
Not applicable.
Informed Consent Statement
Not applicable.
Data Availability Statement
The observations are available at https://data.cma.cn/data/cdcindex/cid/f0fb4b55508804ca.html (accessed on 1 May 2022), and the ERA5 data are available at https://cds.climate.copernicus.eu/cdsapp#!/dataset/reanalysis-era5-single-levels?tab=form/ (accessed on 1 May 2022).
Conflicts of Interest
The authors declare no conflict of interest.
References
- Hu, Z.M.; Zhou, W.C. Case study on the formation mechanism of Blizzard in Northeast China. J. Nanjing Inst. Meteorol. 2005, 28, 679–684. [Google Scholar]
- Dong, X.; Zhou, S.W.; Hu, Z.M. Spatiotemporal distribution characteristics of blizzard in Northeast China in the past 50 years. Meteorol. Dep. 2010, 36, 74–79. [Google Scholar]
- Zhao, G.N. Research on Blizzard Weather Analysis and Forecast Method in Heilongjiang Province. Ph.D. Thesis, Lanzhou University, Lanzhou, China, 2011; pp. 1–70. [Google Scholar]
- Yan, Q.; Jiang, X.K.; Chen, C.L. Climate characteristics of Liaoning regional blizzard in 1960–2009. AMA 2012, 28, 43–48. [Google Scholar]
- Fu, L.; Zhao, Y.; Yang, C.F. Statistical characteristics of the northward extratropical blizzard affecting the northeast. Plateau Weather 2018, 37, 1705–1715. [Google Scholar]
- Martin, J.E. The structure and evolution of a continental winter cyclone. Part I: Frontal structure and the occlusion process. Mon. Weather Rev. 1998, 126, 303–328. [Google Scholar] [CrossRef][Green Version]
- Martin, J.E. The structure and evolution of a continental winter cyclone. Part II: Frontal forcing of an extreme snow event. Mon. Weather Rev. 1998, 126, 329–348. [Google Scholar] [CrossRef][Green Version]
- Grim, J.A.; Rauber, R.M.; Ramamurthy, M.K.; Jewett, B.F.; Han, M. High-resolution observations of the trowal–warm-frontal region of two continental winter cyclones. Mon. Weather Rev. 2007, 135, 1629–1646. [Google Scholar] [CrossRef]
- Sheng, C.Y.; Yang, X.X. A rare symmetric instability analysis of Shandong blizzard weather. Meteorol. Dep. 2002, 28, 33–37. [Google Scholar]
- Wang, D.H.; Duan, Y.H.; Liu, Y. Analysis of the rain and snow weather process in an autumn extratropical cyclone. J. Meteorol. 2013, 71, 606–627. [Google Scholar]
- Yang, X.L.; Wang, Y.Q.; Yang, M. Analysis of the heavy precipitation process in North China, where a heavy rain and a very heavy blizzard coexist. Meteorol. Dep. 2014, 40, 1446–1454. [Google Scholar]
- Wang, H.Q.; Fu, Y.N.; Meng, X.F. Characteristics of water vapor transport during an extreme snowfall process in northeastern Inner Mongolia. Drought Weather 2019, 37, 11. [Google Scholar]
- Wang, Y.; Kou, Z.; Xie, J.Z. Diagnostic analysis of a blizzard process in Northeast China. Inn. Mong. Meteorol. Reg. 2009, 56, 11–14. [Google Scholar]
- Liu, J.; Li, N.; Chen, C.Y. Front structure and mesoscale cloud group analysis in a blizzard process in a warm area in northern Xinjiang. Plateau Weather 2018, 37, 158–166. [Google Scholar]
- Liang, J.; Zhang, S.J.; Wang, S.X. Characteristic analysis and numerical simulation of a regional blizzard in Dalian. Plateau Weather 2010, 29, 744–754. [Google Scholar]
- Liu, C.; Yang, C.F. Characteristics and causes of complex precipitation. Meteorol. Sci. 2016, 36, 411–417. [Google Scholar]
- Zhang, J.L.; Peng, J. Identification and cause analysis of spring precipitation in northern Xinjiang. Plateau Weather 2017, 36, 939–949. [Google Scholar]
- Yang, S.N.; Xu, J.; He, L.F. Analysis of the influence of low-layer temperature advection on the rain and snow weather process in North China. Meteorol. Dep. 2017, 43, 665–674. [Google Scholar]
Publisher’s Note: MDPI stays neutral with regard to jurisdictional claims in published maps and institutional affiliations. |
© 2022 by the authors. Licensee MDPI, Basel, Switzerland. This article is an open access article distributed under the terms and conditions of the Creative Commons Attribution (CC BY) license (https://creativecommons.org/licenses/by/4.0/).