Article

Trends in Summer-Time Tropospheric Ozone during COVID-19 Lockdown in Indian Cities Might Forecast a Higher Future Risk

1
Laboratory of Applied Stress Biology, Department of Botany, University of Gour Banga, Malda 732103, West Bengal, India
2
School of Environmental Sciences, Jawaharlal Nehru University, New Delhi 110067, India
3
Global Research Arch for Developing Education (GRADE) Academy Pvt. Ltd., Birgunj 44300, Nepal
4
Faculty of Health and Sport Sciences, University of Tsukuba, 1-1-1 Tennodai, Tsukuba 3058574, Ibaraki, Japan
*
Authors to whom correspondence should be addressed.
Atmosphere 2022, 13(7), 1115; https://doi.org/10.3390/atmos13071115
Submission received: 10 June 2022 / Revised: 8 July 2022 / Accepted: 11 July 2022 / Published: 14 July 2022
(This article belongs to the Special Issue Feature Papers in Atmosphere Science)

Abstract

:
High concentrations of tropospheric ozone (O3) is a serious concern in India. The generation and atmospheric dynamics of this trace gas depend on the availability of its precursors and meteorological variables. Like other parts of the world, the COVID-19 imposed lockdown and restrictions on major anthropogenic activities executed a positive impact on the ambient air quality with reduced primary pollutants/precursors load. In spite of this, several reports pointed towards a higher O3 in major Indian cities during the lockdown. The present study designed with 30 pan-Indian mega-, class I-, and class II-cities revealed critical and contrasting aspects of the geographical location, source, precursor, and meteorological variable dependency of the spatial and temporal O3 formation. This unexpected O3 increase in the major cities might forecast the probable future risks for the National Air Quality policies, especially O3 pollution management, in the Indian sub-continent. The results also pointed towards the severity of the north Indian air quality, followed by the western and eastern parts. We believe these results will definitely pave the way for researchers and policy-makers for predicting/framing regional and/or national O3 management strategies in the future.

1. Introduction

In the last few decades, the trace gas ozone (O3) has emerged as one of the major air pollutants worldwide with its potent impacts on atmospheric chemistry, climate change, human health, and global food security [1,2,3,4]. In the troposphere, the O3 is formed by photochemical reactions through the oxidation of its precursor molecules in alliance with the meteorological variables. In addition to that, a fraction of O3 present in the stratosphere is also transported to the troposphere [5]. While correlating the impact of increasing surface O3 with global crop production, Giles [6] projected a few major O3 “hotspots” between the years 2000 and 2100, which include India and China as two significant zones. India is a diversified country with its geographical distributions, such as a large coastline of 7517 km surrounded by the Indian ocean in the east, west, and south, and the Himalayan mountain ranges in the north and the Western Ghats in the south, and a heterogeneous population of 1.39 billion with multi-economical and -ethnical status [7]. These diversities result in nationwide varied climate zones, energy consumption profiles, pollutant synthesis, distribution patterns, etc. [8].
Like other countries, several studies from India have reported increasing trends in tropospheric O3 with seasonal and regional variations over the last few decades [9,10]. In northern India, Delhi recorded 44 and 196.96 µg.m−3 of summer-time, 35 and 116.15 µg.m−3 of monsoon-time, and 38 µg.m−3 of winter-time O3 during 2012 and 2018 [9,10]. Varanasi recorded 90.62 µg.m−3 of summer-monsoon-time O3 during 2007, and 88.85 and 92.78 µg.m−3 of winter-time O3 during 2007-08 and 2008-09 [11,12,13]. In western India, Udaipur recorded 54.92 and 37.27 µg.m−3 of summer-time and monsoon-time O3 during 2010 [14]. Jodhpur recorded 47, 27, and 37 µg.m−3 of summer-time, monsoon-time, and winter-time O3 during 2016 [15]. In southern India, Chennai recorded 29.66 µg.m−3 of summer-time and 17.62 µg.m−3 of monsoon-time O3 during 2016 [16]. In addition to these seasonal and regional variations, several reports demonstrated significant diurnal and weekday/weekend variations in the tropospheric O3 concentrations across India. Delhi recorded 86.30 and 47.07 µg.m−3 of day-time and night-time O3 during the summer of 2016 [17]. Jodhpur recorded 129 and 96 µg.m−3 of day-time and night-time O3 and 55.8 and 57.80 µg.m−3 of weekday and weekend O3 during the summer of 2016 [15]. Bengaluru recorded 41 and 32 µg.m−3 of day-time and night-time O3 during the summer of 2015 [18]. Following the available reports, the tropospheric O3 was generally found higher during day-time and summer seasons; and also in the northern, eastern and western part of India as compared to the central, southern, and north-eastern parts of India.
Being a secondary pollutant, the generation as well as mitigation of tropospheric O3 largely depend on multiple factors, such as the dynamics of emission sources for precursor molecules, the ratio and saturation levels of the available precursor molecules, alteration of meteorological variables, and others [19,20,21]. Based on the source and sink mechanism, the precursors such as nitrogen oxides (NOX: NO and NO2), volatile organic compounds (VOCs) including benzene, toluene, ethylbenzene, xylene (BTEX), the proportion of NOX to VOCs [19,20,21], along with the meteorological variables like solar radiation intensity, temperature, relative humidity, wind speed, and rainfall [22,23,24,25], play a key role in the synthesis of O3 in the troposphere. Reshmi et al. [26], while discussing the relations of precursor molecules with O3 formation in the Kannur city, India, pointed towards a negative correlation with NOX, but positive correlation with carbon monoxide (CO). In another study on 22 Indian cities, Sharma et al. [27] reported similar negative correlations between O3-NOX and O3-VOCs. Chen et al. [19], in their study in Delhi, demonstrated that the concentration of O3 increased by 50% due to a 50% increment in VOCs, but increased by 5% due to a 50% reduction in NOX during summer-time in 2018. Li et al. [28] depicted a 2.68% increment in daily mean O3 due to a 10% increase in VOCs, but a 2.25% reduction due to a 10% increase in NOX at Chengguan district, China during 2016. In addition to these precursor molecules, tropospheric O3 formation also demonstrated positive correlation with meteorological parameters like temperature and sunshine hours, but negative correlation with relative humidity and rainfall [29,30].
Like other parts of the world, the O3 formation in the Indian urban region is primarily seasonal, light-limited and/or VOCs/NOX-limited [19,20]. In VOCs limited regime, the tropospheric O3 concentration primarily depends on changing levels of VOCs and secondarily on NOX, whereas in NOX limited regime, the tropospheric O3 concentration primarily depends on changing levels of NOX, not VOCs. Therefore, it is very important to determine which regime prevails before applying O3 pollution mitigation approaches. The restrictions on vehicular movement, biomass burning, and industrial and construction activities might help to control major air pollutants like NOX, particulate matters (PM10 and PM2.5), CO, etc., but not the VOCs particularly [20].
COVID-19 enforced a substantial lockdown of nearly 2 months (64 days) in India; which resulted in the significant reduction of major air pollutants. This sudden improvement in the nation-wide air quality was a ‘silver-lining’ to all the researchers, policymakers, and common people in decades. However, with the reduction of precursors during the lockdown, the production of tropospheric O3 is another very important issue to be addressed. Keeping this in mind, the present study aims to compare the O3-production during the pre-lockdown and lockdown with their precursor availability and atmospheric dynamics.

2. Materials and Methods

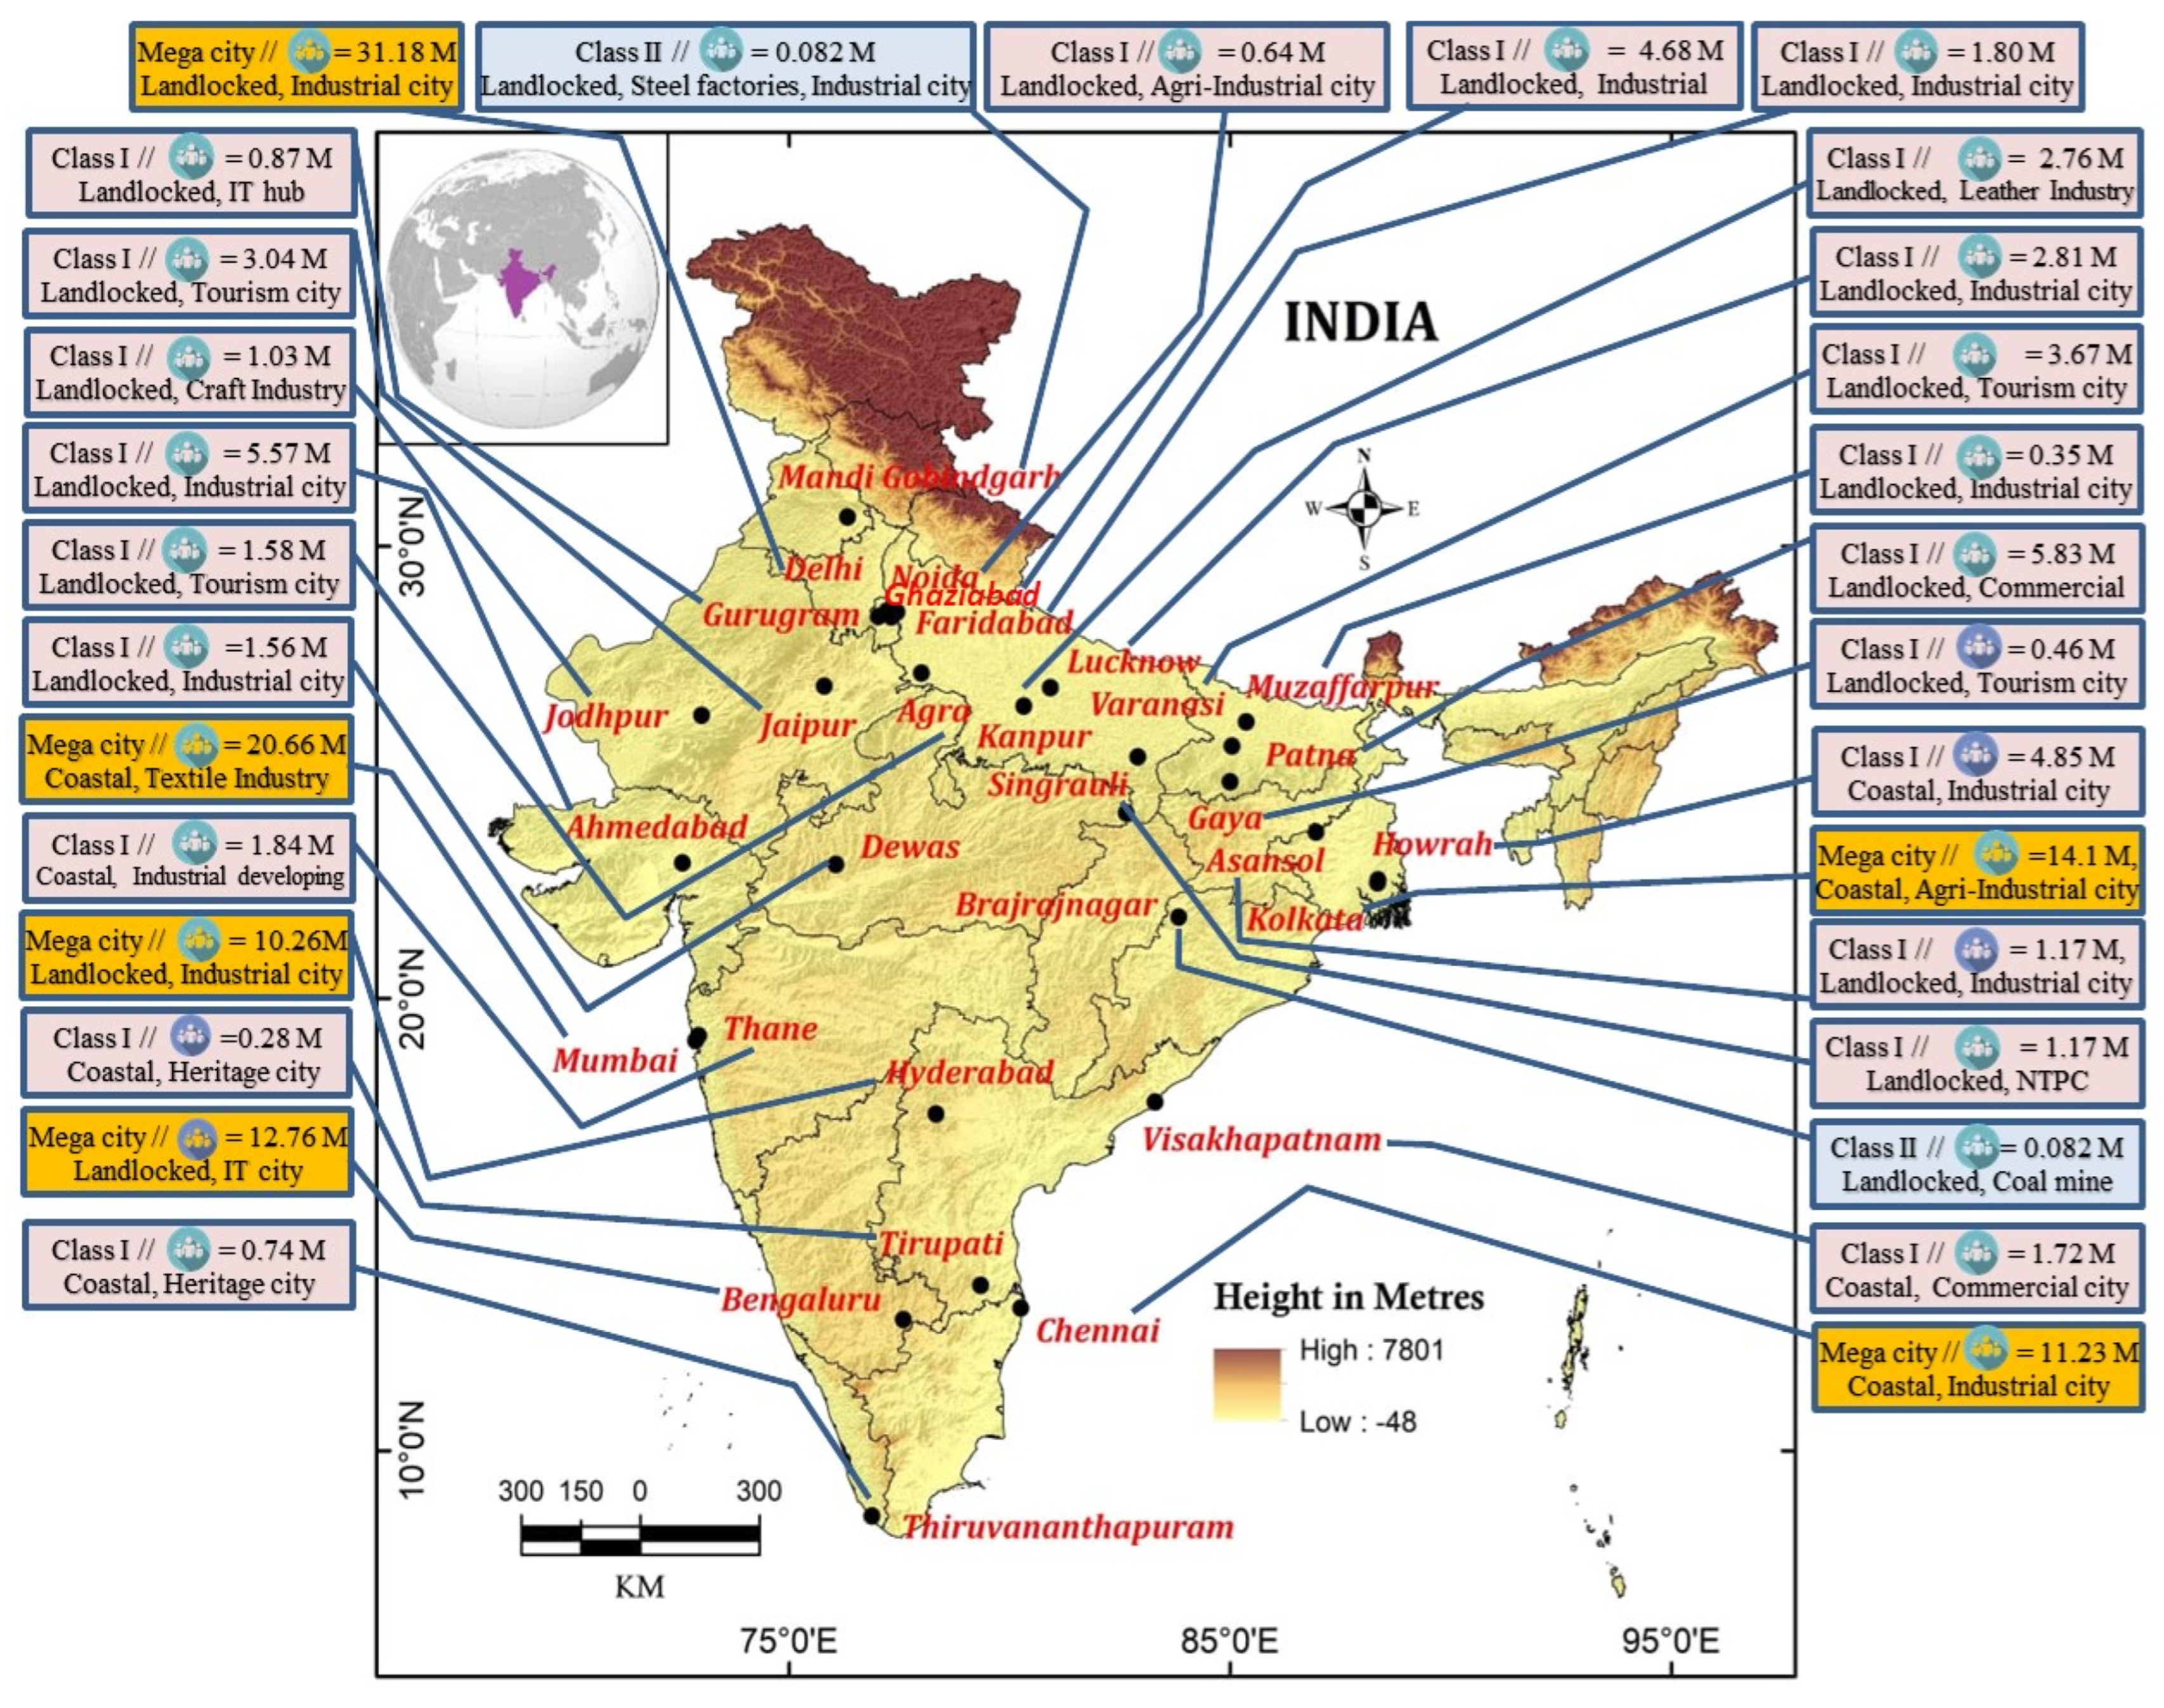
2.1. Selection of Indian Cities and Study Periods

A total of thirty (30) cities with higher air pollution records have been selected from different geographical regions throughout the India (Figure 1). These cities are—(i) Megacity (population ≥10 million), (ii) Class I-city (population ≥ 0.1 million), and (iii) Class II-city (population between 0.05–0.099 million) as per Census 2011 [31].
The four months (128 days) long study period was divided into two phases—(i) first phase/pre-lockdown (17 January to 24 March 2020) and (ii) second phase/lockdown (25 March to 31 May 2020), each of a total of sixty four days in three consecutive years, i.e., 2018, 2019, and 2020. According to the India Meteorological Department (IMD), the above mentioned period comes within summer-time in the Indian climate zone. This lockdown was implemented in four phases by the Government of India. Major activities like public gatherings, educational institutes, industrial establishments, business and trade, hospitality services, roadways, railways and airways transportation, and others, were completely suspended during the initial phases, but partially allowed in later phases.

2.2. Collection of Tropospheric O3, NO2, Benzene, Toluene, Ethylbenzene, Xylene (BTEX) Concentration and Meteorological Variables

The daily mean 8 h (8 AM–16 PM) daytime concentration of O3 was collected from the Central Pollution Control Board (CPCB) online portal for air quality data dissemination [32]. In general, the O3 concentration reaches its daytime maxima during the selected periods of 8 h (8 AM–16 PM), if favored by meteorological conditions and precursor concentration. CPCB provides ambient air quality data and their national standards with quality assurance or quality control (QA/QC) programs by defining rigorous protocols for the monitoring, analysis, and calibration. To maintain a parity, the concentration of precursors (NO2, benzene, toluene, ethylbenzene and xylene) and meteorological variables (ambient temperature (AT), relative humidity (RH), wind speed (WS), and wind direction) were collected for the same duration and period as of O3 from the same CPCB online portal.

2.3. Cartographical Analyses

The wind rose diagrams were prepared using WRPLOT view ver. 7.0.0 (Lakes Software, ON, Canada) to visualize the wind pattern and speed of each selected city. The obtained wind speed for every city was averaged arithmetically yielding a scalar mean wind speed, and the direction of the wind was averaged to the vector mean wind direction [32]. The concentration of O3 was plotted using Inverse Distance Weighted interpolation method in the ArcGIS 10.5 Spatial Analyst tool.

2.4. Statistical Analyses

The O3 values available at monitoring stations have been summed up and divided by the number of stations to get the daily arithmetic mean. These obtained mean values have been summed up and divided by the number of days to estimate the mean value for the concerned city. The change in percent in mean concentrations of O3 between two time periods has been executed to study the variations over time. Likewise, the arithmetic mean values of NO2, BTEX, AT, RH, and WS for each city were obtained.
The multiple linear regression analyses have been applied for determining the average relationship among O3 concentration and BTEX, NO2, RH, WS, and AT using SPSS ver. 21 (Chicago, IL, USA).
Hierarchical cluster analyses were done to group the cities based on percentage changes of the daily mean O3 concentrations from the first phase/pre-lockdown to the second phase/lockdown in the years 2018, 2019, and 2020 by using SPSS ver. 21. Rescaled Distance Cluster Combine (RDCC) was employed to compute the distance among cities and the clustering method was within-group linkage based on the Z scores standardized transformation. The two variables with the lowest average distance are generally linked to form a new cluster.

3. Results

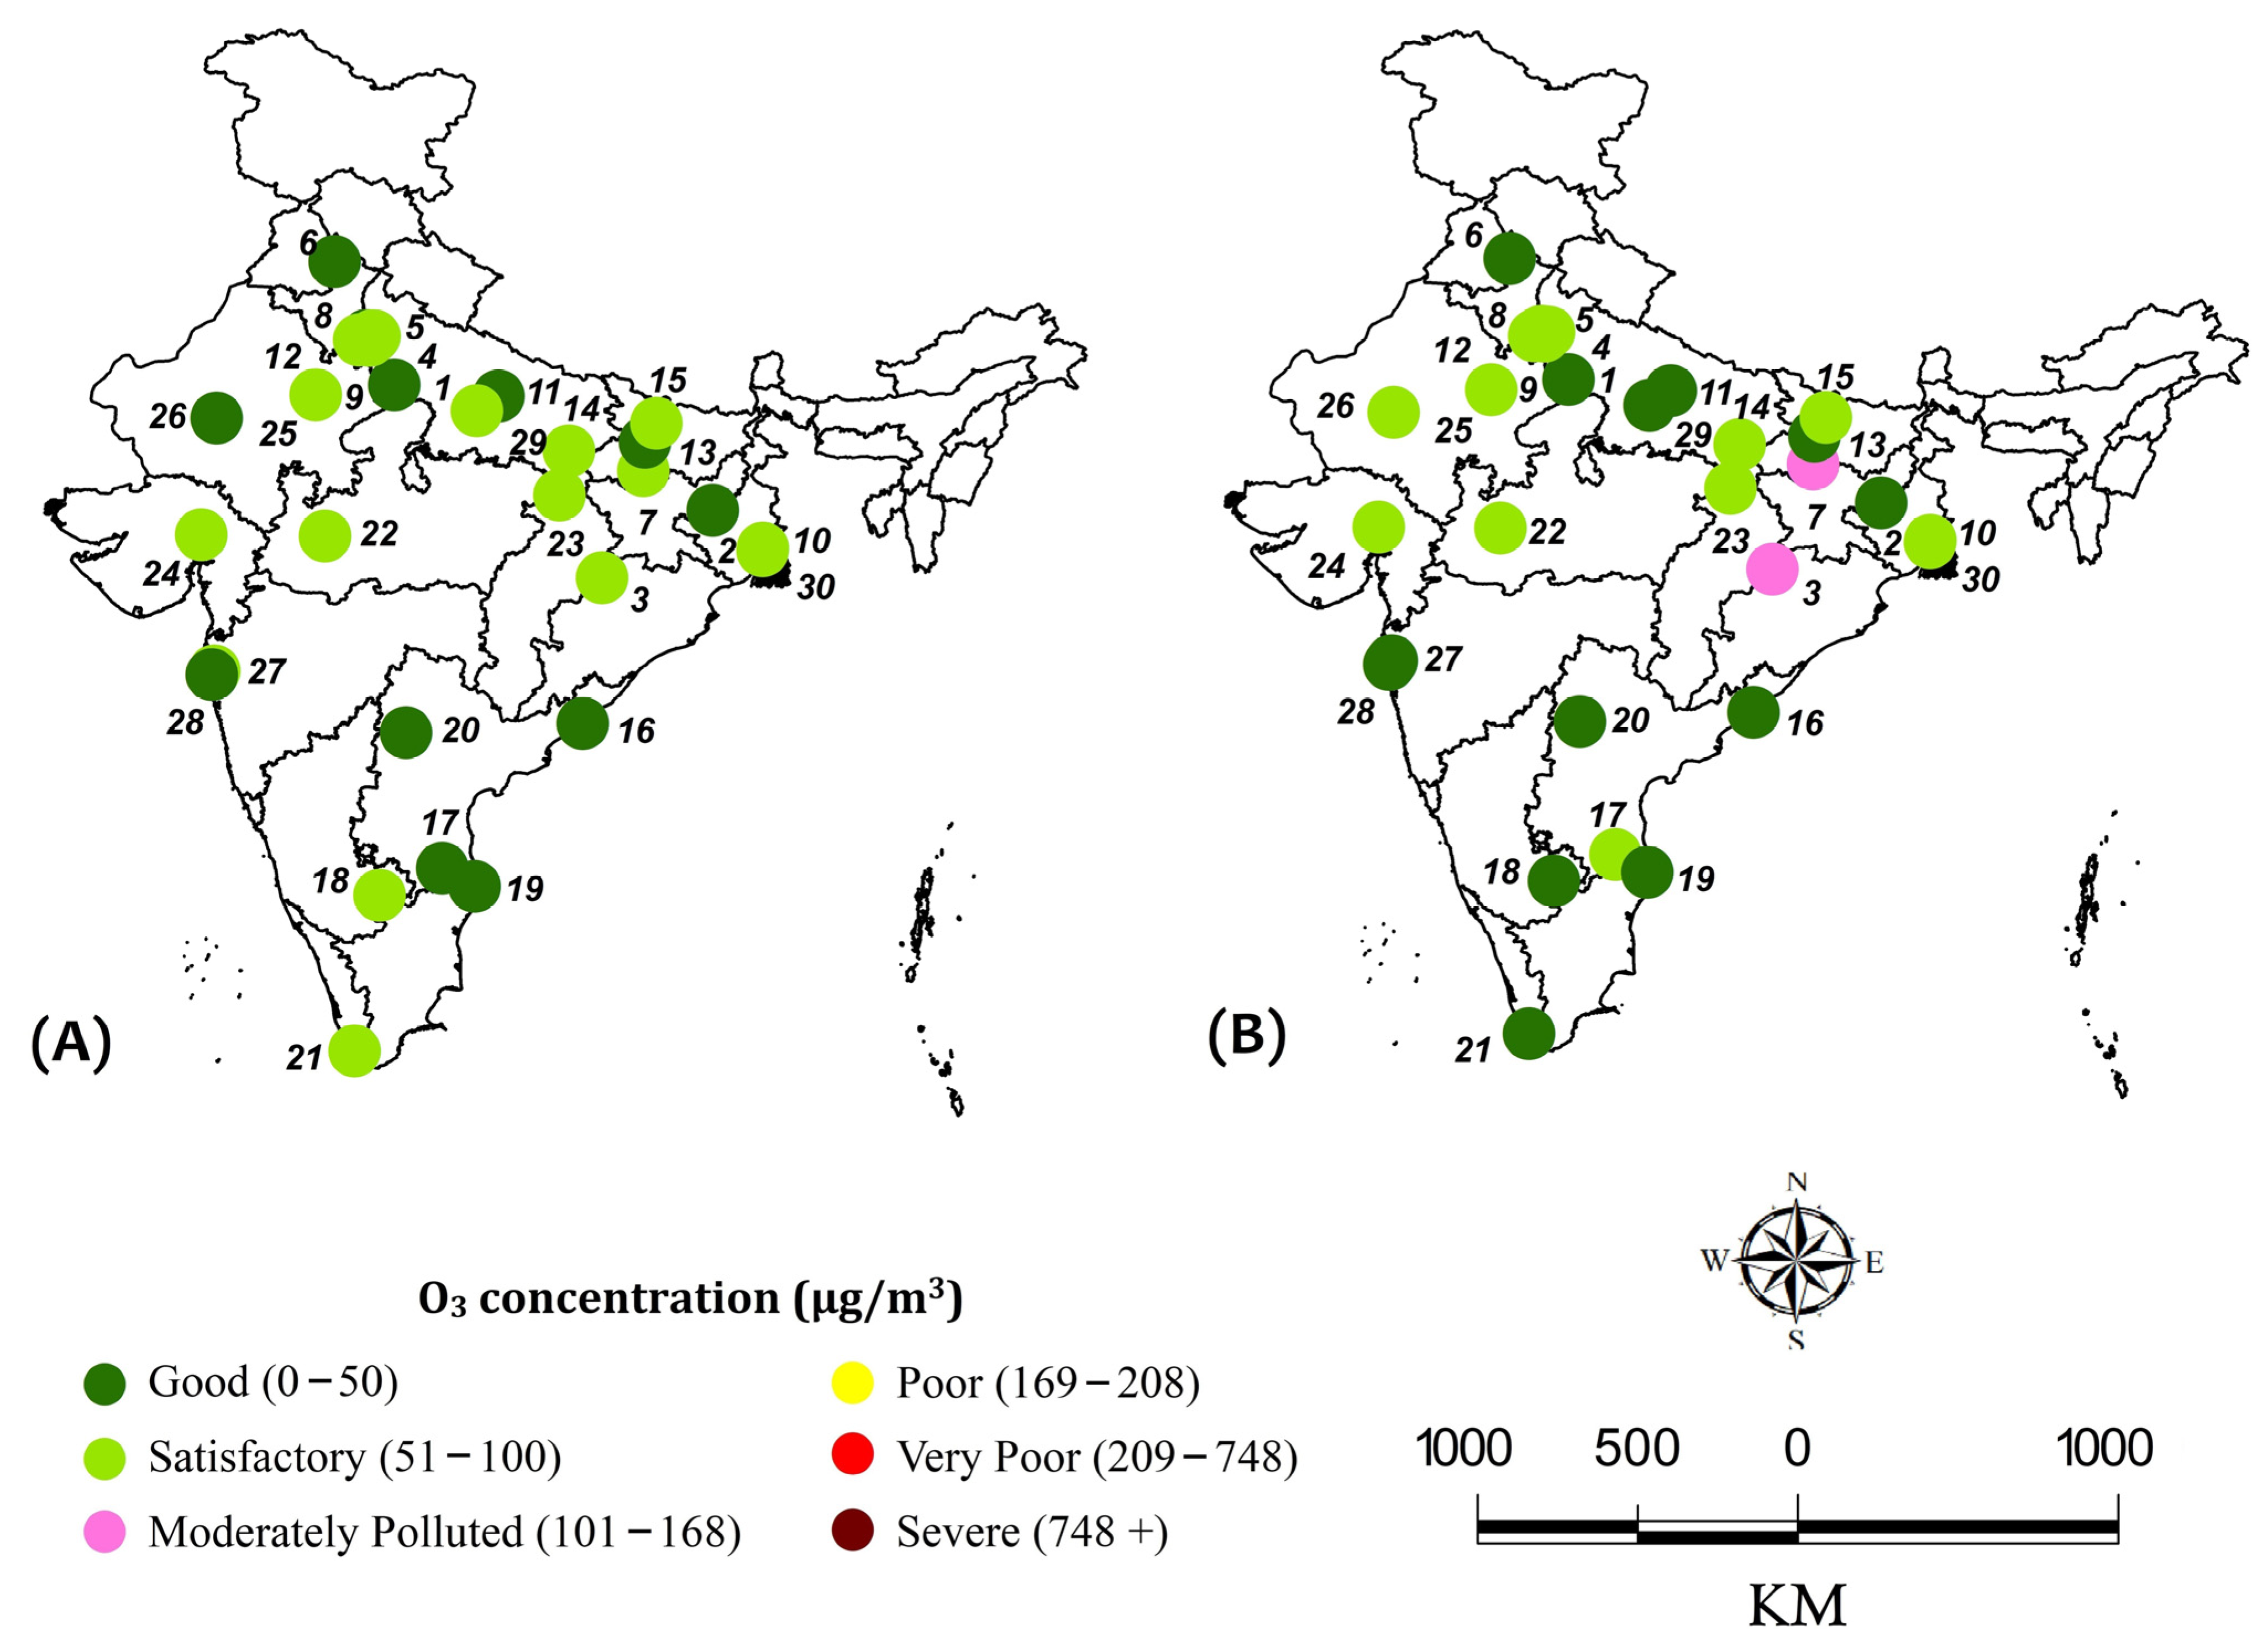
3.1. Spatial and Temporal Concentration of Tropospheric O3

The summer-time O3 concentrations for all the selected cities for both the phases were recorded separately for consecutive three years, i.e., 2018, 2019, and 2020. The mean O3 concentration was determined during the second phase/lockdown with reference to the first phase/pre-lockdown of 2020 and the same time span of 2018 and 2019. During the first phase of 2018, O3 concentrations in Patna and Dewas (101.9 and 106.3 µg.m−3) exceeded the national ambient air quality standards (NAAQS) of 100 µg.m−3 (moderately polluted). Though, 09 cities demonstrated O3 concentration under the NAAQS and reported a good category of O3 level. However, O3 concentration was significantly increased in 14 cities during the second phase of 2018, and Patna and Muzaffarpur (111.7 and 104.0 µg.m−3) surpassed the critical limits. However, 10 cities showed a good category of O3 level during this period of 2018 (Figure S1).
During the first phase of 2019, 02 landlocked north Indian cities, i.e., Varanasi and Muzaffarpur (130.5 and 122.8 µg.m−3) followed by only 01 east Indian city Patna (115.7 µg.m−3) surpassed the critical limits and exhibited moderately polluted. Although, the O3 level was found to be good in 15 cities and satisfactory in another 12 cities. As compared to the first phase, O3 was increased in 21 cities, among which 04 north Indian cities, i.e., Faridabad, Ghaziabad, Varanasi, and Kanpur, and one east Indian city, i.e., Patna, surpassed the NAAQS during the second phase of 2019 (Figure S1).
The O3 concentrations during the first phase/pre-lockdown of 2020 have demonstrated the good category in 12 cities and satisfactory in 18 cities. No cities exceeded the NAAQS of 100 µg.m−3. In comparison with the first phase/pre-lockdown of 2020, O3 concentration was significantly increased in 19 cities, among which 02 landlocked east Indian cities, i.e., Brajrajnagar and Gaya, showed 102.33 and 100.48 µg.m−3 of O3 concentration, which exceeded the NAAQS (100 µg.m−3) during the second phase/lockdown of 2020 (Figure 2). The overall rise in O3 concentration is seen in Agra (130%), followed by Brajrajnagar (72.9%), Ahmedabad (61%), Dewas (54%), Ghaziabad (51.2%), Gaya (50%), Tirupati (47.1%), Patna (41.7%), Delhi (41.2%), Gurugram (40.4%), Jodhpur (37.3%), Mandi Gobindgarh (34.2%), Noida (30.3%), Singrauli (26.1%), Muzaffarpur (23.4%), Varanasi (12.2%), Chennai (8.5%), Hyderabad (1.7%), and Kanpur (1.6%), compared with first phase/pre-lockdown of 2020. During the observed span, the concentration of O3 has decreased in 11 cities, i.e., Lucknow, Vishakhapatnam, Bengaluru, Kolkata, Thiruvananthapuram, Asansol, Mumbai, Thane, Faridabad, Howrah, and Jaipur (Figure 2). The higher decrease in O3 concentration was observed in 02 coastal west Indian cities, Mumbai (50.4%) and Thane (42.2%), followed by east and south Indian cities, Kolkata (28.5%), Thiruvananthapuram (27.5%), Bengaluru (22%), and Visakhapatnam (18.2%).

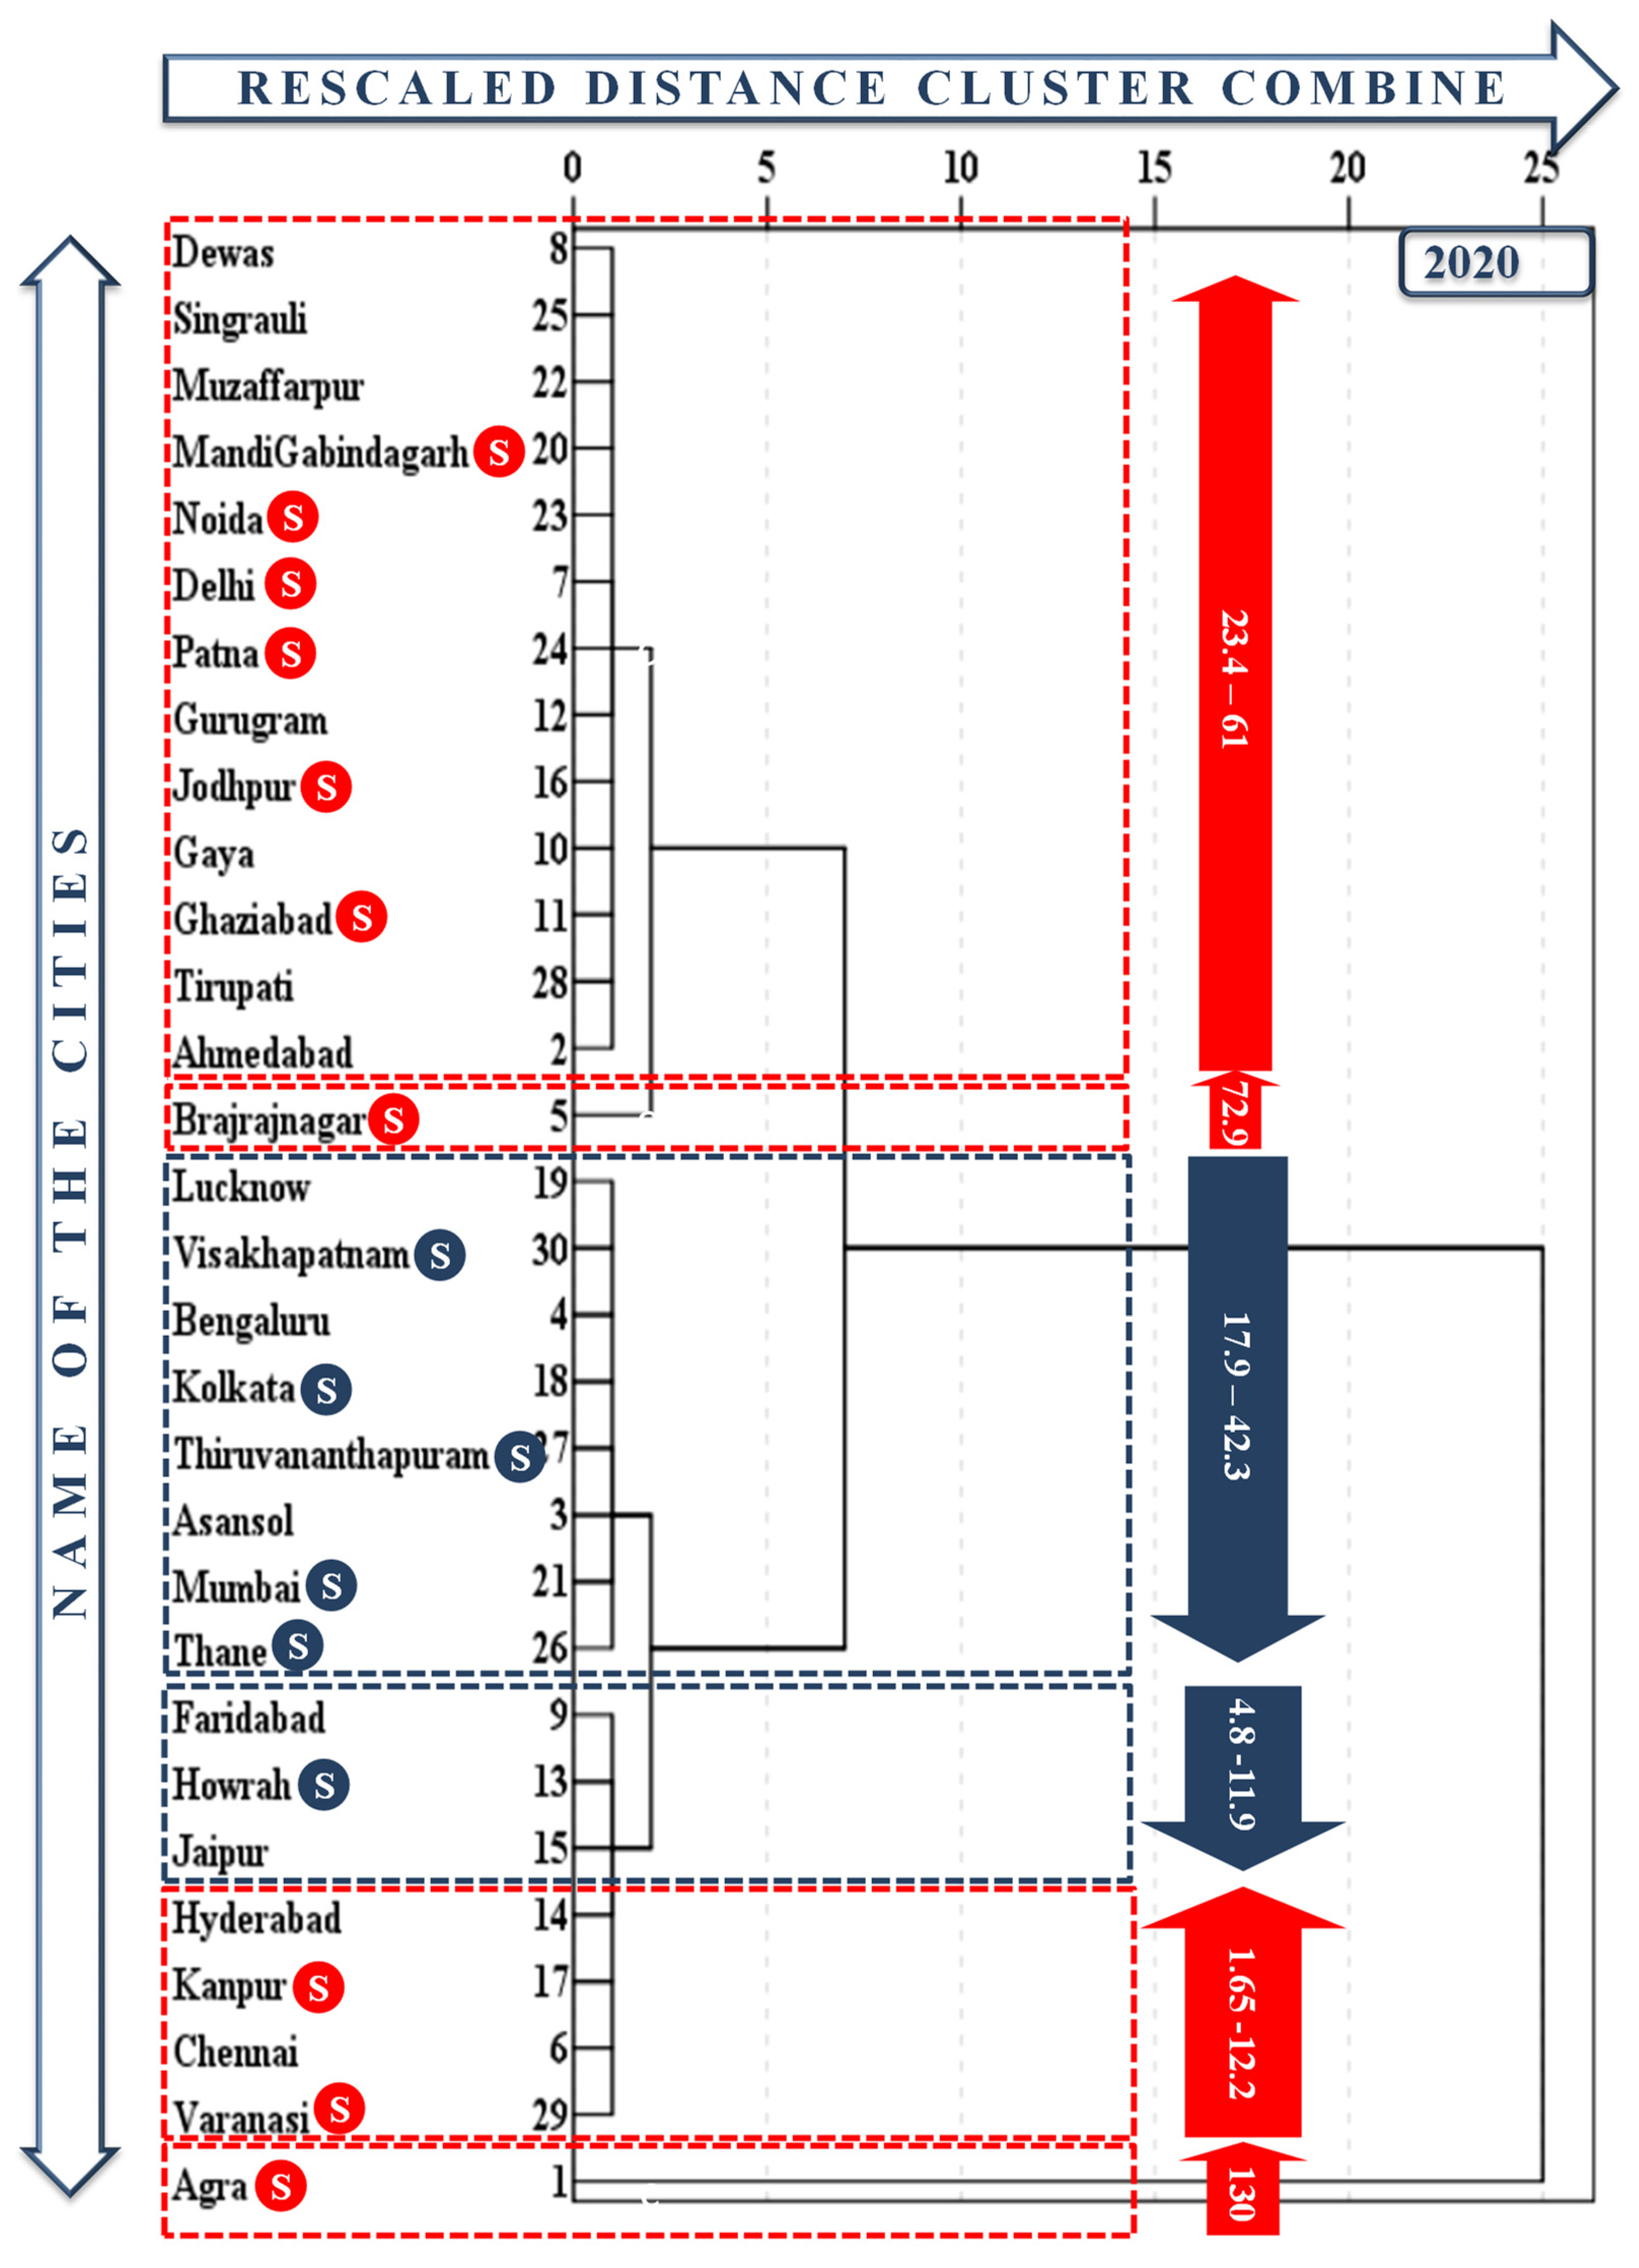
3.2. Clustering of Indian Cities Based on Changes in O3 Concentrations during Second Phase/Lockdown of 2020

The increase or decrease of tropospheric O3 in 30 Indian cities were grouped/clustered together based on the percentage changes of O3 concentrations during the second phase/lockdown of 2020 as compared to the first phase/pre-lockdown of 2020, and also in 2018 and 2019. According to the results, all the selected 30 cities were grouped into five city clusters where 19 cities (enclosed by the red box) showed increasing and 11 cities (enclosed by the blue box) decreasing summer-time O3 during the second phase/lockdown as compared to the first phase/pre-lockdown of 2020 (Figure 3). Although, a total of six city clusters where 14 cities had increasing O3 and 09 cities had decreasing O3 were observed during the second phase of 2018. Hence, 30 cities were grouped into six city clusters where 21 cities showed increasing O3 and 09 cities demonstrated decreasing O3 during the second phase of 2019 with respect to the first phase (Figure S2). A total of 16 cities demonstrated exactly the same trends/patterns in O3 concentrations during the second phase/lockdown of 2020, as compared to the first phase/pre-lockdown of 2020 in all three years. Out of which, 10 cities, i.e., Mandi Gobindgarh, Noida, Delhi, Patna, Jodhpur, Ghaziabad, Brajrajnagar, Kanpur, Varanasi, and Agra [marked by (S) in red circle], demonstrated increasing O3 trends; but 06 cities, i.e., Visakhapatnam, Kolkata, Thiruvananthapuram, Mumbai, Thane, and Howrah [marked by (S) in the blue circle], showed the opposite (Figure 3). The first city cluster includes a total of 13 cities (Dewas, Singrauli, Muzaffarpur, Mandi Gobindgarh, Noida, Delhi, Patna, Gurugram, Jodhpur, Gaya, Ghaziabad, Tirupati, and Ahmedabad), which showed significant increasing O3 concentrations (23.4–61% over pre-lockdown) during the second phase/lockdown of 2020. The second city cluster of the single city Brajrajnagar showed comparatively higher O3 increment by 72.9% during pre-lockdown. The third city cluster of 8 cities (Lucknow, Vishakhapatanam, Bengaluru, Kolkata, Thiruvanathapuram, Asansol, Mumbai, and Thane) showed significantly reduced O3 concentrations (17.9–42.3%) during the second phase/lockdown as compared to the first phase/pre-lockdown of 2020. However, in the fourth city cluster, 03 cities, i.e., Faridabad, Howrah, and Jaipur, demonstrated non-significant reduction of O3 concentrations (4.8–11.9%), and 04 cities (Hyderabad, Kanpur, Chennai, and Varanasi) with non-significant increase of O3 concentrations (1.6–12.2% over pre-lockdown) during the second phase/ lockdown of 2020. The fifth city cluster of single city Agra showed the highest O3 increase by 130% during the second phase/lockdown, as compared to the first phase/pre-lockdown of 2020 (Figure 3). Here, a total of 19 cities (out of 30 cities) exhibited increasing trends of O3 concentrations during the second phase/lockdown of 2020.

3.3. Correlation between O3 and Precursor Molecules

The relationship between O3 and its precursors (VOCs including benzene, toluene, ethylbenzene, xylene; and NO2) has been examined during the second phase/lockdown in 2020; using multiple linear regression models (Table S1). Among the VOCs, the benzene demonstrated positive correlations in 04 cities, i.e., Patna (p-value = 0.455), Gurugram (p-value = 0.006), Ghaziabad (p-value = 0.224), and Hyderabad (p-value = 0.321), and negative correlations in 13 cities, i.e., Dewas (p-value = 0.005), Muzaffarpur (p-value = 0.013), Mandi Gobindgarh (p-value = 0.499), Noida (p-value = 0.014), Ahmedabad (p-value = 0.862), Brajrajnagar (p-value = 0.576), Kanpur (p-value = 0.612), Chennai (p-value = 0.860), Varanasi (p-value = 0.348), Agra (p-value = 0.684), Delhi (p-value = 0.040), Gaza (p-value = 0.033), and Tirupati (p-value = 0.866), with increasing O3 during the second phase/lockdown of 2020. In Dewas, the obtained result prominently demonstrated that one unit decrease of benzene increases 44.964 unit of O3 (Table S1). However, during the second phase/lockdown in 2020, benzene exhibited positive correlations in 08 cities and negative correlations in 03 cities with decreasing O3 (Table S1).
The toluene showed positive correlations in 11 cities [Muzaffarpur (p-value = 0.954), Noida (p-value = 0.439), Delhi (p-value = 0.268), Gurugram (p-value = 0.688), Jodhpur (p-value = 0.592), Gaya (p-value = 0.329), Ahmedabad (p-value = 0.165), Brajrajnagar (p-value = 0.605), Kanpur (p-value = 0.744), Varanasi (p-value = 0.134), and Agra (p-value = 0.506)], and negative correlation in another 07 cities [Dewas (p-value = 0.002), Mandi Gobindgarh (p-value = 0.955), Patna (p-value = 0.685), Ghaziabad (p-value = 0.005),Tirupati (p-value = 0.046), Hyderabad (p-value = 0.010), and Chennai (p-value = 0.015)] with increasing O3 during the second phase/lockdown in 2020 (Table S1). The obtained result of the central Indian landlocked city Dewas revealed one unit decrease of toluene increases 2.938 unit of O3 significantly (p-value = 0.002) during the second phase/lockdown of 2020 (Table S1). On the other hand, toluene also demonstrated positive correlations in 09 cities, and negative correlations in 02 cities with decreasing O3 during the second phase/lockdown of 2020.
The ethylbenzene exhibited positive correlations in 04 cities, i.e., Dewas (p-value = 0.042), Mandi Gobindgarh (p-value = 0.729), Gaya (p-value = 0.222), and Chennai (p-value = 0.597), whereas, negative correlations in 05 cities, i.e., Delhi (p-value = 0.653), Patna (p-value = 0.038) Gurugram (p-value ≤ 0.001), Ahmedabad (p-value = 0.884), and Brajrajnagar (p-value = 0.278), with increasing O3 during the second phase/lockdown of 2020. In Gurugram, this result showed that one unit decrease of ethylbenzene increases 3.289 unit of O3. However, it also demonstrated positive correlations in 02 cities, i.e., Asansol and Faridabad; and negative correlation in 05 cities, i.e., Bengaluru, Howrah, Jaipur, Kolkata, and Mumbai, with decreasing O3 during this phase (Table S1).
Though xylene demonstrated positive correlations in 03 cities, i.e., Patna (p-value = 0.021), Ghaziabad (p-value = 0.258), and Hyderabad (p-value = 0.939), and negative correlations in 06 cities like Delhi (p-value = 0.110), Gurugram (p-value = 0.647), Gaya (p-value = 0.490), Tirupati (p-value = 0.732), Ahmedabad (p-value = 0.166), and Varanasi (p-value = 0.015) with increasing O3. The obtained results of north Indian city Varanasi showed one unit decrease of xylene increases 17.668 unit of O3 significantly (p-value = 0.015) during the second phase/lockdown of 2020 (Table S1). However, it showed negative correlation in 03 cities (Faridabad, Kolkata, and Visakhapatnam) and positive correlations in 02 cities (Lucknow and Howrah) where O3 concentration decreased during this period (Table S1).
NO2 exhibited positive correlations in 10 cities including Dewas (p-value = 0.009), Muzaffarpur (p-value = 0.297), Noida (p-value = 0.509), Delhi (p-value = 0.568), Gurugram (p-value = 0.001), Gaya (p-value ≤ 0.001), Ghaziabad (p-value ≤ 0.001), Tirupati (p-value = 0.138), Hyderabad (p-value = 0.185), and Chennai (p-value = 0.408); while negative correlations in 08 cities including Singrauli (p-value ≤ 0.001), Mandi Gobindgarh (p-value = 0.583), Patna (p-value = 0.228), Jodhpur (p-value = 0.411), Ahmedabad (p-value = 0.096), Kanpur (p-value = 0.732), Varanasi (p-value = 0.040), and Agra (p-value = 0.696) with higher O3 during the second phase/lockdown of 2020. In the case of Singrauli and Varansi, the multiple regression results indicated one unit decrease of NO2 increases 0.751 and 5.076 unit of O3 significantly (Table S1). Although, it showed positive correlations in 06 cities, and negative correlation in 05 cities with reducing O3 during the second phase/lockdown of 2020 (Table S1).

3.4. Correlation between O3 and Meteorological Variables

Meteorological variables play an important role in the formation, dispersion, transportation, and dilution of air pollutants. Consequently, the variation in local meteorological conditions such as AT, RH, and WS can affect the temporal and spatial variation in tropospheric O3. The correlation between O3 and its meteorological variables (like AT, RH, and WS) has been determined using a multiple linear regression model during the second phase/lockdown of 2020 (Table S1). AT demonstrated positive correlations in 15 cities, i.e., Dewas (p-value = 0.039), Mandi Gobindgarh (p-value = 0.377), Noida (p-value = 0.007), Delhi (p-value = 0.002), Patna (p-value = 0.470), Gurugram (p-value = 0.121), Jodhpur (p-value = 0.093), Ghaziabad (p-value = 0.531), Tirupati (p-value = 0.031), Ahmedabad (p-value ≤ 0.001), Brajrajnagar (p-value ≤ 0.001), Hyderabad (p-value = 0.062), Chennai (p-value ≤ 0.001),Kanpur (p-value = 0.211), and Agra (p-value = 0.035), and negative correlations in 04 cities, i.e., Singrauli (p-value = 0.059),Muzaffarpur (p-value = 0.845), Gaya (p-value = 0.061) and Varanasi (p-value = 0.499) with increasing O3. In the national capital Delhi, the result manifests one unit increase of AT increases 1.692 units of O3 concentrations. In the coastal south Indian city Chennai, the multiple regression result also showed one unit increase of AT significantly increases 6.898 unit of O3 during the second phase/lockdown of 2020 (Table S1). However, it showed positive correlations in 05 cities (Kolkata, Lucknow, Visakhapatnam, Thiruvananthapuram, and Thane), and negative correlations in 06 cities (Asansol, Bengaluru, Faridabad, Howrah, Jaipur, and Mumbai) with reducing O3 during the second phase/lockdown of 2020 (Table S1).
RH exhibited non-significant positive correlations in 03 cities, i.e., Patna (p-value = 0.880), Varanasi (p-value = 0.622), and Chennai (p-value = 0.434), and negative correlation in 16 cities with increasing O3; as well as showing positive correlations in 01 city Thiruvananthapuram and negative correlations in 10 cities where O3 decreased during the second phase/lockdown of 2020 (Table S1). In Ghaziabad and Jodhpur, it has been determined one unit decrease of RH significantly increases 0.736 and 1.474 unit of O3 (Table S1).
WS showed positive correlations in 05 cities, i.e., Noida (p-value = 0.265), Ghaziabad (p-value = 0.597), Brajrajnagar (p-value = 0.371), Ahmedabad (p-value = 0.130), and Kanpur (p-value = 0.983), and negative correlations in 14 cities, i.e., Dewas (p-value ≤ 0.001), Singrauli (p-value = 0.186), Muzaffarpur (p-value = 0.393), Mandi Gobindgarh (p-value = 0.612), Delhi (p-value = 0.214), Patna (p-value = 0.375), Gurugram (p-value = 0.581), Jodhpur (p-value = 0.831), Gaya (p-value = 0.027), Tirupati (p-value = 0.490), Hyderabad (p-value = 0.811), Chennai (p-value = 0.150), Varanasi (p-value = 0.256), and Agra (p-value = 0.866) during the second phase/lockdown of 2020. In the case of the central Indian landlocked city Dewas, one unit decrease of WS significantly increases 6.659 unit of O3 during this period (Table S1). However, it demonstrated positive correlations in 04 cities, and negative correlations in 07 cities with decreasing O3 during the second phase/lockdown of 2020 (Table S1).

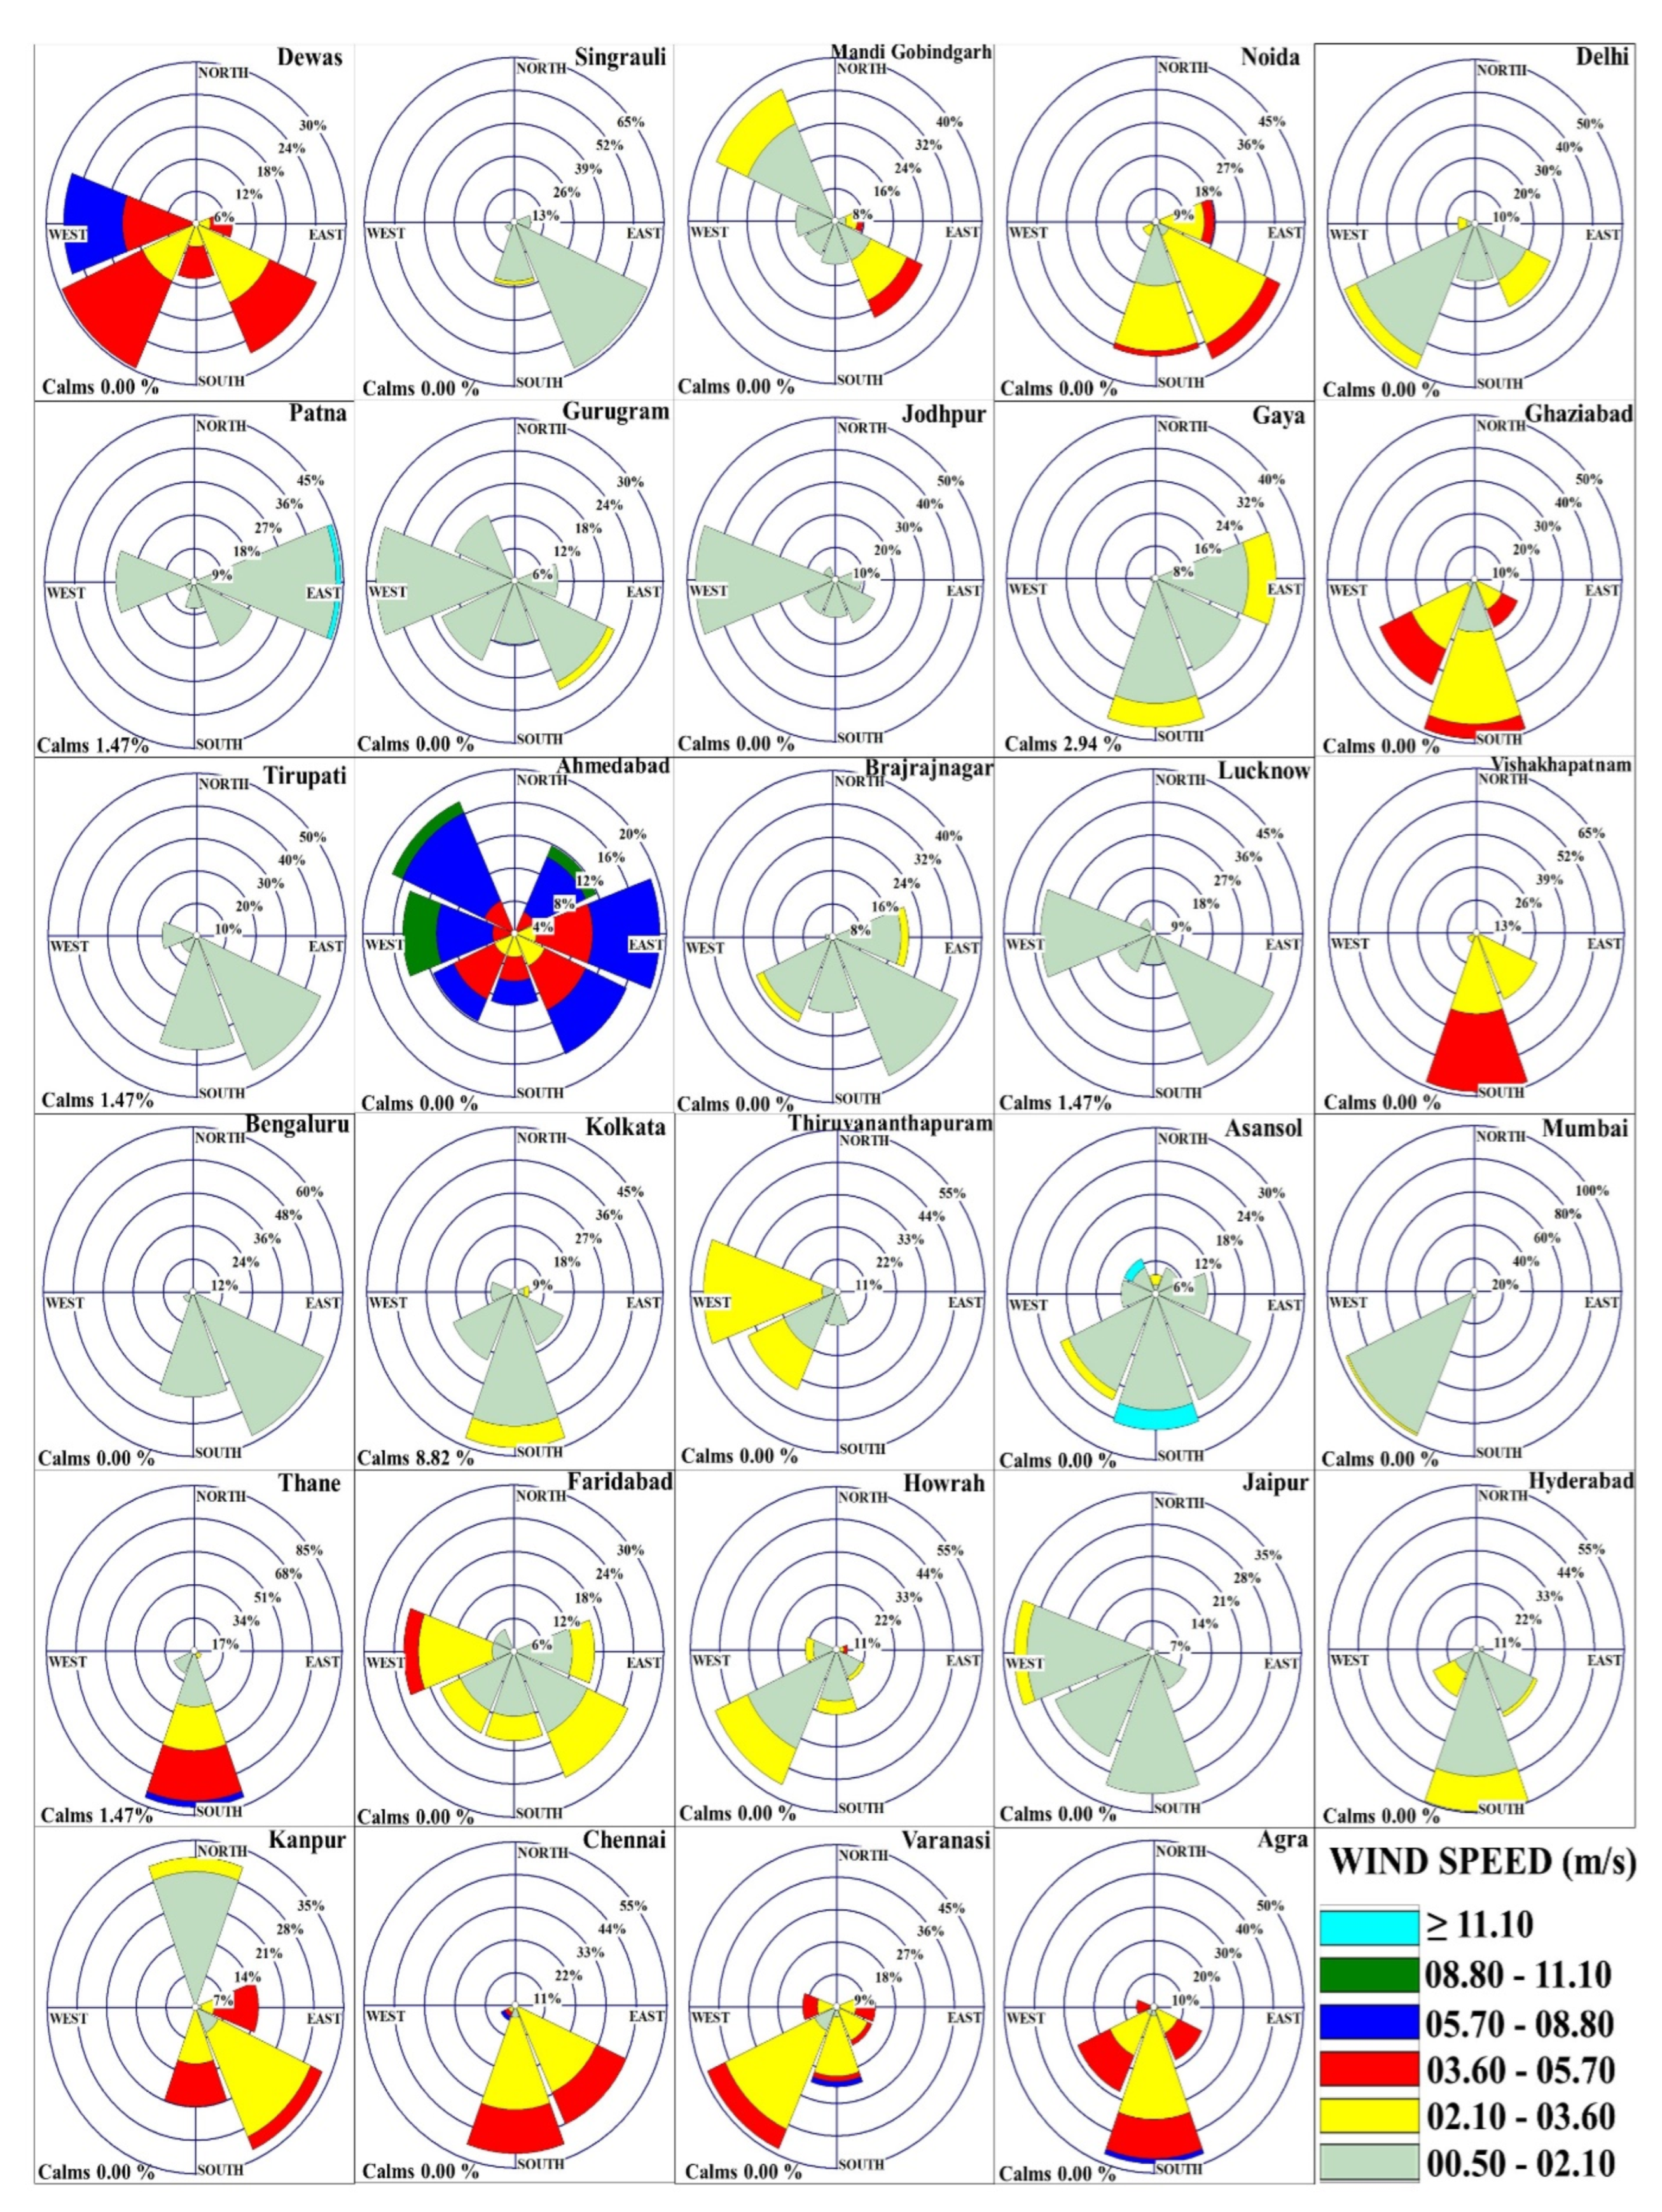
3.5. Temporal and Spatial Variation of Wind Speed and Directions

On average ~4.1 and 1.3 ms−1 wind speed, south-west and south-east were the pre-dominant wind directions of the central Indian landlocked cities, Dewas and Singrauli, during the second phase/lockdown of 2020. In west Indian cities (i.e., Mandi Gobindgarh, Jaipur, and Jodhpur); north-west, west, and south-west were the predominant wind directions with an average WS of ~1.6, 1.3, and 1.1 ms−1, respectively. However, another west Indian city, Ahmedabad, showed variable wind direction with an average speed of ~5.8 ms−1, which can be attributed to enhancing transport or dispersal of O3 from/to the adjoining regions during the second phase/lockdown of 2020 (Figure 4). In north Indian landlocked cities (Noida, Delhi, Gurugram, Ghaziabad, Lucknow, Faridabad, Kanpur, Varanasi, and Agra), the predominant wind direction was south and south-west with an average WS of ~2.2 ms−1. However, particularly in Kanpur, Varanasi, and Agra, the average WS was slightly high, i.e., ~2.5, 3.0, and 3.3 ms−1, respectively, as compared to the other north Indian city that might assist in long-range transport. Although, the south Indian cities (Tirupati, Visakhapatnam, Bengaluru, Thiruvananthapuram, Hyderabad, and Chennai) demonstrated south-east and south-west predominant wind directions with an average WS of ~1.8 ms−1. The predominant wind direction was south and south-east, while an average WS of ~1.1 ms−1 in east Indian cities (Patna, Gaya, Brajrajnagar, Kolkata, Howrah, Asansol) during the second phase/lockdown of 2020 (Figure 4). Here, it has been observed that WS was light in almost all cities during the summer-time lockdown of 2020, indicating native pollution rather than transport or dispersal from/to the adjoining areas.

4. Discussion

As long as the human civilization exists, COVID-19 will be remembered as one of the most unfortunate episodes in the history of humankind; but the ‘imposed lockdown’ that restricted anthropogenic activities executed a ‘positive’ impact on the nature and natural resources. The world has experienced the best possible pollution-free environment, especially in terms of air quality for decades [26,33,34,35,36]. It also offered the researchers and policymakers the opportunity to identify the sources and nodal points that need rectifying for a better and healthier future.
Like the other parts of the world, several studies demonstrated significant improvements in air quality during the lockdown in India. However, the majority of those reports pointed to an unusual higher concentration of O3 during the same lockdown period in a significant number of places throughout the India [33,36]. It was generally found that the increase/decrease phenomena of photochemically processed tropospheric O3 are complicated because of its non-linear relationship with its precursors (NO2 or NOX and VOCs) and meteorological variables; and the reduction of precursor does not necessarily lead to a reduction in tropospheric O3 [21]. Keeping these in mind, the present study only focuses on the tropospheric O3 profile of 30 major cities throughout the India during the lockdown of 2020, with reference to the pre-lockdown of 2020, and the same time span of the previous years 2018 and 2019; and, with the aim to understand if the changes in O3 profile are regional/seasonal precursor and/or meteorological variables dependent/limited or not.
The collected four months (128 days) long summer-time O3 concentrations for the consecutive three years, i.e., 2018, 2019, and 2020, between the period 17 January–31 May (divided into two phases—first phase/pre-lockdown of 2020: 17 January–24 March, and second phase/lockdown of 2020: 25 March–31 May) demonstrated a significant temporal and spatial variations without much changes in the meteorological variables within these years (Figure 2 and Figure S1) [27]. Among these, only the second phase/lockdown of 2020 was significantly different from others, as all the major anthropogenic activities were completely/partially suspended during this time [26,33,34,35,36]. So, the changes in O3 concentrations during these second phases of both 2018 and 2019, as compared to their respective first phases, were largely because of the usual generation and availability of the precursors and meteorological variables; which altered during the second phase/lockdown of 2020. It is important to note that the O3 concentrations recorded in most of these selected cities were under NAAQS (100 µg.m−3); but the concentrations were significantly increased in 14 cities in 2018, 21 cities in 2019, and 19 cities in 2020 during the late summer-time or second phase/lockdown of 2020 (Figure 2 and Figure S1). Sharma et al. [27] also reported similar trends with an average 17% increase in O3 concentrations in 22 Indian cities during the initial lockdown of 2020, as compared to the previous years 2017 to 2019. Upon precursor’s availability, the urban atmosphere can be divided as VOCs/NOX limited. In VOCs limited environment, the higher O3 levels mostly depend on increasing VOCs and rarely on NOX; but in NOX limited environment, the O3 generation pattern and precursor dependence become vice-versa. It is important to determine which environment prevails before developing any O3 management strategies [21].
While analyzing the increasing/decreasing phenomena of tropospheric O3 concentrations in selected Indian cities, the percentage changes in the second phase/lockdown of 2020 as compared to the first phase/pre-lockdown were grouped for all three study years (Figure 3 and Figure S2). In lockdown of 2020, a total of five city clusters, where 19 cities with positive change and 11 cities with negative change of O3 were observed. Though, the number and nature of the city clusters varied from the previous reference years (Figure S2); but 16 cities demonstrated the same increasing/decreasing phenomena as of previous years (Figure 3).
The first city cluster of 13 cities, i.e., Dewas, Singrauli, Muzaffarpur, Mandi Gobindgarh, Noida, Delhi, Patna, Gurugram, Jodhpur, Gaya, Ghaziabad, Tirupati and Ahmedabad, experienced a significant higher O3 (23.4–61% increase over pre-lockdown) during the lockdown of 2020 (Figure 3). The city cluster was mainly dominated by the north and west Indian cities. Among the major precursors and meteorological variables, one or more VOCs (i.e., benzene, toluene, ethyl benzene, and xylene), NO2, and AT showed a significant positive correlation and RH showed a significant negative correlation with O3 formation in most of the northern cities (Table S1). In spite of the lockdown, these densely populated north Indian cities experienced active local pollution sources like domestic emissions, staple burning, thermal power plants, etc., which might have contributed to higher O3 formation [37]. Even the lower wind speed in these landlocked cities also support local source based pollution rather than long-range transport, and/or dispersion (Figure 4) [37]. Chen et al. [19] reported the domestic emissions and staple burning in Uttar Pradesh and Haryana states during the lockdown significantly contributed towards the higher O3 levels of northern cities like Delhi. Kumari and Toshniwal [38] also demonstrated that a nearly 37.3% increase in the O3 in Delhi and Noida during lockdown might be an effect of continuous operational thermal power plants in the area [38]. In another study, Rahaman et al. [36] also reported that the far distance of landlocked north Indian cities from the sea, and meteorological variables like enhanced temperature might contribute to the higher O3 during the lockdown. Both the West Indian cities, Jodhpur and Ahmedabad, also experienced significant higher O3 (37.3 and 61% increase over pre-lockdown), which is positively correlated with toluene and AT, but negatively correlated with other VOCs, NO2, and RH (Table S1). The WS and patterns were significantly different among both the cities. The Jodhpur like other landlocked cities experienced lower WS and distribution patterns; but the Ahmedabad demonstrated positively correlated higher WS and distribution patterns that might contribute to enhancing migration as well as the dispersal of O3 from/to the adjoining areas (Figure 4). Saadat et al. [33] reported a similar study in west Indian cities and concluded O3 levels increase in Jodhpur and Ahmedabad due to a decrease of NO2 during the lockdown. The higher O3 levels in the central Indian cities, Dewas and Singrauli (26.1 and 28.4% increase over pre-lockdown), followed a similar pattern as observed in previous landlocked cities. Being an industrial city, the O3 formation in Dewas showed significant negative correlation with toluene (p-value = 0.002), RH (p-value = 0.006), and WS (p-value ≤ 0.001), but significant positive correlation with NO2 (p-value = 0.009), and AT (p-value = 0.039). The enhancement of O3 in Dewas might be attributed to the higher solar radiation, whereas in Singrauli, the O3 formation was significantly NO2 and RH limited. Several previous studies demonstrated the decline NOX changes NOX-VOCs ratio [39]; and continuous operational Vidyachal super thermal power station might be a major reason behind the higher O3 in Singrauli [40]. Although the south Indian cities demonstrated healthier air quality throughout the years, Tirupati showed the higher O3 formation (47.1% increase over pre-lockdown), which was significantly AT (p-value = 0.031) and RH dependent (p-value = 0.009) (Table S1). Pakkatil et al. [35], also pointed the rising O3 during summer-time lockdown could be attributed to the higher solar radiation which triggers photochemical reactions between NOX and VOCs.
The second city cluster only includes Brajrajnagar of eastern India, which experienced a significant higher O3 of 102.3 µg.m−3 (72.9% increase over pre-lockdown) during the second phase/lockdown of 2020. This comparatively smaller landlocked city (class-II) is surrounded by open cast mines and railway coal siding, which contribute to significant native dust pollution including PM10, PM2.5, and others [41]. Saadat et al. [33] reported a reduction in both PM10 and PM2.5 in Brajrajnagar during the lockdown of 2020. This lower particulate pollution might enhance the solar radiation intensity, AT, and also reduced RH towards a higher O3 formation. The obtained multiple regression results of significant positive correlation of O3-AT (p-value ≤ 0.001) and negative correlation of O3-RH (p-value = 0.002) also support this in Brajrajnagar (Table S1).
The third city cluster of 08 cities, i.e., Lucknow, Visakhapatnam, Bengaluru, Kolkata, Thiruvananthapuram, Asansol, Mumbai and Thane, showed lower O3 (17.9–42.3% decreased over pre-lockdown) during the second phase/lockdown of 2020 (Figure 3). The city cluster was mostly dominated by the south Indian followed by east and west Indian cities. Saadat et al. [33] and Rahaman et al. [36] both reported similar reduced O3 formation in all these cities mainly due to lower availability of precursors molecules and critical meteorological dynamics (Table S1). Except for coastal cities like Visakhapatnam, Thiruvananthapuram, and Thane, the WS and distribution patterns indicated more towards local pollution than transport or dispersion (Figure 4). Most of the photochemical ways for the elimination of O3 become active while RH rises in the atmosphere. Besides, the higher percentage of RH levels retarded the photochemical processes due to its association with cloudiness and atmospheric instability. In addition, O3 might also be removed from the atmosphere through the deposition of its molecules with water droplets [42,43].
The fourth city cluster including 07 cities represented a complex nature where both non-significant increased and decreased O3 levels were found (Figure 3). 03 out of 07 cities (Faridabad, Howrah, and Jaipur) demonstrated lower O3 (4.8–11.9% decreased over pre-lockdown), and the other 04 cities (Hyderabad, Kanpur, Chennai, and Varanasi) experienced higher O3 (1.6–12.2% increased over pre-lockdown) during the second phase/lockdown of 2020 (Figure 3). Rahaman et al. [36] reported O3 decreased by 7% in the landlocked west Indian city of Jaipur and other landlocked north Indian cities due to the reduction of O3 precursor molecules and meteorological variables dynamics. Among these 03 cities with lower O3, the WS and its distribution patterns in Howrah could not help in long rang transport of O3 (Figure 4). Out of 04 cities with higher O3, in 02 landlocked north Indian cities, i.e., Kanpur and Varanasi, the O3 formation might be due to the reduction of NO2. Rahaman et al. [36] also reported similar increasing O3 levels associated with decreasing NO2. The Kanpur and Varanasi experienced a negative correlation with NO2 and VOCs. However, the WS and distribution pattern of both cities were more or less similar and could help in long range transport (Figure 4). In Chennai, the higher O3 level was VOCs dependent (benzene and toluene) in association with high AT and low RH. Despite of this factor, WS and wind direction also showed an important role in O3 enrichment. During the lockdown in Chennai, the wind was blown from south and south-east from the seaside, with speed ranged between 2.10 to 5.70 m/s. Therefore, the higher O3 might be a result of the sea breeze which transported O3 rich air from the adjoining areas [16]. Even this increase in O3 concentration might be related to chlorine which present in the onshore flow. In general, chlorine oxides VOCs and forms hydroxyl radical (OH), which enhances O3 formation at the coast-line [16]. Pakkattil et al. [35] reported increased BTEX in nearby point sources might also contribute to higher O3 in Hyderabad during the lockdown. The lower WS and its pattern indicated towards native pollution, rather than transport/dispersion (Figure 4).
The fifth city cluster includes Agra of north India, which experienced a highest increase in O3 (130% increase over pre-lockdown) during the second phase/lockdown of 2020. In Agra, O3 formation showed a negative correlation with two VOCs (benzene and xylene), NO2, and WS; but, significant positive correlation with AT (p-value = 0.035) (Table S1). Kumari et al. [44] reported staple burning in agriculture fields of Punjab and Haryana might lead to the downwind transport of major precursors as well as O3 in Agra. Another study of Saxena and Raj [37], depicted higher O3 in Agra owing to the continuous operational of thermal power plants in adjoining areas during the second phase/lockdown of 2020.
A nearly identical city clusters with 16 cities demonstrating similar increasing/decreasing O3 concentrations were observed in the last three years, i.e., 2018, 2019, and 2020 (Figure 3 and Figure S2). Out of these 16 cities, 10 cities (north Indian cities—Noida, Delhi, Ghaziabad, Kanpur, Varanasi and Agra; east Indian cities—Patna and Brajrajnagar; west Indian cities—Mandi Gobindgarh and Ahmedabad) showed increasing O3 during the second phase of 2018 and 2019, and the lockdown of 2020. The other 09 cities (central Indian cities—Dewas and Singrauli; north Indian city—Gurugram; east Indian cities—Muzaffarpur and Gaya; west Indian city—Ahmedabad; South Indian cities—Tirupati, Hyderabad, and Chennai) also demonstrated similar increasing O3 concentrations during the lockdown of 2020; but not in 2018 and 2019. Though the available reports pointed towards the possible unavailability of the precursors; such increased levels of O3 in these cities certainly demonstrate higher future risks [33,34,35,36,37,38,39,40].

5. Conclusions

Following its stable increasing trends over the last few decades, the tropospheric O3 has already become a prime issue for India’s future air pollution management strategies. The issue is more serious as the levels of O3 critically vary through the seasons, geographical locations, and primary pollutants’ inventories. The COVID-19 resulted in the imposition of a 64-days long nationwide lockdown, which helped in the reduction of the major criteria air pollutants levels and emissions throughout India [33]; but the O3 demonstrated the opposites. In the present study, a good number of cities (19 cities, i.e., Dewas, Singrauli, Muzaffarpur, Mandi Gobindgarh, Noida, Delhi, Patna, Gurugram, Jodhpur, Gaya, Ghaziabad, Tirupati, Ahmedabad, Brajrajnagar, Hyderabad, Kanpur, Chennai, Varanasi and Agra, out of 30 major Indian cities with poor air quality records) mainly of north and west India, manifested similar trends. The cluster analyses demonstrated the city clusters with both increased and decreased O3 levels during the lockdown as compared to the pre-lockdown. Furthermore, the multiple linear regression results also indicated that the summer-time O3 formation was mainly VOCs/NOX dependent in most of the cities.
According to the previous reports, in many polluted urban regions, the reduction of NOX levels might have served as a sink for OH radicals; hence, the reduced NOX titration could induce higher O3 [45]. In addition to that, the tropospheric O3 changes considerably depend on diverse local factors, like the VOCs levels or reactivity, oxidant levels, as well as meteorological and seasonal dynamics. Therefore, considering the local emissions and meteorology for O3 generation, appropriate policies and control measures should be taken to supersede the harmful effect of increasing O3. In reality, the variations in NOX and VOCs emissions were often coupled because of similar and common emission sources. An actual and effective control depends on more precise and detailed information of the real time emissions sources form a different timetable. It is also important to note that the present results were obtained based on the COVID-19 lockdown in the summer. A different response of O3 formation to NOX and VOCs regime might be expected in the winter/rainy season.

Supplementary Materials

The following are available online at https://www.mdpi.com/article/10.3390/atmos13071115/s1, Table S1: Multiple linear regression with co-efficient of determination (R2) and significance level (p values) in O3 (y) v/s. benzene, toluene, ethylbenzene, xylene, NO2, AT, RH, and WS. Figure S1: Spatio-temporal variations in O3 concentration for 30 selected Indian cities. (A) 17 January to 24 March 2018. (B) 25 March to 31 May 2018. (C) 17 January to 24 March 2019. (D) 25 March to 31 May 2019. 1. Agra 2. Asansol 3. Brajrajnagar 4. Delhi 5. Faridabad 6. Mandi Gobindgarh 7. Gaya 8. Ghaziabad 9. Gurugram 10. Howrah 11. Lucknow 12. Noida 13. Patna 14. Varanasi 15. Muzaffarpur 16. Visakhapatnam 17. Tirupati 18. Bengaluru 19. Chennai 20. Hyderabad 21. Thiruvananthapuram 22. Dewas 23. Singrauli 24. Ahmedabad 25. Jaipur 26. Jodhpur 27. Thane 28. Mumbai 29. Kanpur 30. Kolkata. Figure S2: Clustering cities based on the percentage change in mean O3 concentration during 25 March to 31 May, as compared to 17 January to 24 March in the years 2018, 2019 for 30 selected Indian cities. Clustering cities with red and blue color boxes show increasing and decreasing O3 concentrations.

Author Contributions

Conceptualization: A.S.; methodology: S.D.; software: S.D., S.N. and A.S.; validation: S.D. and A.S.; formal analysis: A.S. and S.D.; investigation, A.S. and S.D.; resources: A.S.; data curation, S.D. and M.N.S.; writing—original draft preparation: A.S. and S.D.; writing—review and editing: R.R., G.K.A., U.M. and A.S.; visualization: A.S., R.R., G.K.A., U.M., S.N., S.D. and M.N.S.; supervision: A.S. All authors have read and agreed to the published version of the manuscript.

Funding

This research was funded by the Department of Science & Technology and Biotechnology (DST&BT), Government of West Bengal, India to AS (Memo No.: 207 (Sanc.)-ST/P/S&T/5G-14/2018, dated: 20 February 2019).

Institutional Review Board Statement

Not applicable.

Informed Consent Statement

Not applicable.

Data Availability Statement

All data used in this study were obtained directly from the publicly accessible databases of CPCB (https://app.cpcbccr.com/ccr/#/caaqm-dashboard-all/caaqm-landing, accessed on 10 May 2021).

Acknowledgments

AS thankfully acknowledge the Department of Science & Technology and Biotechnology (DST&BT), Government of West Bengal, for providing the financial support in the form of a research project (Memo No.: 207 (Sanc.)-ST/P/S&T/5G-14/2018, dated: 20 February 2019).

Conflicts of Interest

The authors declare no conflict of interest.

References

  1. Lim, S.S.; Vos, T.; Flaxman, A.D.; Danaei, G.; Shibuya, K.; Adair-Rohani, H.; AlMazroa, M.A.; Amann, M.; Anderson, H.R.; Andrews, K.G.; et al. A comparative risk assessment of burden of disease and injury attributable to 67 risk factors and risk factor clusters in 21 regions, 1990–2010: A systematic analysis for the Global Burden of Disease Study 2010. Lancet 2012, 380, 2224–2260. [Google Scholar] [CrossRef] [Green Version]
  2. Monks, P.S.; Archibald, A.T.; Colette, A.; Cooper, O.; Coyle, M.; Derwent, R.; Fowler, D.; Granier, C.; Law, K.S.; Mills, G.E.; et al. Tropospheric ozone and its precursors from the urban to the global scale from air quality to short-lived climate forcer. Atmos. Chem. Phys. 2015, 15, 8889–8973. [Google Scholar] [CrossRef] [Green Version]
  3. Sarkar, M.; Pandey, D.; Rakwal, R.; Agrawal, G.K.; Sarkar, A. Impact of tropospheric ozone pollution on wheat production in Southeast Asia: An update. In Global Climate Change; Elsevier: Amsterdam, The Netherlands, 2021; pp. 235–266. [Google Scholar] [CrossRef]
  4. Cho, K.; Tiwari, S.; Agrawal, S.B.; Torres, N.L.; Agrawal, M.; Sarkar, A.; Shibato, J.; Agrawal, G.K.; Kubo, A.; Rakwal, R. Tropospheric ozone and plants: Absorption, responses, and consequences. Rev. Environ. Contam. Toxicol. 2011, 212, 61–111. [Google Scholar] [CrossRef] [PubMed]
  5. Lelieveld, J.; Dentener, F.J. What controls tropospheric ozone? J. Geophys. Res. Atmos. 2000, 105, 3531–3551. [Google Scholar] [CrossRef]
  6. Giles, J. Hikes in surface ozone could suffocate crops. Nature 2005, 435, 7–8. [Google Scholar] [CrossRef] [PubMed] [Green Version]
  7. United Nations, Department of Economic and Social Affairs: World Population Prospects 2019 Highlights. Available online: https://population.un.org/wpp/Publications/Files/wpp2019_10KeyFindings.pdf (accessed on 10 November 2021).
  8. Garg, A.; Shukla, P.R.; Bhattacharya, S.; Dadhwal, V.K. Sub-region (district) and sector level SO2 and NOx emissions for India: Assessment of inventories and mitigation flexibility. Atmos. Environ. 2001, 35, 703–713. [Google Scholar] [CrossRef]
  9. Kumar, A.; Singh, D.; Singh, B.P.; Singh, M.; Anandam, K.; Kumar, K.; Jain, V.K. Spatial and temporal variability of surface ozone and nitrogen oxides in urban and rural ambient air of Delhi-NCR, India. Air Qual. Atmos. Health 2015, 8, 391–399. [Google Scholar] [CrossRef]
  10. Kunchala, R.K.; Attada, R.; Vellore, R.K.; Soni, V.K.; Mohan, M.; Chilukoti, N. On the understanding of surface ozone variability, its precursors and their associations with atmospheric conditions over the Delhi region. Atmos. Res. 2021, 258, 105653. [Google Scholar] [CrossRef]
  11. Sarkar, A.; Agrawal, G.K.; Shibato, J.; Cho, K.; Rakwal, R. Impacts of Ozone (O3) and Carbon Dioxide (CO2) Environmental Pollutants on Crops: A Transcriptomics Update; INTECH Open Access Publisher: London, UK, 2012; pp. 49–60. [Google Scholar]
  12. Sarkar, A.; Rakwal, R.; Shibato, J.; Agrawal, G.K. Toward Sustainable Agriculture through Integrated ‘OMICS’Technologies: A Quest for Future Global Food Security. J-STAGE 2012, 7, 103–110. [Google Scholar] [CrossRef]
  13. Sarkar, A.; Agrawal, S.B. Elevated ozone and two modern wheat cultivars: An assessment of dose dependent sensitivity with respect to growth, reproductive and yield parameters. Environ. Exp. Bot. 2010, 69, 328–337. [Google Scholar] [CrossRef]
  14. Yadav, R.; Sahu, L.K.; Jaaffrey, S.N.A.; Beig, G. Distributions of ozone and related trace gases at an urban site in western India. J. Atmos. Chem. 2014, 71, 125–144. [Google Scholar] [CrossRef]
  15. Pancholi, P.; Kumar, A.; Bikundia, D.S.; Chourasiya, S. An observation of seasonal and diurnal behavior of O3–NOx relationships and local/regional oxidant (OX= O3 + NO2) levels at a semi-arid urban site of western India. Sustain. Environ. Res. 2018, 28, 79–89. [Google Scholar] [CrossRef]
  16. Mohan, S.; Saranya, P. Assessment of tropospheric ozone at an industrial site of Chennai megacity. J. Air. Waste Manag. Assoc. 2019, 69, 1079–1095. [Google Scholar] [CrossRef] [PubMed]
  17. Sharma, A.; Sharma, S.K.; Mandal, T.K. Ozone sensitivity factor: NOX or NMHCs? A case study over an urban site in Delhi, India. Urban Clim. 2021, 39, 100980. [Google Scholar] [CrossRef]
  18. Reddy, R.R.; Gopal, K.R.; Reddy, L.; Narasimhulu, K.; Kumar, K.R.; Ahammed, Y.N.; Reddy, C.V. Measurements of surface oz one at semi-arid site Anantapur (14.62 N, 77.65 E, 331 m asl) in India. J. Atmos. Chem. 2018, 59, 47–59. [Google Scholar] [CrossRef] [Green Version]
  19. Chen, Y.; Beig, G.; Archer-Nicholls, S.; Drysdale, W.; Acton, W.; Lowe, D.; Nelson, B.S.; Lee, J.D.; Ran, L.; Wang, Y.; et al. Avoiding high ozone pollution in Delhi, India. Faraday Discuss. 2021, 226, 502–514. [Google Scholar] [CrossRef]
  20. Chen, Y.; Wild, O.; Ryan, E.; Sahu, S.K.; Lowe, D.; Archer-Nicholls, S.; Wang, Y.; McFiggans, G.; Ansari, T.; Singh, V.; et al. Mitigation of PM 2.5 and ozone pollution in Delhi: A sensitivity study during the pre-monsoon period. Atmos. Chem. Phys. 2020, 20, 499–514. [Google Scholar] [CrossRef] [Green Version]
  21. Nelson, B.S.; Stewart, G.J.; Drysdale, W.S.; Newland, M.J.; Vaughan, A.R.; Dunmore, R.E.; Edwards, P.M.; Lewis, A.C.; Hamilton, J.F.; Acton, W.J.; et al. In situ ozone production is highly sensitive to volatile organic compounds in Delhi, India. Atmos. Chem. Phys. 2021, 21, 13609–13630. [Google Scholar] [CrossRef]
  22. Vukovich, F.M.; Sherwell, J. An examination of the relationship between certain meteorological parameters and surface ozone variations in the Baltimore–Washington corridor. Atmos. Environ. 2003, 37, 971–981. [Google Scholar] [CrossRef]
  23. Alvim-Ferraz, M.C.M.; Sousa, S.I.V.; Pereira, M.C.; Martins, F.G. Contribution of anthropogenic pollutants to the increase of tropospheric ozone levels in the Oporto Metropolitan Area, Portugal since the 19th century. Environ. Pollut. 2006, 140, 516–524. [Google Scholar] [CrossRef]
  24. Pudasainee, D.; Sapkota, B.; Shrestha, M.L.; Kaga, A.; Kondo, A.; Inoue, Y. Ground level ozone concentrations and its association with NOx and meteorological parameters in Kathmandu valley, Nepal. Atmos. Environ. 2006, 40, 8081–8087. [Google Scholar] [CrossRef]
  25. Khoder, M.I. Diurnal, seasonal and weekdays–weekends variations of ground level ozone concentrations in an urban area in greater Cairo. Environ. Monit. Assess. 2009, 149, 349–362. [Google Scholar] [CrossRef] [PubMed]
  26. Resmi, C.T.; Ye, F.; Satheesh, S.; Nishanth, T.; Mk, S.K.; Balachandramohan, M.; Manivannan, D.; Jianlin, H.; Valsaraj, K.T. Variation of trace gases in Kannur Town, a coastal South Indian city. Environ. Chall. 2021, 5, 100336. [Google Scholar] [CrossRef]
  27. Sharma, S.; Zhang, M.; Gao, J.; Zhang, H.; Kota, S.H. Effect of restricted emissions during COVID-19 on air quality in India. Sci. Total Environ. 2020, 728, 138878. [Google Scholar] [CrossRef] [PubMed]
  28. Li, J.; Wang, Z.; Chen, L.; Lian, L.; Li, Y.; Zhao, L.; Zhou, S.; Mao, X.; Huang, T.; Gao, H.; et al. WRF-Chem simulations of ozone pollution and control strategy in petrochemical industrialized and heavily polluted Lanzhou City, Northwestern China. Sci. Total Environ. 2020, 737, 139835. [Google Scholar] [CrossRef]
  29. Tiwari, S.; Rai, R.; Agrawal, M. Annual and seasonal variations in tropospheric ozone concentrations around Varanasi. Int. J. Remote Sens. 2008, 29, 4499–4514. [Google Scholar] [CrossRef]
  30. Peshin, S.K.; Sharma, A.; Sharma, S.K.; Naja, M.; Mandal, T.K. Spatio-temporal variation of air pollutants and the impact of anthropogenic effects on the photochemical buildup of ozone across Delhi-NCR. Sustain. Cities Soc. 2017, 35, 740–751. [Google Scholar] [CrossRef]
  31. Census of India. Ministry of Home Affairs, Government of India. 2011. Available online: https://censusindia.gov.in/2011census/PCA/A4.html (accessed on 12 January 2022).
  32. Central Pollution Control Board (CPCB). Available online: https://app.cpcbccr.com/ccr/#/caaqm-dashboard-all/caaqm-landing (accessed on 4 November 2021).
  33. Saadat, M.N.; Das, S.; Nandy, S.; Pandey, D.; Chakraborty, M.; Mina, U.; Sarkar, A. Can the nation-wide COVID-19 lockdown help India identify region-specific strategies for air pollution? Spat. Inf. Res. 2021, 30, 233–247. [Google Scholar] [CrossRef]
  34. Mahato, S.; Pal, S.; Ghosh, K.G. Effect of lockdown amid COVID-19 pandemic on air quality of the megacity Delhi, India. Sci. Total Environ. 2020, 730, 139086. [Google Scholar] [CrossRef]
  35. Pakkattil, A.; Muhsin, M.; Varma, M.R. COVID-19 lockdown: Effects on selected volatile organic compound (VOC) emissions over the major Indian metro cities. Urban Clim. 2020, 37, 100838. [Google Scholar] [CrossRef]
  36. Rahaman, S.; Jahangir, S.; Chen, R.; Kumar, P.; Thakur, S. COVID-19’s lockdown effect on air quality in Indian cities using air quality zonal modeling. Urban Clim. 2021, 36, 100802. [Google Scholar] [CrossRef]
  37. Saxena, A.; Raj, S. Impact of lockdown during COVID-19 pandemic on the air quality of North Indian cities. Urban Clim. 2021, 35, 100754. [Google Scholar] [CrossRef] [PubMed]
  38. Kumari, P.; Toshniwal, D. Impact of lockdown measures during COVID-19 on air quality–A case study of India. Int. J. Environ. Health Res. 2020, 32, 503–510. [Google Scholar] [CrossRef]
  39. Aher, S.B.; Nandi, S.; Ramesh, G.; Raj, D.; Patel, L.; Tiwari, R. Effects of COVID-19 lockdown on ambient air pollution in Madhya Pradesh, India. Int. J. Environ. Stud. 2021, 79, 401–416. [Google Scholar] [CrossRef]
  40. Kumari, P.; Toshniwal, D. Impact of lockdown on air quality over major cities across the globe during COVID-19 pandemic. Urban Clim. 2020, 34, 100719. [Google Scholar] [CrossRef]
  41. Barik, R.N.; Pradhan, B.; Patel, R.K. A study of dust pollution around open cast coal mines of ib valley area, brajarajnagar. J. Ind. Pollut. 2005, 21, 305–308. [Google Scholar]
  42. Lal, D.M.; Ghude, S.D.; Patil, S.D.; Kulkarni, S.H.; Jena, C.; Tiwari, S.; Srivastava, M.K. Tropospheric ozone and aerosol long-term trends over the Indo-Gangetic Plain (IGP), India. Atmos. Res. 2012, 116, 82–92. [Google Scholar] [CrossRef]
  43. Zeng, Y.; Cao, Y.; Qiao, X.; Seyler, B.C.; Tang, Y. Air pollution reduction in China: Recent success but great challenge for the future. Sci. Total Environ. 2019, 663, 329–337. [Google Scholar] [CrossRef]
  44. Kumari, S.; Lakhani, A.; Kumari, K.M. Transport of aerosols and trace gases during dust and crop-residue burning events in Indo-Gangetic Plain: Influence on surface ozone levels over downwind region. Atmos. Environ. 2020, 241, 117829. [Google Scholar] [CrossRef]
  45. Wang, H.; Huang, C.; Tao, W.; Gao, Y.; Wang, S.; Jing, S.; Wang, W.; Yan, R.; Wang, Q.; An, J.; et al. Seasonality and reduced nitric oxide titration dominated ozone increase during COVID-19 lockdown in eastern China. NPJ Clim. Atmos. Sci. 2022, 5, 24. [Google Scholar] [CrossRef]
Figure 1. Elevation map of selected Indian cities with their characters and existing population. # IT = Information technology; NTPC = National thermal power corporation; M = Million.
Atmosphere 13 01115 g001
Figure 2. Spatio-temporal variations in O3 concentration for 30 selected Indian cities. (A) 17 January to 24 March 2020. (B) 25 March to 31 May 2020. 1. Agra 2. Asansol 3. Brajrajnagar 4. Delhi 5. Faridabad 6. Mandi Gobindgarh 7. Gaya 8. Ghaziabad 9. Gurugram 10. Howrah 11. Lucknow 12. Noida 13. Patna 14. Varanasi 15. Muzaffarpur 16. Vishakhapatnam 17. Tirupati 18. Bengaluru 19. Chennai 20. Hyderabad 21. Thiruvananthapuram 22. Dewas 23. Singrauli 24. Ahmedabad 25. Jaipur 26. Jodhpur 27. Thane 28. Mumbai 29. Kanpur 30. Kolkata. Note: The concentration range has adopted from the breakpoints of O3 (8 h.) in Indian National Air Quality Index.
Atmosphere 13 01115 g002
Figure 3. Clustering of cities based on the percentage change in mean O3 concentrations during the second phase/lockdown, as compared to the first phase/pre-lockdown of 2020 for 30 selected Indian cities. Clustering cities with red and blue color boxes show increasing and decreasing O3 concentrations; cities with similar increasing and decreasing of O3 concentrations during 2018, 2019, and 2020 are marked as similar (S) in a red and blue color circle.
Atmosphere 13 01115 g003
Figure 4. Temporal and spatial variations of wind speed and directions across 30 selected Indian cities during the second phase/lockdown of 2020.
Atmosphere 13 01115 g004
Publisher’s Note: MDPI stays neutral with regard to jurisdictional claims in published maps and institutional affiliations.

