Article

Assessment of ERA-5 Temperature Variability in the Middle Atmosphere Using Rayleigh LiDAR Measurements between 2005 and 2020

1
Laboratoire Atmosphères, Milieux, Observations Spatiales, UMR 8190, Institut Pierre-Simon Laplace, Université Versailles-Saint Quentin, Université Paris-Saclay, 78280 Guyancourt, France
2
Laboratoire de Météorologie Dynamique/IPSL, CNRS, UMR 8539, École Polytechnique, 91120 Palaiseau, France
3
Commissariat à l’Energie Atomique (CEA), Direction des Applications Militaires (DAM), Campus Île-de-France (DIF) Bruyères-le-Châtel, 91297 Arpajon, France
*
Author to whom correspondence should be addressed.
Atmosphere 2022, 13(2), 242; https://doi.org/10.3390/atmos13020242
Submission received: 3 December 2021 / Revised: 26 January 2022 / Accepted: 27 January 2022 / Published: 31 January 2022
(This article belongs to the Special Issue Middle Atmosphere Dynamics)

Abstract

:
In this study, the temperature biases and the ability of the ERA-5 product to reproduce the LiDAR variability in the 30–80 km altitude range were evaluated for the period 2005–2020, both for the winter and the summer months. During winter, temperatures from the ERA-5 dataset were in good agreement with LiDAR observations up to 45 km, while in the mesosphere, almost 70% of the ERA-5 profiles were cooler than those from LiDAR, except around 65 km. During summer, negative biases of −3 K were observed up to the stratopause, while significant positive biases of more than +10 K were found in the mesosphere. For the winter months, the variability observed by LiDAR, even during sudden stratospheric warming (SSWs) events, was reproduced accurately by the model in the upper stratosphere, but not in the mesosphere. Surprisingly, the LiDAR variability mainly due to propagating gravity waves in the summertime was also not reproduced by ERA-5 in the whole middle atmosphere. The model uncertainty associated with this variability, evaluated afterward with a new method, grew as expected with altitude and was more significant in winter than summer. A principal component analysis of the fluctuations of the temperature differences between the LiDAR and ERA-5 was performed to investigate the vertical coupling between 30 km and 70 km. The three first vertical modes illustrated 76% and 78% of the fluctuations of the temperature difference profiles in summer and winter, respectively, confirming the connection between the studied layers. The leading modes of the summer (49%) and winter (42%) possessed an anti-correlation between the upper stratosphere and the mesosphere, where fluctuations increased (at least ±5 K at 65 km) for both seasons due to the coarse vertical resolution in the model. The other modes showed an agreement between the LiDAR and ERA-5 fluctuations in the upper stratosphere and had a wave-like structure mainly located in the mesosphere, confirming that the model either overlooked or simulated imprecisely the gravity waves, leading to mesospheric inversions. Finally, SSWs impacted the ERA-5 temperature (deviation of ±3 K) some days before and after its trigger around the stratopause.

1. Introduction

Meteorological reanalyses provided by the European Centre for Medium-Range Weather Forecasts (ECMWF) are widely used for weather forecast and by the scientific community in order to access the atmospheric state at any time and to study the different atmospheric processes (e.g., [1,2,3]). Reanalysis, computed by the Integrated Forecasting System (IFS) in the ECMWF model, is defined as being a combination of global available observations with a forecast using a sophisticated community numerical model coupling many different sub-systems including interacting radiative dynamical and chemistry processes. Such reanalyses have been regularly improved thanks to the availability of new observations or model improvements such as their spatial resolution, domain expansion, or new sub-grid processes’ parameterizations. The top altitude and the number of levels increased as forecasts were improved. With these improvements, two types of general circulation model appear: the “high-top” models with a well-resolved stratosphere and the “low-top” models having a coarse resolution in the stratosphere and a lower top boundary [4]. Charlton-Perez et al. [5] compared different climate numerical models within the Fifth Coupled Model Intercomparison Project (CMIP5) experiment with different reanalysis packages MERRA, ERA-Interim, and ERA-40, revealing that high-top models simulate more accurately the stratospheric daily and interannual variability than low-top models. This issue is strong as the stratospheric circulation, which can affect the tropospheric weather (e.g., [6,7]), is therefore better reproduced by models that possess a mesosphere. Thus, adding more levels and the mesosphere domain within the models and the reanalysis packages has seen a growing interest for weather forecast and climate issues.
While the operational version of the ECMWF analysis uses a model in permanent evolution and avoiding any disruption on the analysis series, the ECMWF produces some reanalyses using the same methodology during the total period for climate issues. Since the beginning of reanalysis activities within the ECMWF community, the quality of the atmospheric reanalyses has continuously improved with the development of the forecast models, the new techniques of data assimilation, and the better quality of the new observations. As a result, several generations of reanalysis packages have succeeded each other, such as ERA-15, ERA-40, and ERA-Interim, by improving many aspects each time [8]. The production of the ERA-Interim reanalysis was stopped before 2020 to be replaced by the new and fifth-generation of global reanalysis built by ECMWF, the ERA-5 package, covering the entire mesosphere [9]. Temperatures in the ERA-5 dataset assessed here cover the period from 1950 to the present and implemented 137 verticals levels from the surface up to 0.01 hPa (approximately 80 km) [10]. However, most of the assimilated data are radio soundings lying from the surface to the lower stratosphere and satellite radiance measurements, whose weighting functions peak mainly in the troposphere and the stratosphere [11,12]. Therefore, no operational observations constrain the ERA-5 temperature reanalyses in the mesosphere. Even if the objective of increasing altitude range was primarily to improve the stratospheric part in pulling up the top-model boundary, it is interesting to assess the temperature accuracy both in the stratosphere and the mesosphere domain.
This is why several studies have been undertaken to assess the ERA-5 temperatures in the mesosphere by determining its existing temperature biases with, as in this study, Observatory of Haute-Provence (OHP) LiDAR observations. Some comparisons between LiDAR and the ECMWF operational analyses have already been performed over monthly periods [13,14] and recently above four stations between 1990 and 2017 [15]. A general agreement with LiDAR observations has been found in the upper stratosphere. Large biases have been already observed in the mesosphere, and larger variability in the upper stratosphere during winter than in summer was reported [13,14,15]. This difference between summer and winter is not surprising according to the circulation in the stratosphere [16] due to the wind reversal and the blocking of planetary wave propagation in summer. Temperature biases present in ERA-5 data have evolved with time with the inclusion of new satellite data in the data-assimilation system from COSMIC GPSRO and AMSU-A on NOAA-15 and then on NOAA-16 [17]. According to Marlton et al. [15], the intensification of the warm bias in the upper stratosphere above OHP between 2000 and 2007 is due to the introduction of AMSU-A data from NOAA-16.
In the present work, the temperature biases in the middle atmosphere in the ERA-5 dataset were updated with a seasonal approach for the period between 2005 and 2020. The main novelty here, in order to pursue the previous studies, was the assessment of the variability of the model using LiDAR observations.
Systematic LiDAR observations performed within the Network for the detection of Composition Changes (NDACC) were used for trend estimates [18] and showed they can be used as a benchmark for time continuity for satellite cross-adjustment, long-term analyses, and numerical climate models [19,20].
The LiDAR variability, as well as its climatology have already been investigated at OHP in the south of France [16] and with LiDAR at different locations [21]. The interest of using the OHP LiDAR, in addition to the high quality of its temperature products [20], is the quasi constant number of measurements carried out each month, 10 on average here, allowing a good representation of dynamic phenomena on the scale of a few days. The observation of a polar stratospheric cloud by Keckhut et al. [22] confirms that the OHP located at mid-latitude in the Northern Hemisphere is nearly at the edge of the polar vortex and therefore ideally placed according to disturbances induced by planetary wave propagation and Sudden Stratospheric Warmings (SSWs) [23,24]. As only a few instruments cover the middle atmosphere, it is relevant to choose the OHP LiDAR to evaluate the dynamic representation of the ECMWF model at mid-latitudes in the Northern Hemisphere. Moreover, independent comparisons are allowed as the LiDAR observations are not considered in the assimilated data to construct reanalyses. While the upper atmosphere is mainly forced by surface and lower meteorological events, we propose an advanced analysis of the vertical correlation of the biases to study the processes linking the top and the bottom of the atmosphere. As cooling often accompanies the stratospheric warmings in the mesosphere, the impact of SSWs on the comparisons between the LiDAR and ERA-5 at the stratopause was also investigated.
The paper is organized as follows. The description of OHP Rayleigh-Mie LiDAR observations and ERA-5 reanalyses is given in the next section. In Section 3, the mean temperature difference profiles between the LiDAR and ERA-5 are computed both in winter and in summer. The model variability is assessed in Section 4. Afterward, a method is proposed to quantify the model uncertainty relative to the variability observed by the LiDAR in Section 5. Then, in Section 6, the main systematic biases between the LiDAR and ECMWF are analyzed. In Section 7, the impact of SSWs on the temperature differences at the stratopause is investigated. Finally, a conclusion is given in Section 8.

2. Data Description

2.1. OHP LiDAR

The vertical temperature profiles used in this study came from the routine observations acquired by one of the LiDARs located at the Observatory of Haute-Provence (OHP, 44° N, 6° E). The physics principle of the Rayleigh LiDAR is based on the backscattering of a monochromatic emitted laser pulse by atmospheric molecules providing vertical air density profiles in relative values. More precisely, the backscattered photons by the sounded atmospheric layers are collected by a telescope. Then, the number of photons counted allows for deducing the vertical structure of the density. The hydrostatic equilibrium and the ideal gas law are afterward used to derive a 30–90 km temperature profile, where we expect a pure molecular scattering. The uncertainty attached to this photon-counting follows a Poisson law of statistics and is given by the square root of the number of photons received. The statistical uncertainty is the main limitation for LiDAR observations, and the potential biases are eliminated by robust instrumental design and regular inter-comparison exercises. A complete detailed description of the technique employed, as well as the uncertainties associated has already been presented in several publications [16,25].
The LiDAR Température et Aérosols (LTA) at OHP has measured nightly temperature in the middle atmosphere (M.A.) since 1979, providing around 15–20 mean profiles per month as the sky needs to be clear to perform an observation. This world’s longest LiDAR temperature series have been implemented within the Network for the Detection of Composition Changes (NDACC) for trend studies [26,27] within the ozone-monitoring program, as well as satellite validation [28]. A seeded Nd:YAG laser is used to produce a light pulse at 532 nm with a maximum power of 24 W. The LiDAR has a transmitted beam with a 30 Hz repetition rate and a time and vertical resolution respectively of nearly 3 min and 75 m (other LiDAR characteristics can be found in Keckhut et al. [25]). The time integration of the LiDAR (typically 2–6 h) and the vertical smoothing performed with a Hanning window over 2 km provide accurate temperature in the 30–90 km altitude range with 1 km sampling steps. The temperature uncertainties are mainly due to random errors and can attain an accuracy of 1 K from 30–70 km and 3 K at 80 km [25,29]. Statistical noise increases with altitude as soon as the air density decreases. The top part around 90 km could be affected by background noise estimates and initialization of the pressure profile with the MSIS-90 model [30] becoming rapidly negligible due to its exponential decrease. Despite these existing uncertainties, the OHP Rayleigh LiDAR can accurately capture perturbations generated by gravity waves in the mesosphere around 75 km, confirming the reliability of its temperature measurements at these altitudes [31]. Regular exercises are performed to check the LiDAR’s capability to monitor the long-term temperature changes within the NDACC [28,32,33], and cross-comparisons with a mobile LiDAR allow checking the homogeneity of the network [33,34]. These temperature profiles are all archived in the National Ocean and Atmosphere Administration (NOAA) NDACC and the AERIS portals. The studied period here corresponds to the most recent data extending from 2005 to 2020, during which the OHP LiDAR acquired 1505 nights of observations, i.e., around 10 observations per month. There are no LiDAR data from September 2009 to September 2012 due to the presence of interference between two collocated LiDARs. Outside this period, the LiDAR data are spread uniformly [28].
Figure 1 illustrates the data used here and shows the evolution of the temperature profiles from the LiDAR and the ECMWF for three dates selected in January 2019 during which an SSW event occurred. Thus, according to these profiles, the model accurately simulated the magnitude of the warming in the upper stratosphere where SSWs occur, but not the temperature variations in the mesosphere where the vertical resolution decreases.
LiDAR observations are performed at night, and operations depend on a clear sky. Usually, observations are conducted during the first part of the night between 8 p.m. UTC and midnight and integrated over several hours. Here, temperature profiles from the ERA-5 product were extracted at the starting time of each LiDAR observation to perform individual comparisons. We considered that the average of ERA-5 temperature profiles over the observation time was not necessary as most of the LiDAR acquisitions last 2–3 h and tidal effects are negligible over this small interval of time. Another interest in using LiDAR observations is that they are not assimilated data used to build the ERA-5 product and allow independent comparisons.

2.2. ECMWF: ERA-5 Product

The new ERA-5 product benefits the updated ECMWF Integrated Forecast System (IFS) Cycle 41r2 and better model parametrizations of convection and microphysics. The ERA-5 output is produced throughout hourly on a 0.25° latitude–longitude grid and 137 vertical levels from the surface to the level pressure 0.01 hPa, enhancing both the temporal and spatial resolution compared to the 6 h ERA-Interim product computed on a 0.75 latitude–longitude grid with 60 vertical levels lying from the surface to 0.1 hPa. The distance between the OHP LiDAR and the selected grid cell of ERA-5 is estimated to be about 25 km. For these new reanalyses, a 12 h window between 09:00 UTC and 21:00 UTC and another from 21:00 to 09:00 UTC (the following day) are used by the assimilation system [10]. Currently, the period covered by the complete ERA-5 homogeneous analysis lies from 1950 to the present. The cold bias in the lower stratosphere from 2000 to 2006in the ERA-5 analyses is corrected in the new ERA-5.1 analyses [17].
In this study, we extracted ERA-5 temperatures at the nearest hour of the starting time of the LiDAR acquisition, and then, we compared them with the temperature observed by the OHP LiDAR. Firstly, we used a product to convert the 137 pressure levels into geometric altitude levels for each ERA-5 profile to compare them with LiDAR profiles. Since the vertical resolution is much better in the LiDAR data, we interpolated each LiDAR profile to the corresponding ERA5 profile before computing the difference. In addition, as the geometric altitude levels computed are different for each ERA5 profile, it was also necessary to re-interpolate afterward the differences between the LiDAR and ERA-5 over the altitude range 31–79 km (1 km step by step) in order to evaluate the systematic biases and the variability and to perform the PCA for both seasons.

3. Assessment of Systematic Differences between ERA-5 and the OHP LiDAR

3.1. Result

Due to the variability, two seasons of 3 months were considered. The periods selected correspond to 3 months for both winter (December, January, February) and summer (June, July, August) to avoid the transition period of spring and autumn seasons while the vortex appears and disappears at very different times from one year to another (Figure 2). The LiDAR data possess 368 profiles for the winter season and 381 profiles for the summer season over the period 2005–2020.
In wintertime, LiDAR observations and ERA-5 profiles are in good agreement up to 45 km (Figure 2) with a slight warm bias of the model around 40 km (−1 K). This agreement was also retrieved by Marlton et al. [15], who found a temperature bias of ±1 K up to 1 hPa, confirming the good thermal representation of the model in the stratosphere. This good agreement at zonal mean levels at all latitudes, but with limb sounder observations, was also reported in Wright and Hindley [35], confirming the quality of the ERA-5 product in the stratosphere. In the mesosphere, the biases of the temperature differences are all positive and highly significant (+7 K on average between 50 km and 80 km) and exhibit two maxima of +7 K and +13 K at around 55 km and 75 km, respectively. The temperature differences of the LiDAR and model were assumed to follow a normal law distribution. Therefore, standard deviations in the mesosphere indicate that almost 70% of the ERA-5 profiles are cooler than the temperature derived from LiDAR data, except around 65 km, where differences are minor with a mean difference of +3 K. The LiDAR and ECMWF temperature profiles well illustrate this mean behavior in winter shown in January (Figure 1). Similar results were found above Sodankylä in Finland during December 2015 by Ehard et al. [14], who concluded that these temperature deviations in the mesosphere were amplified by the last horizontal resolution upgrade, as well as by the new cycle of the data-assimilation system.
Regarding the summer period, comparisons show a similar vertical pattern. However, differences in the upper stratosphere are more considerable and more significant with quasi constant negative biases of −3 K. The same behavior in the upper stratosphere was observed by Marlton et al. [15], who found a slight warm bias of the model during the summer months. A positive bias is observed in the entire mesosphere with a mean difference of +10 K around 60 km without decreasing at 65 km, as observed for the winter months. Thus, the trend in the mesosphere during winter is enhanced in summer, where almost all of the ERA-5 profiles are cooler than the LiDAR observations. In the next section, to complete the previous studies focusing only on the model biases, the evaluation of the ERA-5 product is further pursued by studying the model’s ability to simulate the seasonal variability.

3.2. Discussion of Winter Biases in the Mesosphere

In Figure 1, the warming between 50 km and 60 km observed by the LiDAR and temperature inversions occurring around 70 km are not present in the ERA-5 temperature profiles. At first glance, we could be tempted to explain the absence of the warming between 50 km and 60 km in the ERA-5 profiles by the SSW occurring in the lower part affecting the ERA-5 temperature in the mesosphere. However, this difference between the LiDAR and ERA-5 tends to decrease when the temperature increases in the upper stratosphere. Interestingly, this difference observed is retrieved in the profile of mean temperature differences for the winter months (Figure 2). Moreover, few SSW events (18) are covered by LiDAR observations over the studied period, while the mean biases in winter are computed over 368 profiles. This result suggests that the temperature differences in the mesosphere are not due to the occurring SSW, but to, first, systematic biases in the model and fluctuations at small scales, essentially due to gravity waves, observed by the LiDAR, but not simulated by the model in the mesosphere. Indeed, even though gravity waves with large amplitudes are well parameterized in ERA-5 and a vertical smoothing over 2 km has been applied on the LiDAR data, it can maintain observed perturbations whose scales are sub-grid. In order to confirm that this model bias is not related to an imperfect simulation of SSWs, we studied afterward the model variability and the error associated.

4. Study of the Model Variability

4.1. Winter

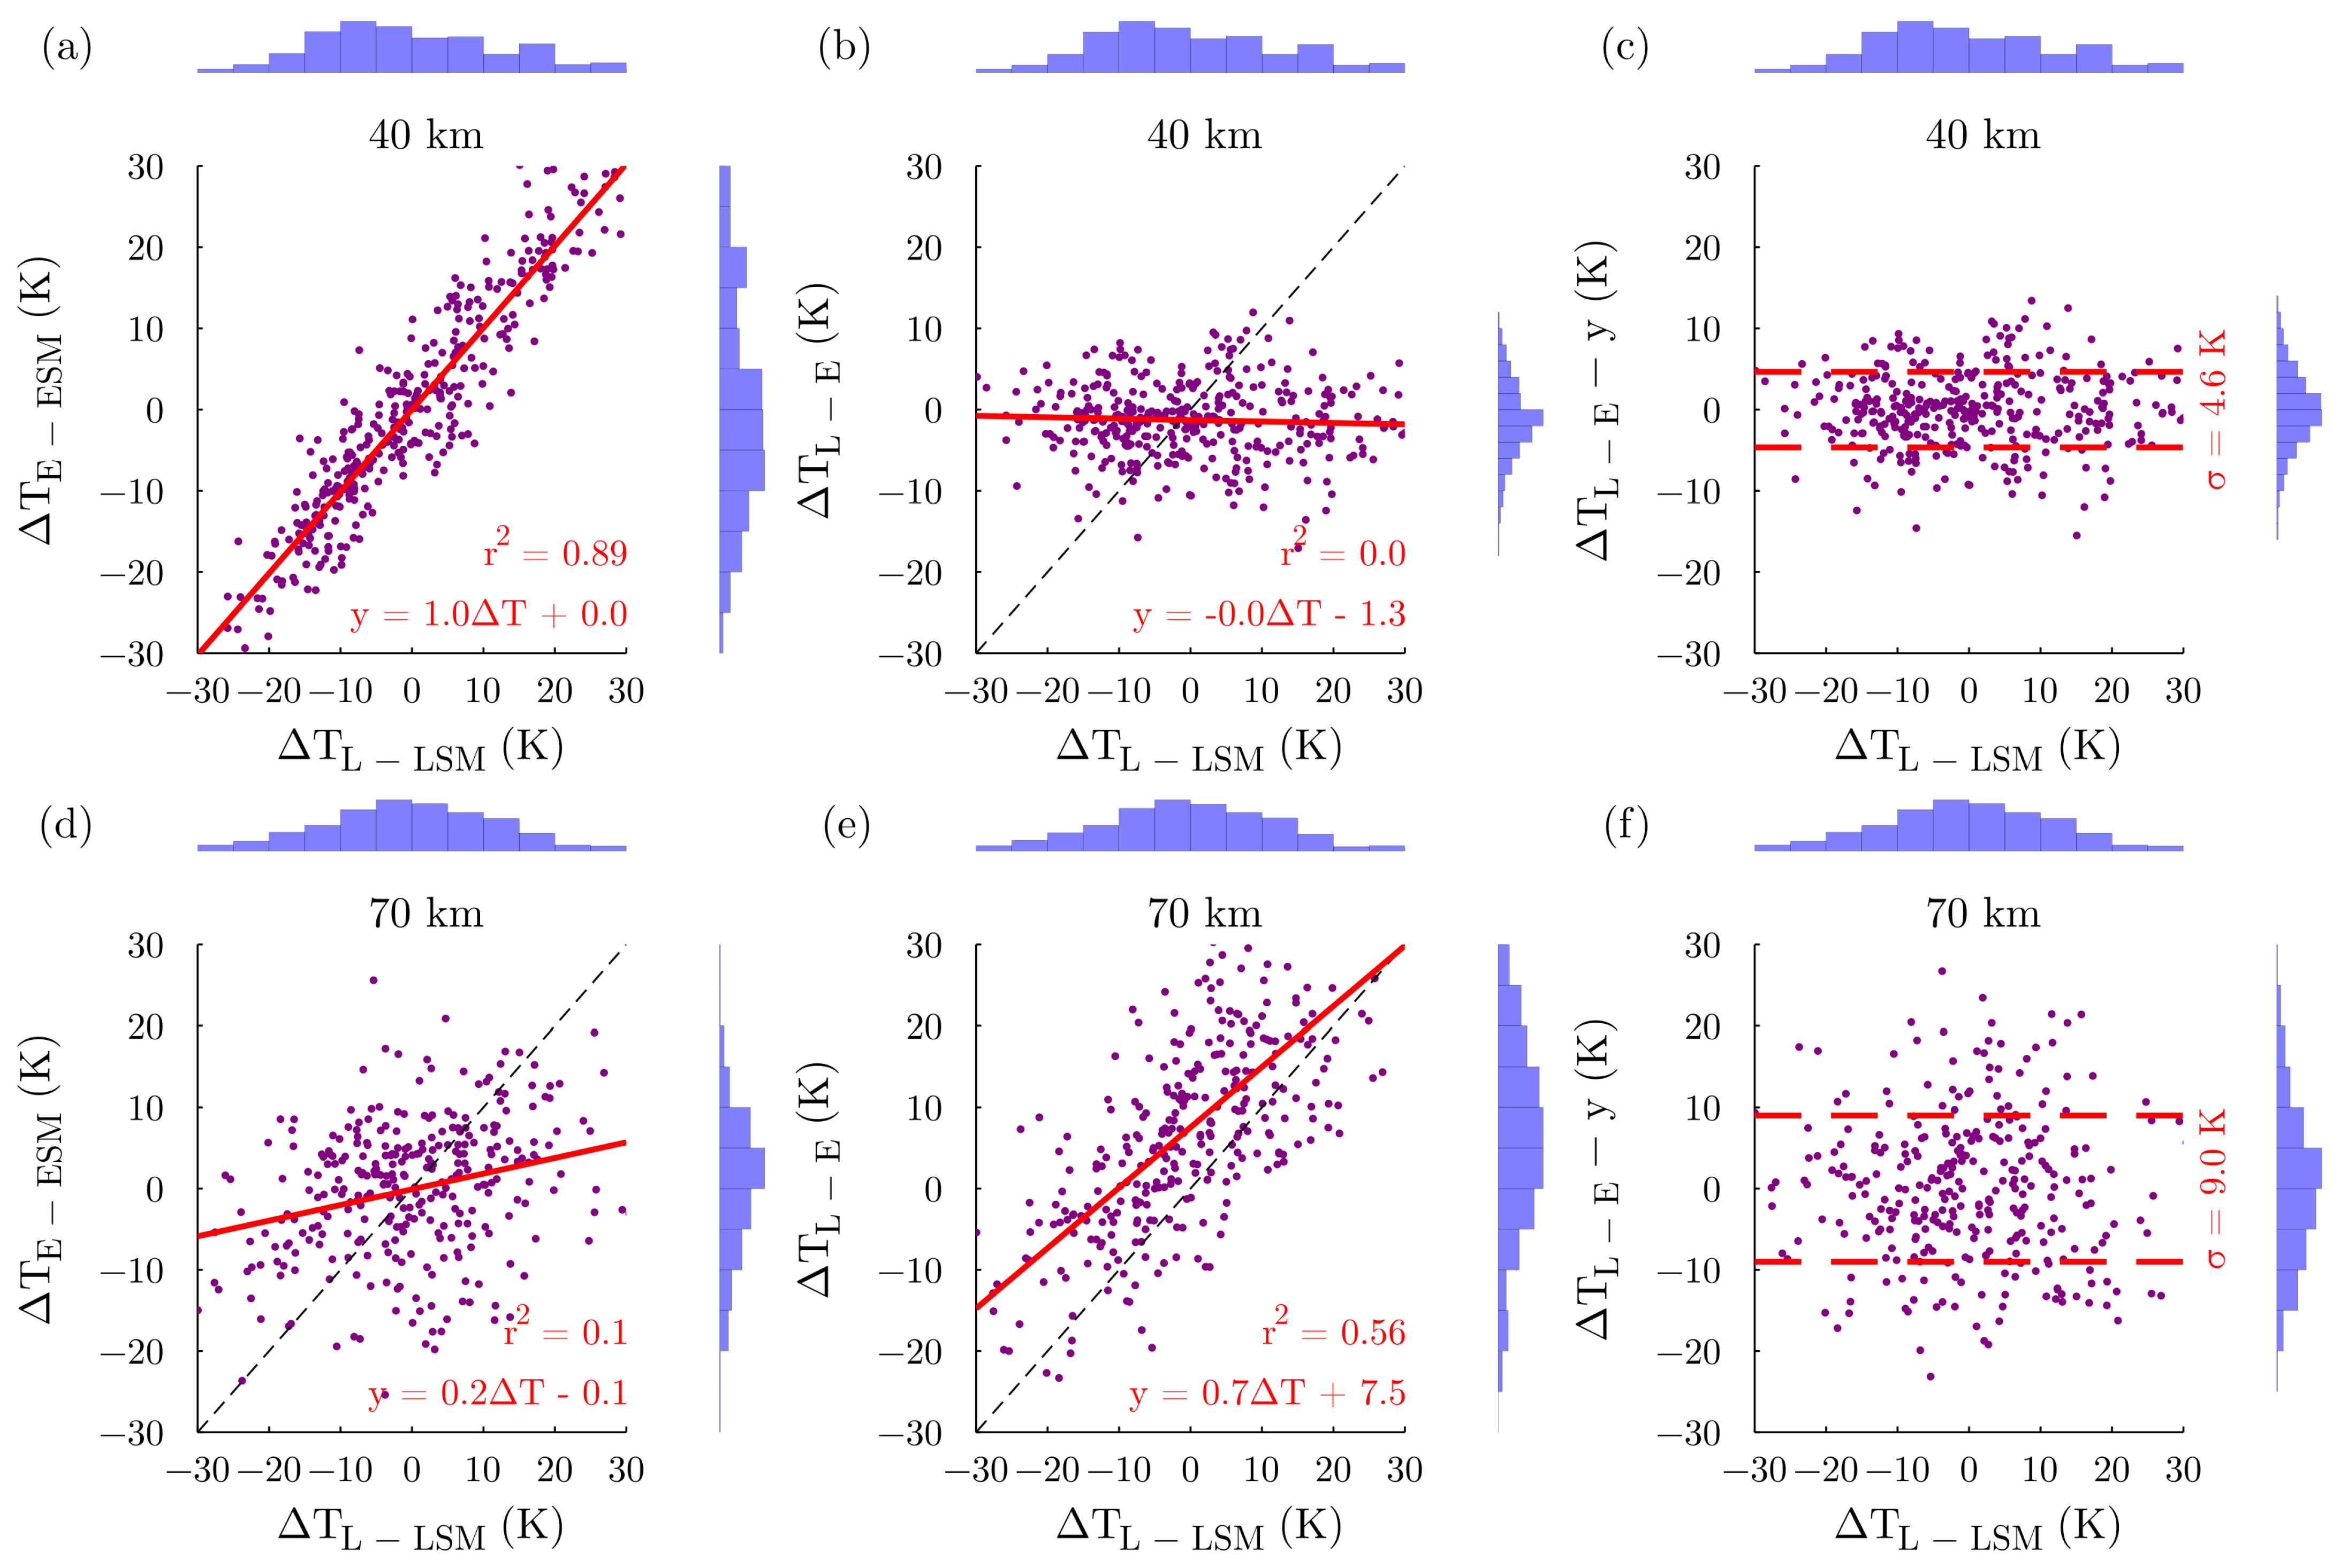
In order to assess the temporal variation of the modeled temperature, the individual temperature differences between the LiDAR and the ECMWF ( Δ T L E ) were calculated over the three respective months of winter and summer at each altitude. The individual temperature deviations of ERA-5 profiles to their seasonal mean ( Δ T E ESM ) and of the LiDAR profiles to their seasonal mean ( Δ T L LSM ) were similarly computed to allow comparisons with Δ T L E . In this section, two comparisons were investigated, the one between Δ T L E and Δ T L LSM and the one between Δ T E ESM and Δ T L LSM . Motivated by the divergence observed between the mean of the temperature difference profiles (Figure 2), these comparisons aimed to assess both the capacity of the model to reproduce the variability observed in the LiDAR measurements and the model divergence to the LiDAR seasonal mean. In the linear regression equations computed between temperature differences Δ T L E and Δ T L LSM , the slope coefficient represents how the observed variability is reproduced in ERA-5 and the y-intercept represents the model bias. Concretely, a slope coefficient of one means that the model behaved as the seasonal mean and did not reproduce the observed variability. This is the opposite for comparisons between Δ T E ESM and Δ T L LSM .
Comparisons at 40 km during winter (Figure 3a) showed an excellent agreement (slope coefficient of one with zero bias) between Δ T E ESM and the temperature fluctuations observed with the LiDAR Δ T L LSM . In addition, the value computed for the determination coefficient ( r 2 = 0.89 ) confirmed the quality of the linear regression applied here. Both temperature fluctuation distributions revealed a bi-modal function with two maxima centered at −10 K and +20 K. This bi-modal distribution was already shown in Angot et al. [23], who concluded that the second peak was associated with SSW events. Despite this high variability, the model succeeded in reproducing the same temperature evolution with its seasonal climatology as the LiDAR observations in the upper stratosphere during winter. The temperature differences between the LiDAR and ERA5 ( Δ T L E ) were afterward corrected by the linear regression ( Δ T L E y ), i.e., we subtracted from each Δ T L E value the corresponding y( Δ T L LSM ), in order to remove the model biases and the variability common to Δ T L E and Δ T L LSM . The small normal distribution found for Δ T L E y with a standard deviation of 4.6 K (Figure 3c) was associated with noise either due to the LiDAR instrumentation or due to model and assimilation effects for the ECMWF. A disagreement was noted in the mesosphere. For example, at 70 km (Figure 3d), the slope coefficient between ERA-5 fluctuations and LiDAR fluctuations decreased down to 0.2, showing that a large part of the variability observed with the LiDAR was not included in the meteorological model. This trend was true in the whole mesosphere. The evolution of the slope coefficients between Δ T E ESM and Δ T L LSM showed that the excellent agreement found in the upper stratosphere decreased from the stratopause (Table 1). This calculation confirmed that the model had a climatology cooler than the LiDAR in the mesosphere during winter. However, around 65 km, the mean difference still exhibited a small bias of +3 K. This suggests that mean differences between both climatologies and the capability to reproduce the LiDAR variability by the model are independent issues. When the differences between the LiDAR and ERA-5 ( Δ T L E ) were compared with the LiDAR fluctuations ( Δ T L LSM ), a linear correlation was found with relative large slope coefficients reaching values as large as 0.8 (Table 1), suggesting that the ECMWF model does not reproduce a significant part of the variability observed by the LiDAR.
Indeed, the slope coefficient between Δ T L E and Δ T L LSM increased from the stratopause, suggesting that the ECMWF model tends to behave as the LiDAR climatology in the mesosphere. The opposite evolution of the slope correlation coefficient over the altitude was observed between Δ T E ESM and Δ T L LSM .
The link between these coefficient evolutions could be that the model parametrization led the model to behave as its climatology in the layers where perturbations responsible for the variability were not perfectly simulated. This result implies that a restoring force to the climatology acts in the model to prevent an inconsistent representation of the mesosphere. In the winter stratosphere, most of the variance is due to the propagation of planetary-scale waves having large amplitudes, sometimes leading to SSWs [36]. Consequently, we can conclude that planetary waves are well reproduced in ERA-5. In contrast, the temperature variance in the winter mesosphere, primarily due to propagating and breaking gravity waves causing mesospheric inversions around 65 km, is not reproduced in ERA-5. The main reason is the coarse vertical resolution of the model in the mesosphere, preventing simulation perturbations at small scales.
Finally, the evolution of the biases associated with the comparisons between Δ T L E and Δ T L LSM followed, as expected, the mean of the temperature difference profiles (Figure 2a). When temperature differences between the LiDAR and model ( Δ T L E ) were corrected by this linear correlation (Figure 3c,f), residual differences were obtained with a distribution shape close to a normal distribution. This suggests that the standard deviation of this quantity increasing with altitude can be related to noise, including instrumental LiDAR noise and other model effects such as the smoothing effect or a restoring force to the climatology.

4.2. Summer

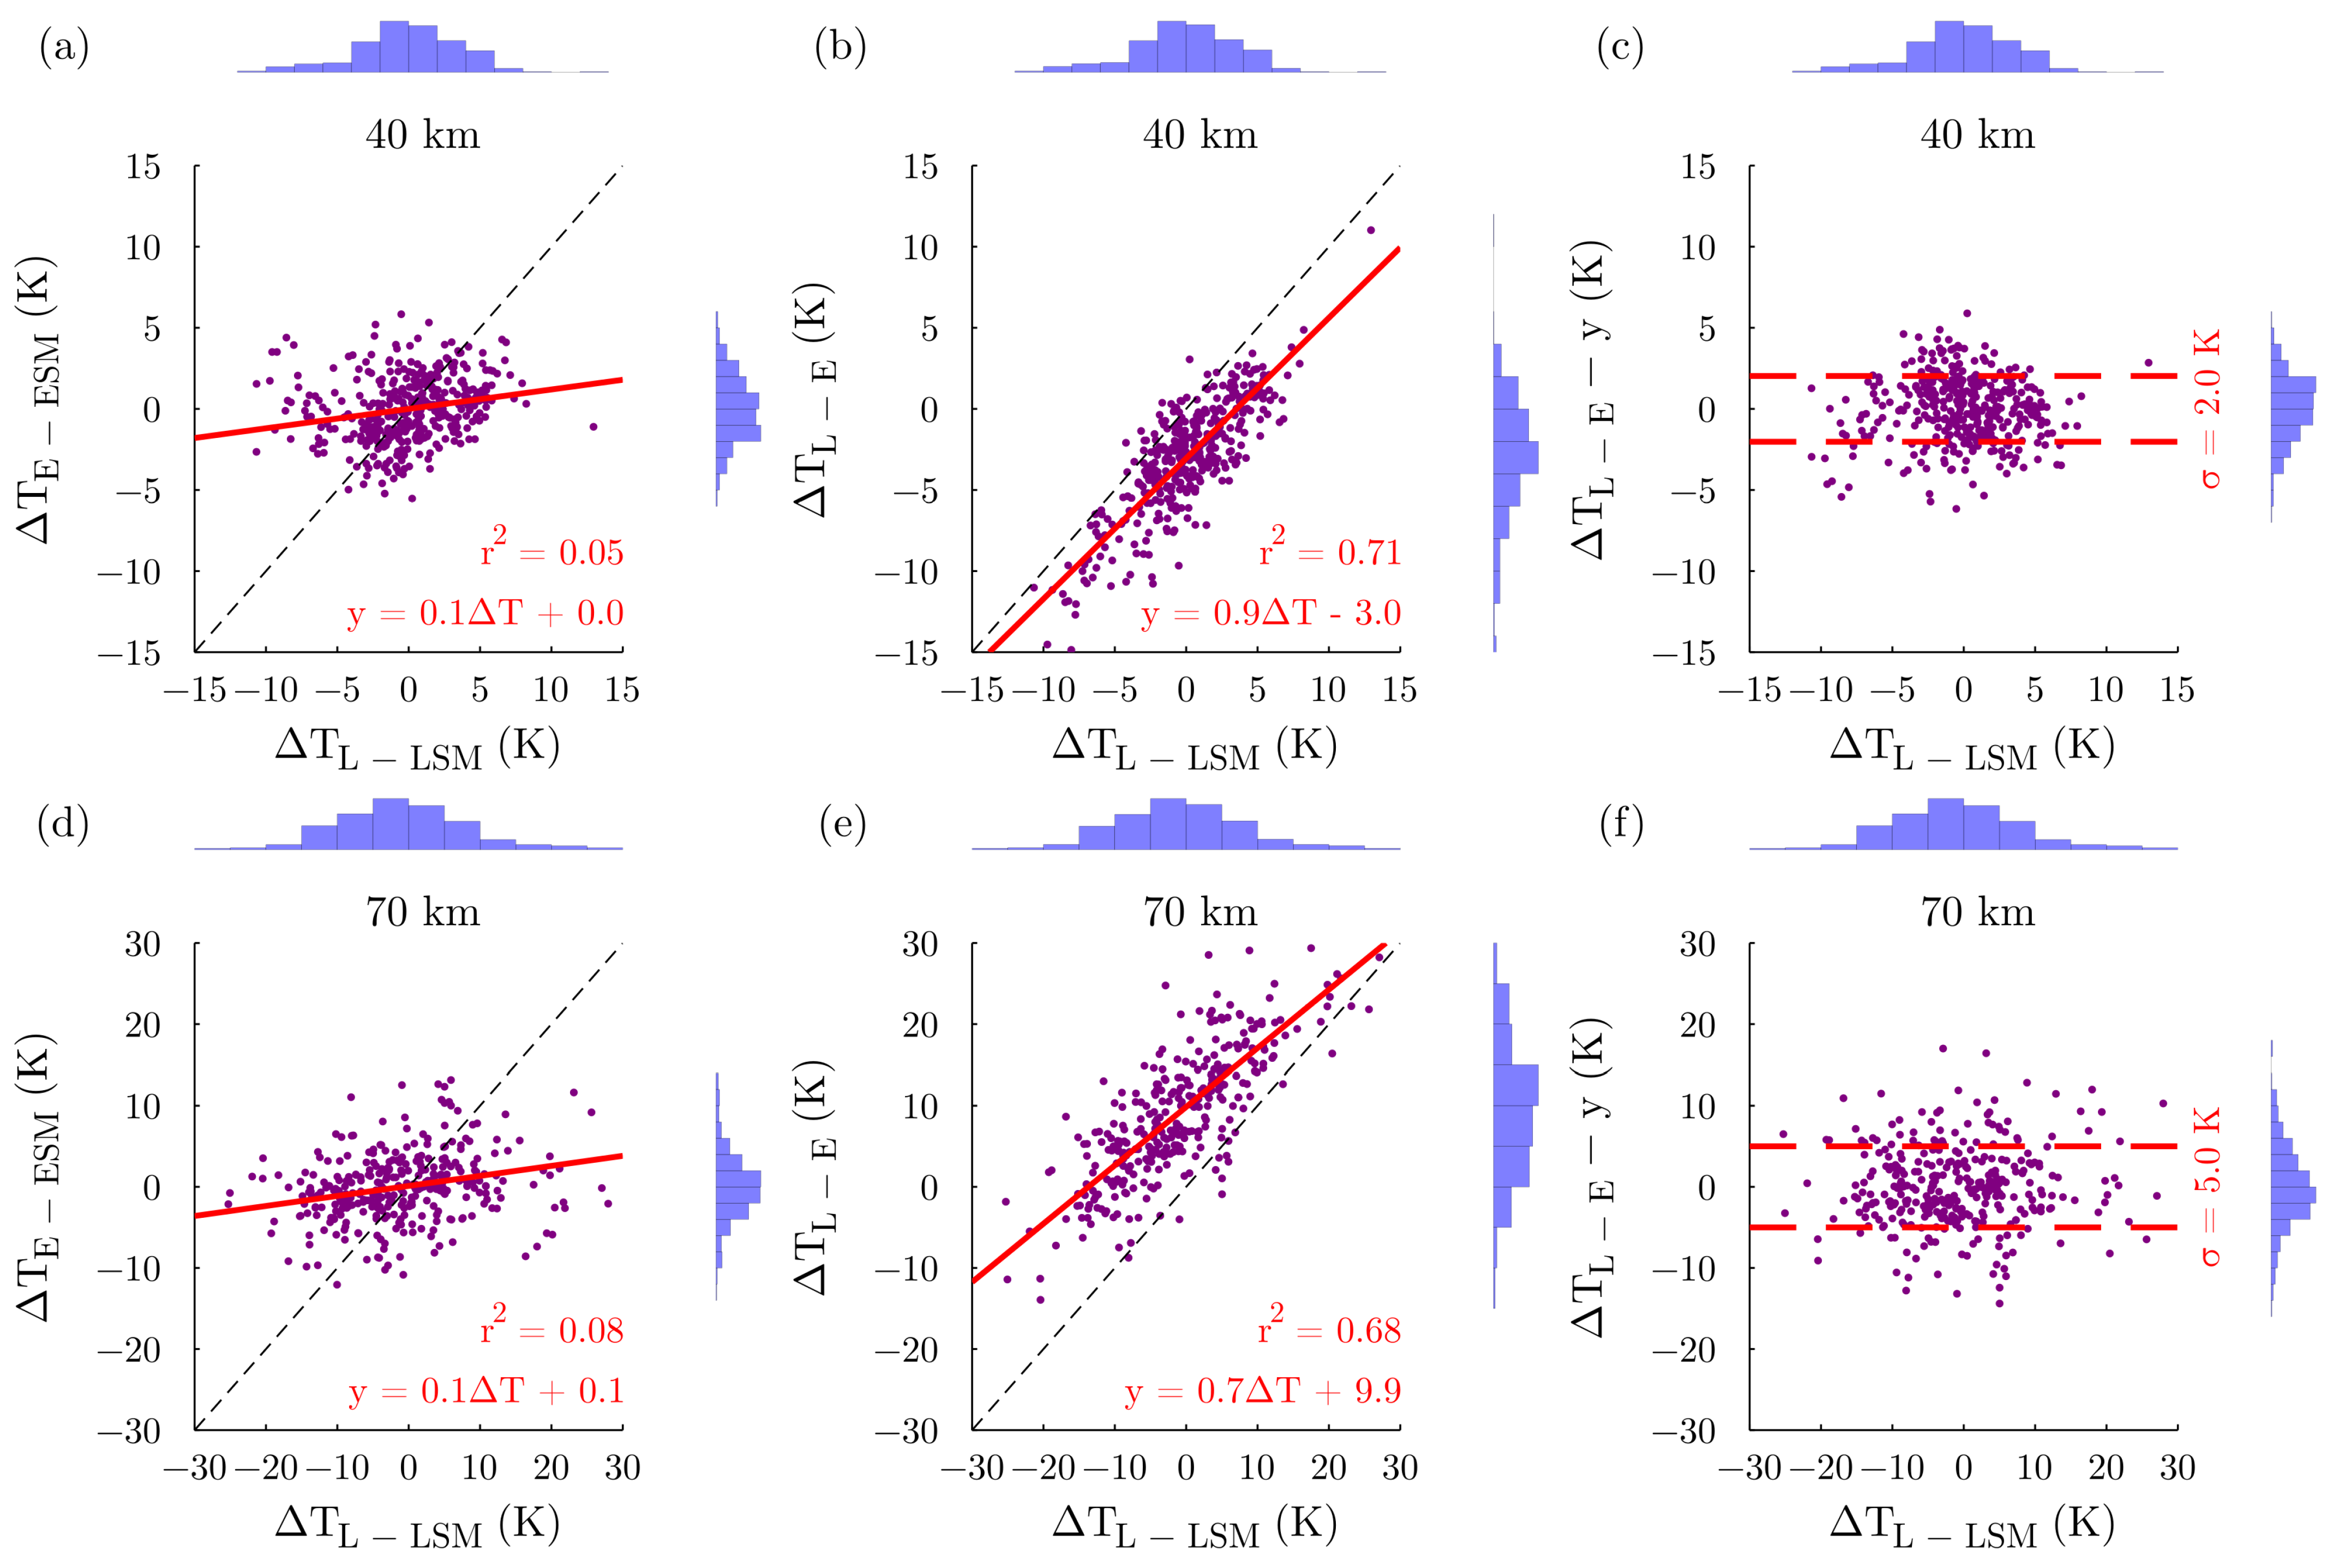
As opposed to the winter period, a small correlation with a slope coefficient of 0.1 is found at 40 km in summer between temperature differences Δ T E ESM and Δ T L LSM (Figure 4a).
Surprisingly, significant correlations were observed between temperature differences Δ T L E and temperature LiDAR deviation from its own climatology Δ T L LSM (Figure 4b), with a slope coefficient of 0.9 and a negative bias of −3 K. This bias is in good agreement with previous comparisons (Figure 2). This high correlation suggests that ERA-5 temperatures are close to the climatology. This result is not limited to the stratosphere, and similar comparisons were obtained in the mesosphere (Figure 4d) with a slope coefficient of 0.1 at 70 km. Again in the mesosphere, the linear correlation of the differences between ERA-5 and the LiDAR also indicates significant correlations with a slope coefficient of 0.7 at 70 km (Figure 4d) and a large positive bias of +9.9 K, in good agreement with the mean comparisons (Figure 2). Hence, the model did not reproduce the summer variability observed in the LiDAR data. These results confirm the model’s trend to behave as the LiDAR climatology when the model does not reproduce the observed variability.
According to previous observations [37], the summer stratosphere is characterized by a weak variability, while a more substantial variability is observed in the upper mesosphere due to inversions occurring mainly in the 70–80 km altitude range. The temperature variance in the summer stratosphere is caused by propagating gravity waves, whose amplitudes are likely smaller in ERA-5 than in the observations and, unlike winter, by the impossible propagation of planetary waves in the middle atmosphere at this period [38]. As the winter, the few available levels between 70 km and 80 km in ERA-5 prevent reproducing the small amplitudes of gravity waves and their breaking, causing mesospheric inversions.
Moreover, it is impossible to infer, as opposed to the winter months, whether the model’s ability to reproduce the variability is impacted or not by the mean difference between both climatologies. As expected, Δ T L E y increases with altitude, lying from 2 K at 40 km to 5 K at 70 km (Figure 4c,f), meaning that the model uncertainty is greater in winter than in summer. Again, the evolution of the biases (Table 2) is consistent with the mean temperature difference profile (Figure 2b) during summer.

5. Evolution of the Model Uncertainty

Independent of the biases observed in the model, it is interesting to estimate the model variability and the associated uncertainty, which is usually difficult to quantify. This uncertainty is due mainly to intrinsic errors in the assimilation process [39] and to its coarse resolution, reducing the parameterization quality of small-scale atmospheric processes such as gravity waves or mesospheric inversions. Thereby, statistical comparisons between the LiDAR and ERA-5 allow evaluating the model variability not observed by that LiDAR that can be associated with an estimate of the model uncertainty for the vertical LiDAR resolution. According to Keckhut et al. [28], the LiDAR succeeds in capturing the fluctuations at small scales generated by breaking gravity waves over the studied altitude range. Thus, as the measured temperature is the sum of the mean plus fluctuations, we can decompose the variance observed by the LiDAR σ L i D A R 2 and the variance simulated by the model σ M o d e l 2 as follows:
σ L i D A R 2 = σ L a r g e S c a l e 2 + σ S m a l l S c a l e 2 + σ L i D A R N o i s e 2 ,
and:
σ M o d e l 2 = σ L a r g e S c a l e 2 + σ M o d e l U n c e r t a i n t y 2 ,
where σ L a r g e S c a l e 2 and σ S m a l l S c a l e 2 are the real geophysical variances at large and small scales, respectively σ L i D A R N o i s e the median of the LiDAR instrumental errors and σ M o d e l U n c e r t a i n t y 2 the uncertainty associated with the model variance. Here, we propose a method to estimate this model uncertainty, which includes small-scale and short-period variability not represented in the ECMWF [13], by using the linear correlation found between Δ T L E and Δ T L LSM :
  • First, the temperature differences between the LiDAR and the ECMWF ( Δ T L E ) were compared to the temperature differences between the LiDAR and its seasonal mean ( Δ T L LSM ) at each altitude;
  • Afterward, the temperature differences between the LiDAR and the ECMWF ( Δ T L E ) were corrected by the linear correlation found with the LiDAR temperature fluctuation ( Δ T L LSM ) in order to remove their common variability and the model biases;
  • Finally, from Equations (1) and (2), we can express the global uncertainty including the model uncertainty and small-scale fluctuations not simulated with this relation:
    σ G l o b a l U n c e r t a i n t y 2 = σ S m a l l S c a l e 2 + σ M o d e l U n c e r t a i n t y 2 = σ ( Δ T L E y ) 2 σ L i D A R N o i s e 2 ,
    where σ ( Δ T L E y ) is the standard deviation of the temperature differences between the LiDAR and the model corrected by the linear regression (Figure 3c,f and Figure 4c,f).
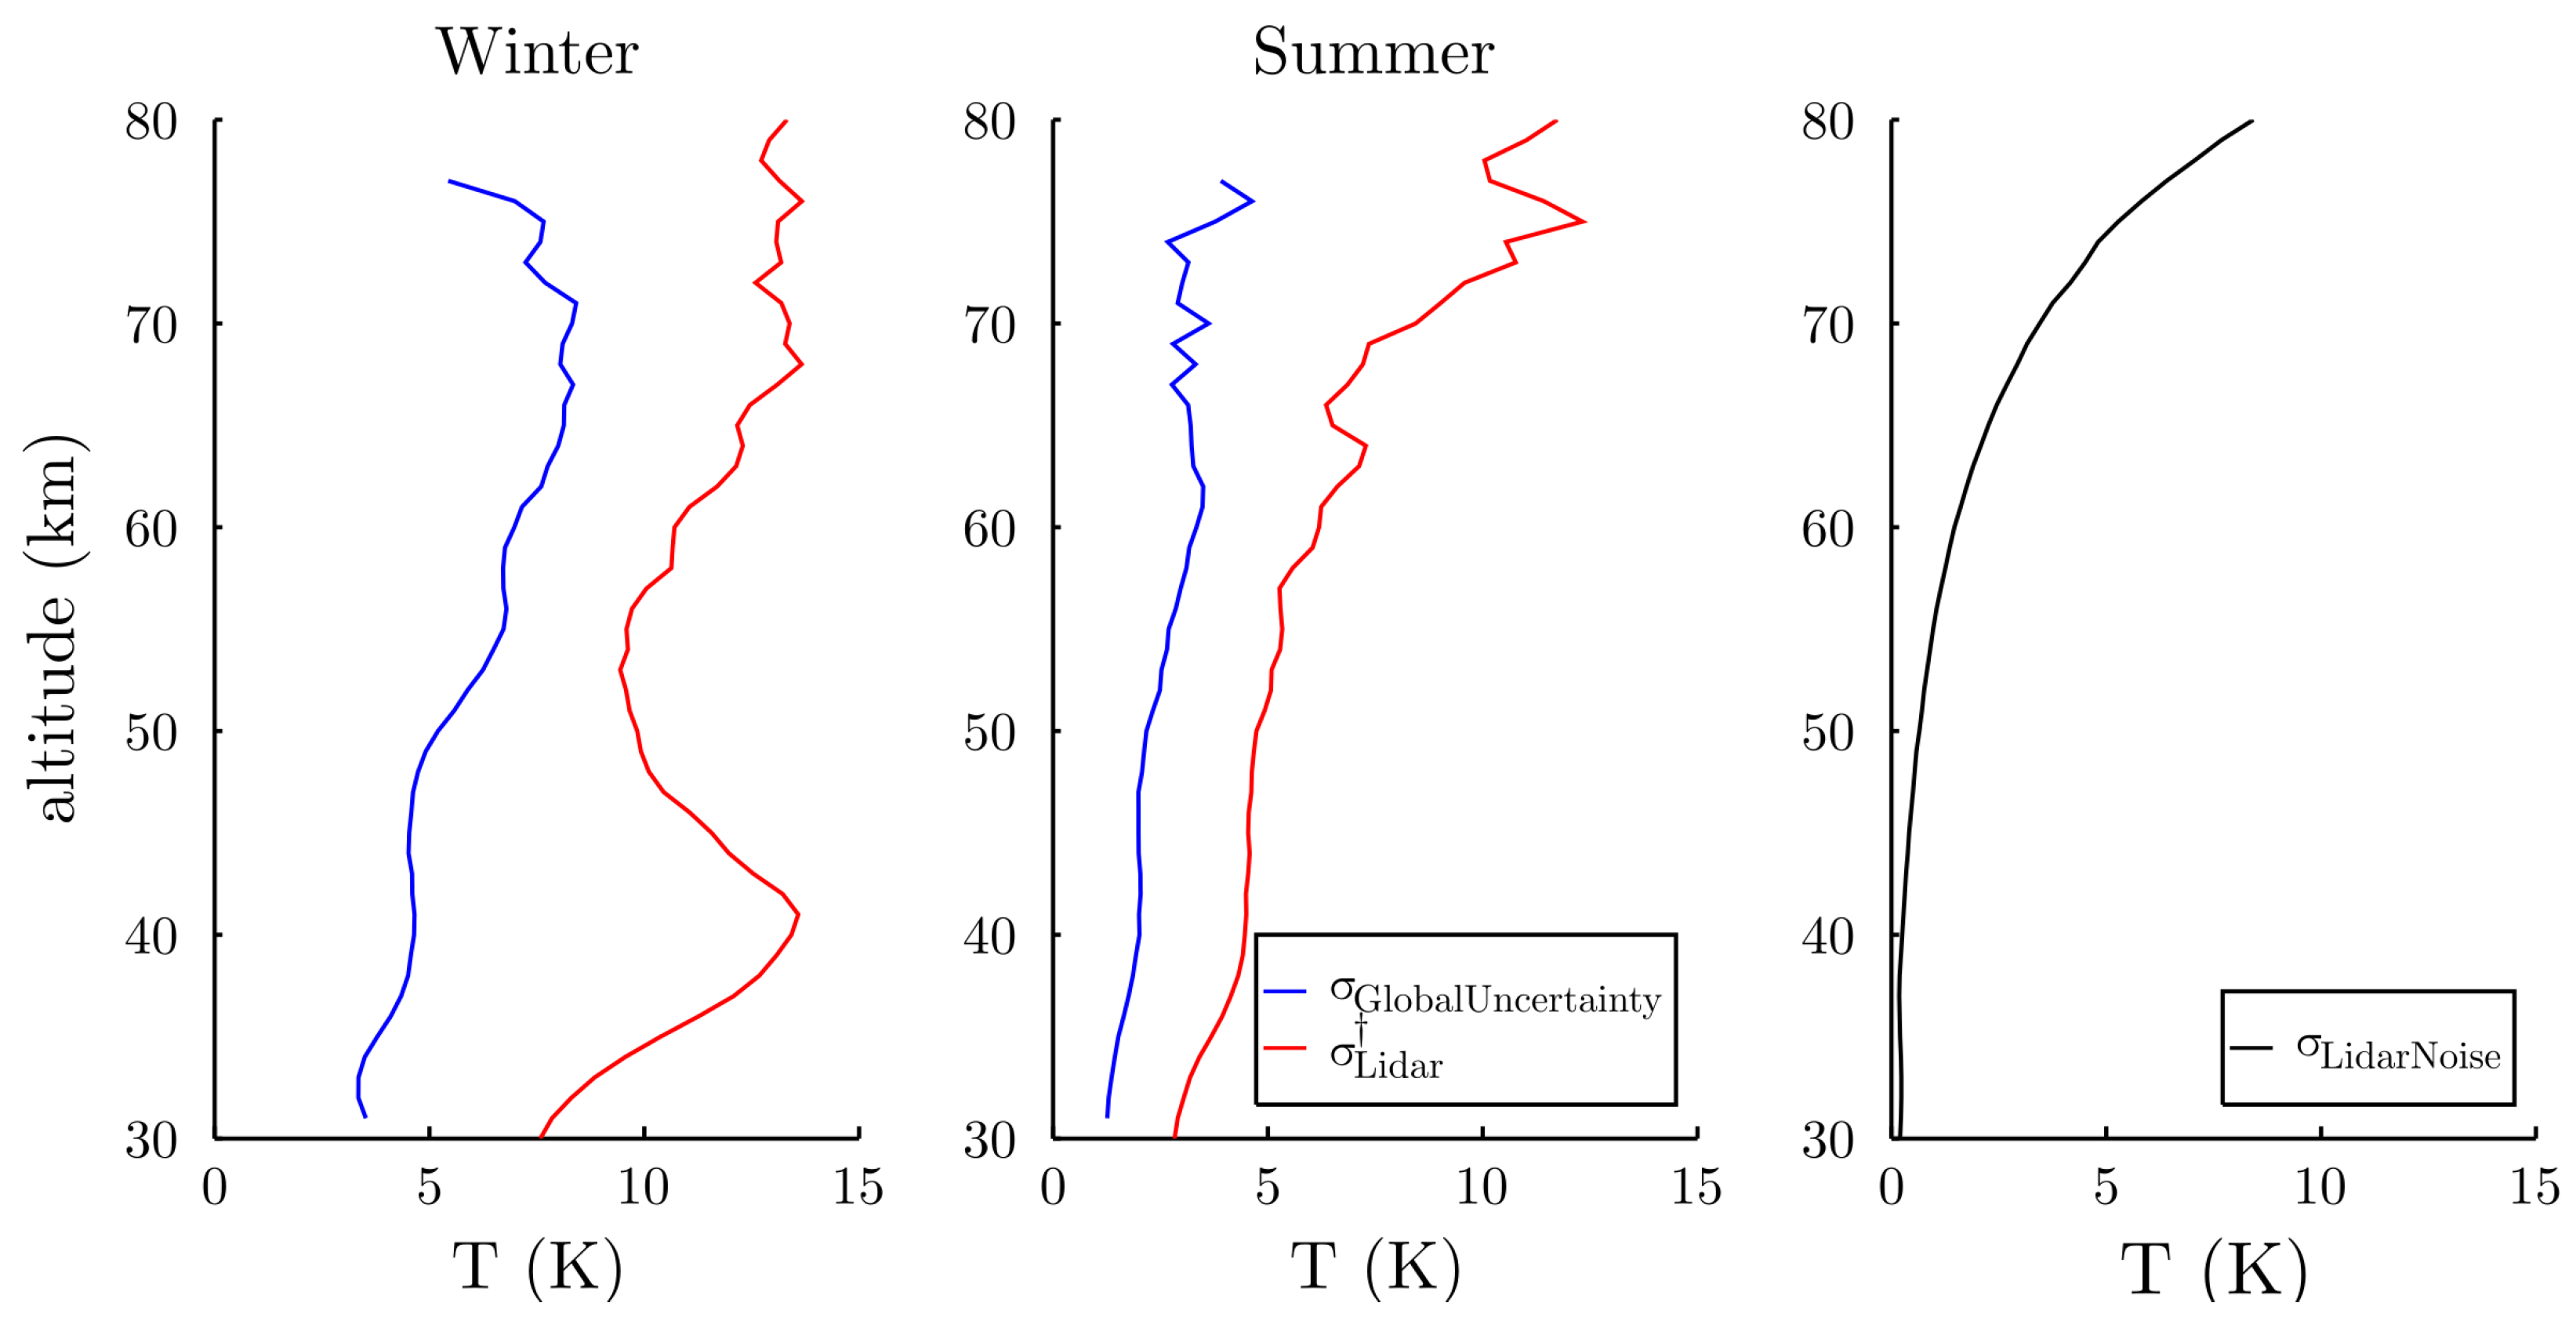
As expected, the model uncertainty and fluctuations at a small scale grow with altitude in both seasons and are higher in winter than in summer in the whole middle atmosphere (Figure 5). The global uncertainty increases from 3–7 K and from 1–4 K between 30 km and 70 km during winter and summer, respectively. In winter, the LiDAR variability reaches a maximum at 40 km, corresponding to the propagation of planetary waves and the effect of the SSWs. Then, the LiDAR variability decreases until the stratopause region and slightly increases up to 80 km. In the upper stratosphere during winter, a large part of the LiDAR variability (65% at 40 km) is reproduced by the model, which could explain the excellent agreement found previously between Δ T E ESM and Δ T L LSM . However, from the stratopause region to 70 km, only a tiny part of the LiDAR variability is reproduced by the model (36% in average), which could explain here the bad agreement found between Δ T E ESM and Δ T L LSM . This result is not surprising because, as discussed in Section 3.2 and Section 4.1, a more significant part of small-scale fluctuations observed by the OHP LiDAR is supposed to be not simulated by the model in the mesosphere. Concretely, the variance generated by small-scale fluctuations contributes more to the global uncertainty in the mesosphere than in the upper stratosphere due to the degradation of the model resolution. Above 70 km, the global uncertainty is poorly estimated, while LiDAR uncertainties (initialization, background noise estimation) are likely overestimated (see Section 2.1). Indeed, LiDAR instrumental errors increase exponentially with altitude to reach more than 3 K at 70 km (Figure 5). Therefore, the model uncertainty should not be considered beyond this altitude. In summer, the LiDAR variability is smaller than during winter. The model reproduces 54% of the LiDAR variability from 30–60 km, which is consistent with the model inability observed above to capture the variability in the summertime in the middle atmosphere. Above 60 km, the increase of the LiDAR variability is explained by mesospheric inversions occurring at these altitudes in the summertime, which are not accurately captured by the ECMWF products either. However, the global uncertainty decreases slightly and remains constant in the upper mesosphere, where its evolution is expected to increase. This result is due to LiDAR instrumental errors that are too high at these altitudes to evaluate the total uncertainty accurately.

6. Temperature Differences and Vertical Coupling

The atmospheric variability is estimated by ERA-5 at each altitude level independently. However, as the atmosphere is a fluid, strong links exist between the different layers as the so-called stratosphere–troposphere coupling (e.g., [6,7]).
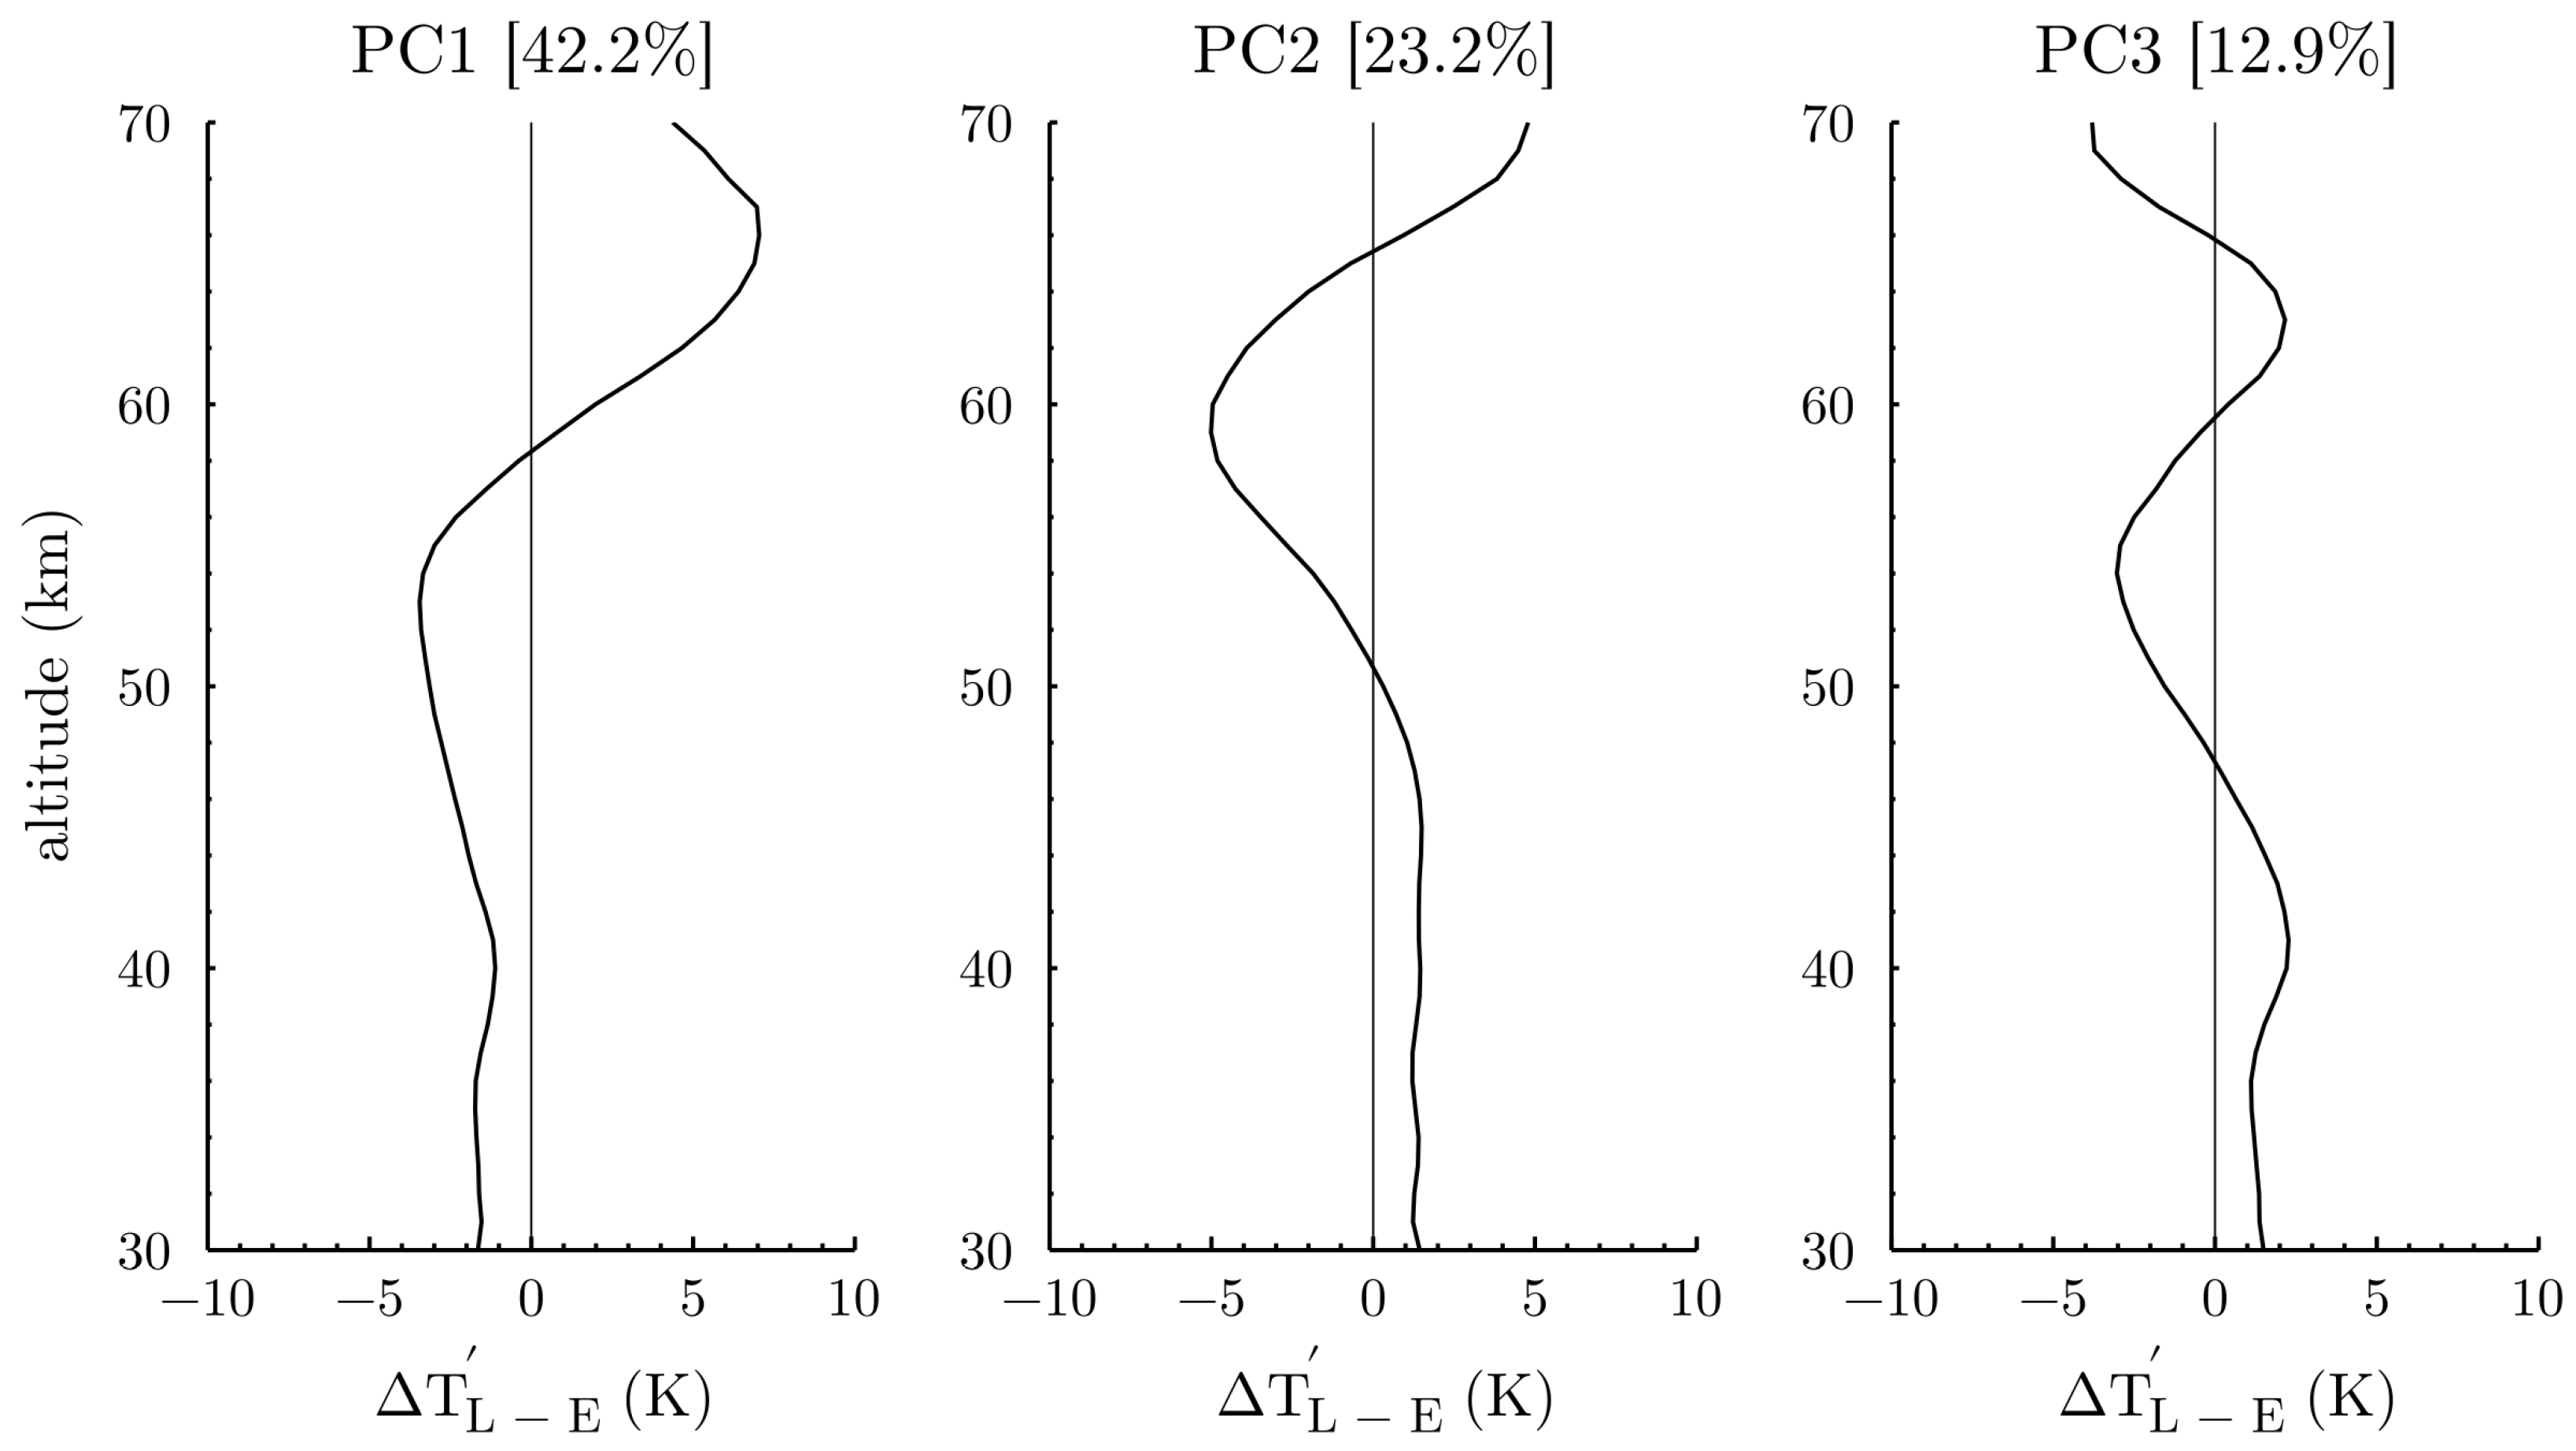
For this reason, a Principal Component Analysis (PCA) was performed on the fluctuations of the temperature differences between the LiDAR and ERA-5 to investigate vertical patterns in the observed and modeled variability reproduced. The PCA was computed over 368 profiles in winter and 381 in summer in the 30–70 km altitude range as the ERA-5 profiles suffer from a coarse resolution in the upper mesosphere. The three first modes explain 76% and 78% of the total variance in summer and in winter, respectively (Figure 6 and Figure 7).
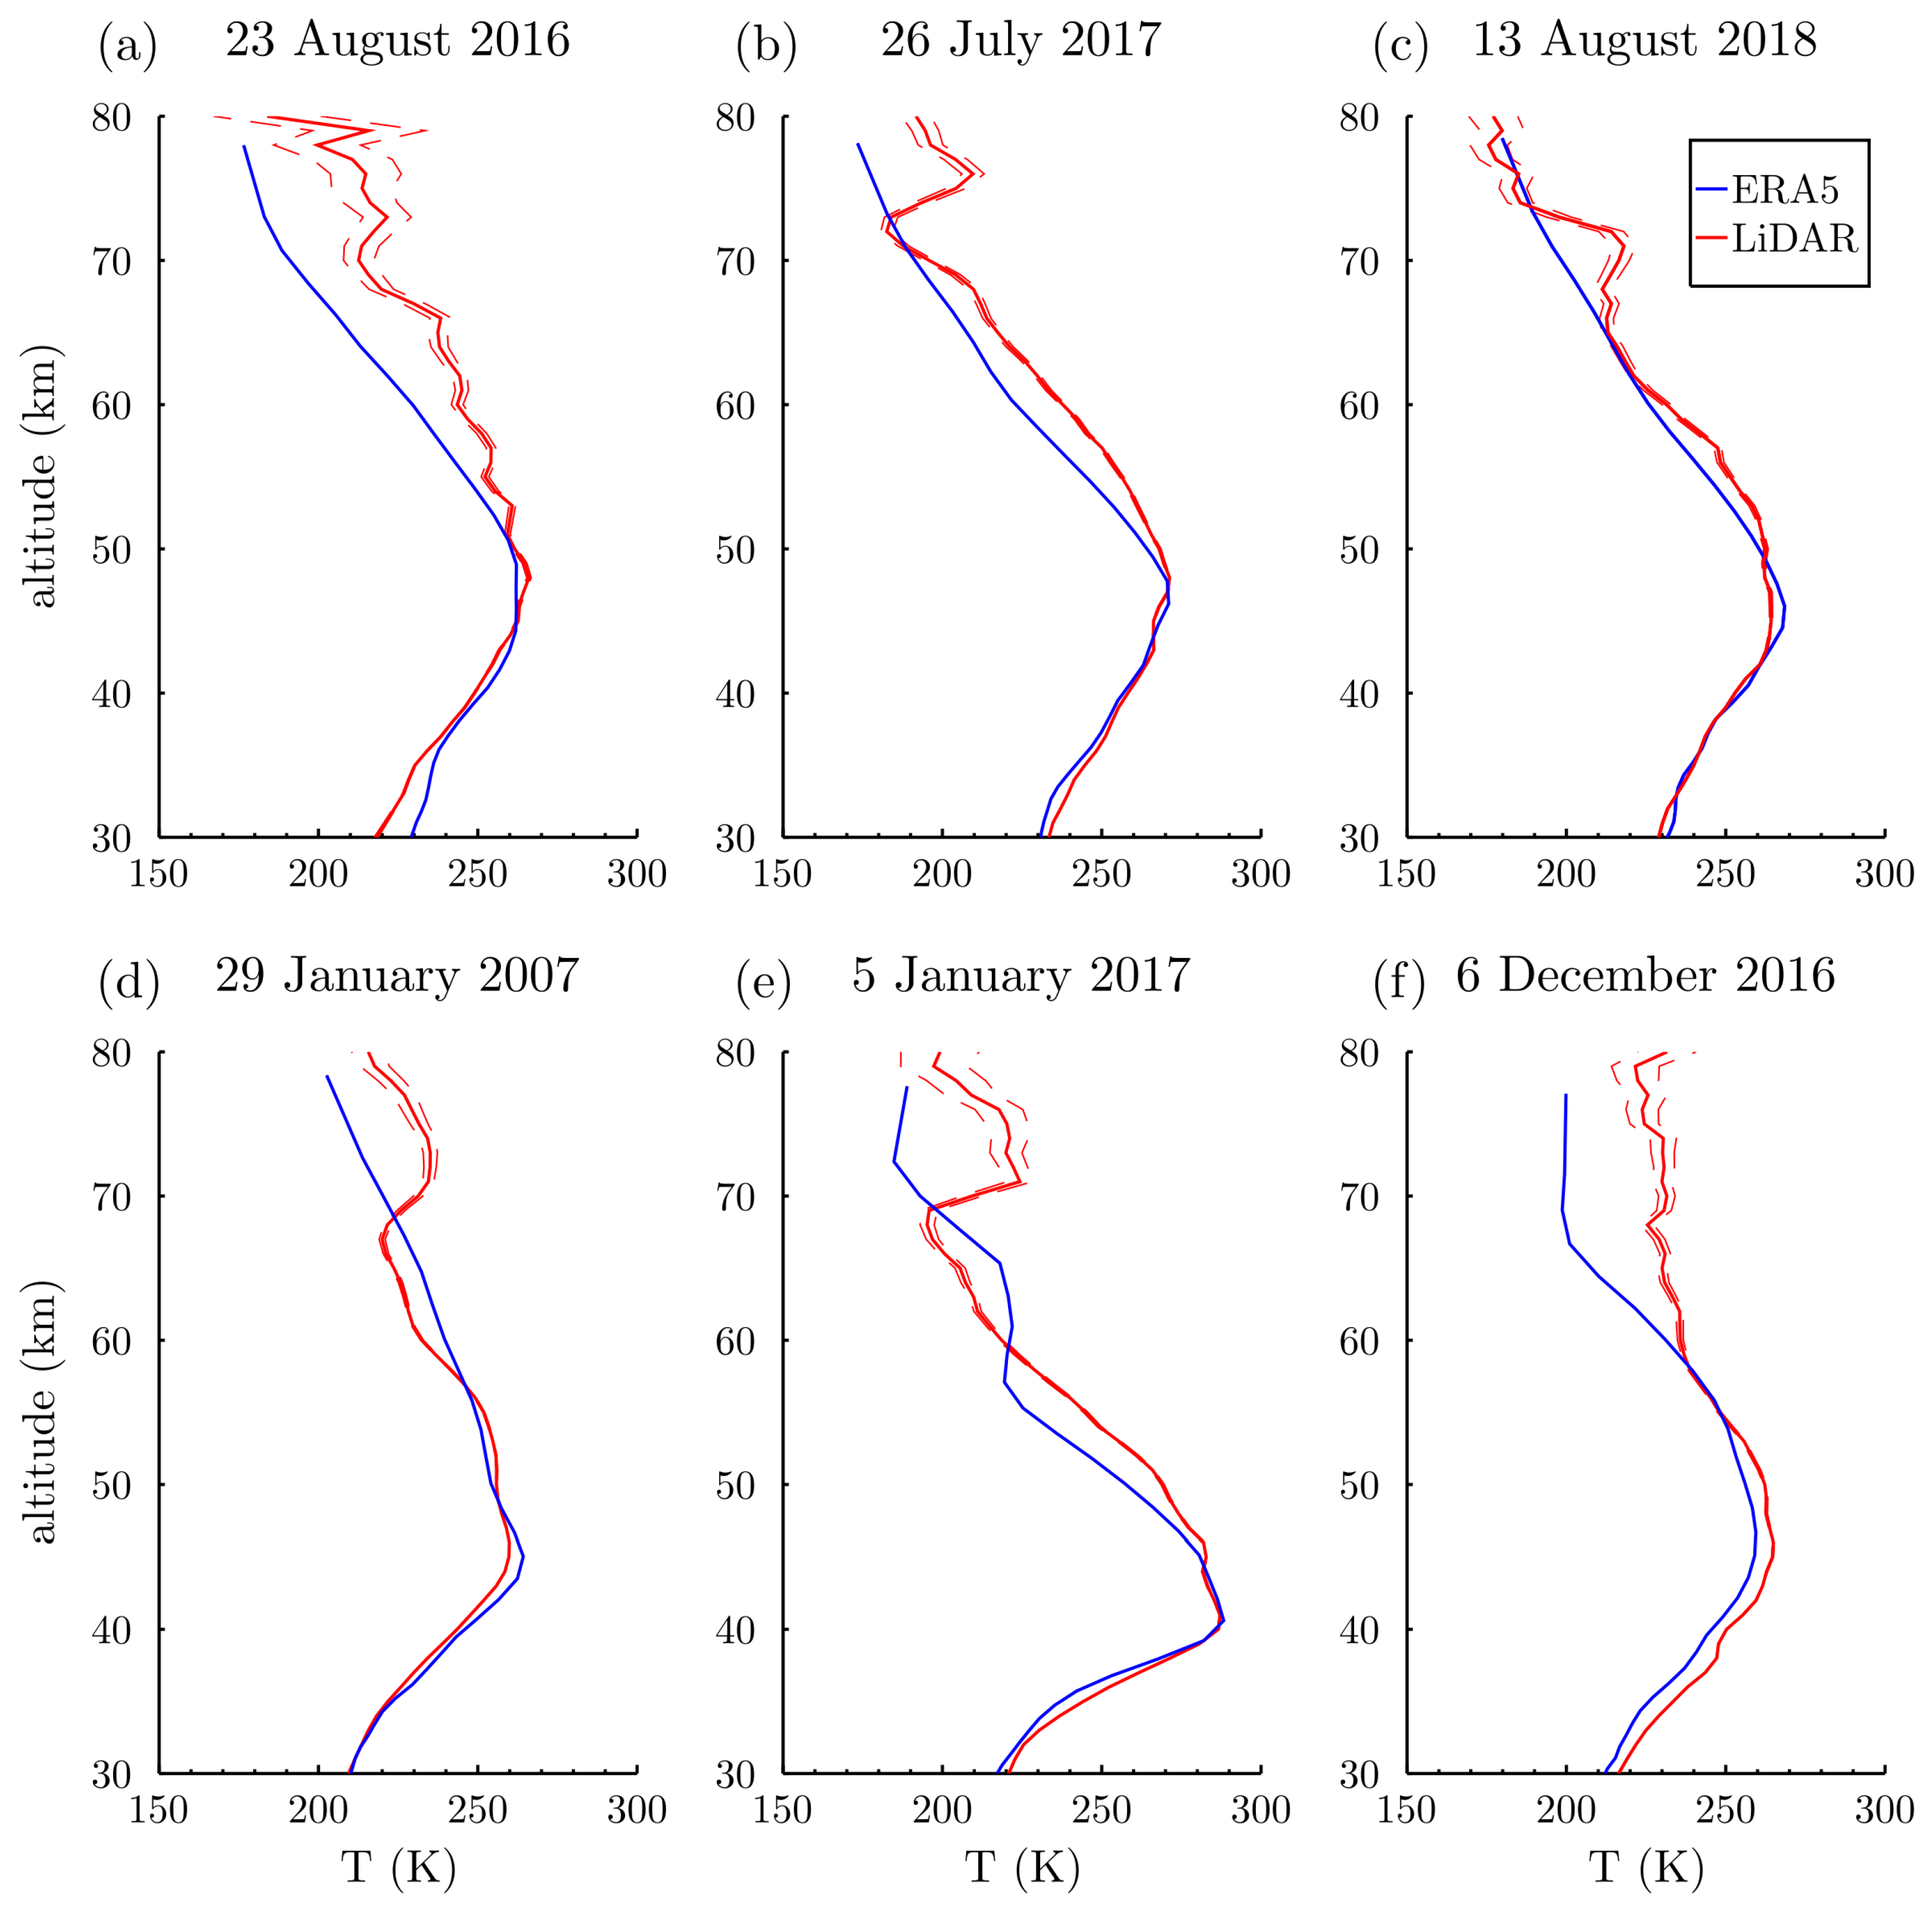
In summer, the leading mode, which corresponds to 49% of the total variability of the fluctuations (Figure 6a), has a clear anti-correlation between the upper stratosphere (+2 K at 40 km) and the mesosphere (−5 K at 70 km). This leading mode is illustrated by temperature profiles from the LiDAR and model for the date 23 August 2016 (Figure 8a). Numerous dates with the same vertical pattern have been found (not shown here), confirming that the PC1 computed represents a typical model behavior, i.e., the model tends to be warmer and cooler than LiDAR observations in the upper stratosphere and the mesosphere, respectively. However, the source responsible for this leading mode pattern is complicated as the compensations between the upper stratosphere and the mesosphere seem to be related to persisting biases and not small-scale phenomena. Two other modes, accounting for respectively 17% and 10% of the variability (Figure 6b,c), are more representative of the small-scale fluctuations not simulated in ERA-5. Both modes have a tiny signal (<1 K) in the upper stratosphere and possess a wave-like structure in the mesosphere, suggesting the presence of gravity waves causing temperature inversions [40].
Hence, these significant mesospheric fluctuations of 20–40 K over an atmospheric thickness of 5–10 km around 70 km are not reproduced by ERA-5 in summer (Figure 8b,c), confirming the hypothesis mentioned in Section 4-b. This trend of the model to overlook mesospheric inversions occurring at about 70 km is also illustrated with two dates in summer (Figure 8b,c). The examples shown here for the summer period confirm that ERA-5 is systematically cooler in the entire mesosphere and becomes warmer only when mesospheric inversions occur.
In winter, the three main modes explain 42%, 23%, and 13% of the variability of the temperature difference fluctuations. Similar to the summer, the first mode shows an anti-correlation between the upper stratosphere (−1 K at 40 km) with the lower mesosphere (−4 K at 55 km) and the upper mesosphere (+7 K at 65 km). The typical pattern of this mode is illustrated by the LiDAR and model temperature profiles in Figure 1 and Figure 8d. Interestingly, the summer and winter leading modes possess opposite patterns, suggesting that there is a connection between these two first modes. An investigation of the PC1 coefficient evolution over the studied period (not shown here) revealed a signal with opposite phases between summer and winter. Consequently, these first modes would not result from only an actual vertical coupling, but may represent seasonal fluctuations.
The vertical patterns of the second and the third modes are likely associated with propagating atmospheric waves and mesospheric inversions occurring at lower altitudes than in summer [40,41]. Illustrations of the second and third modes are shown for three days in winter (Figure 8d–f). At first glance, the model sometimes tended to overlook (Figure 8d) a part of the mesospheric inversions during winter. However, contrary to the summer period, the model managed for some cases to simulate them, but often with a smaller magnitude and loweraltitude (Figure 8e), probably responsible for the bias reduction found at 65 km (Figure 2A). As mesospheric inversions are caused by breaking gravity waves, this seasonal difference should result from the model parametrization of gravity wave activity, which is supposed to be maximum in winter and minimum in summer [31,42]. Indeed, according to Strelnikova et al. [43], Gravity Wave Potential Energy Densities (GWPEDs) per unit volume ( E p V ) in ERA-5 become smaller from 45 km and admit a seasonal cycle with a maximum in winter and a minimum in summer. Here, as retrieved by Meriwether and Gardner [44], the mesosphere inversion layer altitude appears to be dependent on the seasons, i.e., lower in winter and higher in summer, at mid-latitudes. Hence, mesospheric inversions are challenging to simulate. Thanks to a 2D model, Hauchecorne and Maillard [45] were able to reproduce mesospheric inversions in winter with a parametrization of the drag, diffusion, and dissipation due to gravity wave breaking. The ECMWF has implemented in the ERA-5 reanalyses an artificial sponge layer effective above 10 hPa in order to reduce the unrealistic vertical wave reflection at the top model [14,46]. However, according to Ehard et al. [14], the sponge layer strongly damps the gravity wave activity above 45 km in the ERA-5 reanalyses, preventing the energy transport to the model top. Furthermore, Strelnikova et al. [43] found that E p V is smaller in ERA-5 and increases with altitude, admitting a seasonal cycle with a maximum in winter. Thus, these remarks should be considered as research leads for future updates and improvements of the last ECMWF model.

7. Impact of the SSWs on Temperature Differences

Several observations have shown that SSWs may increase the middle stratospheric temperature by more than 40 °C [47,48] in a span of a few days and influence the tropospheric weather for several weeks. These events are observed in the LiDAR temperature series over OHP [23,40]. However, these vast temperature deviations are still not well predicted by models [49]. Since SSWs are mainly driven by strong nonlinear processes, it is interesting to investigate how ERA-5 temperature reanalyses behave when these extreme events occur. According to the previous results, the magnitude of SSWs is well reproduced by the model in the upper stratosphere (Figure 3a). Thus, to investigate the impact of SSWs on the ERA-5 product, the temporal evolution of the temperature differences between the LiDAR and ERA-5 corrected by the model biases and the common variability Δ T L E y 20 d before and after SSWs was studied in the middle atmosphere.
To detect any significant differences during one of the phases of an SSW, we considered differences according to the first day of the stratospheric warming. Day 0 is defined as the day when the zonal mean zonal wind is lower than 10 ms 1 at 60° N and 10 hPa. This criterion is slightly different from major SSW’s definition associated with wind reversal. This wind criterion was used here to include all major SSWs associated with coherent category as defined by Maury et al. [50]. Thus, the algorithm identified here 18 SSW events over the period 2005–2020, during which the OHP LiDAR carried out observations.
The results are not shown here, but no patterns were detected in most of the stratosphere, as well as in the mid- and upper mesosphere where differences Δ T L E y appeared randomly distributed with time. The only pattern we can report is in the vicinity of the stratopause and the lower mesospheric levels (Figure 9). According to the moving mean, the model tended to be slightly cooler than LiDAR observations 5–20 d before that SSW happened with more than 60% of the temperature differences corrected, which were positive and with a mean of +1.7 K. As the days came close to the stratospheric warming, the model tended to be warmer. During the first 5 d after SSW, the model was mainly warmer than the LiDAR, with more than 75% of the temperature differences corrected, which were negative, and a mean of −2.5 K. Beyond five days after the SSW occurred, the model stayed within the dispersion and reproduced quite well the temperature observed by the LiDAR. ERA-5 reanalyses, even during a strong nonlinear event such as SSWs, allow representing quite well SSW evolutions except in the lower mesosphere a few days after the maximum of the event.

8. Conclusions

OHP LiDAR observations over the last fifteen years have been used as a benchmark to validate many satellite observations and were used here to assess the ERA-5 temperature reanalyses in the 30–80 km range at mid-latitudes.
Hence, in this study, the temperature assessments of the ECMWF model were carried out for both seasons, winter and summer, and only with the OHP station, as no other stations have been regularly measuring the middle atmosphere at mid-latitudes. First, the mean temperature differences between the LiDAR observations and the ECMWF model confirmed previous comparisons and showed a similar vertical pattern in winter and summer. A good agreement was found up to 45 km in winter, whereas a slight negative bias of −3 K up to 50 km was observed in summer. However, significant positive biases were found in the mesosphere for both seasons, indicating that the model climatology tends to be cooler than the LiDAR climatology. A reduction of the temperature bias was notable at 65 km for the winter months, likely due to mesospheric inversions, often simulated imprecisely by the model.
In order to pursue the previous studies focusing only on the temperature bias [13,14,15], a more detailed investigation of the model performance to reproduce the variability observed by the OHP LiDAR was carried out. In winter, the high variability due to SSWs, which characterizes the upper stratosphere, was well captured by the model, confirming that planetary waves are well reproduced in ERA-5. In the mesosphere, the model did not deviate from its seasonal mean and, therefore, did not reproduce most of the variability observed by LiDAR. Thus, it appears that the biases between the LiDAR and ERA-5 and the capability of the model to reproduce the variability in the mesosphere are not necessarily linked. In summer, the model did not reproduce the observed variability, neither in the upper stratosphere nor in the mesosphere. In the summer stratosphere, the reason was likely that ERA-5 simulates gravity waves whose amplitudes are smaller than in the observations. In the mesosphere, as for winter, the central part of gravity waves cannot be simulated in the model with its current vertical resolution. As a result, a restoring force to the climatology acts on the model to keep a realistic representation of the mesosphere. In the mesosphere, the variability issue is similar for both seasons, while this altitude domain is mainly driven by gravity wave propagation and breaking, leading to mesospheric inversions. Hence, the model cannot accurately simulate mesospheric inversions responsible for the most considerable variability.
Of specific interest is the capability of the ERA-5 product to reproduce the observed variability in the upper stratosphere during winter. The damping of the variability in ERA-5 during summer in the stratosphere compared to winter has not been explained yet. A novelty of this work is the method suggested to estimate the model uncertainty associated with its variability. As the model uncertainty grows with the altitude, an accurate simulation of the natural variability for both seasons is limited, especially in the mesosphere.
In addition to this model variability assessment, the vertical coupling between the mesosphere and the upper stratosphere was investigated thanks to a principal component analysis of the fluctuations of the temperature differences between the LiDAR and ERA-5. The leading modes of both seasons revealed anti-correlations between the upper stratosphere and the mesosphere, illustrating the typical behavior of the model. Additionally, both first modes possess opposite patterns between winter and summer. The EOF coefficient evolution over the studied period suggests that the source of this connection would be due to seasonal fluctuations. On the other hand, the secondary modes for both seasons illustrate more the small-scale fluctuations not simulated in ERA-5. Indeed, the wave-like structure observed in these other modes suggests the presence of gravity waves, leading to mesospheric inversions, confirming, as inferred previously, either their absence in summer or their inaccuracy in winter in the ERA-5 temperature profiles.
As a significant part of the winter variability is due to SSWs, the study of their impact on the temperature reanalyses in the middle atmosphere was pursued here. It was found that SSWs influence ERA-5 temperatures around the stratopause several days before and after their trigger. Nevertheless, further studies about SSWs’ representation in the models (start, evolution, duration, intensity, coupling, etc.) should be led with all LiDAR temperature series to assess their parametrization. These future investigations are of significant interest for the community using the ERA-5 product to accurately study SSWs’ impacts on the bottom and the top of the atmosphere.
Finally, further investigations should be pursued to determine the origin of the model biases and explain the current limitation of the model to reproduce mesospheric inversions produced by gravity wave breaking. A first lead is the seasonal difference in the model ability observed here to simulate mesospheric inversions, which is undoubtedly due to the annual cycle of the gravity wave activity, i.e., maximum in winter and minimum in summer [31,42].
This study points out the need to assimilate more observations of the mesosphere, such as wind and temperature, to improve its representation in the model. However, only a few instruments measure this part of the atmosphere. Since 2018, the satellite Aeolus has been providing wind measurements up to 30 km that have demonstrated in the stratosphere their usefulness for model analyses [51]. Similar data should be added as infra-sound measurements deployed with the ARISE network [19] to complete the wind field representation at higher altitudes. Furthermore, some temperature profiles with high-repetitiveness overpasses can be derived from CubeSat constellation [34].

Author Contributions

Conceptualization, A.M., P.K. and A.H.; methodology, P.K., A.H., C.C. and M.M.; data curation and investigation, A.M.; resources, P.K., A.H. and C.C.; supervision, P.K., A.H. and C.C.; writing, A.M.; discussion, P.K., A.H., A.L.P., C.C., M.M. and S.K.; reviewing and revision, P.K., A.H., A.L.P., C.C., M.M. and S.K. All authors have read and agreed to the published version of the manuscript.

Funding

The French Educational Ministry with EUR IPSL and NDACC operations are supported by CNRS, CNES, and UVSQ.

Institutional Review Board Statement

Not applicable.

Informed Consent Statement

Not applicable.

Data Availability Statement

The data used in this publication were obtained as part of the Network for the Detection of Atmospheric Composition Change (NDACC) and are publicly available through the international NDACC website https://www-air.larc.nasa.gov/missions/ndacc/data.html and the French AERIS data portal http://cds-espri.ipsl.fr/NDACC/. The indications to download the ERA-5 data over 137 levels are given on the ECWMF website https://confluence.ecmwf.int/display/CKB/How+to+download+ERA-5. Additional and more detailed technical information is available at https://confluence.ecmwf.int/display/CKB/ERA-5%3A+data+documentation (accessed on 1 November 2021).

Acknowledgments

This work was a contribution to the MARTIC payload development supported by CNES and CNRS through the national program on remote sensing AO (Programme National de Télédétection Spatiale). The assessment of meteorological reanalyses using LiDAR have been initiated within the European H2020 ARISE project. We acknowledge the OHP station and their operators working on the site.

Conflicts of Interest

The authors declare no conflict of interest.

References

  1. Seviour, W.J.M.; Butchart, N.; Hardiman, S.C. The Brewer-Dobson circulation inferred from ERA-Interim. Q. J. R. Meteorol. Soc. 2012, 138, 878–888. [Google Scholar] [CrossRef]
  2. Lee, C.; Smets, P.; Charlton-Perez, A.; Evers, L.; Harrison, G.; Marlton, G. The Potential Impact of Upper Stratospheric Measurements on Sub-seasonal Forecasts in the Extra-Tropics. In Infrasound Monitoring for Atmospheric Studies: Challenges in Middle Atmosphere Dynamics and Societal Benefits; Le Pichon, A., Blanc, E., Hauchecorne, A., Eds.; Springer International Publishing: Cham, Switzerland, 2019; pp. 889–907. [Google Scholar] [CrossRef]
  3. Butler, A.H.; Seidel, D.J.; Hardiman, S.C.; Butchart, N.; Birner, T.; Match, A. Defining Sudden Stratospheric Warmings. Bull. Am. Meteorol. Soc. 2015, 96, 1913–1928. [Google Scholar] [CrossRef]
  4. Hardiman, S.C.; Butchart, N.; Hinton, T.J.; Osprey, S.M.; Gray, L.J. The Effect of a Well-Resolved Stratosphere on Surface Climate: Differences between CMIP5 Simulations with High and Low Top Versions of the Met Office Climate Model. J. Clim. 2012, 25, 7083–7099. [Google Scholar] [CrossRef]
  5. Charlton-Perez, A.J.; Baldwin, M.P.; Birner, T.; Black, R.X.; Butler, A.H.; Calvo, N.; Davis, N.A.; Gerber, E.P.; Gillett, N.; Hardiman, S.; et al. On the lack of stratospheric dynamical variability in low-top versions of the CMIP5 models. J. Geophys. Res. Atmos. 2013, 118, 2494–2505. [Google Scholar] [CrossRef]
  6. Baldwin, M.P.; Thompson, D.W.J.; Shuckburgh, E.F.; Norton, W.A.; Gillett, N.P. Weather from the Stratosphere? Science 2003, 301, 317–319. [Google Scholar] [CrossRef] [PubMed] [Green Version]
  7. Charlton, A.J.; O’neill, A.; Lahoz, W.A.; Massacand, A.C. Sensitivity of tropospheric forecasts to stratospheric initial conditions. Q. J. R. Meteorol. Soc. 2004, 130, 1771–1792. [Google Scholar] [CrossRef]
  8. Uppala, S.M.; KÅllberg, P.W.; Simmons, A.J.; Andrae, U.; Bechtold, V.D.C.; Fiorino, M.; Gibson, J.K.; Haseler, J.; Hernandez, A.; Kelly, G.A.; et al. The ERA-40 reanalysis. Q. J. R. Meteorol. Soc. 2005, 131, 2961–3012. [Google Scholar] [CrossRef]
  9. Dee, D.P.; Uppala, S.M.; Simmons, A.J.; Berrisford, P.; Poli, P.; Kobayashi, S.; Andrae, U.; Balmaseda, M.A.; Balsamo, G.; Bauer, P.; et al. The ERA-Interim reanalysis: Configuration and performance of the data assimilation system. Q. J. R. Meteorol. Soc. 2011, 137, 553–597. [Google Scholar] [CrossRef]
  10. Hersbach, H.; Bell, B.; Berrisford, P.; Hirahara, S.; Horányi, A.; Muñoz-Sabater, J.; Nicolas, J.; Peubey, C.; Radu, R.; Schepers, D.; et al. The ERA5 global reanalysis. Q. J. R. Meteorol. Soc. 2020, 146, 1999–2049. [Google Scholar] [CrossRef]
  11. Hoppel, K.W.; Eckermann, S.D.; Coy, L.; Nedoluha, G.E.; Allen, D.R.; Swadley, S.D.; Baker, N.L. Evaluation of SSMIS Upper Atmosphere Sounding Channels for High-Altitude Data Assimilation. Mon. Weather. Rev. 2013, 141, 3314–3330. [Google Scholar] [CrossRef]
  12. Funatsu, B.M.; Claud, C.; Keckhut, P.; Hauchecorne, A.; Leblanc, T. Regional and seasonal stratospheric temperature trends in the last decade (2002–2014) from AMSU observations. J. Geophys. Res. Atmos. 2016, 121, 8172–8185. [Google Scholar] [CrossRef] [Green Version]
  13. Le Pichon, A.; Assink, J.; Heinrich, P.; Blanc, E.; Charlton-Perez, A.; Lee, C.; Keckhut, P.; Hauchecorne, A.; Rüfenacht, R.; Kämpfer, N.; et al. Comparison of co-located independent ground-based middle-atmospheric wind and temperature measurements with Numerical Weather Prediction models. J. Geophys. Res. Atmos. 2015, 120, 8318–8331. [Google Scholar] [CrossRef]
  14. Ehard, B.; Malardel, S.; Dörnbrack, A.; Kaifler, B.; Kaifler, N.; Wedi, N. Comparing ECMWF high-resolution analyses with LiDAR temperature measurements in the middle atmosphere. Q. J. R. Meteorol. Soc. 2018, 144, 633–640. [Google Scholar] [CrossRef] [Green Version]
  15. Marlton, G.; Charlton-Perez, A.; Harrison, G.; Polichtchouk, I.; Hauchecorne, A.; Keckhut, P.; Wing, R.; Leblanc, T.; Steinbrecht, W. Using a network of temperature LiDARs to identify temperature biases in the upper stratosphere in ECMWF reanalyses. Atmos. Chem. Phys. 2021, 21, 6079–6092. [Google Scholar] [CrossRef]
  16. Hauchecorne, A.; Chanin, M.L.; Keckhut, P. Climatology and trends of the middle atmospheric temperature (33–87 km) as seen by Rayleigh LiDAR over the south of France. J. Geophys. Res. Atmos. 1991, 96, 15297–15309. [Google Scholar] [CrossRef]
  17. Simmons, A.; Soci, C.; Nicolas, J.; Bell, B.; Berrisford, P.; Dragani, R.; Flemming, J.; Haimberger, L.; Healy, S.; Hersbach, H.; et al. Global Stratospheric Temperature Bias and Other Stratospheric Aspects of ERA5 and ERA5. 1; European Centre for Medium Range Weather Forecasts: Reading, UK, 2020. [Google Scholar] [CrossRef]
  18. Funatsu, B.; Claud, C.; Keckhut, P.; Hauchecorne, A. Cross-validation of AMSU and LiDAR for long-term upper-stratospheric temperature monitoring. J. Geophys. Res.-Atmos. 2008, 113. [Google Scholar] [CrossRef] [Green Version]
  19. Blanc, E.; Ceranna, L.; Hauchecorne, A.; Charlton-Perez, A.J.; Marchetti, E.; Evers, L.G.; Kvaerna, T.; Lastovicka, J.; Eliasson, L.; Crosby, N.B.; et al. Toward an Improved Representation of Middle Atmospheric Dynamics Thanks to the ARISE Project. Surv. Geophys. 2018, 39, 171–225. [Google Scholar] [CrossRef] [Green Version]
  20. Wing, R.; Hauchecorne, A.; Keckhut, P.; Godin-Beekmann, S.; Khaykin, S.; McCullough, E.M.; Mariscal, J.F.; d’Almeida, E. LiDAR temperature series in the middle atmosphere as a reference data set—Part 1: Improved retrievals and a 20-year cross-validation of two co-located French LiDARs. Atmos. Meas. Tech. 2018, 11, 5531–5547. [Google Scholar] [CrossRef] [Green Version]
  21. Leblanc, T.; McDermid, I.S.; Keckhut, P.; Hauchecorne, A.; She, C.Y.; Krueger, D.A. Temperature climatology of the middle atmosphere from long-term LiDAR measurements at middle and low latitudes. J. Geophys. Res. Atmos. 1998, 103, 17191–17204. [Google Scholar] [CrossRef] [Green Version]
  22. Keckhut, P.; David, C.; Marchand, M.; Bekki, S.; Jumelet, J.; Hauchecorne, A.; Höpfner, M. Observation of Polar Stratospheric Clouds down to the Mediterranean coast. Atmos. Chem. Phys. 2007, 7, 5275–5281. [Google Scholar] [CrossRef] [Green Version]
  23. Angot, G.; Keckhut, P.; Hauchecorne, A.; Claud, C. Contribution of stratospheric warmings to temperature trends in the middle atmosphere from the LiDAR series obtained at Haute-Provence Observatory (44° N). J. Geophys. Res. Atmos. 2012, 117. [Google Scholar] [CrossRef] [Green Version]
  24. Hauchecorne, A.; Chanin, M.L. Density and temperature profiles obtained by LiDAR between 35 and 70 km. Geophys. Res. Lett. 1980, 7, 565–568. [Google Scholar] [CrossRef]
  25. Keckhut, P.; Hauchecorne, A.; Chanin, M.L. A Critical Review of the Database Acquired for the Long-Term Surveillance of the Middle Atmosphere by the French Rayleigh LiDARs. J. Atmos. Ocean. Technol. 1993, 10, 850–867. [Google Scholar] [CrossRef] [Green Version]
  26. Keckhut, P.; Claud, C.; Funatsu, B.M.; Hauchecorne, A.; Maury, P.; Khaykin, S.; Le Pichon, A.; Steinbrecht, W. Temperature trends observed in the middle atmosphere and future directions. In Infrasound Monitoring for Atmospheric Studies; Springer: Cham, Switzerland, 2019; p. 805. [Google Scholar] [CrossRef] [Green Version]
  27. Steiner, A.K.; Ladstädter, F.; Randel, W.J.; Maycock, A.C.; Fu, Q.; Claud, C.; Gleisner, H.; Haimberger, L.; Ho, S.P.; Keckhut, P.; et al. Observed temperature changes in the troposphere and stratosphere from 1979 to 2018. J. Clim. 2020, 33, 8165–8194. [Google Scholar] [CrossRef]
  28. Keckhut, P.; Randel, W.; Claud, C.; Leblanc, T.; Steinbrecht, W.; Funatsu, B.; Bencherif, H.; McDermid, I.; Hauchecorne, A.; Long, C.; et al. An evaluation of uncertainties in monitoring middle atmosphere temperatures with the ground-based LiDAR network in support of space observations. J. Atmos. Sol.-Terr. Phys. 2011, 73, 627–642. [Google Scholar] [CrossRef] [Green Version]
  29. She, C.Y.; Yu, J.R.; Krueger, D.A.; Roble, R.; Keckhut, P.; Hauchecorne, A.; Chanin, M.L. Vertical structure of the midlatitude temperature from stratosphere to mesopause (30–105 km). Geophys. Res. Lett. 1995, 22, 377–380. [Google Scholar] [CrossRef]
  30. Picone, J.M.; Hedin, A.E.; Drob, D.P.; Aikin, A.C. NRLMSISE-00 empirical model of the atmosphere: Statistical comparisons and scientific issues. J. Geophys. Res. Space Phys. 2002, 107, SIA 15–1–SIA 15–16. [Google Scholar] [CrossRef]
  31. Mze, N.; Hauchecorne, A.; Keckhut, P.; Thétis, M. Vertical distribution of gravity wave potential energy from long-term Rayleigh LiDAR data at a northern middle latitude site. J. Geophys. Res. Atmos. 2014, 119, 12069–12083. [Google Scholar] [CrossRef]
  32. Kurylo, M.J. Network for the detection of stratospheric change. In Remote Sensing of Atmospheric Chemistry; International Society for Optics and Photonics, SPIE: Bellingham, WA, USA, 1991; Volume 1491, pp. 168–174. [Google Scholar] [CrossRef] [Green Version]
  33. Wing, R.; Steinbrecht, W.; Godin-Beekmann, S.; McGee, T.J.; Sullivan, J.T.; Sumnicht, G.; Ancellet, G.; Hauchecorne, A.; Khaykin, S.; Keckhut, P. Intercomparison and evaluation of ground- and satellite-based stratospheric ozone and temperature profiles above Observatoire de Haute-Provence during the LiDAR Validation NDACC Experiment (LAVANDE). Atmos. Meas. Tech. 2020, 13, 5621–5642. [Google Scholar] [CrossRef]
  34. Keckhut, P.; Hauchecorne, A.; Meftah, M.; Khaykin, S.; Claud, C.; Simoneau, P. Middle-Atmosphere Temperature Monitoring Addressed with a Constellation of CubeSats Dedicated to Climate Issues. J. Atmos. Ocean. Technol. 2021, 38, 685–693. [Google Scholar] [CrossRef]
  35. Wright, C.J.; Hindley, N.P. How well do stratospheric reanalyses reproduce high-resolution satellite temperature measurements? Atmos. Chem. Phys. 2018, 18, 13703–13731. [Google Scholar] [CrossRef] [Green Version]
  36. Andrews, D.; Holton, J.; Leovy, C. Middle Atmosphere Dynamics; International Geophysics, Elsevier Science: New York, NY, USA; Academic Press: Cambridge, MA, USA, 1987. [Google Scholar]
  37. Keckhut, P.; Hauchecorne, A.; Kerzenmacher, T.; Angot, G. Modes of variability of the vertical temperature profile of the middle atmosphere at mid-latitude: Similarities with solar forcing. J. Atmos. Sol.-Terr. Phys. 2012, 75–76, 92–97. [Google Scholar] [CrossRef]
  38. Charney, J.G.; Drazin, P.G. Propagation of planetary-scale disturbances from the lower into the upper atmosphere. J. Geophys. Res. 1961, 66, 83–109. [Google Scholar] [CrossRef]
  39. Kalnay, E. Atmospheric Modeling, Data Assimilation and Predictability; Cambridge University Press: Cambridge, UK, 2002. [Google Scholar] [CrossRef]
  40. Hauchecorne, A.; Chanin, M.L.; Wilson, R. Mesospheric temperature inversion and gravity wave breaking. Geophys. Res. Lett. 1987, 14, 933–936. [Google Scholar] [CrossRef]
  41. Leblanc, T.; Hauchecorne, A.; Chanin, M.L.; Rodgers, C.; Taylor, F.; Livesey, N. Mesospheric temperature inversions as seen by ISAMS in December 1991. Geophys. Res. Lett. 1995, 22, 1485–1488. [Google Scholar] [CrossRef]
  42. Wilson, R.; Chanin, M.L.; Hauchecorne, A. Gravity waves in the middle atmosphere observed by Rayleigh LiDAR: 2. Climatology. J. Geophys. Res.-Atmos. 1991, 96, 5169–5183. [Google Scholar] [CrossRef]
  43. Strelnikova, I.; Almowafy, M.; Baumgarten, G.; Baumgarten, K.; Ern, M.; Gerding, M.; Lübken, F.J. Seasonal Cycle of Gravity Wave Potential Energy Densities from LiDAR and Satellite Observations at 54° and 69° N. J. Atmos. Sci. 2021, 78, 1359–1386. [Google Scholar] [CrossRef]
  44. Meriwether, J.W.; Gardner, C.S. A review of the mesosphere inversion layer phenomenon. J. Geophys. Res. Atmos. 2000, 105, 12405–12416. [Google Scholar] [CrossRef]
  45. Hauchecorne, A.; Maillard, A. A 2-d dynamical model of mesospheric temperature inversions in winter. Geophys. Res. Lett. 1990, 17, 2197–2200. [Google Scholar] [CrossRef]
  46. Kawatani, Y.; Hirooka, T.; Hamilton, K.; Smith, A.K.; Fujiwara, M. Representation of the equatorial stratopause semiannual oscillation in global atmospheric reanalyses. Atmos. Chem. Phys. 2020, 20, 9115–9133. [Google Scholar] [CrossRef]
  47. Scherhag, R. Die explosionsartigen stratospherener warmungen des spatwinters. Ber. Deut. Wetterd. 1952, 38, 51–63. [Google Scholar]
  48. Labitzke, K. Interannual Variability of the Winter Stratosphere in the Northern Hemisphere. Mon. Weather. Rev. 1977, 105, 762–770. [Google Scholar] [CrossRef]
  49. Charlton, A.; Polvani, L. A New Look at Stratospheric Sudden Warmings. Part I: Climatology and Modeling Benchmarks. J. Clim. 2007, 20, 449–469. [Google Scholar] [CrossRef]
  50. Maury, P.; Claud, C.; Manzini, E.; Hauchecorne, A.; Keckhut, P. Characteristics of stratospheric warming events during Northern winter. J. Geophys. Res. Atmos. 2016, 121, 5368–5380. [Google Scholar] [CrossRef] [Green Version]
  51. Šavli, M.; Pourret, V.; Payan, C.; Mahfouf, J.F. Sensitivity of Aeolus HLOS winds to temperature and pressure specification in the L2B processor. Atmos. Meas. Tech. Discuss. 2021, 2021, 1–22. [Google Scholar] [CrossRef]
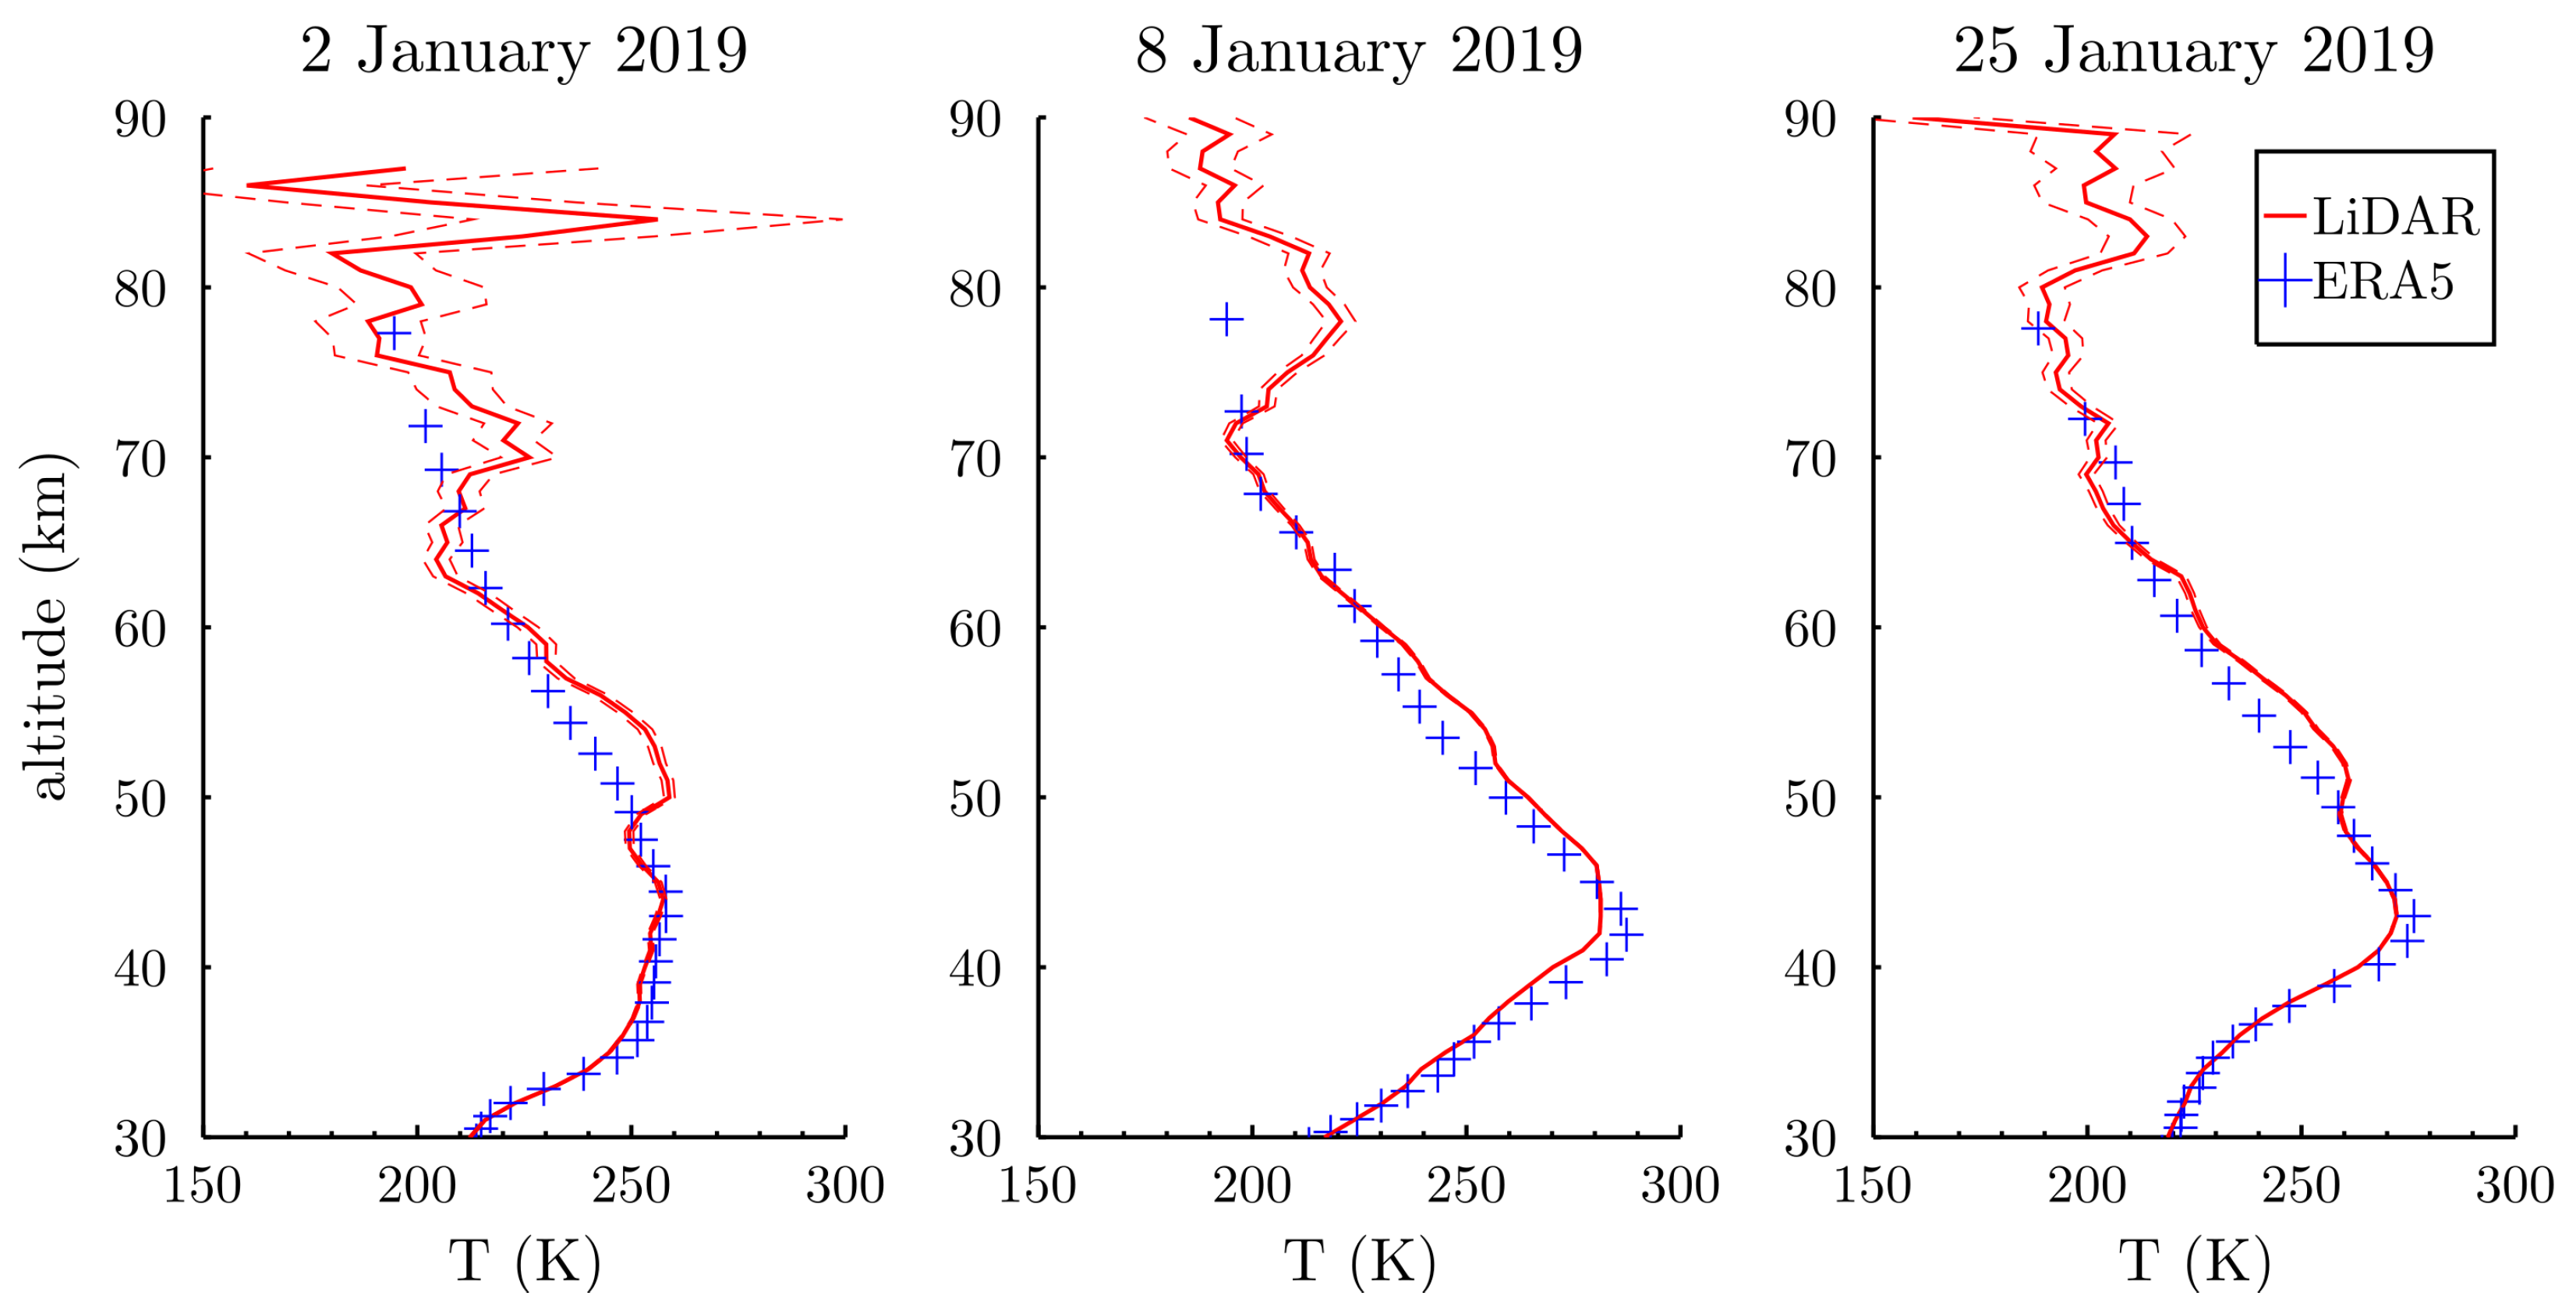
Figure 1. Temperature profiles from the LiDAR (red solid line) and the ECMWF (blue cross) for three dates selected in January 2019 during an SSW event. Instrumental errors from the LiDAR (red dashed lines) are added as well.
Atmosphere 13 00242 g001
Figure 2. Mean of the temperature difference profiles (bold black lines) between the LiDAR and ERA-5 computed between 2005 and 2020 for both seasons. Dotted and dashed black lines represent respectively the 95% confident interval and the standard deviation.
Atmosphere 13 00242 g002
Figure 3. Comparisons of thetemperature differences between ERA-5 and its seasonal mean ( Δ T E ESM ) and between the LiDAR and ERA-5 ( Δ T L E ) with the temperature differences between the LiDAR and its seasonal mean ( Δ T L LSM ) at 40 km (a,b) and 70 km (d,e) during winter. The correlation between these comparisons was computed with a linear regression (solid red line), and the associated determination coefficient ( r 2 ) is displayed. A perfect correlation without bias is illustrated by the black dashed line. The temperature differences between the LiDAR and the ECMWF corrected by the linear regression ( Δ T L E y ) are shown at 40 km (c) and 70 km (f). The distributions (blue bars) of the temperature differences are added at the top for the x-axis and on the right for the y-axis.
Atmosphere 13 00242 g003
Figure 4. Comparisons of the temperature differences between ERA-5 and its seasonal mean ( Δ T E ESM ) and between the LiDAR and ERA-5 ( Δ T L E ) with the temperature differences between the LiDAR and its seasonal mean ( Δ T L LSM ) at 40 km (a,b) and 70 km (d,e) during summer. A perfect correlation without bias is illustrated by the black dashed line. The temperature differences between the LiDAR and the ECMWF corrected by the linear regression ( Δ T L E y ) are shown at 40 km (c) and 70 km (f). The same information regarding the performed linear regressions and the distribution of temperature differences as contained in Figure 3 are displayed.
Atmosphere 13 00242 g004
Figure 5. Model uncertainty estimates (blue solid lines) and atmospheric variability observed with the LiDAR (red solid lines) profiles corrected by the LiDAR noise during winter and summer in the 30–80 km altitude range. The median of the LiDAR instrumental errors σ L i D A R N o i s e (black solid line) over the altitude is shown as well.
Atmosphere 13 00242 g005
Figure 6. Vertical modes for the summer months (June, July, August) of the fluctuations of the temperature difference between the LiDAR and ERA-5, corresponding respectively to (PC1) 49%, (PC2) 17%, and (PC3) 10% of the variability.
Atmosphere 13 00242 g006
Figure 7. Vertical modes for the winter months (December, January, February) of the fluctuations of the temperature difference between the LiDAR and ERA-5, corresponding respectively to (PC1) 42%, (PC2) 23%, and (PC3) 13% of the variability.
Atmosphere 13 00242 g007
Figure 8. Temperature profiles from the LiDAR (solid red lines) and from the model (solid blue lines) for three dates in summer (ac) and three dates in winter (df) chosen for illustrating the principal components found. Instrumental errors from the LiDAR are shown as well (red dashed lines).
Atmosphere 13 00242 g008
Figure 9. Evolution of the temperature differences at 50 km between the LiDAR and the ECMWF corrected by the linear regression 20 d before and after the mean zonal mean wind at 60° N and 10 hPa became inferior to 10 m.s 1 . The standard deviation computed over all values (red dashed lines) and the moving mean (blue solid line) computed over five days are displayed.
Atmosphere 13 00242 g009
Table 1. Numerical values of the slope coefficients at different altitudes for the winter season between the ERA-5 fluctuations ( Δ T E ESM ) and the LiDAR fluctuations ( Δ T L LSM ), calculated from their respective seasonal mean, and between the LiDAR and model temperature differences ( Δ T L E ) and the LiDAR fluctuations ( Δ T L LSM ). Mean biases calculated simultaneously are also provided, as well as the determination coefficient of the regression analysis ( r 2 ).
Winter35 km40 km45 km50 km55 km60 km65 km70 km75 km
Δ T E ESM / Δ T L LSM coef110.80.60.40.30.20.20.2
bias (K)000000−0.1−0.1−0.4
r 2 0.880.890.80.540.280.120.10.10.14
Δ T L E / Δ T L LSM coef000.20.40.60.70.80.70.5
bias (K)0.1−1.30.24.67.24.237.512.8
r 2 000.180.40.390.540.560.560.38
Table 2. The same information as contained in Table 1, but for the summer season.
Summer35 km40 km45 km50 km55 km60 km65 km70 km75 km
Δ T E ESM / Δ T L LSM coef0.10.10.20.20.10.10.10.10
bias (K)00000000.1−0.5
r 2 0.040.050.120.080.040.060.070.080
Δ T L E / Δ T L LSM coef0.90.90.80.80.90.80.80.70.6
bias (K)−2.3−3−2.81.17.31211.69.911.3
r 2 0.760.710.690.690.680.630.720.680.56
Publisher’s Note: MDPI stays neutral with regard to jurisdictional claims in published maps and institutional affiliations.