Article

Characteristics of PM10 Levels Monitored in Bangkok and Its Vicinity Areas, Thailand

by
Navaporn Kanjanasiranont
1,
Teera Butburee
2 and
Piangjai Peerakiatkhajohn
1,*
1
Faculty of Environment and Resource Studies, Mahidol University, Nakhon Pathom 73170, Thailand
2
National Nanotechnology Center, National Science and Technology Development Agency, 111 Thailand Science Park, Pathum Thani 12120, Thailand
*
Author to whom correspondence should be addressed.
Atmosphere 2022, 13(2), 239; https://doi.org/10.3390/atmos13020239
Submission received: 2 January 2022 / Revised: 27 January 2022 / Accepted: 28 January 2022 / Published: 30 January 2022
(This article belongs to the Special Issue Sources, Characterization and Control of Particulate Matter)

Abstract

:
The ambient air concentrations of PM10 were observed in Bangkok and its vicinity areas including Nonthaburi and Nakhon Pathom, Thailand. The selected study areas are located near heavy-traffic roads with a high concentration of traffic-related air pollution. The ambient air samples were collected in the winter season (October 2019 to February 2020). The highest average level of PM10 was found in Nonthaburi (66.63 µg/m3), followed by Bangkok (56.79 µg/m3) and Nakhon Pathom (40.18 µg/m3), respectively. The morphology of these particles is typically spherical and irregular shape particles. At the sampling site in Bangkok, these particles are primarily composed of C, O, and Si, and a certain amount of metals such as Fe, Cu, and Cr. Some trace amount of other elements such as Ca, Na, and S are present in minor concentration. The particles collected from Nakhon Pathom and Nonthaburi sampling sites contain the main abundant elements C, O, and Si, followed by Cu, Cr, S, Fe, Ca, and Na, respectively. These particles are an agglomeration of carbon particles resulting from the incomplete combustion of organic matter. Their origin may be associated with road dust, vehicle emission, and the erosion of building products. It can be noted that the levels and characteristics of PM10 are key factors in understanding the behavior of the particles in not only atmospheric visibility but also human health risks.

1. Introduction

Nowadays, particulate matter (PM) is the most serious problem of air pollution in Thailand, and especially in Bangkok and its vicinity areas. Traffic emissions are recognized as the major source of air pollution in Bangkok, Nonthaburi, and Nakhon Pathom. Normally, PM with a diameter of less than 10 µm (PM10) are generated from both natural and anthropogenic sources. The major source of man-made pollutant comes from biomass burning, agricultural burning, and the burning of fossil fuels [1]. In Northern Thailand, the burning of agricultural residue is the major source of PM10. Moreover, the burning of fossil fuels. PM10 mainly originate from vehicle emission [2]. In urban areas, PM10 are principally derived from transport vehicle fuels that are the dominant source of pollution in the ambient air. Many health impacts are caused from exposure to PM10, for instance, heart disease, lung disease, chronic bronchitis, stroke, and cancer [3]. PM is harming not only human health but also the atmospheric visibility [4].
PM10 has the potential to carry several chemicals, including toxic chemicals. The contamination of PM is caused from vehicle emission and high traffic congestion, especially trace elements [5]. In urban area, Pb, Cr, Cd, Cu, Zn, and Fe were the predominant contributors of trace elements, which generated from automobiles [6]. Chronic exposure to these components that are bound to PM has a wide range of health effects. The exposure to heavy metals associated with PM may cause high blood pressure, kidney damage, and lung cancer [7]. Therefore, a better understanding of the status and trends in air quality in Thailand is crucial to support national, and regional governments in policy-making and implementation, as well as to improve the tools of air quality assessment and management. Moreover, an assessing the chemical compositions, contents of metal elements in PM10 of trace elements should be considered. Several studies have been revealed to determine the concentration of particulate concentration in atmosphere; however, there is limited data on characterization in terms of morphological feature and elemental chemical composition of particulate matter.
Typically, particulates have different shapes, sizes and chemical composition in relation to emission sources. Hence, the physical-chemical and morphological determinations of particulates are one of the main aspects for identification of emission sources as well as environmental and health effects [8,9].
Due to the complexity of PM, it is difficult to determine the characteristics which leads to the adverse health effects [8,10,11]. Transmission electron microscopy analysis has been used to identify for the morphological characteristics of individual particles which is overcome the limitations imposed by bulk chemical analysis [12,13].
Therefore, the present study has been conducted to determine not only the concentration of particulate matter, but also their morphological and chemical composition. Herein, the obtained data could provide more valuable information on the local air quality and chemical composition of PM10.

2. Materials and Methods

2.1. Air Sampling Site

The locations of the selected study area were observed in Bangkok (BK), and its vicinity area included Nonthaburi (NB) and Nakhon Pathom (NP) as shown in Figure 1. The ambient air samples of BK were observed at two locations consisted of Din Daeng (BK1) and Pathum Wan Districts (BK2). Both BK1 and BK2 were selected as the inner area of Bangkok and these sampling sites were situated in the high traffic areas. The location of the selected study area of NB site was within a high traffic density area around the Bang Kruai district. The PM10 data of BK and NB areas were obtained from Pollution Department Control (PCD). The study areas of NP site are represented the air polluted area near the intersection of main heavy traffic congested roads around Mahidol University, Salaya Campus. All samples were observed from October 2019 to February 2020.

2.2. Air Sampling Procedure

The ambient PM10 were collected by using a high-volume air sampler operated at a flow rate of 40 ft3/min. PM10 were collected simultaneously in a 24 h period for all sampling sites.

2.3. TEM-EDS Characterizations

The morphological and quantitative elemental characterization of particles were investigated using transmission electron microscopy (TEM JEOL 2100 Plus, Japan) equipped with energy-dispersive X-ray spectroscopy (EDS). EDS spectra of the individual particle was obtained by scanning an electron beam with an accelerating voltage of 200 kV to determine the individual elemental composition.

2.4. Data Analysis

SPSS software for Windows, version 20, was utilized for statistical analysis in this study. The comparison of PM10 levels among the sampling sites (BK, NP, and NB) were analyzed using One-way analysis of variance (ANOVA) [14,15,16]. A p-value of 0.05 was used for all cases.

3. Results and Discussions

3.1. Ambient Concentration of PM10

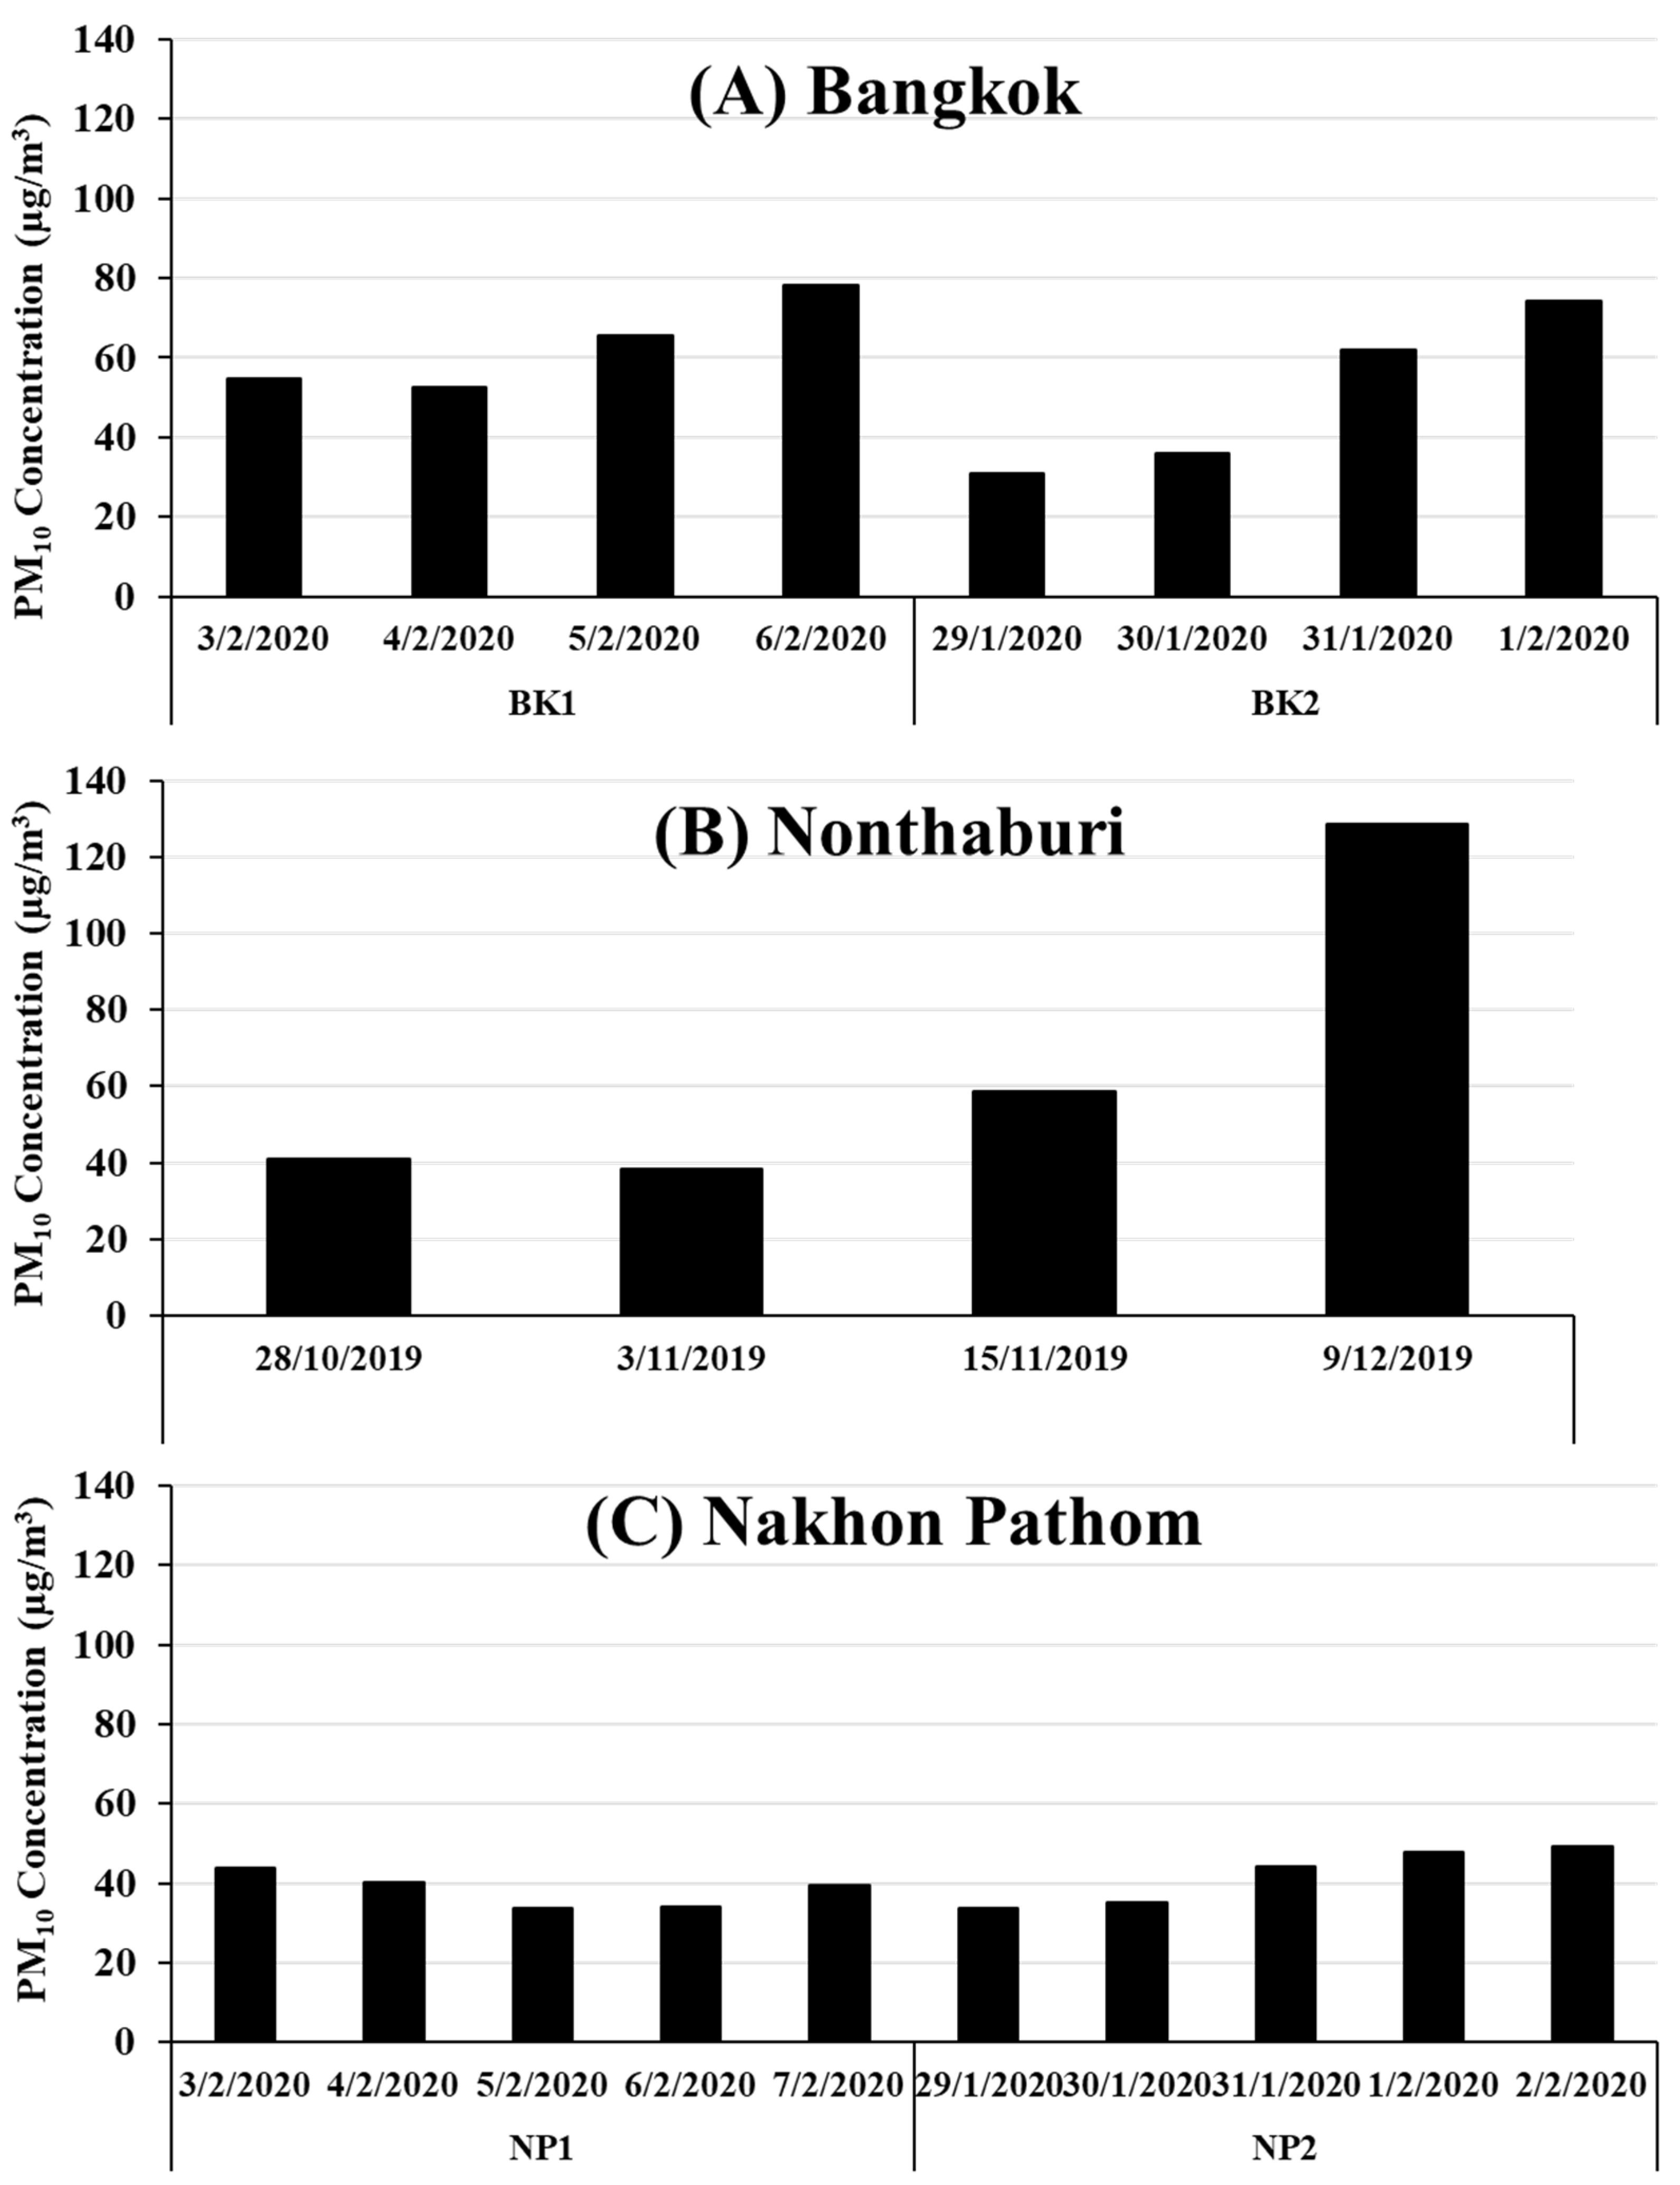
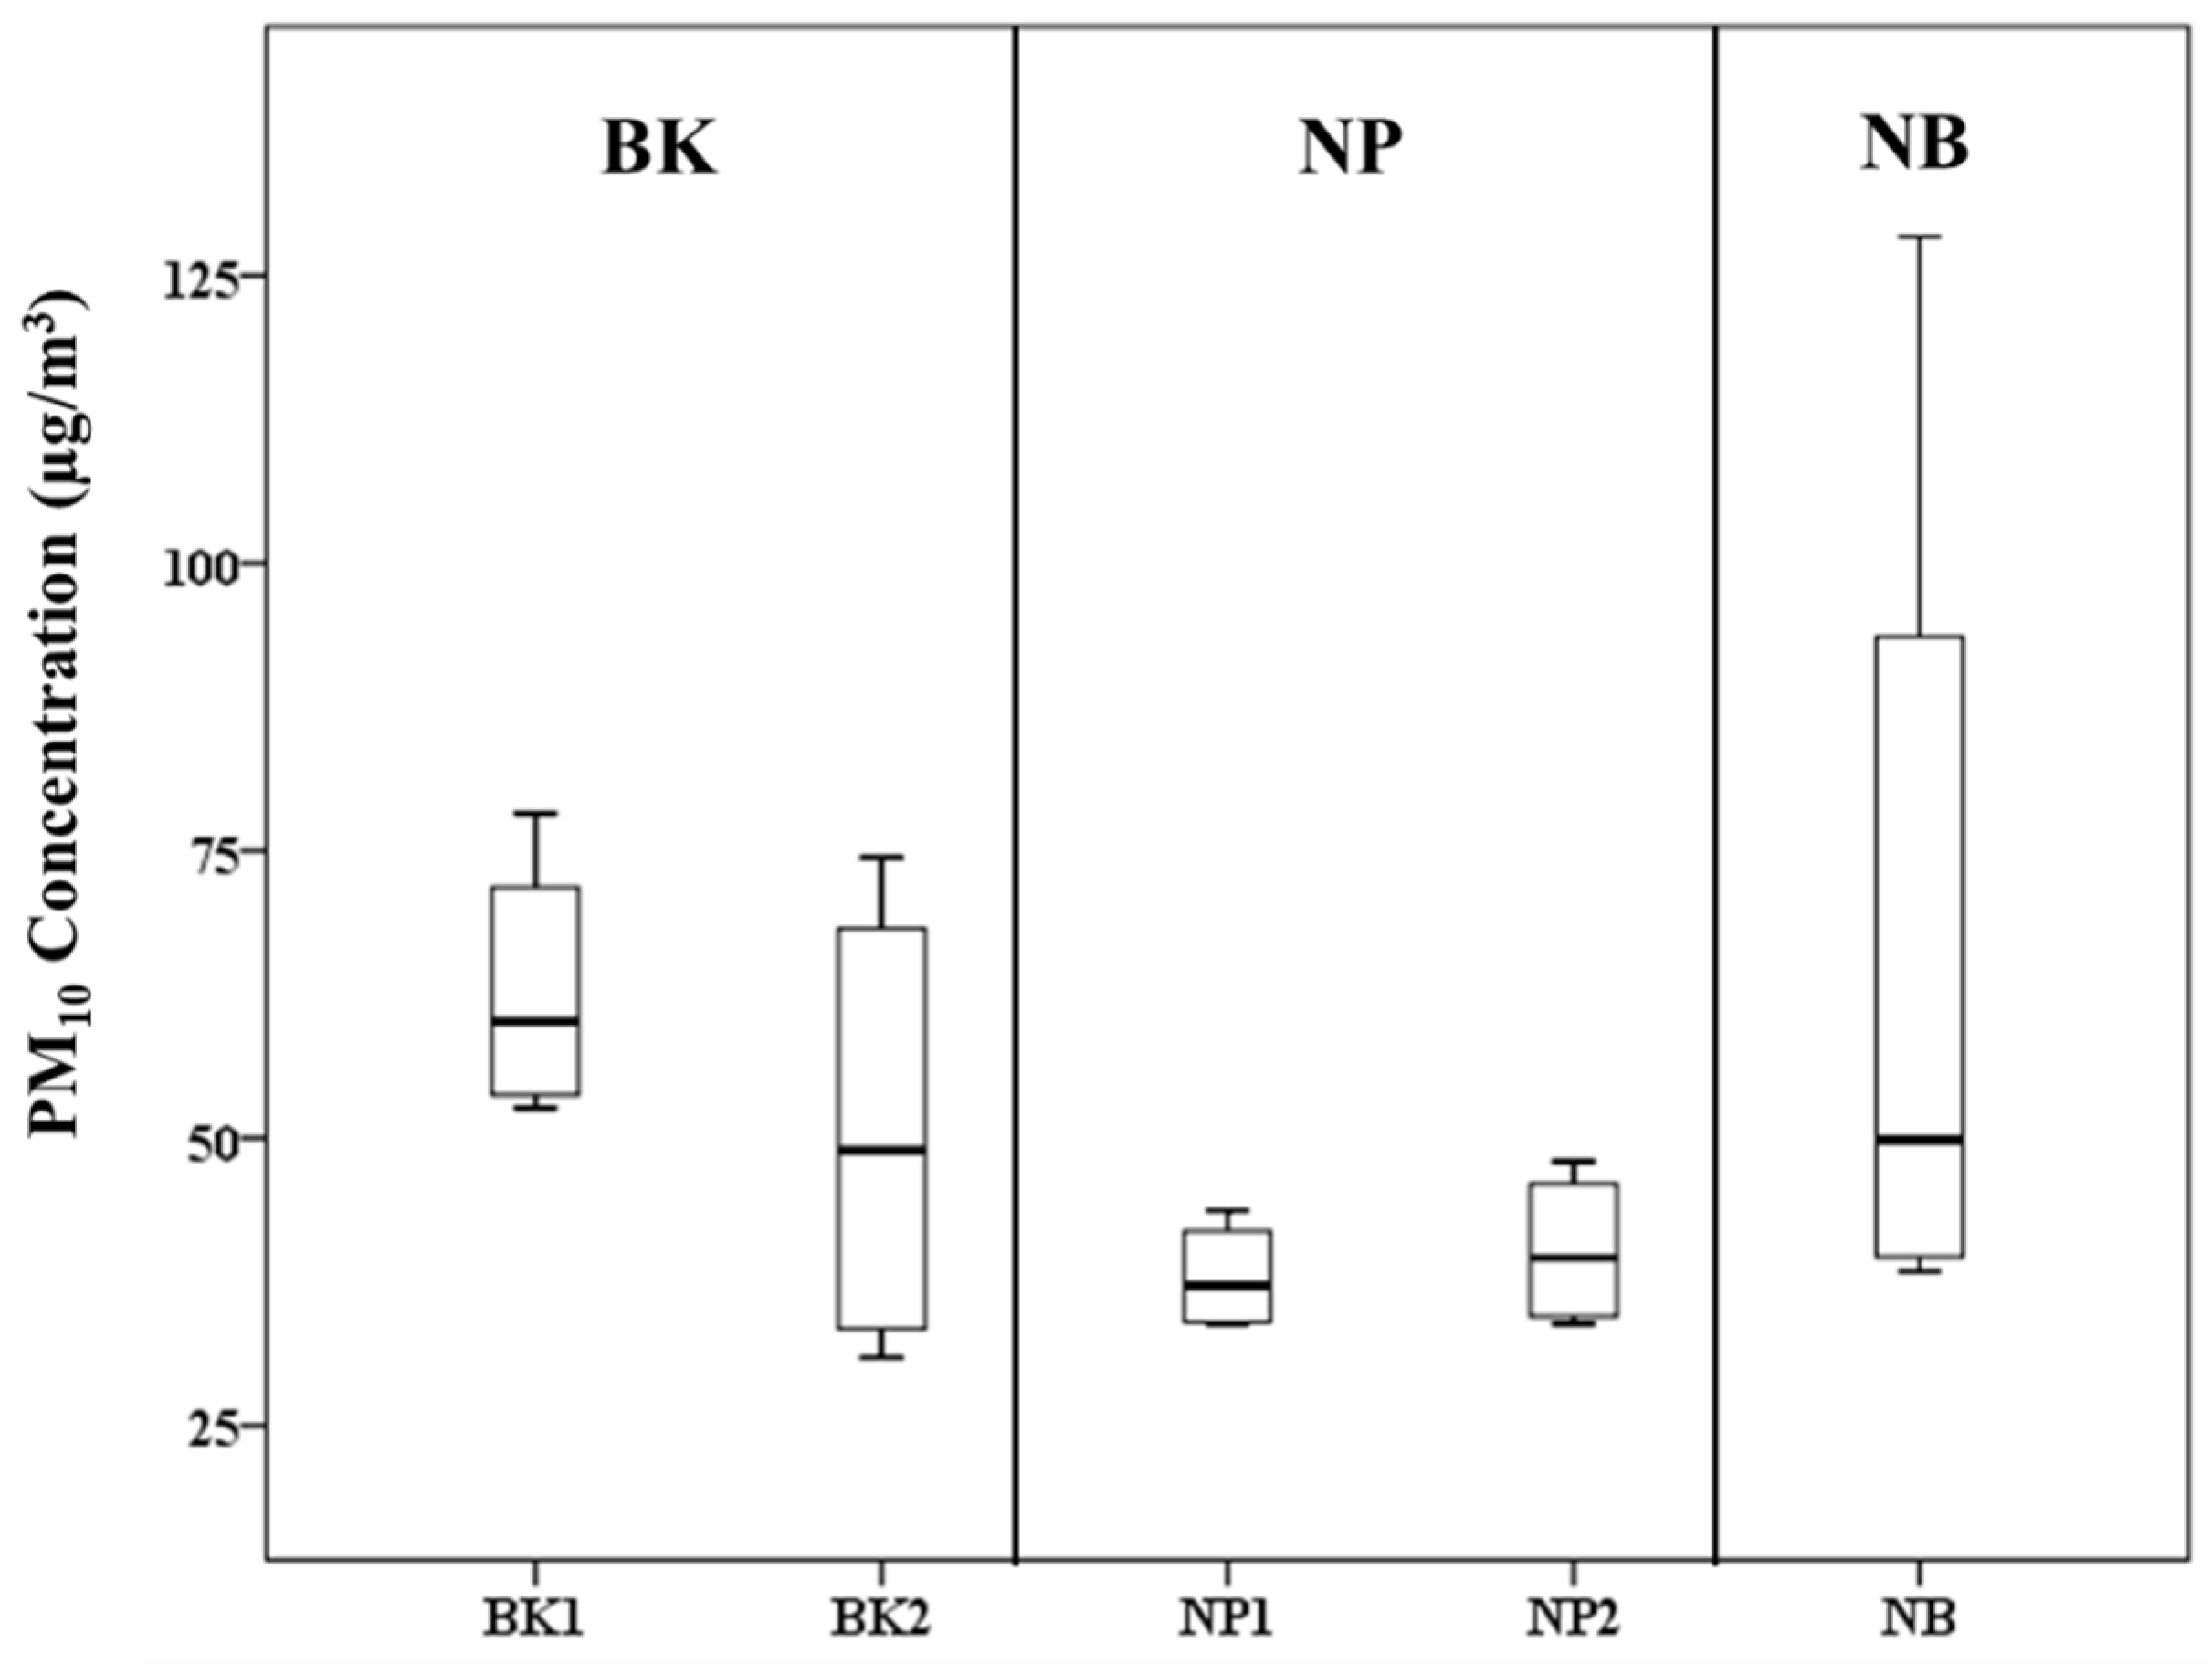
The ambient PM10 levels of all sampling sites are depicted in Figure 2. All detected concentrations of PM10 did not exceed the 24-h PM10 standard of Thailand (120 µg/m3), excepted for the PM10 levels monitored in Nonthaburi Province. The PM10 data of the sampling days reported by Pollution Department Control showed the mean concentration of PM10 at Nonthaburi Province was 66.63 ± 42.17 µg/m3, however the PM10 concentration derived from the sample collected on the samples of 9th December exceeded the standard value. For the sampling site in Bangkok, the average levels of PM10 in BK1 (62.78 ± 11.70 µg/m3) was greater than those detected in BK2 (50.80 ± 20.82 µg/m3). The average PM10 levels at NP1 and NP2 were 38.32 ± 4.23 and 43.03 ± 7.16 µg/m3, respectively. However, there was no significant difference in the levels of PM10 among all the sampled sites for BK and NP (F statistic value is 1.589, Sig 0.223). The trend of PM10 was almost similar because all sampling sites were evaluated in atmospheric samples of a high traffic density area. In order to determine the differences of PM10 levels among all sampling locations, ANOVA was used, and it revealed that there were no significant differences among all the sites as shown in Figure 3.

3.2. Comparison of the PM10 Concentrations with Other Studies

The comparison of PM10 concentrations in this study with other studies is shown in Table 1. The lowest mean concentrations of PM10 were found in Rayong Provinces (Thailand), while the highest mean levels of PM10 were observed in Nepal. The concentrations of PM10 in Bangkok and its vicinity (NP and NB) were lower than those conducted in China, Pakistan, and Nepal, respectively. In this study, only the PM10 level of BK site was greater than that monitored in Iran. Many human activities, which includes industrial processes and motor vehicle exhaust, contributing to ambient PM10.

3.3. Morphology and Chemical Composition of PM10

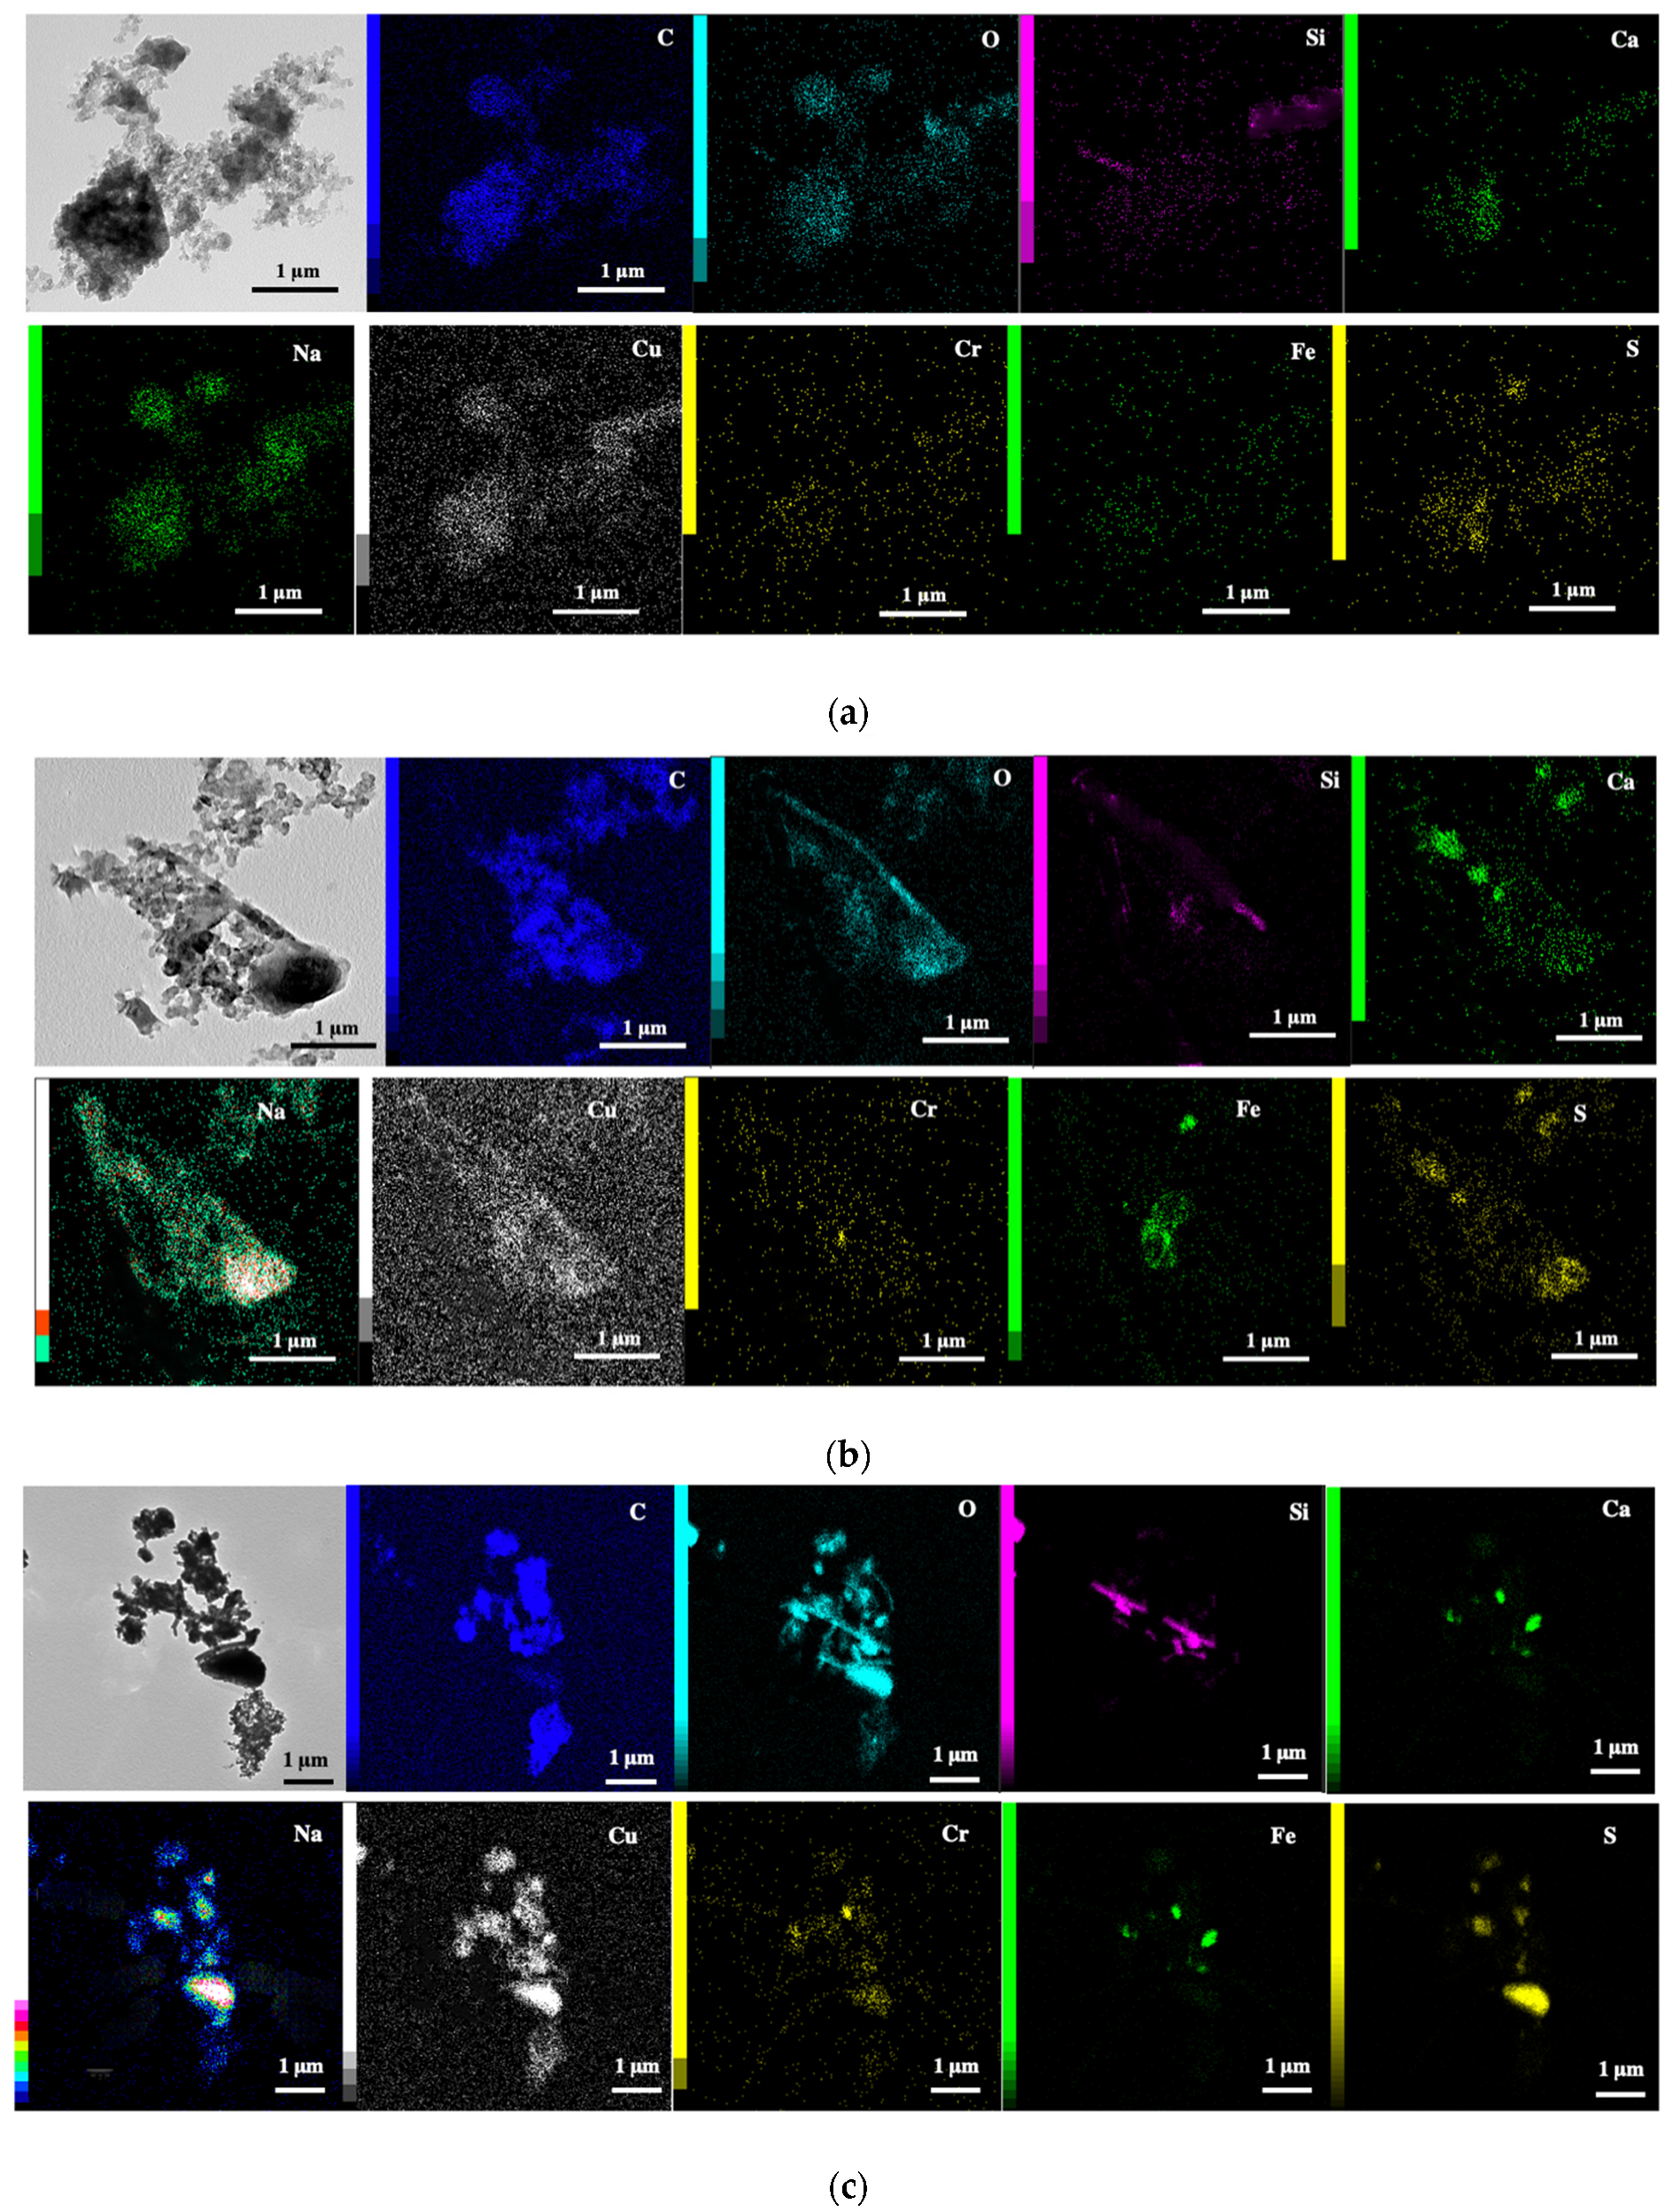
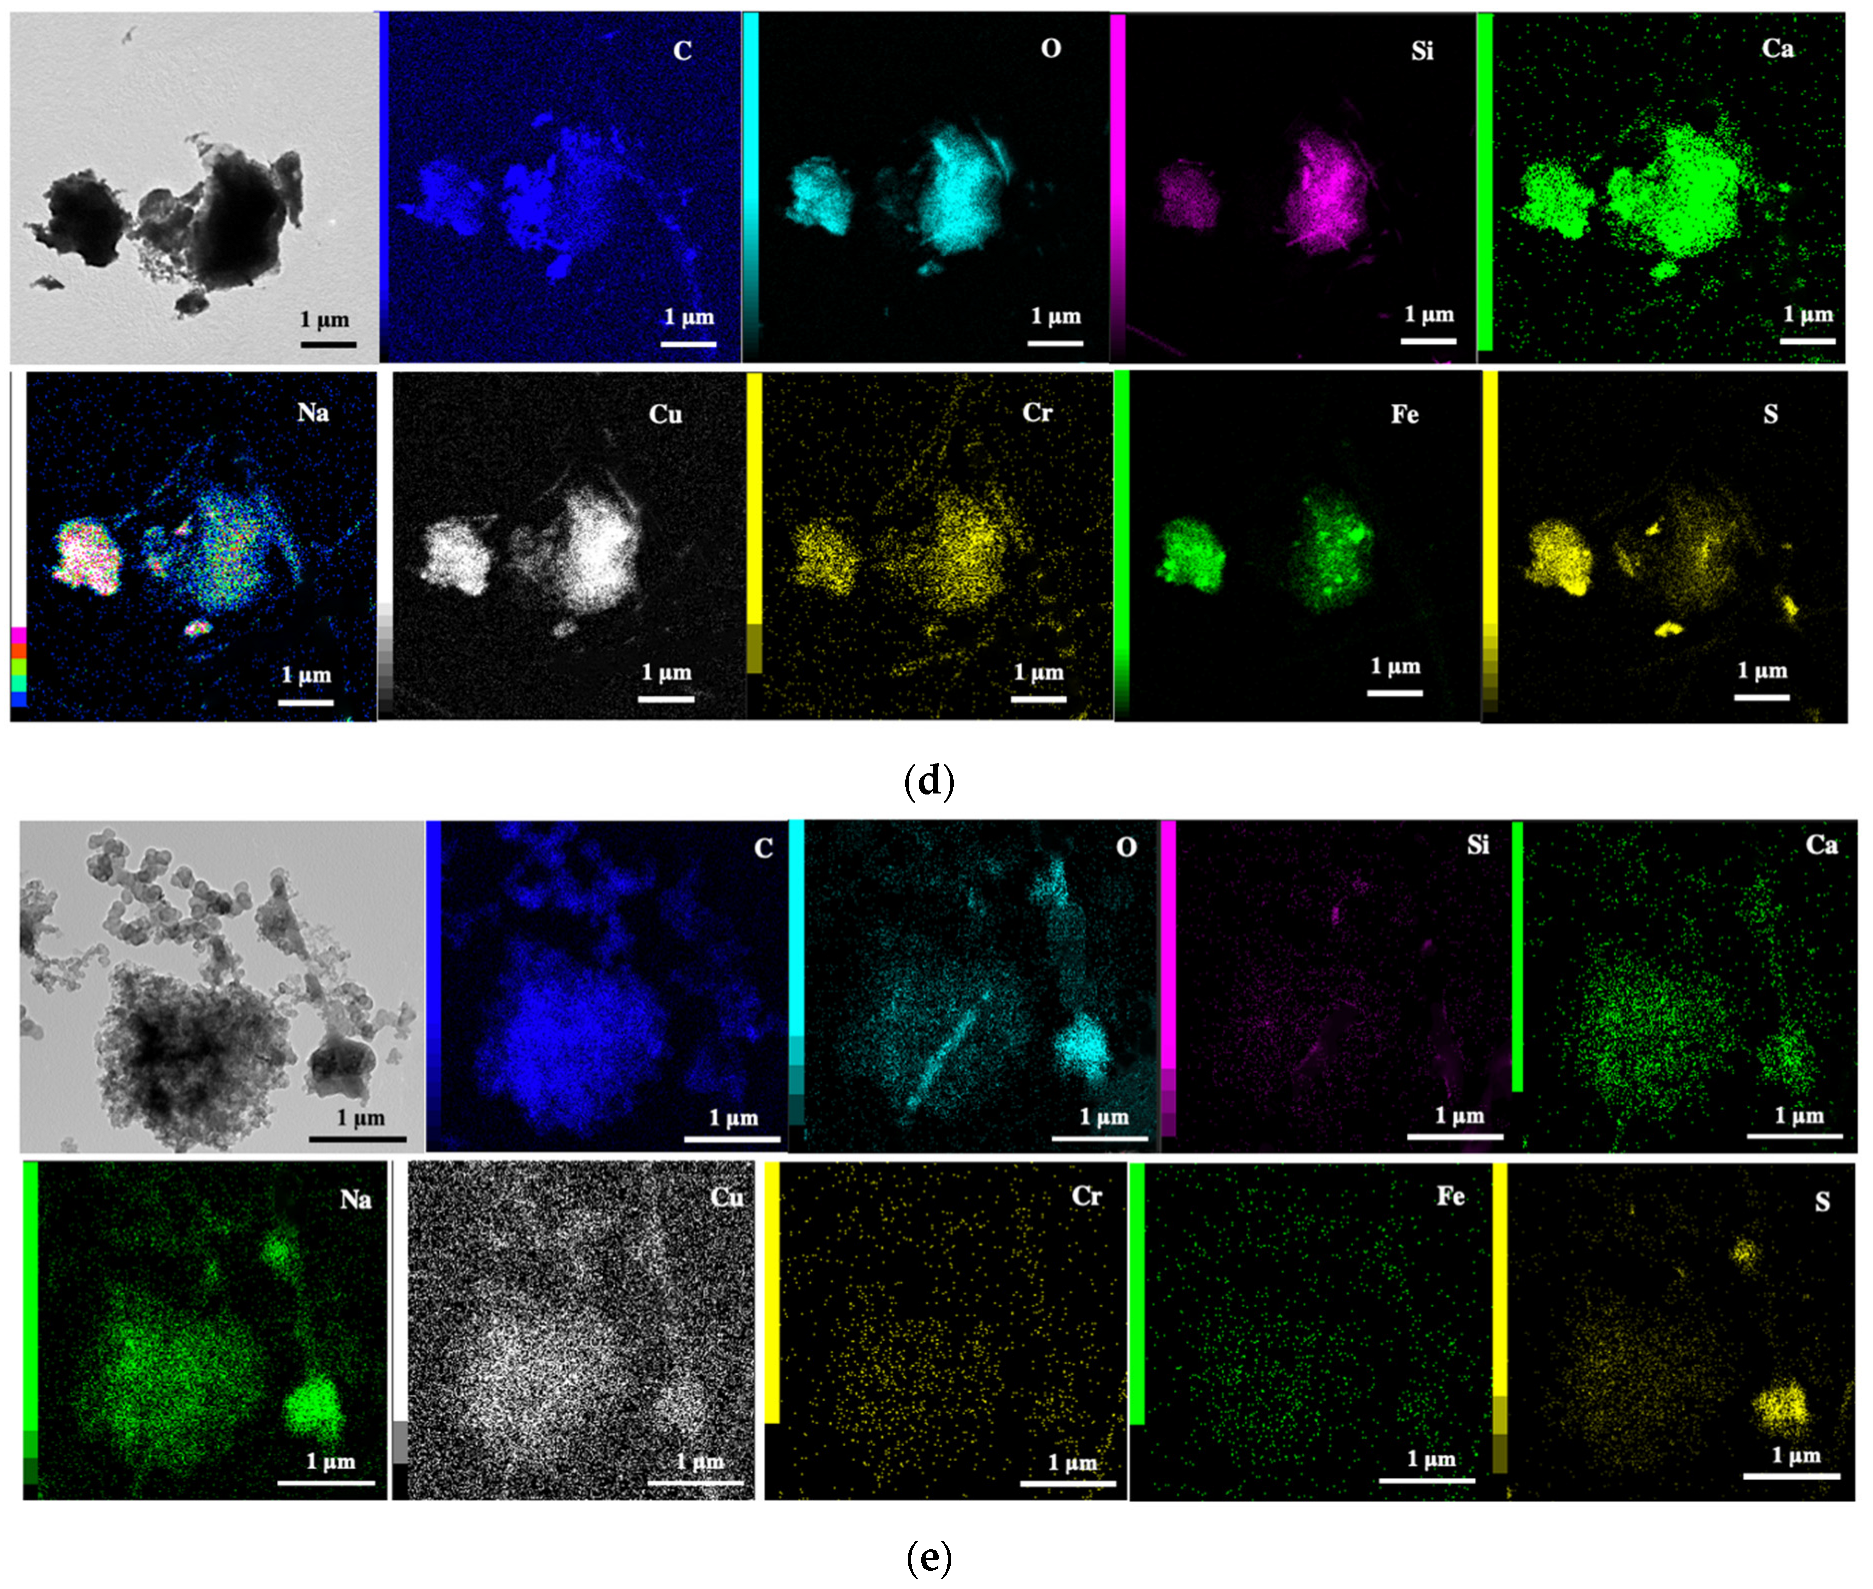
The TEM-EDS was carried out to analyze the morphology and chemical composition of PM10 with different sampling sites (BK1, BK2, NP1, NP2, and NB), as shown in Figure 4a–e. It can be noticed that the diameter size of the single primary particles was not significantly different for PM10 collected in BK1 and BK2 sampling sites. Figure 4a,b illustrates the particles of BK 1 and BK2 sampling sites mainly present a perfectly spherical and irregular shapes, ranging from 2–3 µm. It can be noticed that the PM particles composed of the single primary particles with the average diameter sizes approximately 10–50 nm.
Figure 4c,d present the average diameter sizes, approximately 2–3 µm and 2.5–3 µm of irregular particles from NP1 and NP2, respectively. The particles from NB sampling site present the spherical particles and small agglomerate chain with the average diameter sizes, approximately 2–3 µm and 30–80 nm, respectively, as shown in Figure 4e.
It can be noted that the TEM images of PM10 for all sampling sites revealed the spherical and irregular particles. However, it was observed there are differences in particle aggregation of PM10 with different sampling site. According to Buseck et al., the morphology of soot particles present a chain-like spherical agglomeration of carbonaceous particles that is produced by engine combustion and biomass burning sources [22]. Then, it can be observed that the TEM-EDS images of particles at BK1, BK2, and NB sampling site revealed the soot particles characteristic. Besides, it can be indicated that the concentration of soot particles at different sites was strongly varied significantly depending on high traffic density and commercial area. It can be confirmed that the morphological change depends on sampling site could be attributed to the surrounding environment, season, and human activity in sampling area [23,24]. In addition, the small particles aggregation may raise the surface area for other component deposition and lead to high risk for health effects. Typically, large surface area of ultrafine particle increases their interaction with lung tissue, and can cause damage to human respiratory system [25,26,27]. Furthermore, an increase in number of particles simultaneously increases the surface area, leading to rapid deposition of microscopic airborne toxic elements [8,9,23,28]. Hence, it is a challenge to reduce PM emissions and the associated risks to human health from exposure to PM10.
The elemental mapping depicts the distribution of different elements (C, O, Na, Si, K, Ca, Cr, Fe, and Cu) in the particle. Basically, the particles morphology and chemical composition, illustrate an abundance of natural elements within the sampling area [13,29]. However, some of the elements presented are directly related with human activities. The particles with irregular shape were observed in coarse particle natural sources. It can be noted that the high surface area provides more distribution of metal atoms, contributing to the diffusion of contaminated particles effected on human health [13,29].
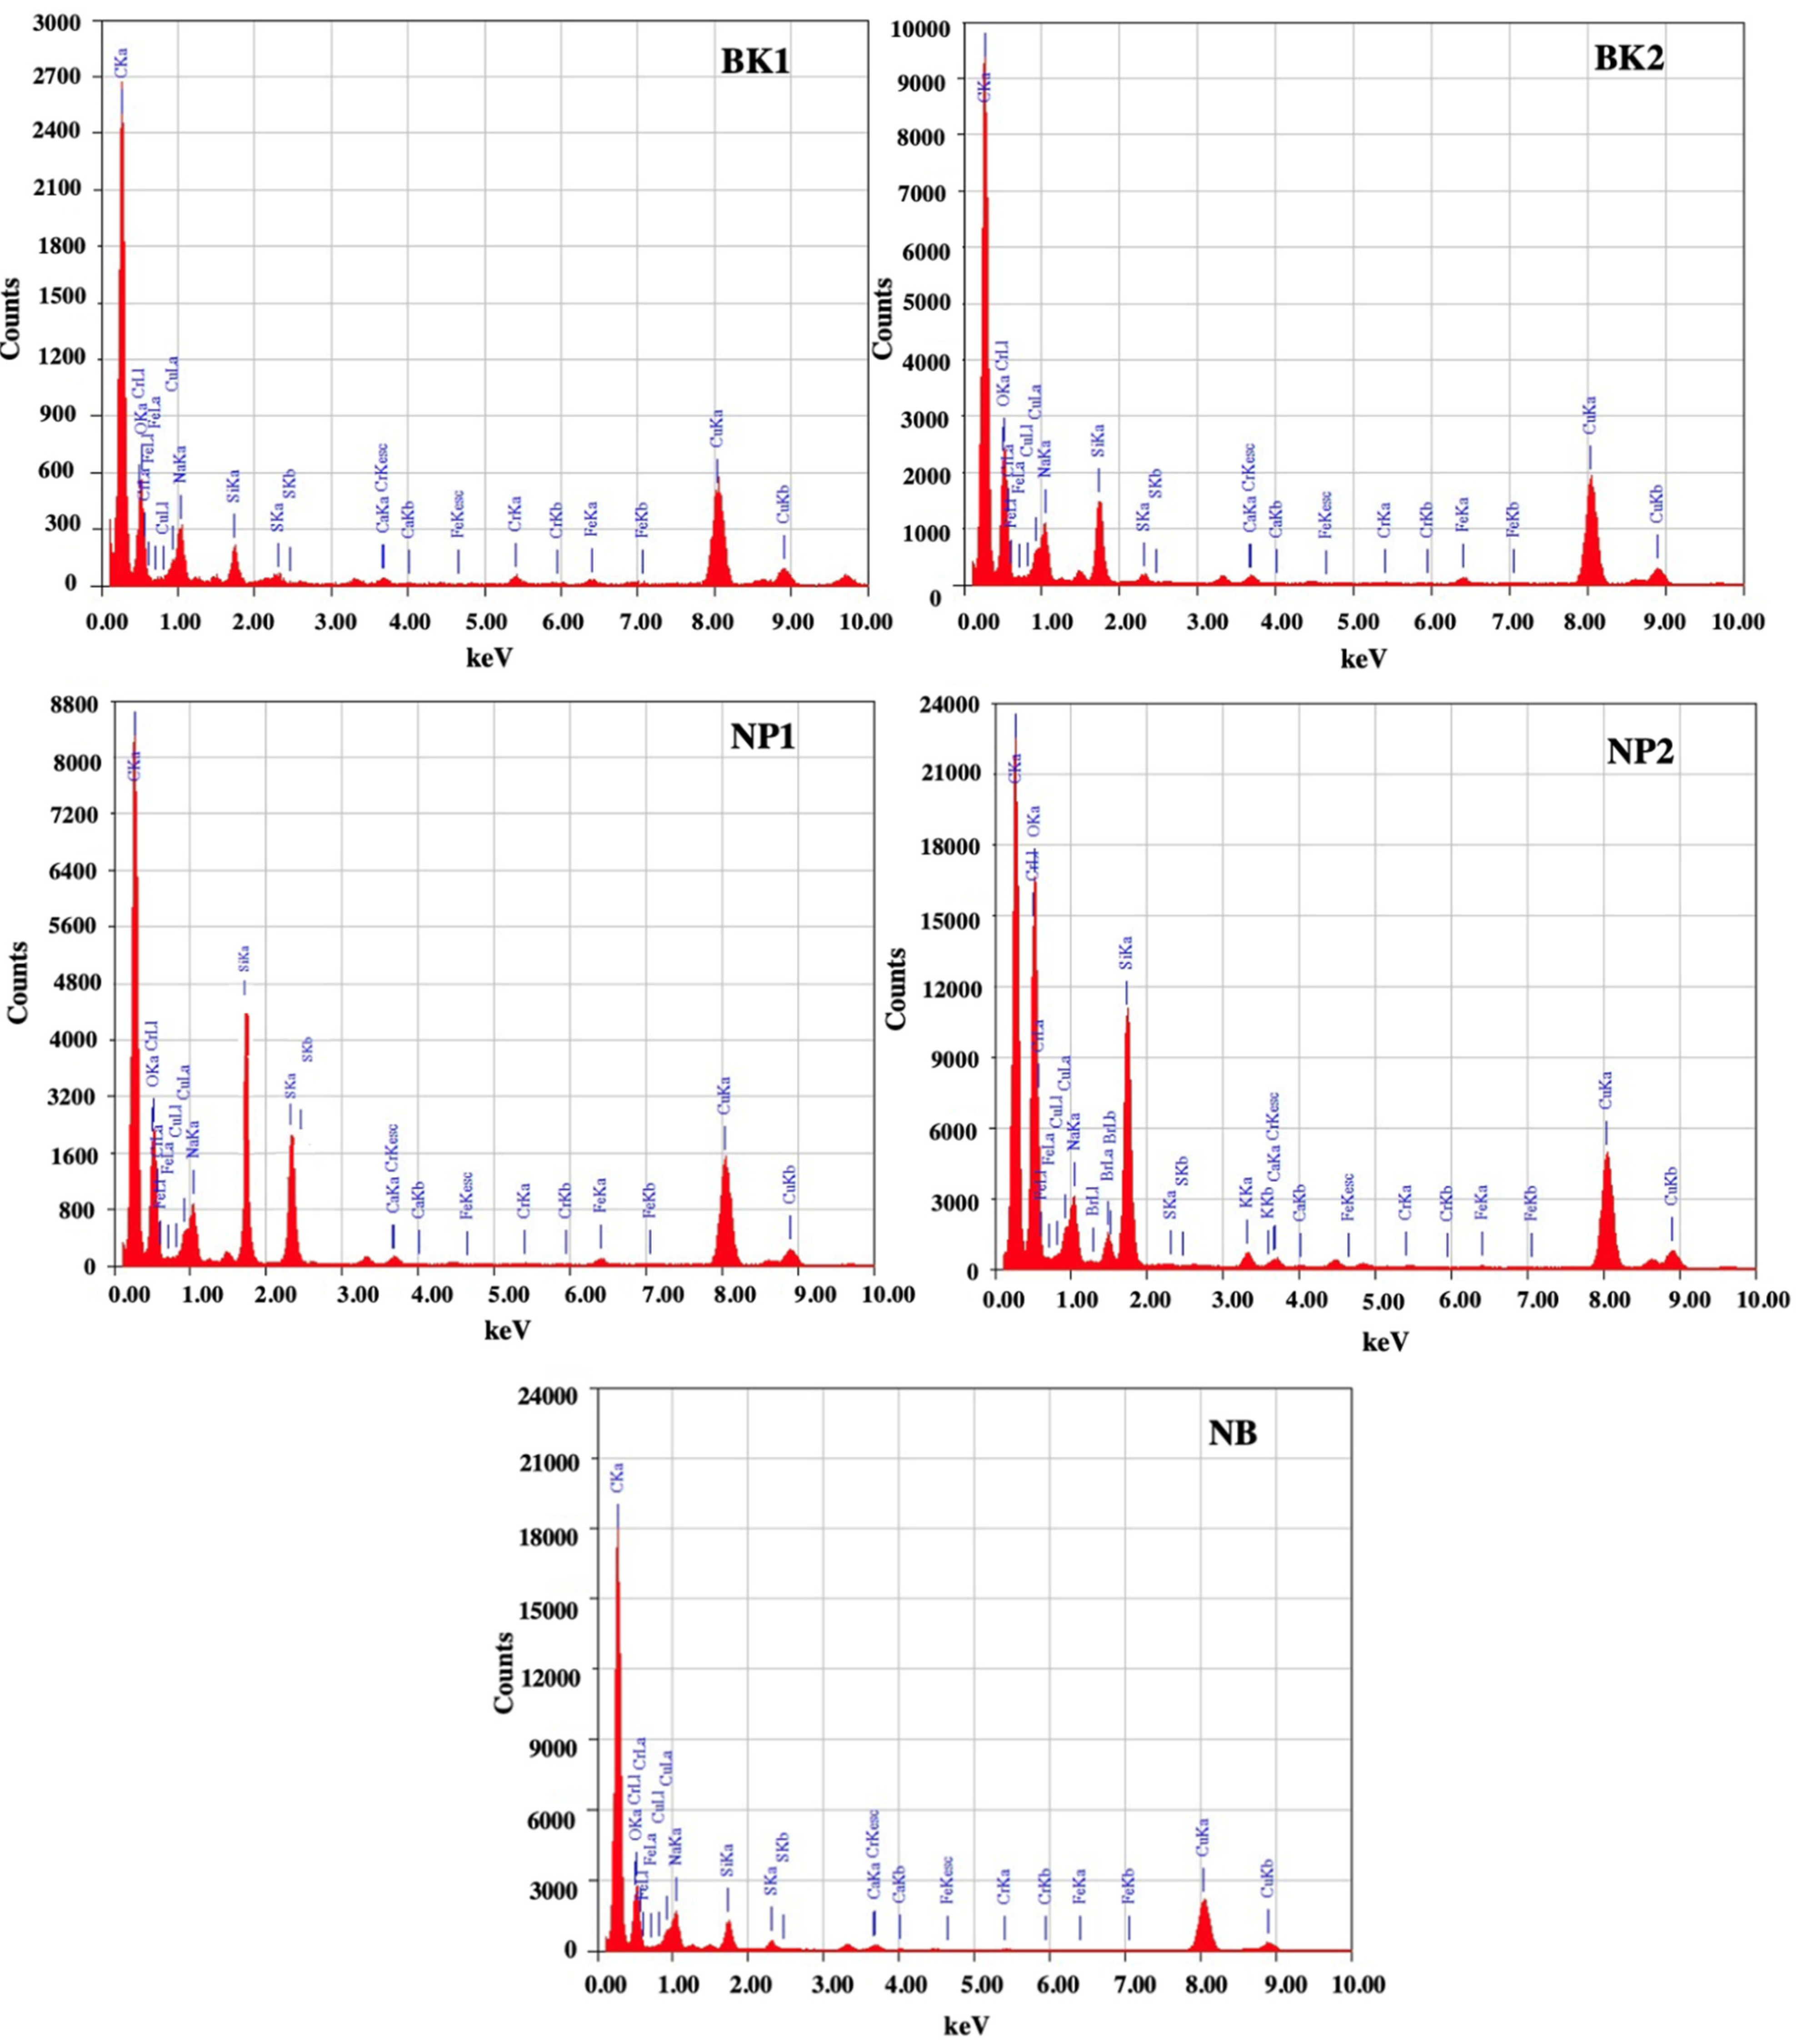
Figure 5 illustrates the EDS spectra of the PM10 at different sampling sites, which exhibits the compositional data of elemental chemical constituents with the presence of nine elements (C, O, Na, Si, K, Ca, Cr, Fe, and Cu) for all sampling sites. Majority of elemental constituents of PM10 samples in various sampling sites (BK1, BK2, NP1, NP2, and NB) with averaged values of weight percentage (wt.%) as shown in Table 2. The quantitative elemental analysis of EDS, which was considered at different elements contained not only C and O but also metal elements such as Si, Ca, Na, Cu, Cr, Fe, and S.
Based on the relative abundance of weight percentage of the elements, it was found that the entire airborne particles collected from different sampling sites were carbonaceous, i.e., the organic particles are mainly composed of C and small amounts of O [13].
The BK1 and BK2 sampling sites present a high content of C, O, Si, and Cu with minor content of other elements such as Ca, Na, Si, Cr, Fe, and S. However, the BK1 sampling site exhibited a higher content of Fe, Cu, and Cr metal elements than that of other sampling sites. Meanwhile, the particles at NP1 and NP2 sampling sites were mainly composed of C, O, and Si, and some components namely Ca, Na, Si, Cu, Cr, Fe, and S. Interestingly, the Si (13.49 wt.%) and Fe (1.15 wt.%) were the dominated elements of the NP2 area which is higher than that of other sampling sites. The particles at NB sampling site contained a higher weight percentage of C, O, Si, and Cu, and minor Ca, Na, Cr, Fe, and S elements. It can be noticed that the NB sampling site with high concentration of PM10 showed the composition of Si element less than that of other sampling sites.
The particles at BK1 revealed a high metal content such as Fe, Cu, and Cr which may be mainly derived from anthropogenic activities such as construction, abrasion of metallic materials, and vehicles or fuel-oil combustion [30,31]. The concentration of organic and metal elements was found to be strongly related with high traffic density in residential and commercial areas. Besides, the particle in all sampling area containing some mineral elements which may come from natural sources such as soil dust, resuspension of dust from road, and some other human activities such as construction and traffic-related sources [8,23,32]. Generally, Ca and S elements in particles are originated by acid-base neutralization reactions in the atmosphere, the deterioration of building surfaces and desulphurization of fuel gas [5].
The particles are composed primarily of Si, Ca, Na, and Fe, their origin is mainly come from erosion of building products, road dust and acid-base neutralization reactions in atmosphere [28,30]. This implies that the pollution in the region is primarily vehicle emission. Similarly, previously studies have shown that the metal and heavy metals Fe, Cr, Cu, and S are the main pollutants in urban street dust [31,33,34]. It can be confirmed that the PM10 in Bangkok, Thailand has a wide range of physical and chemical characteristics including structure, shape, size, and chemical composition.

4. Conclusions

PM10 concentrations in this study were mainly affected by the traffic emission. The vehicular exhaust emissions produce particles mostly in all sampling sites. This study has shown that the overall average concentrations of PM10 were within an acceptable level according to the Thailand standard. The particle morphology of PM10 collected from all urban residential sampling sites was spherical with chain-like aggregates and irregular shapes, ranging from 2–3 µm. For the element composition analysis, the particles contained not only a higher percentage of carbon and oxygen, but also some mineral and metal elements. Among the metal elements, Cu, Cr, and Fe were the dominated metal element at sampling site in Bangkok area. Meanwhile, Si was standing as the main component at sampling site in Nakhon Pathom and Nonthaburi areas. The composition elements of PM10 collected from different areas show the presence of a wide diversity of particles from natural and anthropogenic origin such as engine combustion and construction. Notably, the morphology and elements found in the PM10 indicate the importance of the individual characterization of atmospheric aerosols which provides the valuable additional information on the potential health effects and origin of particles.

Author Contributions

Conceptualization, N.K. and P.P.; Data curation, N.K. and P.P.; Formal analysis, N.K., T.B. and P.P.; Funding acquisition, N.K., T.B. and P.P.; Investigation, N.K., T.B. and P.P.; Methodology, N.K., T.B. and P.P.; Resources, N.K., T.B. and P.P.; Validation, N.K., T.B. and P.P.; Visualization, N.K. and P.P.; Writing-original draft preparation, N.K. and P.P.; Writing-review and editing, N.K., T.B. and P.P. All authors have read and agreed to the published version of the manuscript.

Funding

This research was partially funded by the Faculty of Environmental Resources Studies, Mahidol University. The sampling equipment and analytical instrument were supported by National Nanotechnology Center (NANOTEC) via grant number P1951553.

Acknowledgments

The sampling equipment and analytical instrument were supported by Faculty of Environmental Resources Studies. The samples of PM10 at BK and NB sites was provided by Pollution Control Department.

Conflicts of Interest

There are no conflicts to declare.

References

  1. Punsompong, P.; Chantara, S. Identification of potential sources of PM10 pollution from biomass burning in northern Thailand using statistical analysis of trajectories. Atmos. Pollut. Res. 2018, 9, 1038–1051. [Google Scholar] [CrossRef] [Green Version]
  2. Zhou, L.; Su, X.; Li, B.; Chu, C.; Sun, H.; Zhang, N.; Han, B.; Li, C.; Zou, B.; Niu, Y.; et al. PM2.5 exposure impairs sperm quality through testicular damage dependent on NALP3 inflammasome and miR-183/96/182 cluster targeting FOXO1 in mouse. Ecotoxicol. Environ. Saf. 2019, 169, 551–563. [Google Scholar] [CrossRef] [PubMed]
  3. Khodeir, M.; Shamy, M.; Alghamdi, M.; Zhong, M.; Sun, H.; Costa, M.; Chen, L.-C.; Maciejczyk, P. Source apportionment and elemental composition of PM2.5 and PM10 in Jeddah City, Saudi Arabia. Atmos. Pollut. Res. 2012, 3, 331–340. [Google Scholar] [CrossRef] [PubMed] [Green Version]
  4. Xing, Y.-F.; Xu, Y.-H.; Shi, M.-H.; Lian, Y.-X. The impact of PM2.5 on the human respiratory system. J. Thorac. Dis. 2016, 8, E69–E74. [Google Scholar] [CrossRef]
  5. Wilczyńska-Michalik, W.; Gasek, R.; Michalik, M.; Dańko, J.; Plaskota, T. Mineralogy, chemical composition and leachability of ash from biomass combustion and biomass–coal co-combustion. Mineralogia 2018, 49, 67–97. [Google Scholar] [CrossRef] [Green Version]
  6. Apeagyei, E.; Bank, M.S.; Spengler, J.D. Distribution of heavy metals in road dust along an urban-rural gradient in Massachusetts. Atmos. Environ. 2011, 45, 2310–2323. [Google Scholar] [CrossRef]
  7. Damek-Poprawa, M.; Sawicka-Kapusta, K. Histopathological changes in the liver, kidneys, and testes of bank voles environmentally exposed to heavy metal emissions from the steelworks and zinc smelter in Poland. Environ. Res. 2004, 96, 72–78. [Google Scholar] [CrossRef]
  8. Bharti, S.K.; Kumar, D.; Anand, S.; Poonam; Barman, S.C.; Kumar, N. Characterization and morphological analysis of individual aerosol of PM10 in urban area of Lucknow, India. Micron 2017, 103, 90–98. [Google Scholar] [CrossRef]
  9. D’Evelyn, S.M.; Vogel, C.F.A.; Bein, K.J.; Lara, B.; Laing, E.A.; Abarca, R.A.; Zhang, Q.; Li, L.; Li, J.; Nguyen, T.B.; et al. Differential inflammatory potential of particulate matter (PM) size fractions from imperial valley, CA. Atmos. Environ. 2021, 244, 117992. [Google Scholar] [CrossRef]
  10. Vongruang, P.; Pimonsree, S. Biomass burning sources and their contributions to PM10 concentrations over countries in mainland Southeast Asia during a smog episode. Atmos. Environ. 2020, 228, 117414. [Google Scholar] [CrossRef]
  11. Wu, Z.; Liu, F.; Fan, W. Characteristics of PM10 and PM2.5 at Mount Wutai Buddhism Scenic Spot, Shanxi, China. Atmosphere 2015, 6, 1195–1210. [Google Scholar] [CrossRef] [Green Version]
  12. Labrada-Delgado, G.; Aragon-Pina, A.; Campos-Ramos, A.; Castro-Romero, T.; Amador-Munoz, O.; Villalobos-Pietrini, R. Chemical and morphological characterization of PM2.5 collected during MILAGRO campaign using scanning electron microscopy. Atmos. Pollut. Res. 2012, 3, 289–300. [Google Scholar] [CrossRef] [Green Version]
  13. Liati, A.; Schreiber, D.; Lugovyy, D.; Gramstat, S.; Dimopoulos Eggenschwiler, P. Airborne particulate matter emissions from vehicle brakes in micro- and nano-scales: Morphology and chemistry by electron microscopy. Atmos. Environ. 2019, 212, 281–289. [Google Scholar] [CrossRef]
  14. Hodson, D.L.R.; Sutton, R.T. Exploring multi-model atmospheric GCM ensembles with ANOVA. Clim. Dyn. 2008, 31, 973–986. [Google Scholar] [CrossRef]
  15. Chattopadhyay, G.; Chattopadhyay, S. A probe into the chaotic nature of total ozone time series by correlation dimension method. Soft Comput. 2008, 12, 1007–1012. [Google Scholar] [CrossRef] [Green Version]
  16. Chattopadhyay, S.; Chattopadhyay-Bandyopadhyay, G. Forecasting daily total ozone concentration—a comparison between neurocomputing and statistical approaches. Int. J. Remote Sens. 2008, 29, 1903–1916. [Google Scholar] [CrossRef]
  17. Navaporn Kanjanasiranont, T.P.; Narut, S. Ambient and Indoor PM10 and PM10-bound PAHs around the Vicinity of an Industrial Estate in Rayong, Thailand: Concentration and Source Identification. Appl. Environ. Res. 2021, 43, 15–29. [Google Scholar] [CrossRef]
  18. Majumder, A.K.; Nazmul Islam, K.M.; Bajracharya, R.M.; Carter, W.S. Assessment of occupational and ambient air quality of traffic police personnel of the Kathmandu valley, Nepal; in view of atmospheric particulate matter concentrations (PM10). Atmos. Pollut. Res. 2012, 3, 132–142. [Google Scholar] [CrossRef] [Green Version]
  19. Karimi, B.; Shokrinezhad, B. Spatial variation of ambient PM2.5 and PM10 in the industrial city of Arak, Iran: A land-use regression. Atmos. Pollut. Res. 2021, 12, 101235. [Google Scholar] [CrossRef]
  20. Ahmad, I.; Khan, B.; Khan, S.; Rahman, Z.u.; Khan, M.A.; Gul, N. Airborne PM10 and lead concentrations at selected traffic junctions in Khyber Pakhtunkhwa, Pakistan: Implications for human health. Atmos. Pollut. Res. 2019, 10, 1320–1325. [Google Scholar] [CrossRef]
  21. Wang, J.; Hu, Z.; Chen, Y.; Chen, Z.; Xu, S. Contamination characteristics and possible sources of PM10 and PM2.5 in different functional areas of Shanghai, China. Atmos. Environ. 2013, 68, 221–229. [Google Scholar] [CrossRef]
  22. Buseck, P.R.; Adachi, K.; Gelencsér, A.; Tompa, É.; Pósfai, M. Are black carbon and soot the same? Atmos. Chem. Phys. Discuss. 2012, 2012, 24821–24846. [Google Scholar] [CrossRef] [Green Version]
  23. Jabłońska, M.; Janeczek, J. Identification of industrial point sources of airborne dust particles in an urban environment by a combined mineralogical and meteorological analyses: A case study from the Upper Silesian conurbation, Poland. Atmos. Pollut. Res. 2019, 10, 980–988. [Google Scholar] [CrossRef]
  24. Shahid, I.; Kistler, M.; Mukhtar, A.; Ghauri, B.M.; Ramirez-Santa Cruz, C.; Bauer, H.; Puxbaum, H. Chemical characterization and mass closure of PM10 and PM2.5 at an urban site in Karachi–Pakistan. Atmos. Environ. 2016, 128, 114–123. [Google Scholar] [CrossRef]
  25. Clifford, S.; Mazaheri, M.; Salimi, F.; Ezz, W.N.; Yeganeh, B.; Low-Choy, S.; Walker, K.; Mengersen, K.; Marks, G.B.; Morawska, L. Effects of exposure to ambient ultrafine particles on respiratory health and systemic inflammation in children. Environ. Int. 2018, 114, 167–180. [Google Scholar] [CrossRef]
  26. da Costa e Oliveira, J.R.; Base, L.H.; de Abreu, L.C.; Filho, C.F.; Ferreira, C.; Morawska, L. Ultrafine particles and children’s health: Literature review. Paediatr. Respir. Rev. 2019, 32, 73–81. [Google Scholar] [CrossRef] [PubMed]
  27. Guo, L.; Johnson, G.R.; Hofmann, W.; Wang, H.; Morawska, L. Deposition of ambient ultrafine particles in the respiratory tract of children: A novel experimental method and its application. J. Aerosol Sci. 2020, 139, 105465. [Google Scholar] [CrossRef]
  28. Moreno-Ríos, A.L.; Tejeda-Benítez, L.P.; Bustillo-Lecompte, C.F. Sources, characteristics, toxicity, and control of ultrafine particles: An overview. Geosci. Front. 2021, 13, 101147. [Google Scholar] [CrossRef]
  29. Hernández-Pellón, A.; Mazón, P.; Fernández-Olmo, I. Quantification of manganese species in particulate matter collected in an urban area nearby a manganese alloy plant. Atmos. Environ. 2019, 205, 46–51. [Google Scholar] [CrossRef]
  30. Hao, Y.; Gao, C.; Deng, S.; Yuan, M.; Song, W.; Lu, Z.; Qiu, Z. Chemical characterisation of PM2.5 emitted from motor vehicles powered by diesel, gasoline, natural gas and methanol fuel. Sci. Total Environ. 2019, 674, 128–139. [Google Scholar] [CrossRef]
  31. Lu, Z.; Deng, S.; Liu, X.; Huang, L.; Zhang, R.; Song, H.; Li, G. Morphology and composition of particles emitted from conventional and alternative fuel vehicles. Environ. Sci. Pollut. Res. 2021, 28, 19810–19821. [Google Scholar] [CrossRef] [PubMed]
  32. Genga, A.; Baglivi, F.; Siciliano, M.; Siciliano, T.; Tepore, M.; Micocci, G.; Tortorella, C.; Aiello, D. SEM-EDS investigation on PM10 data collected in Central Italy: Principal Component Analysis and Hierarchical Cluster Analysis. Chem. Cent. J. 2012, 6, S3. [Google Scholar] [CrossRef] [Green Version]
  33. Karin, P.; Koko, P.; Charoenphonphanich, C.; Chollacoop, N.; Hanamura, K. Physicochemical Characterization of Diesel Engine’s Soot and Metal Oxide Ash Nanoparticles Using Electron Microscopy, EDS and TGA. Emiss. Control. Sci. Technol. 2021, 7, 91–104. [Google Scholar] [CrossRef]
  34. Kostenidou, E.; Martinez-Valiente, A.; R’Mili, B.; Marques, B.; Temime-Roussel, B.; Durand, A.; André, M.; Liu, Y.; Louis, C.; Vansevenant, B.; et al. Technical note: Emission factors, chemical composition, and morphology of particles emitted from Euro 5 diesel and gasoline light-duty vehicles during transient cycles. Atmos. Chem. Phys. 2021, 21, 4779–4796. [Google Scholar] [CrossRef]
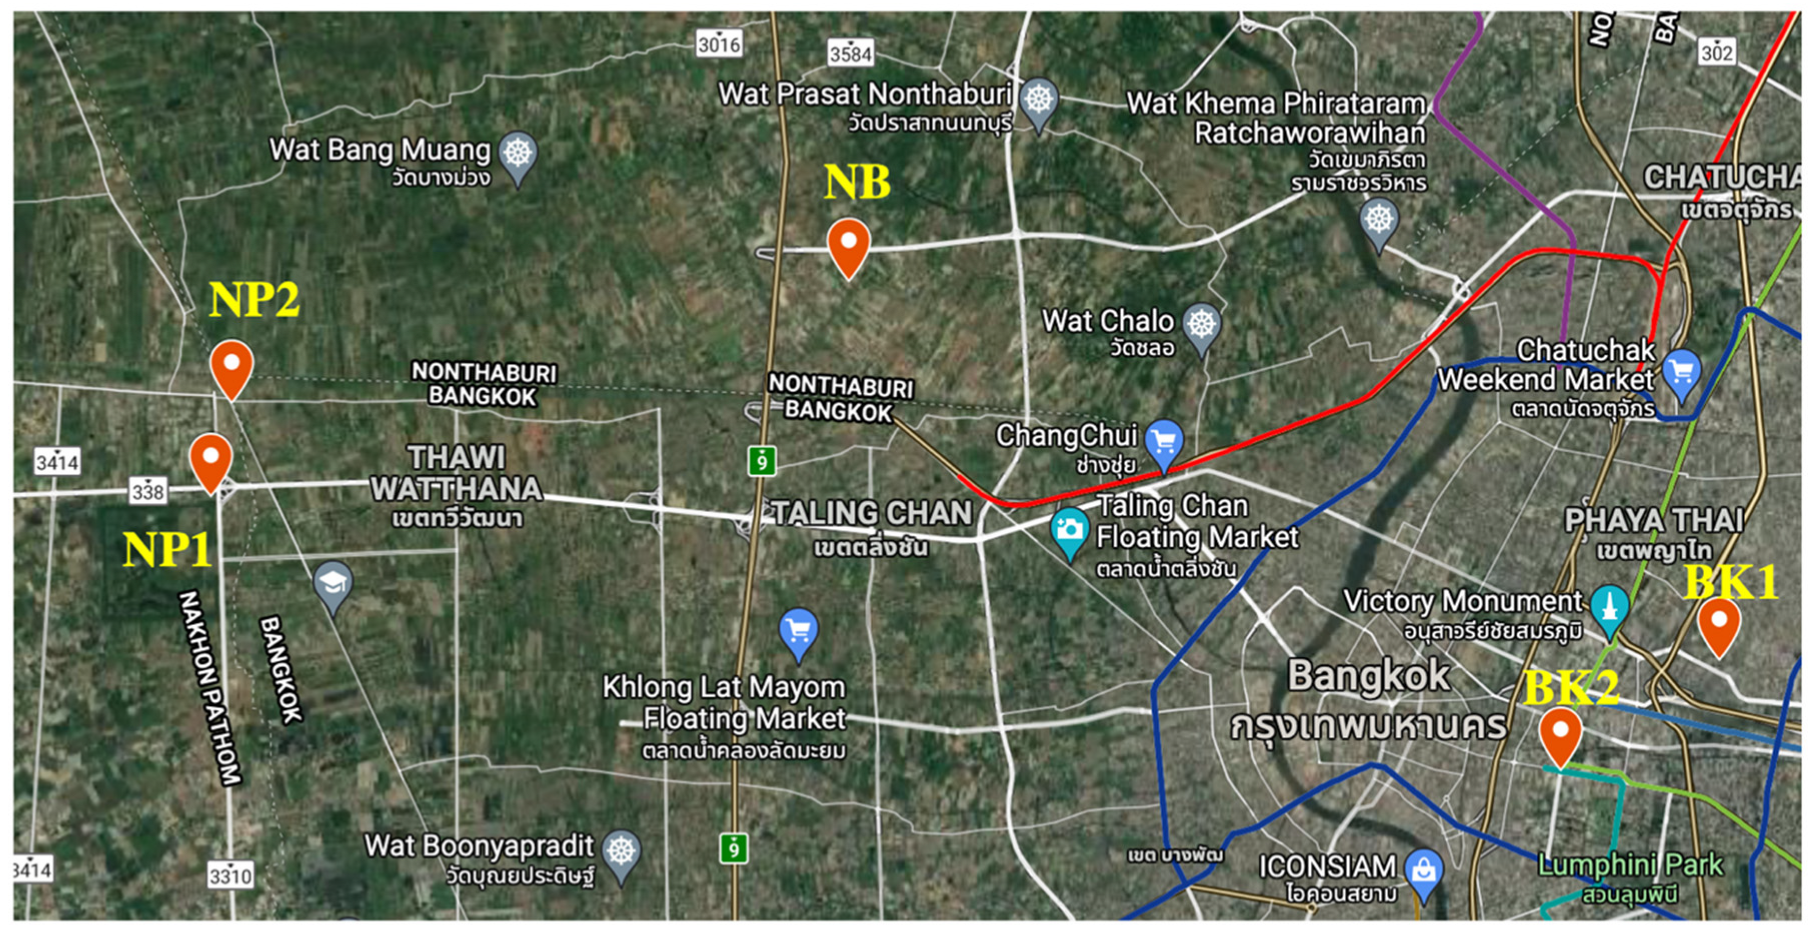
Figure 1. Locations of the air sampling sites in Bangkok (BK), and its vicinity area included Nonthaburi (NB) and Nakhon Pathom (NP).
Atmosphere 13 00239 g001
Figure 2. Ambient air concentrations of PM10 at (A) BK (n = 8), (B) NB (n = 4), and (C) NP (n = 10).
Atmosphere 13 00239 g002
Figure 3. Average concentrations of PM10 at all sampling sites.
Atmosphere 13 00239 g003
Figure 4. TEM micrographs and EDS elemental mapping analysis of PM10 at (a) BK1, (b) BK2, (c) NP1, (d) NP2, and (e) NB sampling sites.
Atmosphere 13 00239 g004aAtmosphere 13 00239 g004b
Figure 5. EDX spectra of particles in PM10 collected from various sampling sites.
Atmosphere 13 00239 g005
Table 1. Average ambient concentrations of PM10 in other locations.
SiteAverage Concentration (µg/m3)References
Bangkok, Thailand 57This study
Nonthaburi, Thailand 42This study
Nakhon Pathom, Thailand40This study
Rayong, Thailand16[17]
Kathmandu, Nepal822[18]
Arak, Iran50[19]
Charsadda, Pakistan254[20]
Khyber Pakhtunkhwa, Pakistan208[20]
Shanghai, China149[21]
Table 2. Quantitative elemental analysis of PM10 samples in sampling sites by TEM-EDS.
Sampling SitesElements (wt.%)
COSiCaNaCuCrFeS
BK185.898.553.420.010.011.620.240.230.04
BK285.607.695.220.010.011.210.030.210.04
NP183.619.326.150.010.010.450.030.210.21
NP273.2211.2813.490.010.010.660.091.150.09
NB88.597.153.170.010.010.980.020.030.05
S.D.5.951.624.21000.460.090.450.07
Publisher’s Note: MDPI stays neutral with regard to jurisdictional claims in published maps and institutional affiliations.