Air Pollution Dispersion over Durban, South Africa
Abstract
:1. Introduction
1.1. Background
1.2. Motivation and Objectives
2. Data and Methods
2.1. Data
2.2. Temporal Methods
2.3. Spatial Methods
2.4. Case Study and Prediction
3. Results
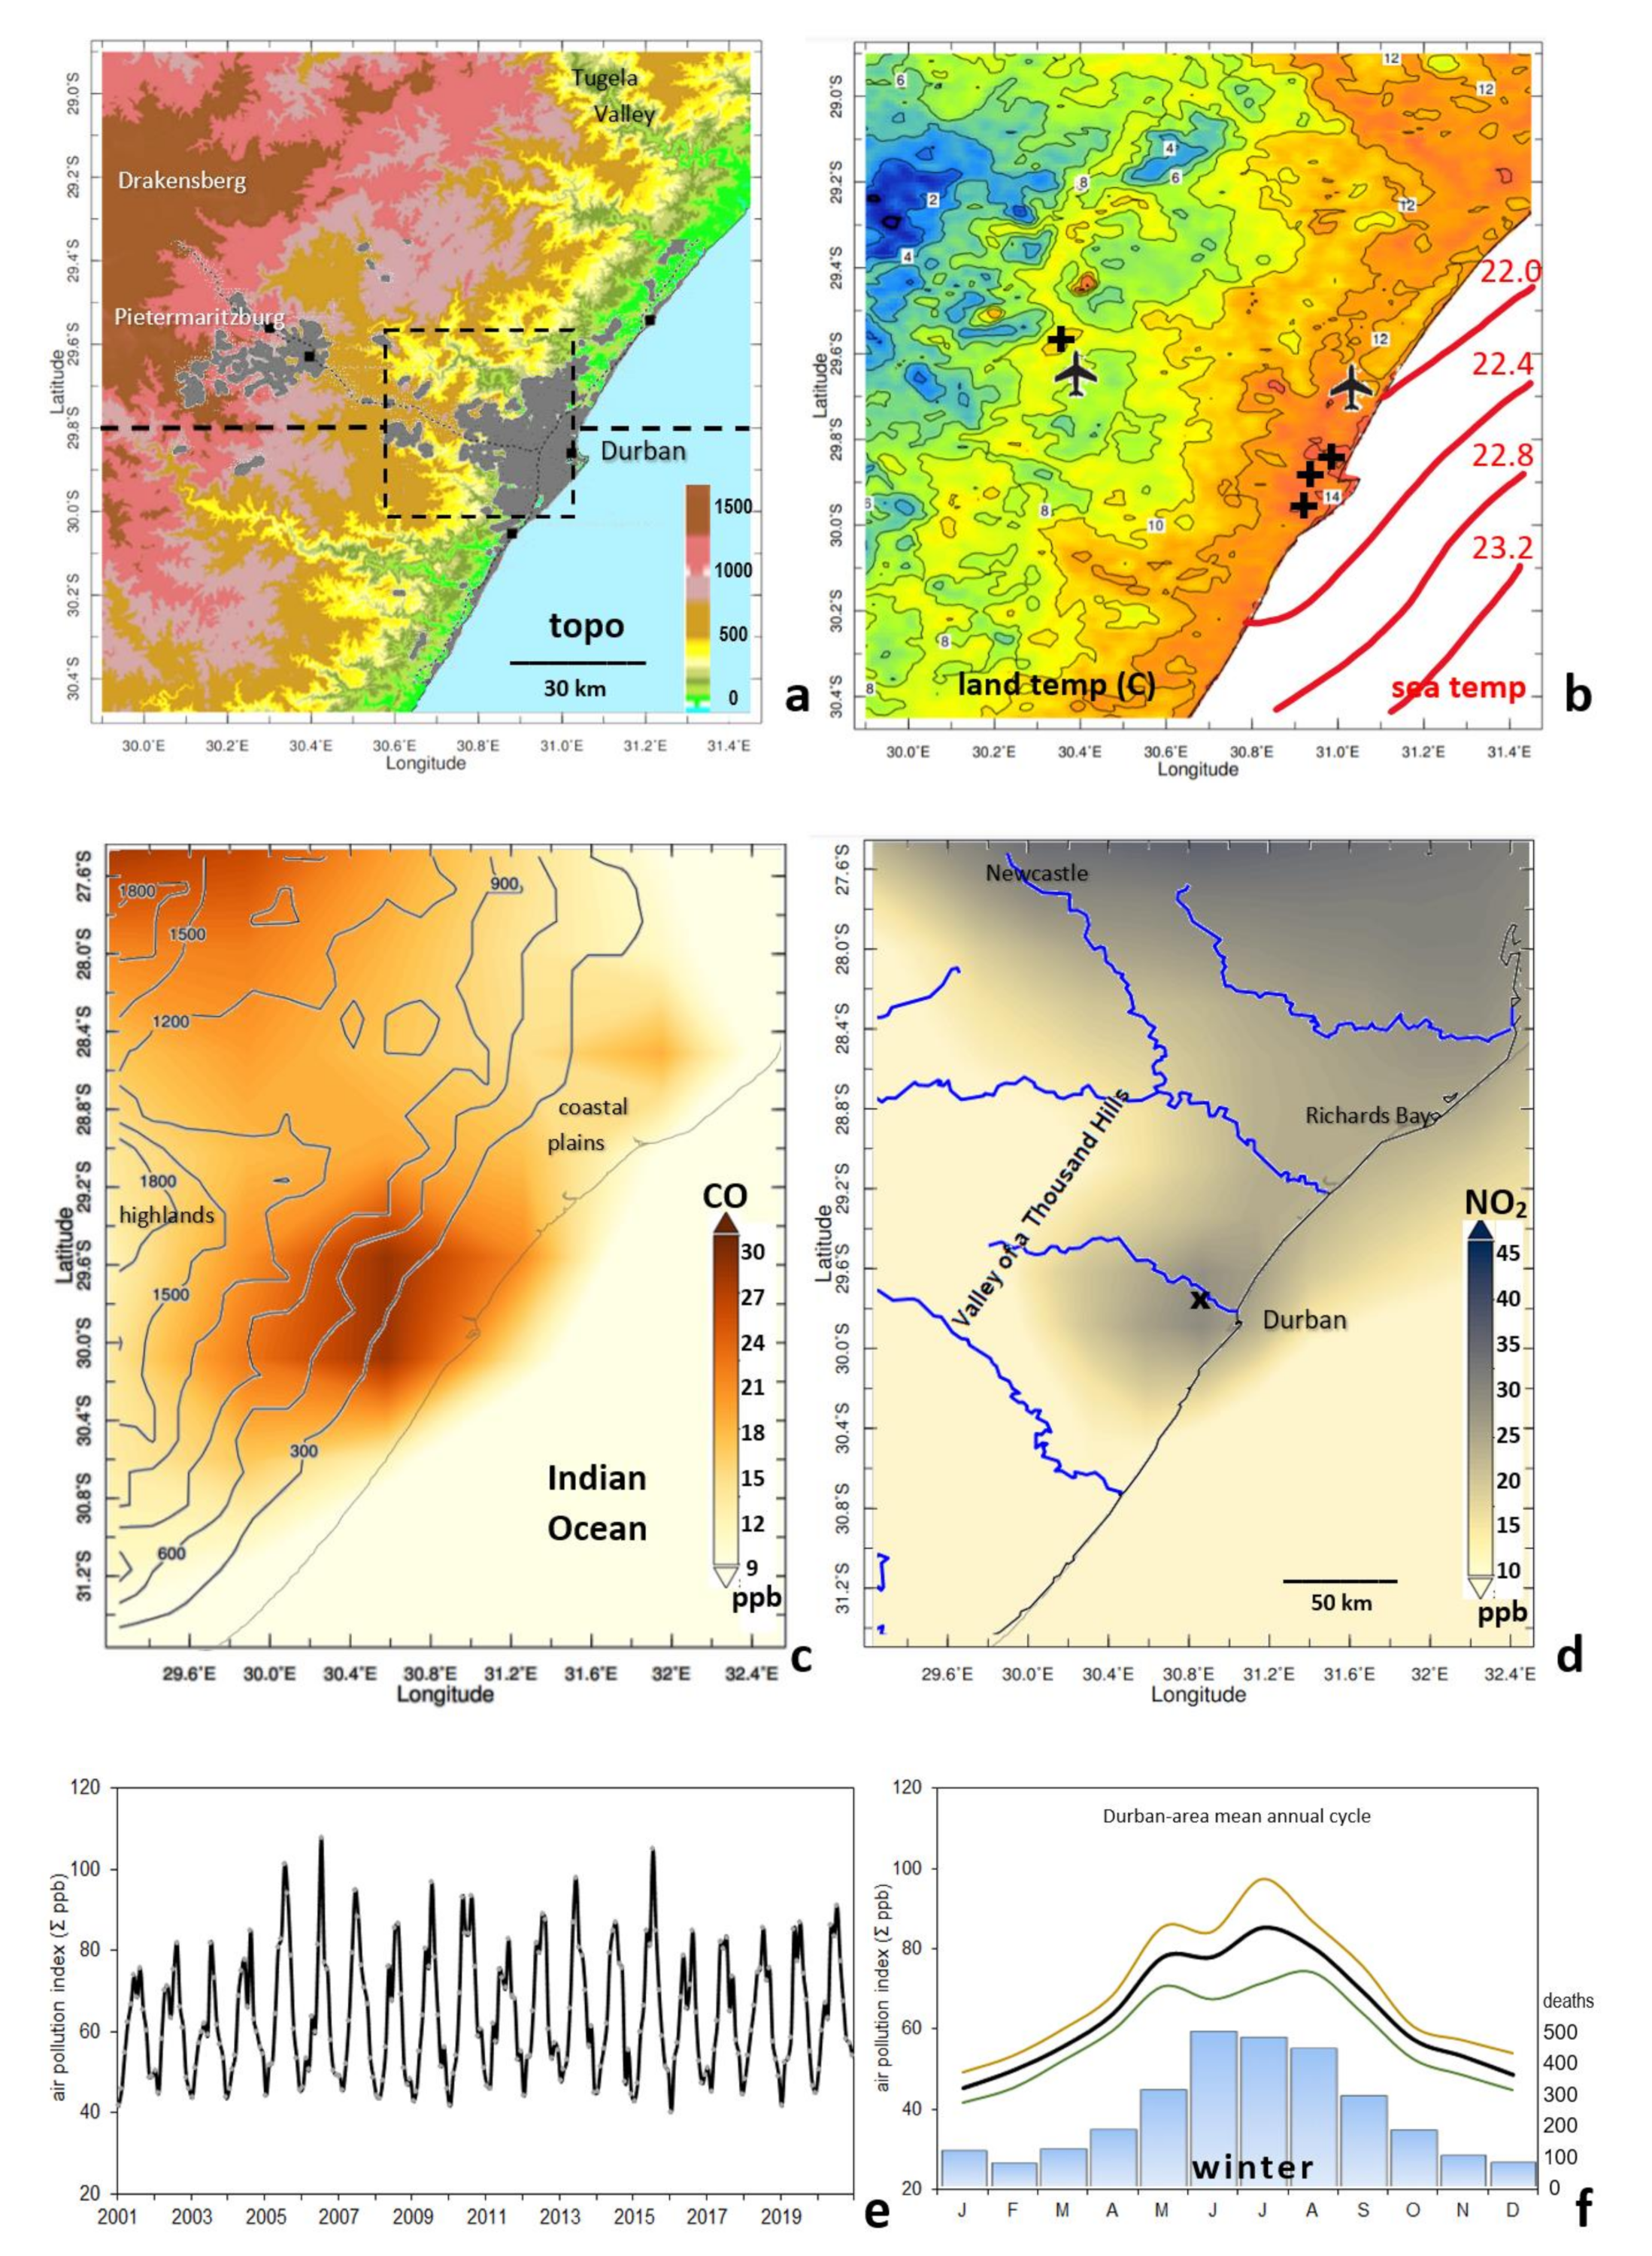
3.1. Geography and Climate
3.2. Coastal Gradients
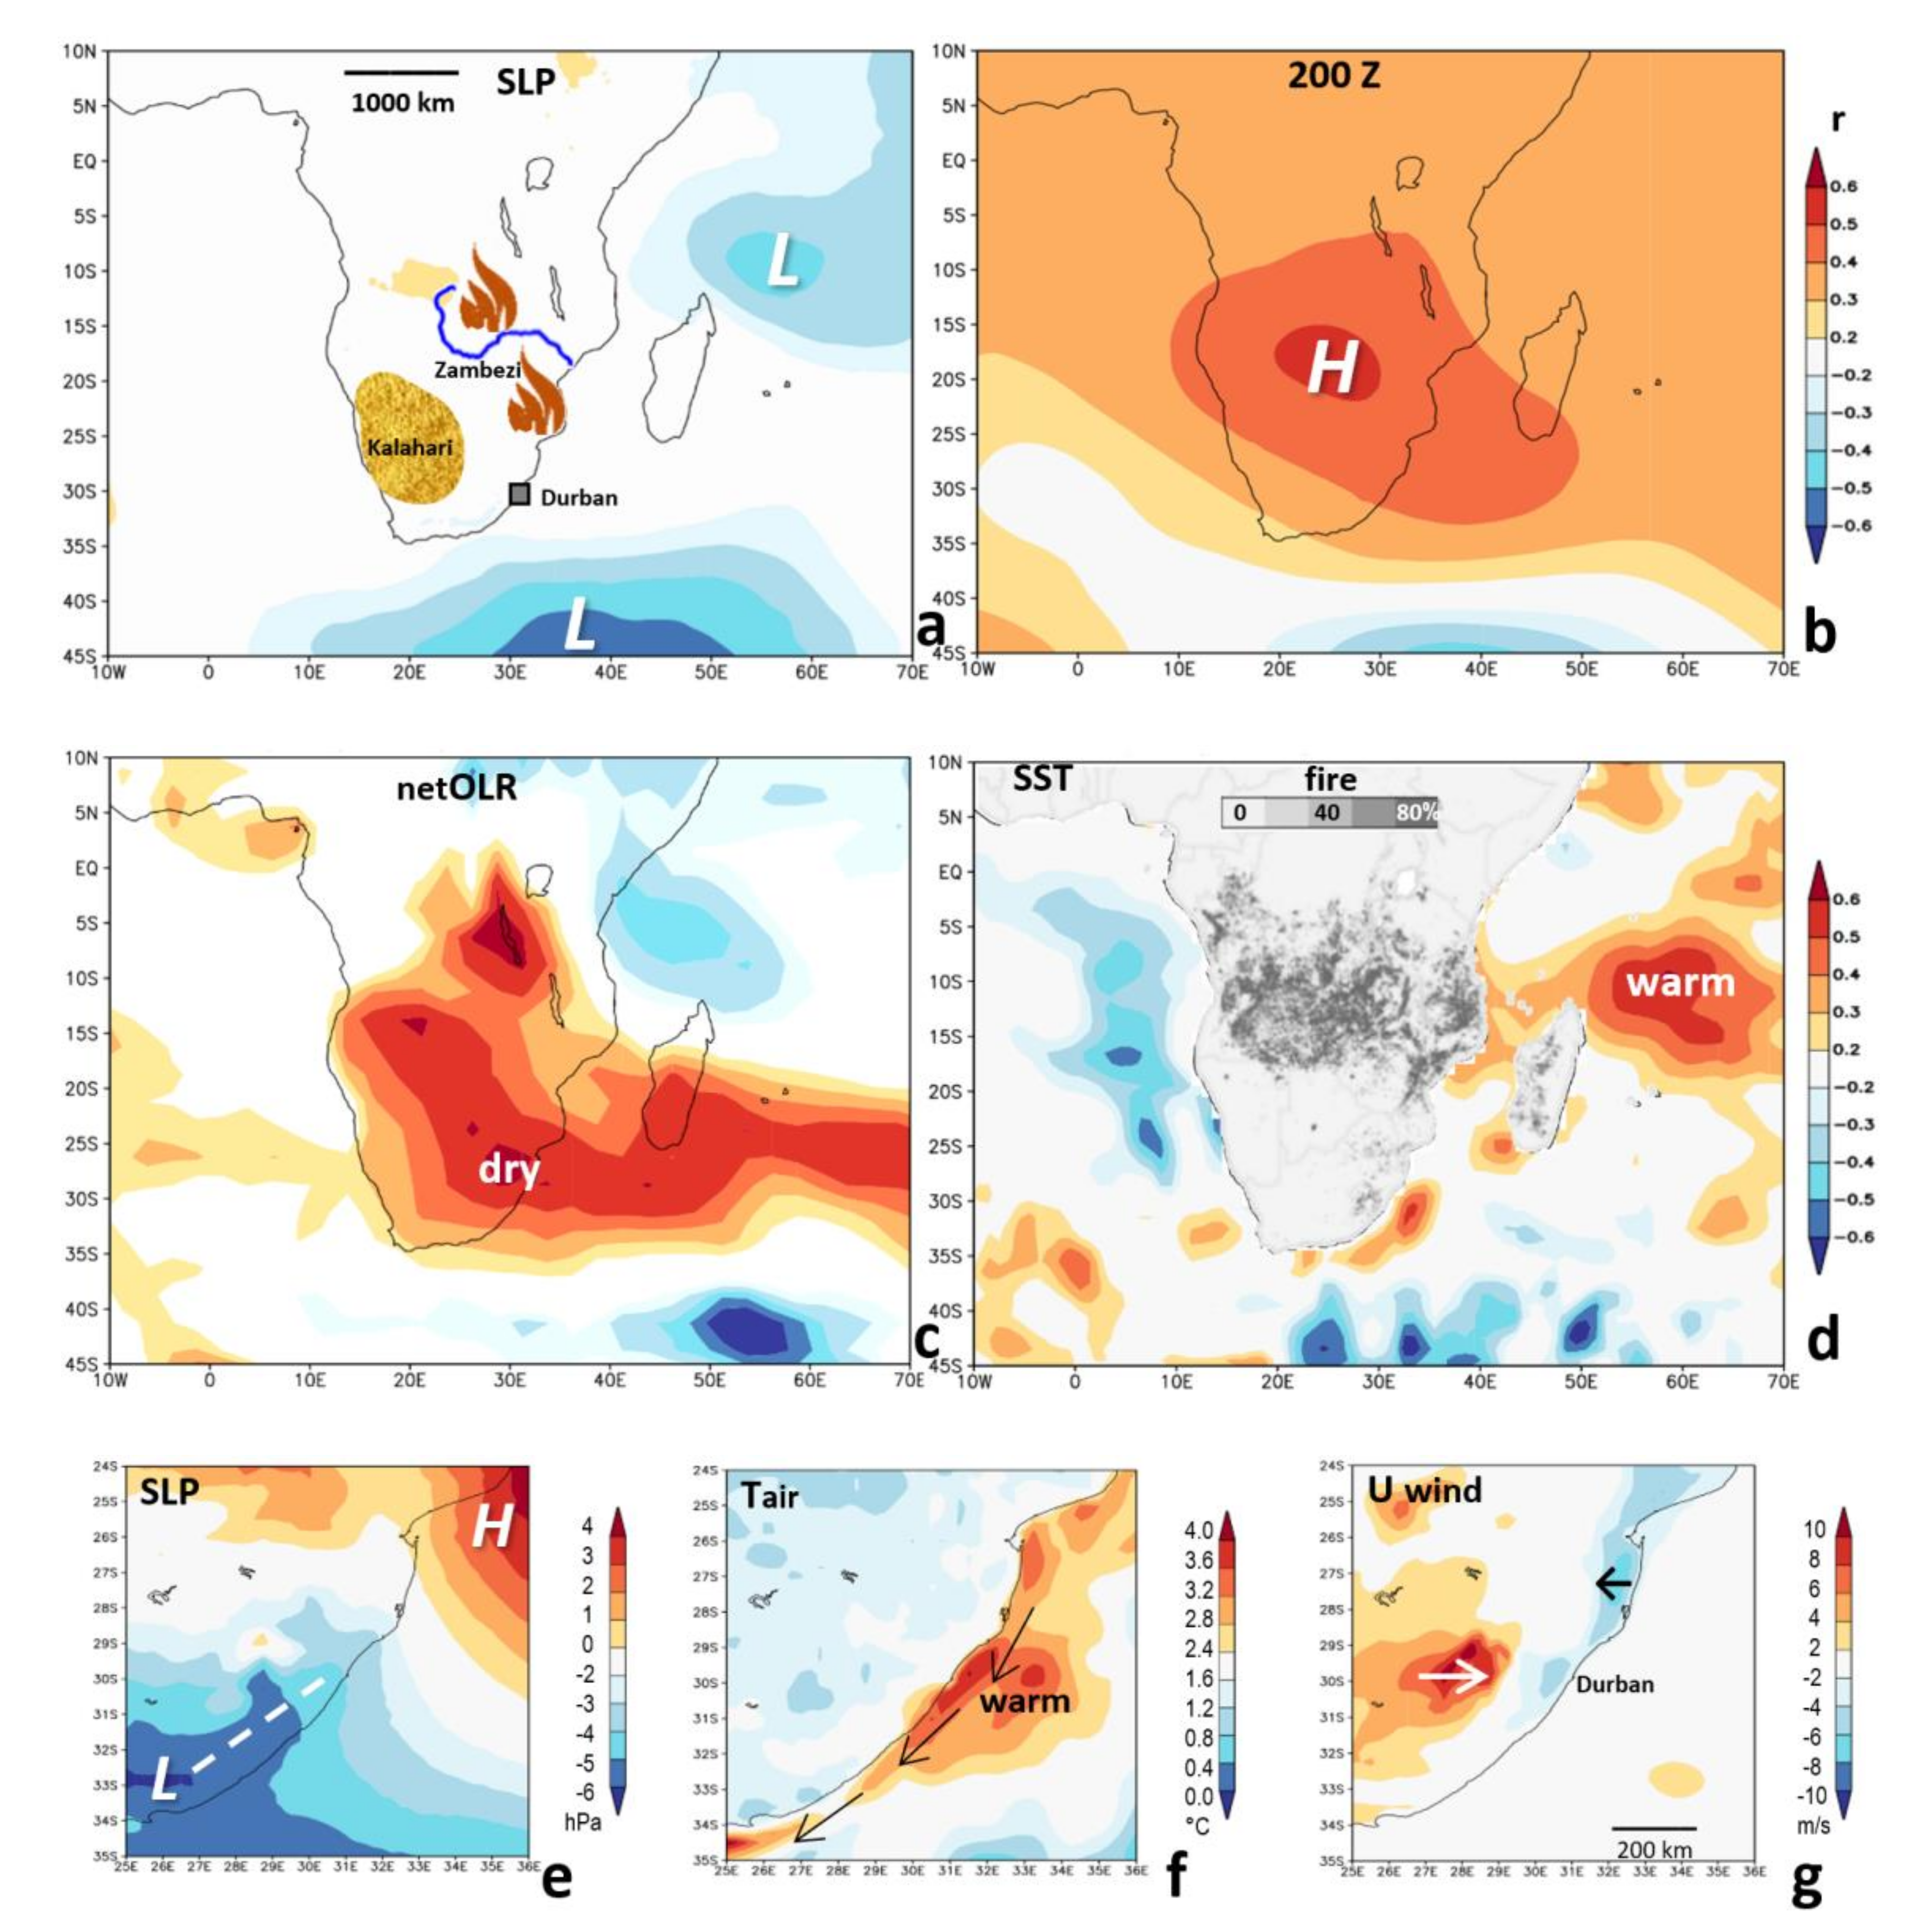
3.3. Inter-Annual Regression Patterns
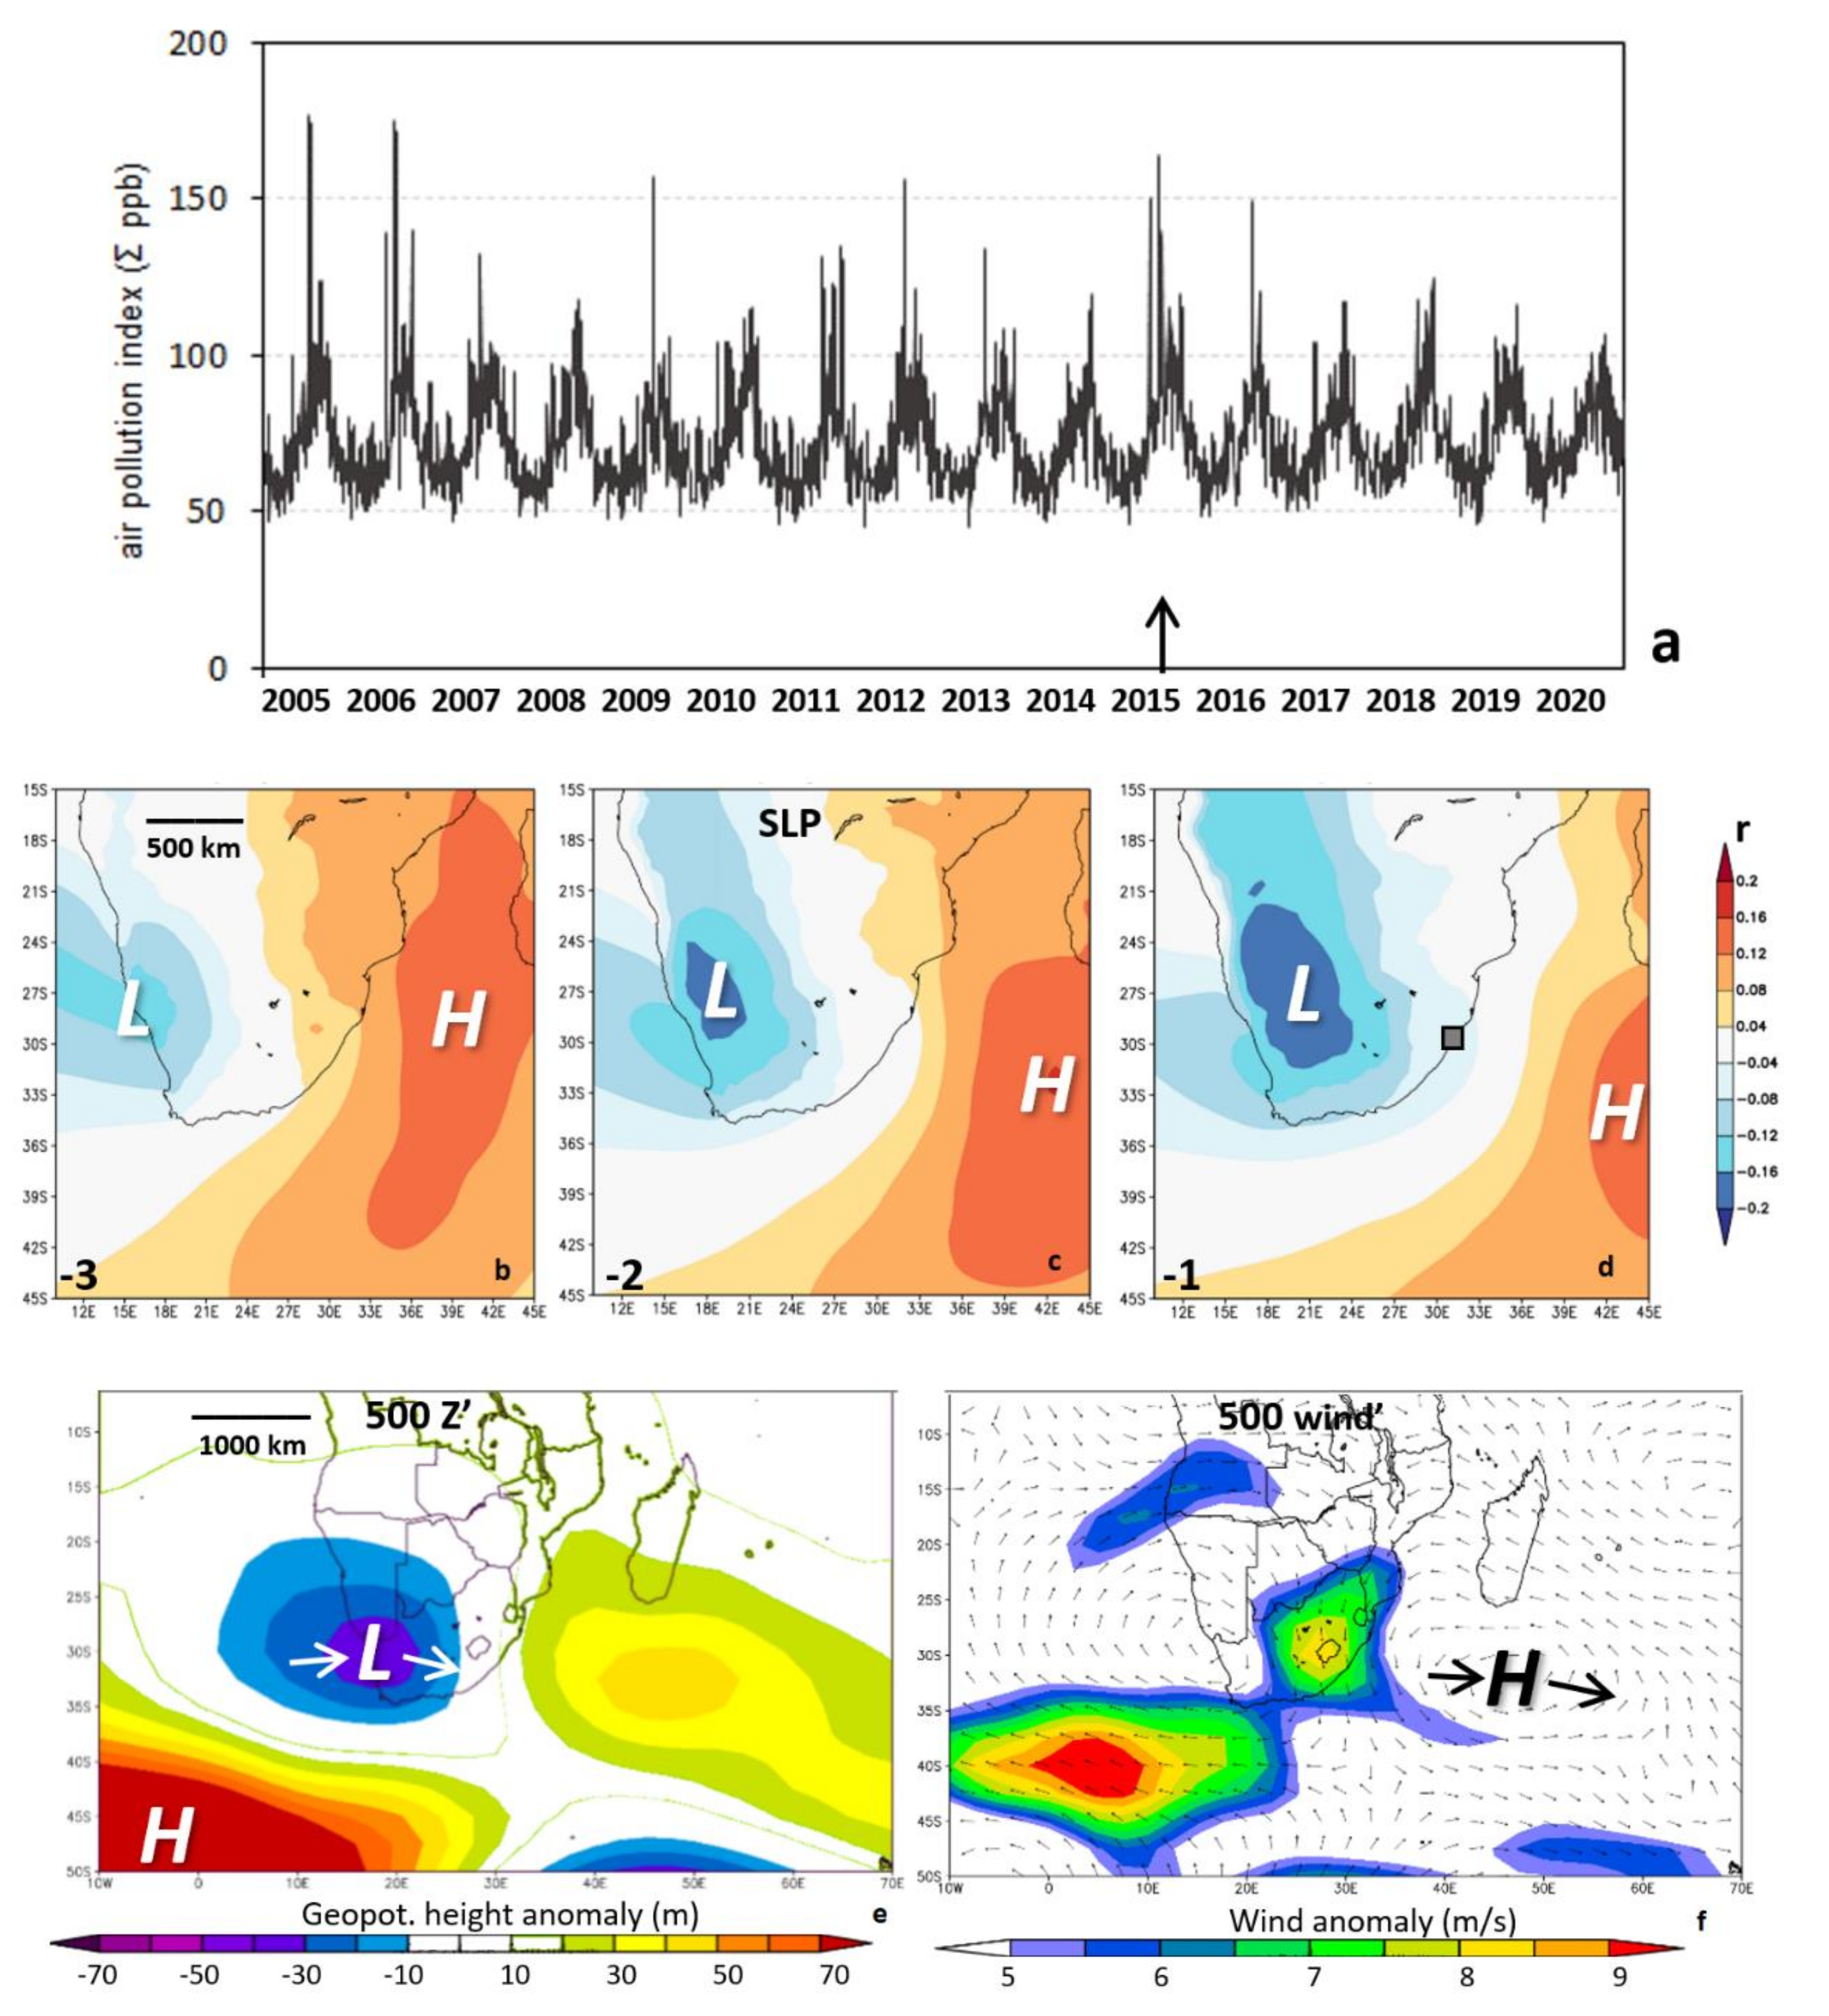
3.4. Daily Statistics and Weather Patterns
3.5. Diurnal Cycle during Winter
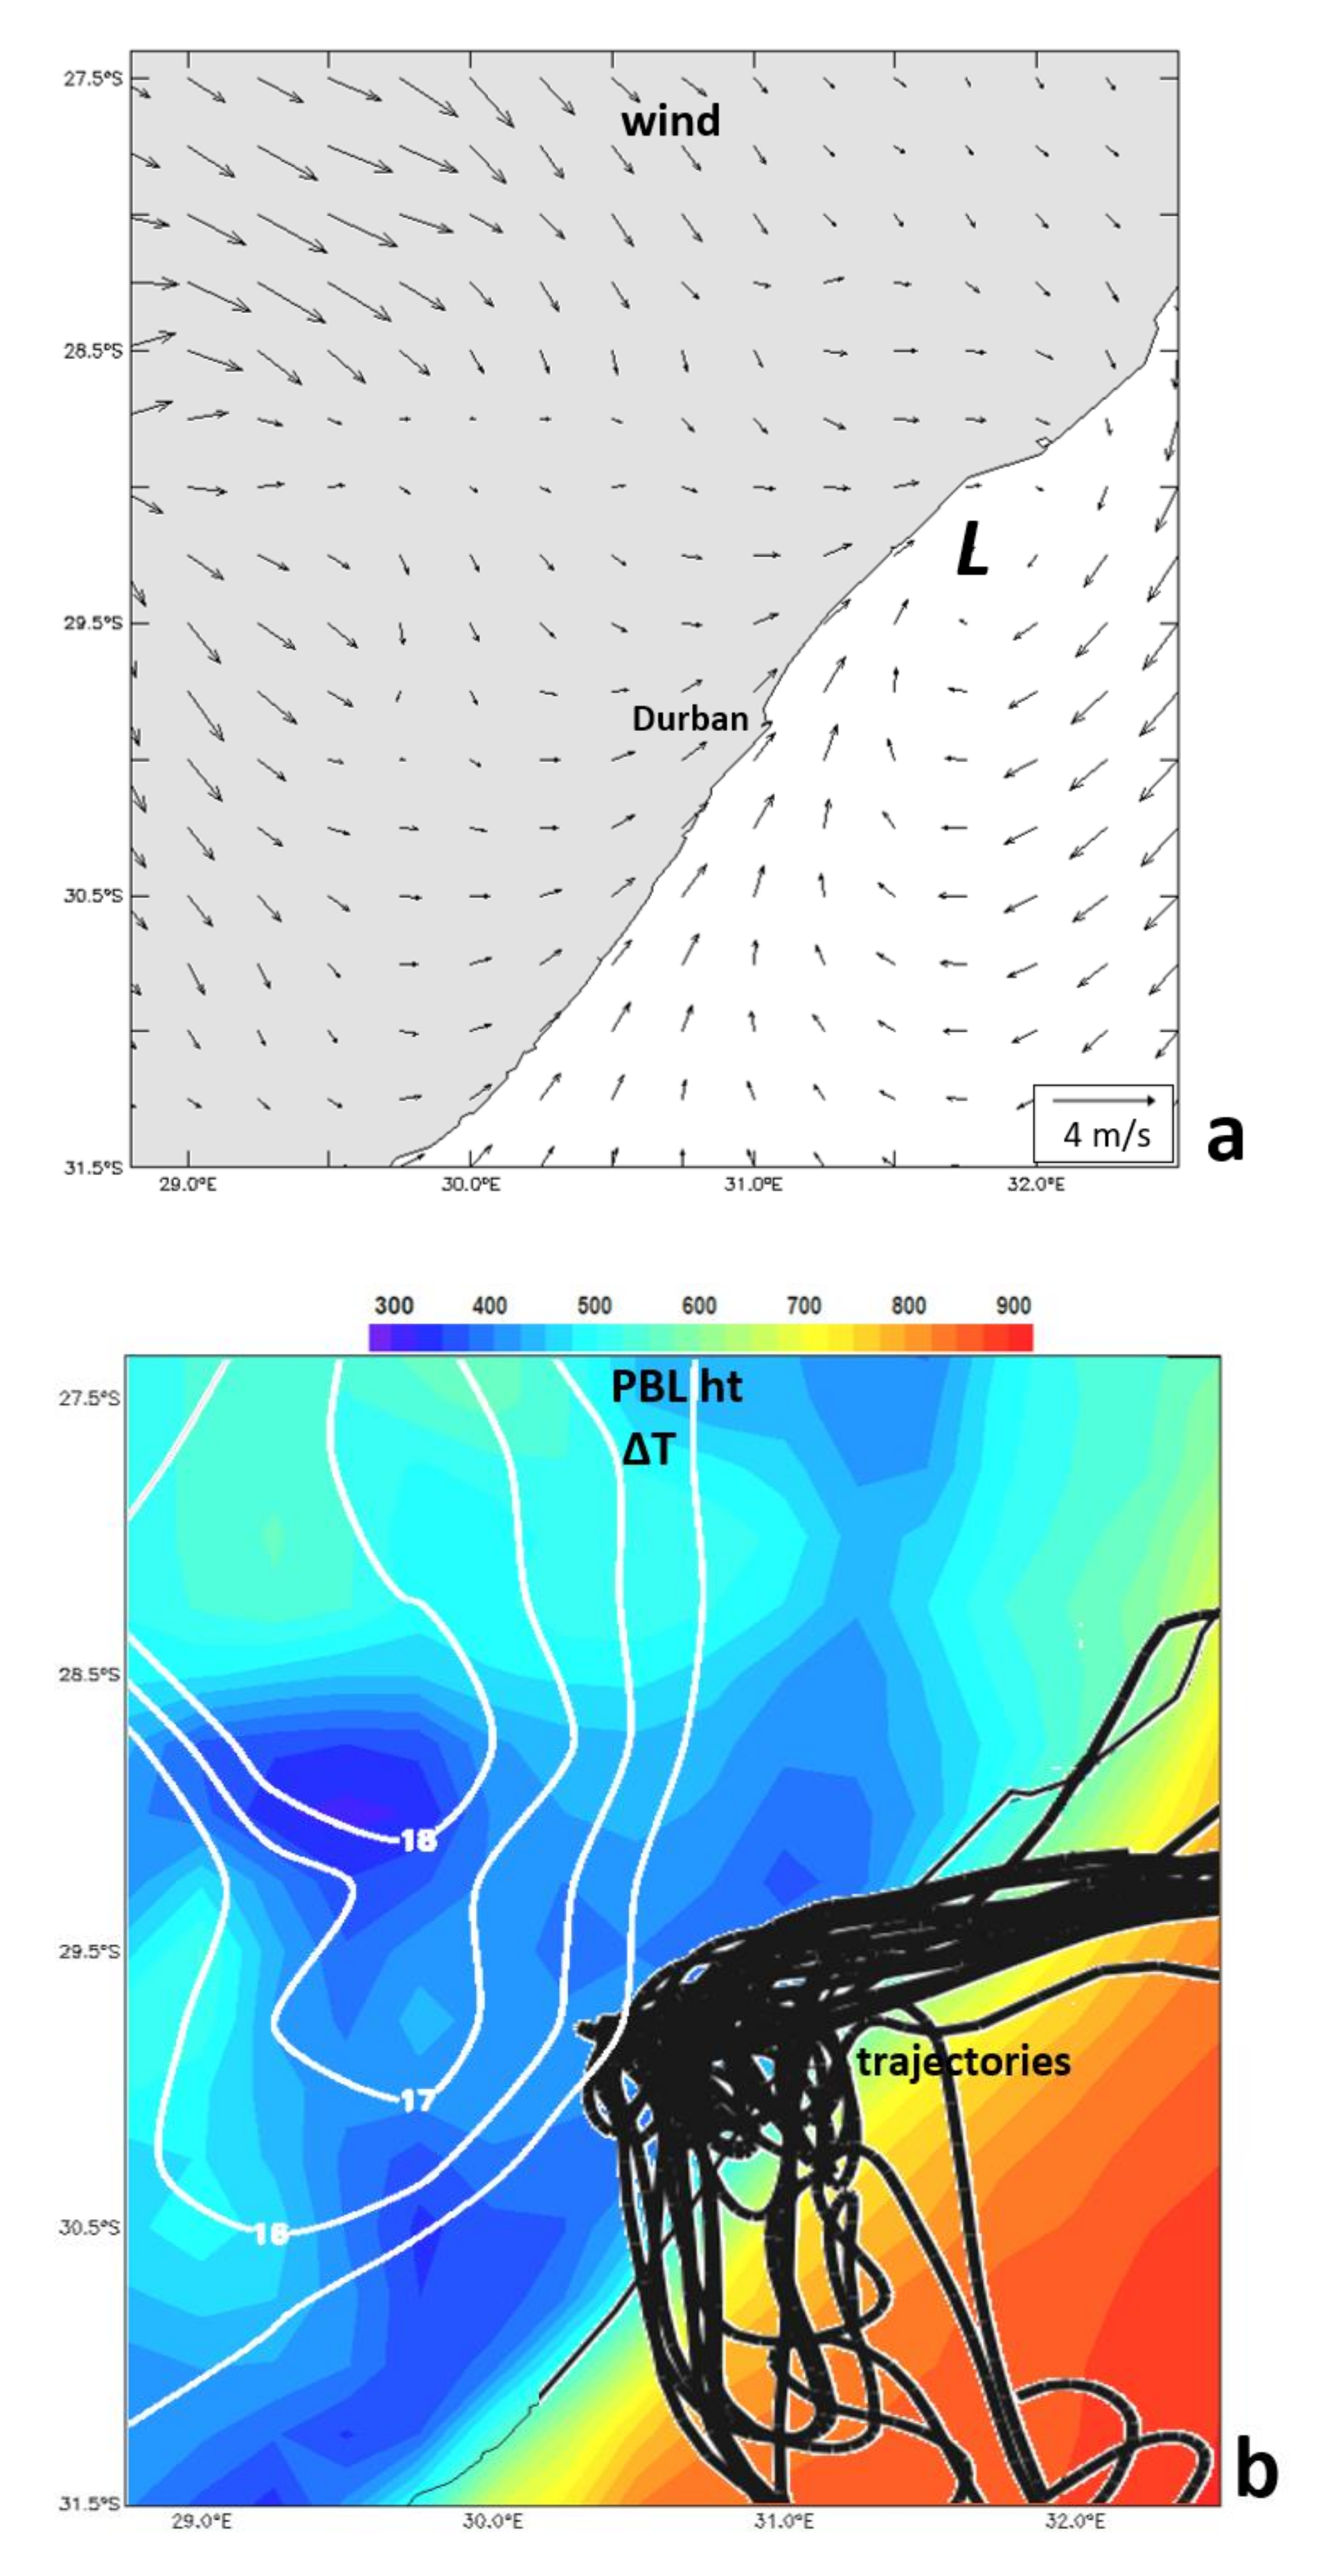
3.6. Dispersion in Winter
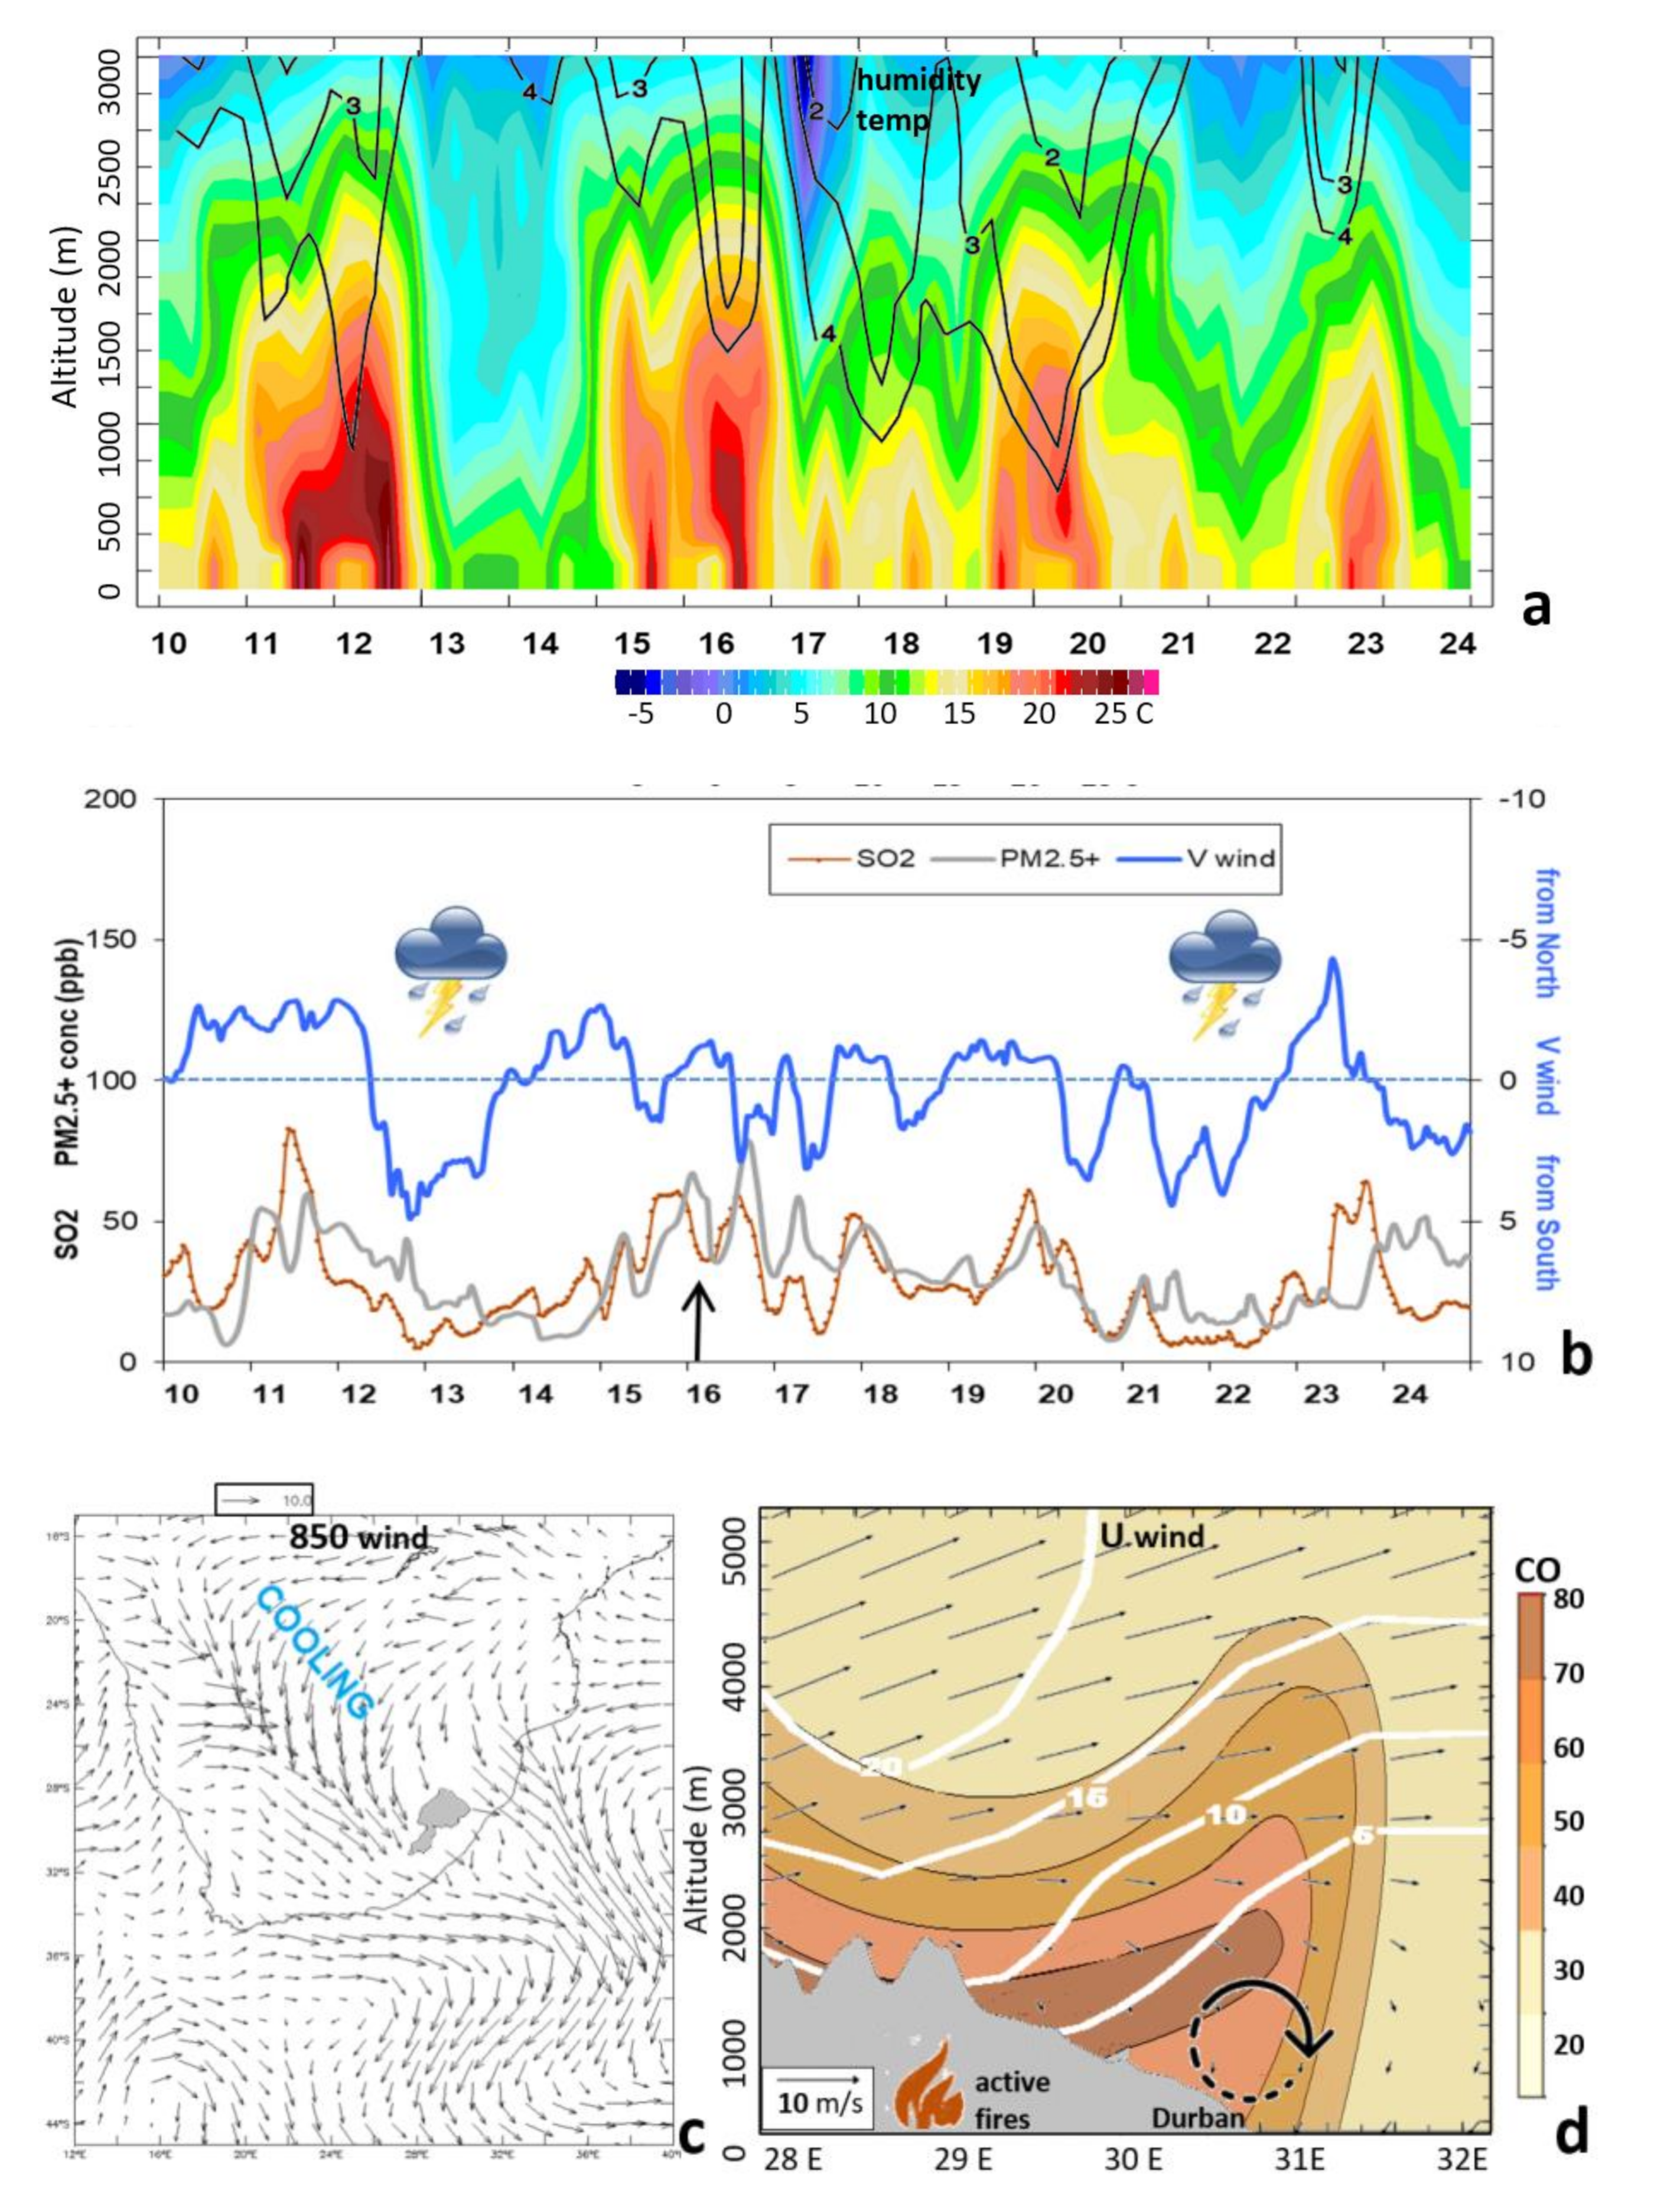
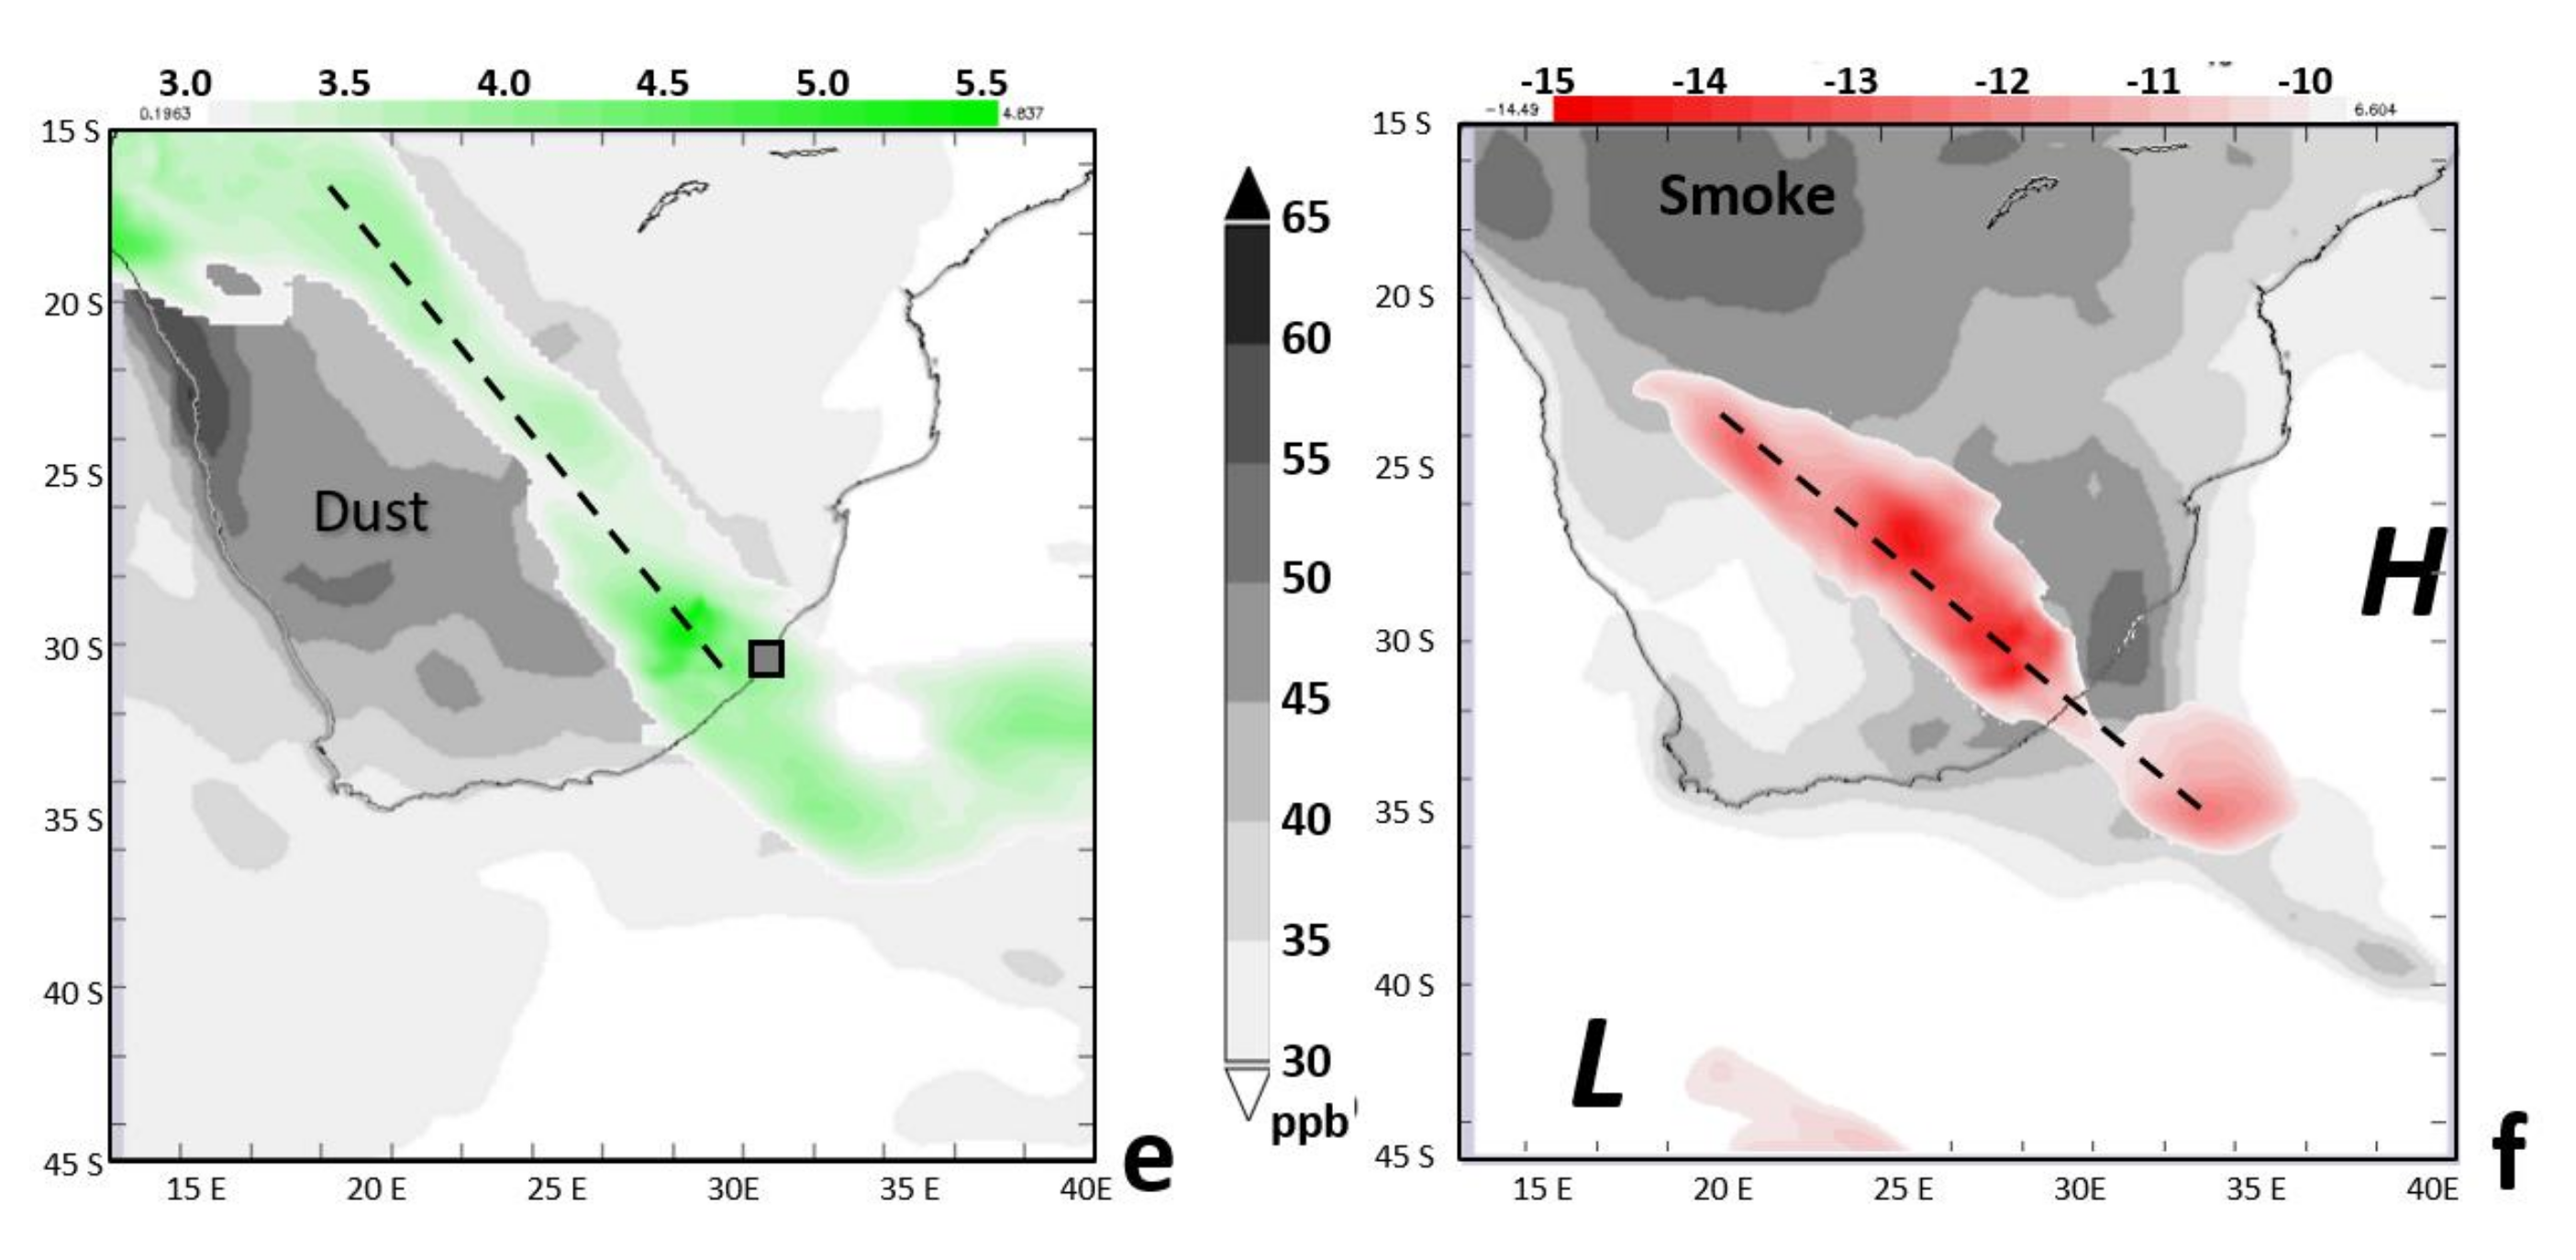
3.7. Air Pollution Episode 10–24 July 2015
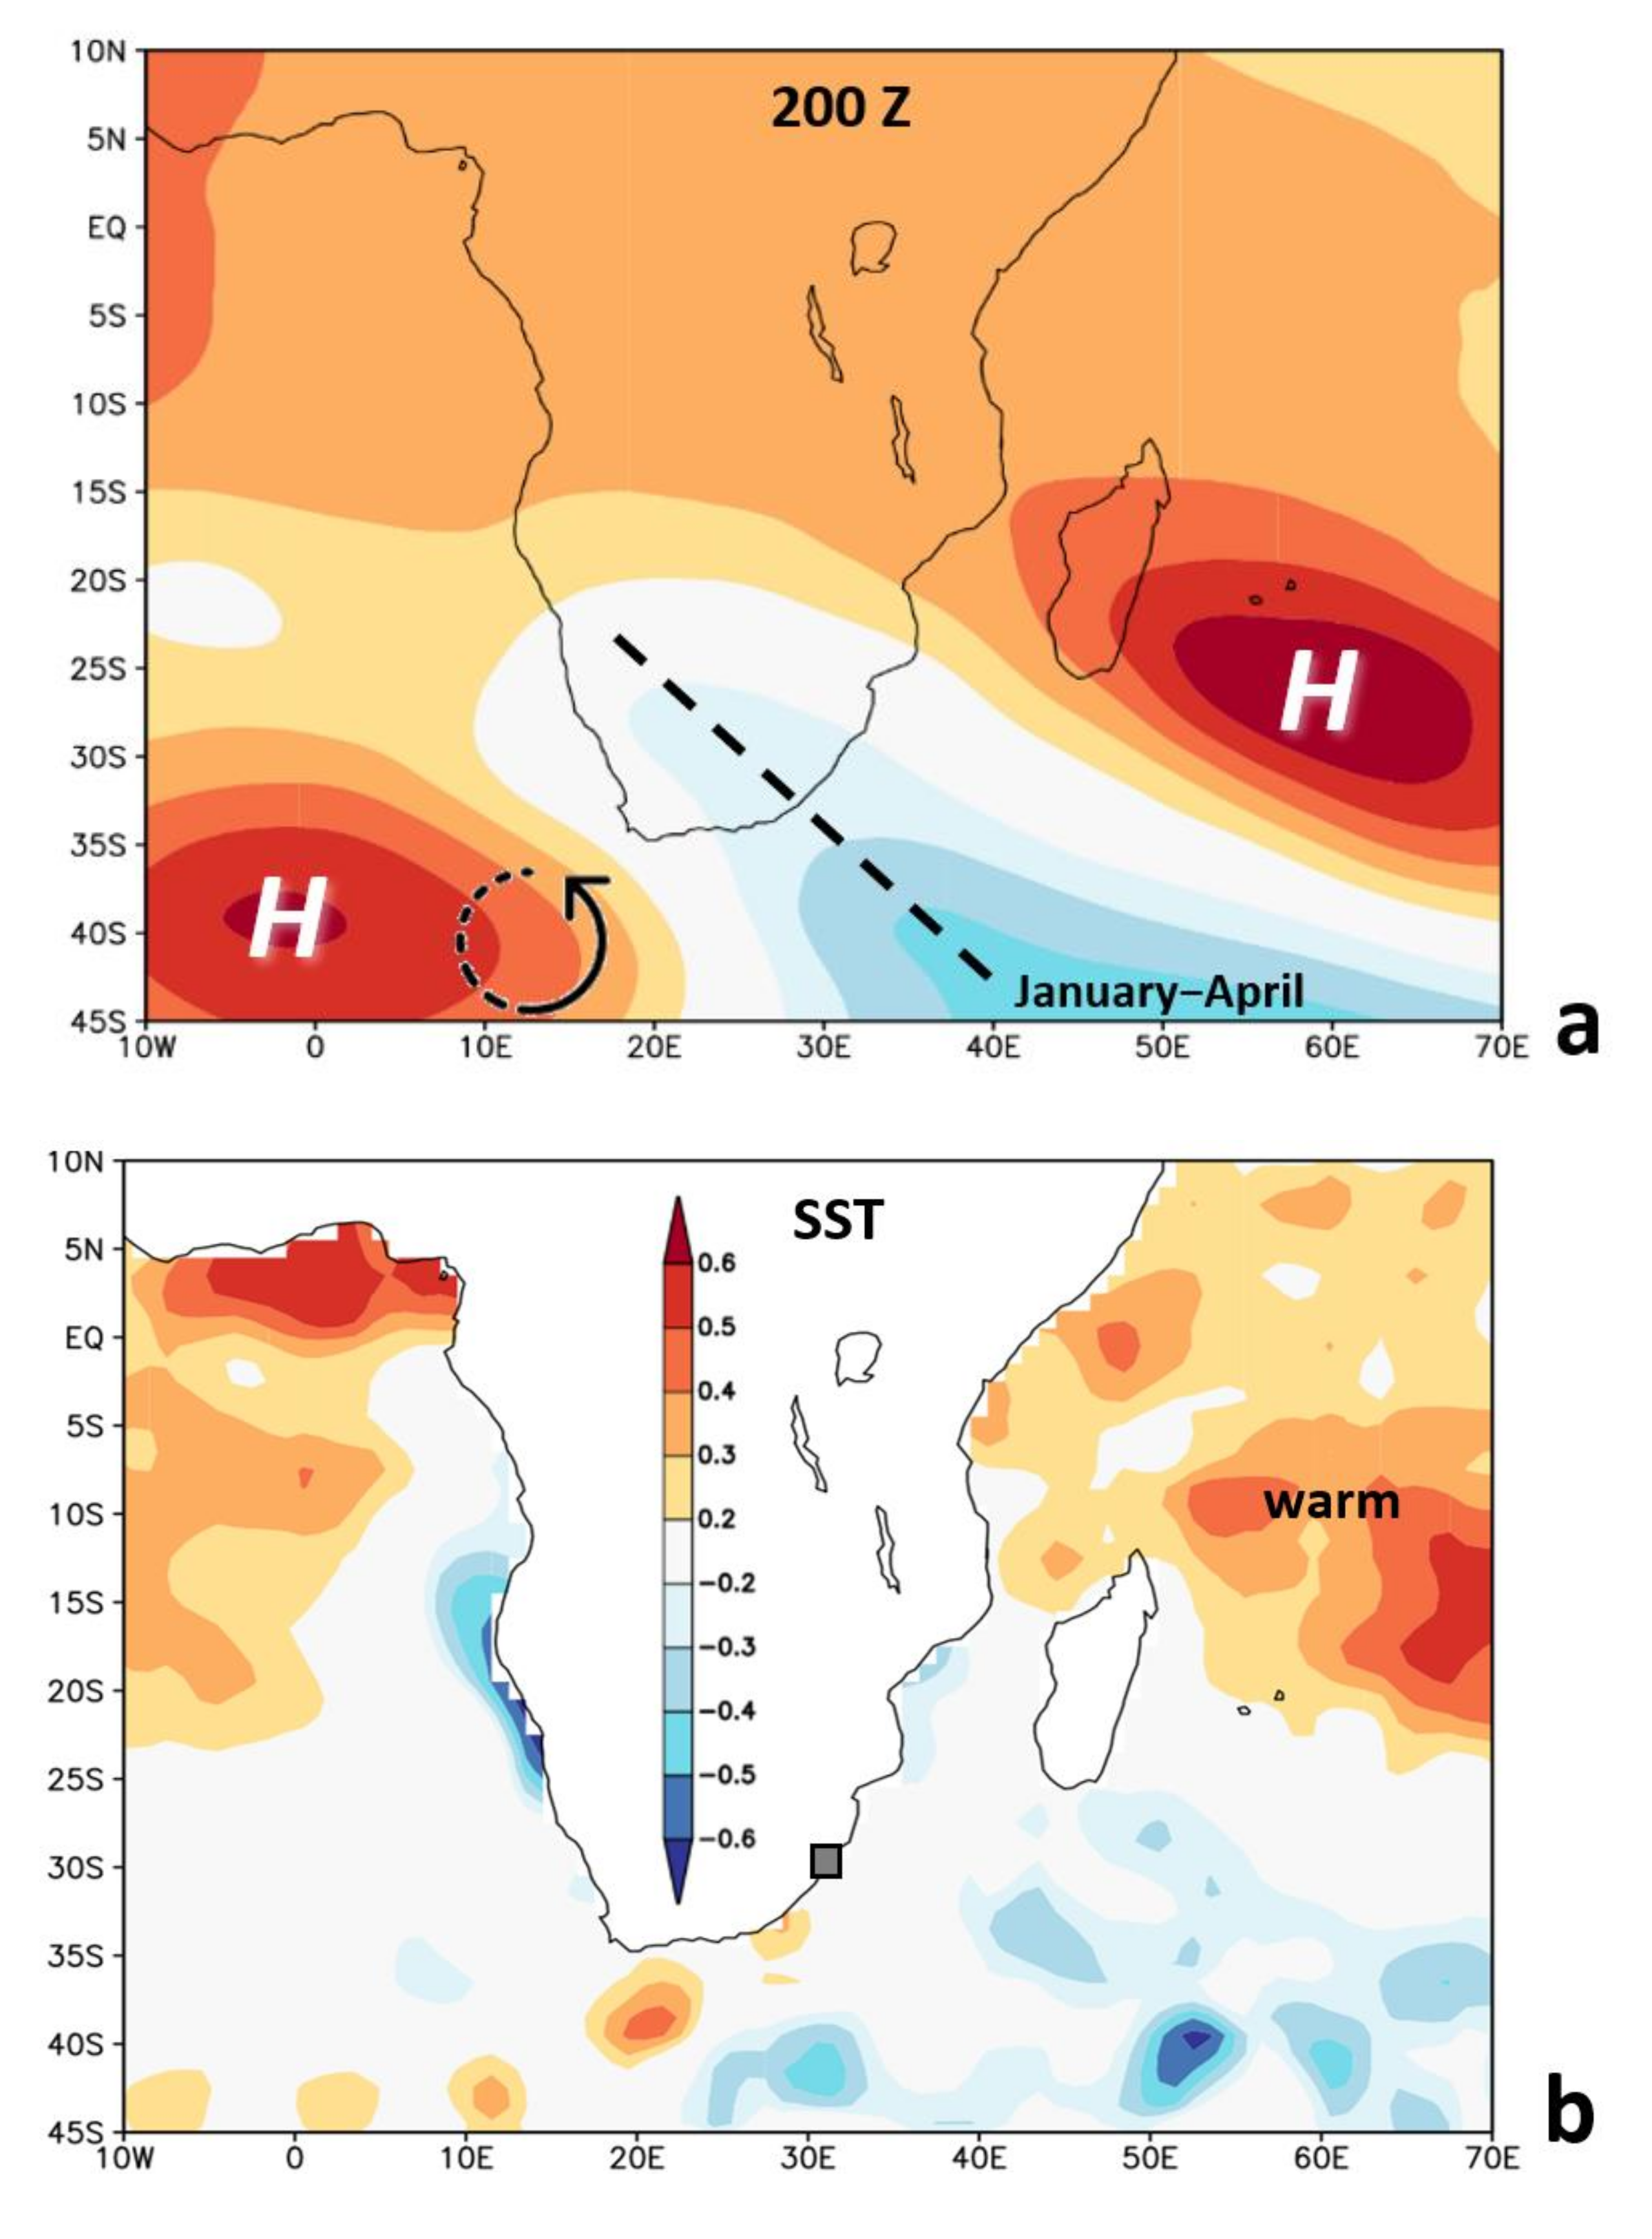
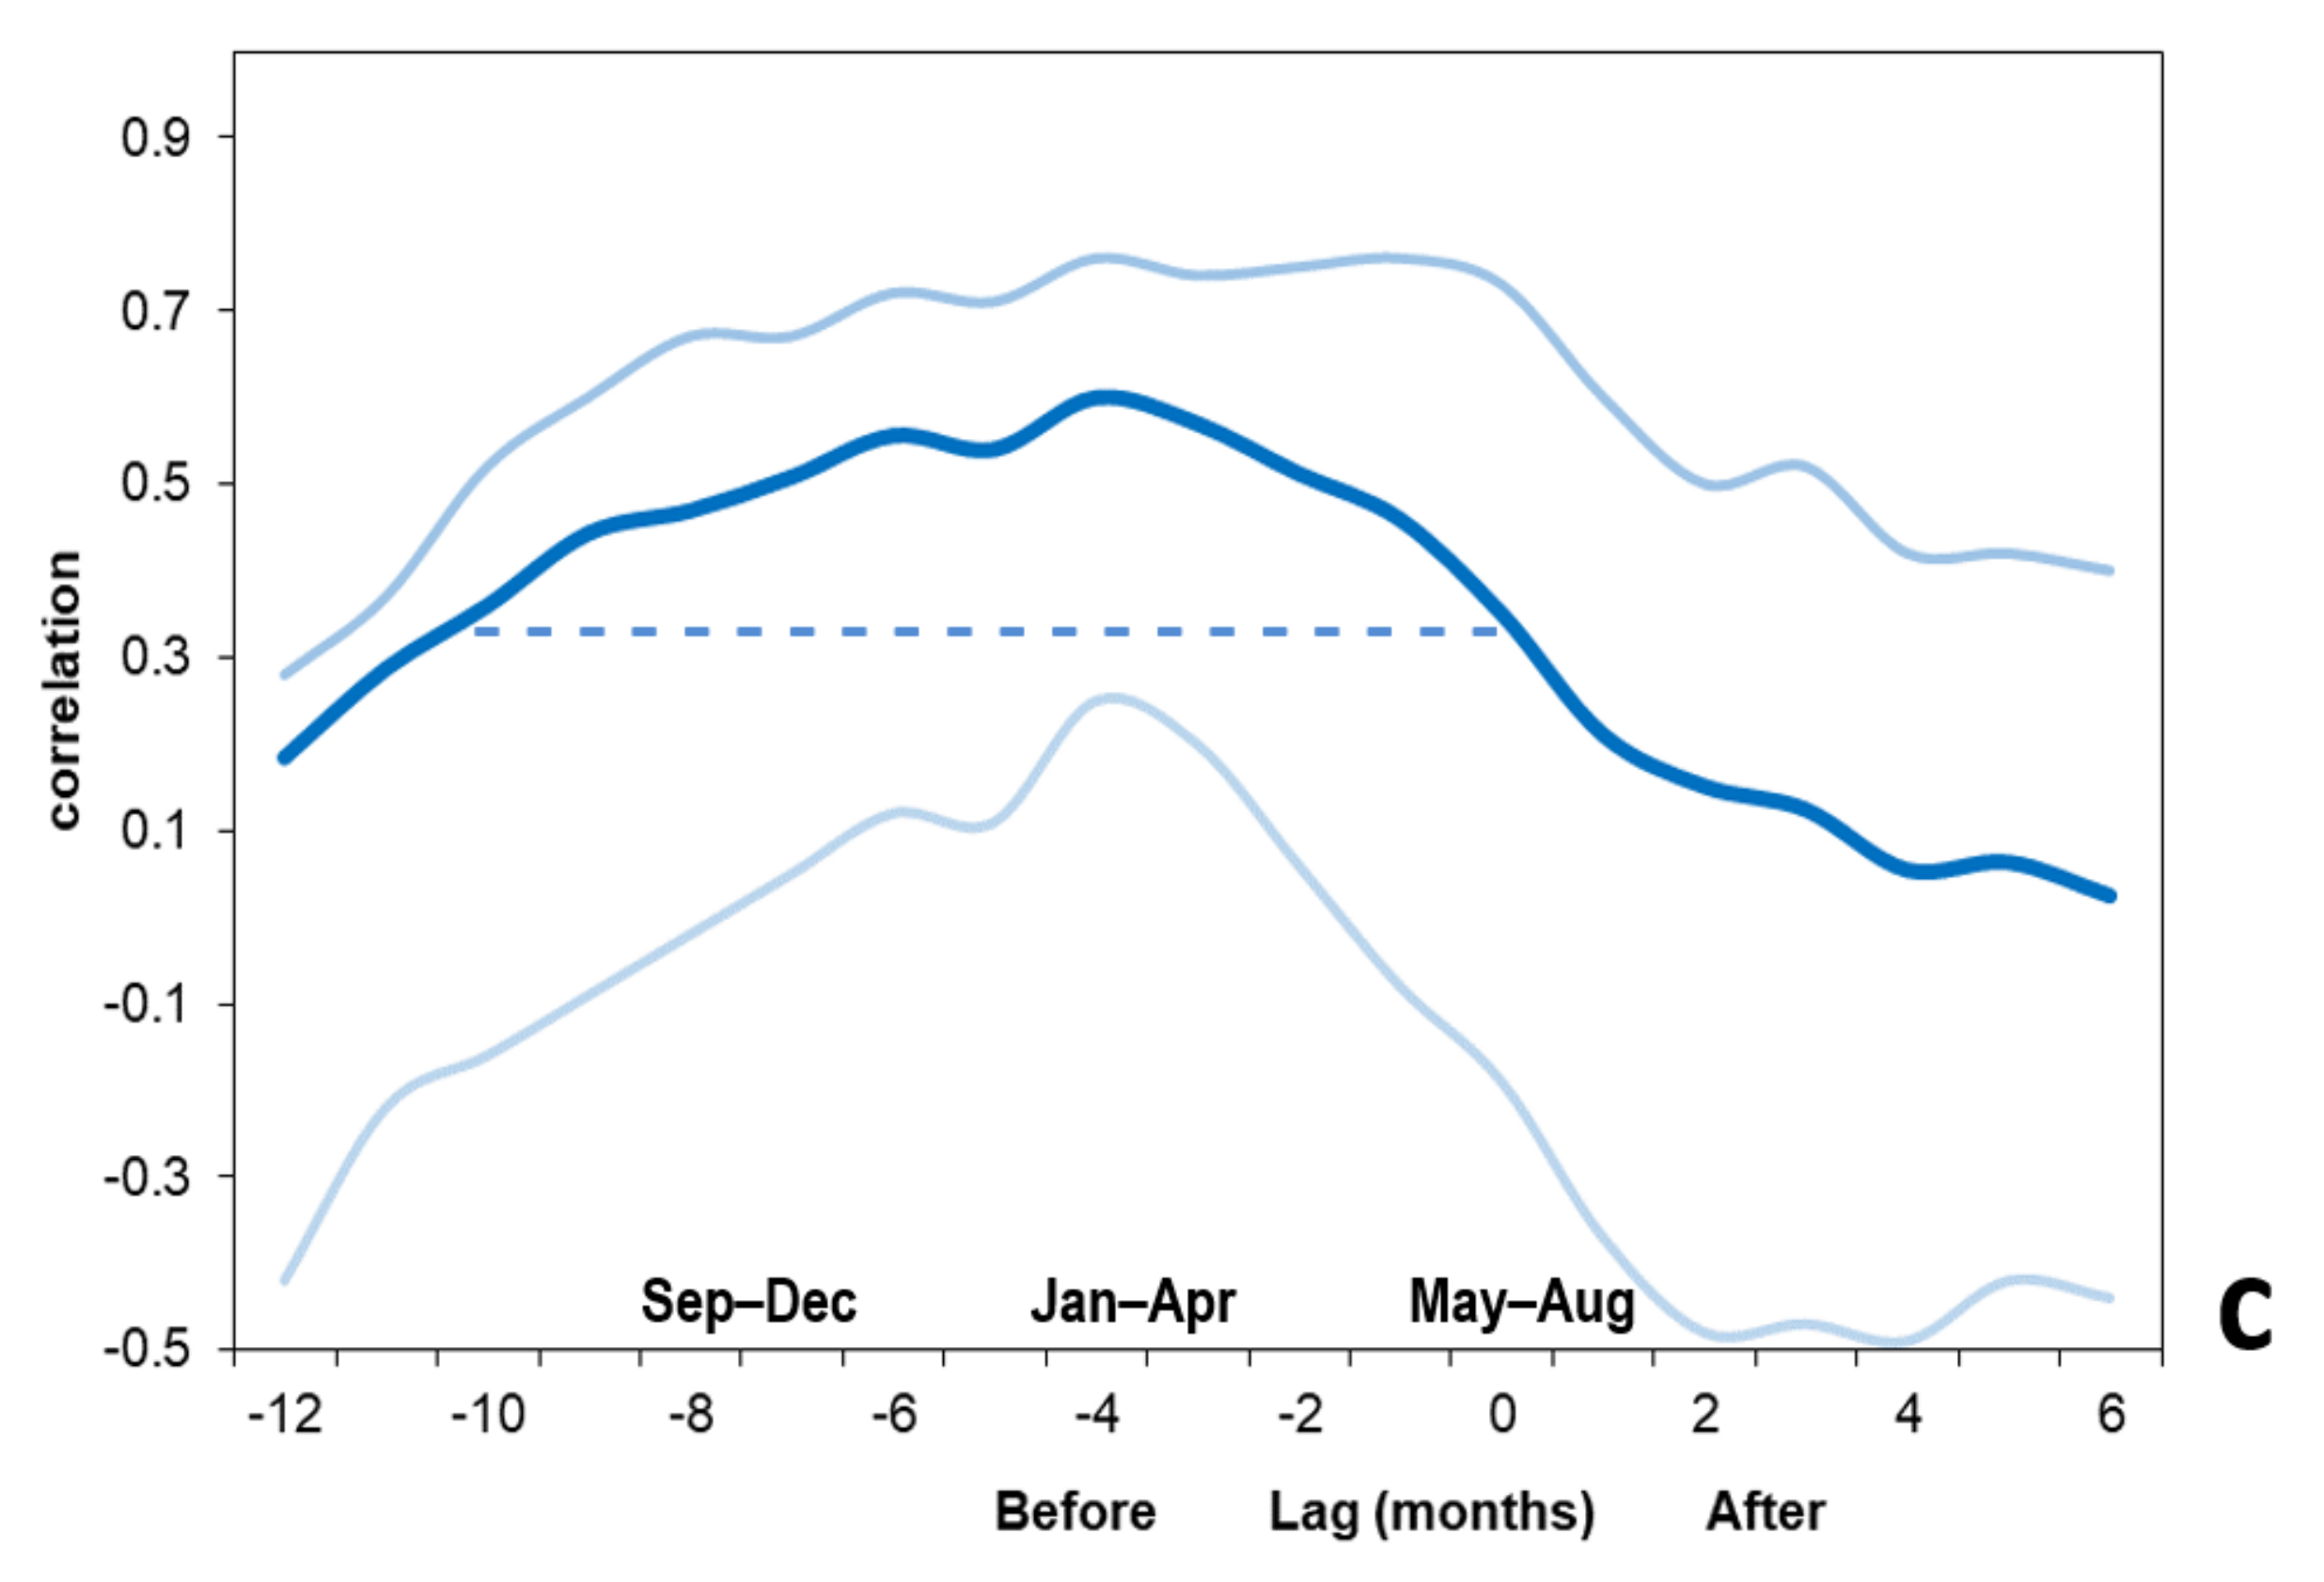
3.8. Predictive Potential
4. Discussion
Supplementary Materials
 > on map (N = 360).
Author Contributions
Funding
Informed Consent Statement
Data Availability Statement
Acknowledgments
Conflicts of Interest
References
- Akimoto, H. Global Air Quality and Pollution. Science 2003, 302, 1716–1719. [Google Scholar] [CrossRef] [PubMed] [Green Version]
- Scorgie, Y. Urban Air Quality Management and Planning in South Africa. Ph.D. Thesis, University of Johannesburg, Johannesburg, South Africa, 2012; p. 333. [Google Scholar]
- Jury, M.R. Statistics and Meteorology of Air Pollution Episodes over the South African Highveld Based on Satellite–Model Datasets. J. Appl. Meteorol. Clim. 2017, 56, 1583–1594. [Google Scholar] [CrossRef]
- Tularam, H.; Ramsay, L.F.; Muttoo, S.; Brunekreef, B.; Meliefste, K.; De Hoogh, K.; Naidoo, R.N. A hybrid air pollution/land use regression model for predicting air pollution concentrations in Durban, South Africa. Environ. Pollut. 2021, 274, 116513. [Google Scholar] [CrossRef] [PubMed]
- Jury, M.R.; Freiman, T. The climate of tropical southern Africa during the Safari 2000 campaign. S. Afr. J. Sci. 2002, 98, 527–533. [Google Scholar]
- Silva, J.M.N.; Pereira, J.M.C.; Cabral, A.I.; Sá, A.C.L.; Vasconcelos, M.J.P.; Mota, B.; Grégoire, J. An estimate of the area burned in southern Africa during the 2000 dry season using SPOT-VEGETATION satellite data. J. Geophys. Res. Earth Surf. 2003, 108. [Google Scholar] [CrossRef] [Green Version]
- Ma, X.; Bartlett, K.; Harmon, K.; Yu, F. Comparison of AOD between CALIPSO and MODIS: Significant differences over major dust and biomass burning regions. Atmos. Meas. Tech. 2013, 6, 2391–2401. [Google Scholar] [CrossRef] [Green Version]
- Bhattachan, A.; D’Odorico, P.; Baddock, M.; Zobeck, T.M.; Okin, G.; Cassar, N. The Southern Kalahari: A potential new dust source in the Southern Hemisphere? Environ. Res. Lett. 2012, 7, 024001. [Google Scholar] [CrossRef] [Green Version]
- Thambiran, T.; Diab, R. Air pollution and climate change co-benefit opportunities in the road transportation sector in Durban, South Africa. Atmos. Environ. 2011, 45, 2683–2689. [Google Scholar] [CrossRef]
- Friedrich, E.; Gopaul, A.; Stretch, D. Public Transportation and Greenhouse Gas Emissions: A Case Study of the e Thekwini Municipality, South Africa. Curr. Trends Civ. Struct. Eng. 2019, 3. [Google Scholar] [CrossRef]
- Preston-Whyte, R.A.; Diab, R.D. Local weather and air pollution potential: The case of Durban. Environ. Conserv. 1980, 7, 241–244. [Google Scholar] [CrossRef]
- Preston-Whyte, R.A.; Tyson, P.D. Atmosphere and Weather of Southern Africa; Oxford University Press: Oxford, UK, 1988; p. 374. [Google Scholar]
- Diab, R.D.; Scott, D. Urban Air Pollution and Quality of Life: Case Study of Durban South Africa. In Proceedings of the 19th Annual Meeting of the International Association for Impact Assessment, Glasgow, UK, 15–19 June 1999. [Google Scholar]
- Matooane, L.; Diab, R.D. Air pollution carrying capacity in the South Durban Industrial Basin. S. Afr. J. Sci. 2001, 97, 450–453. [Google Scholar]
- Diab, R.; Matooane, M. Health risk assessment for sulphur dioxide pollution in south Durban South Africa. Arch. Environ. Health 2003, 58, 763–770. [Google Scholar]
- Ramsay, L.F. Power and Perception : A Political Ecology of Air Pollution in [Durban] South Africa. Ph.D. Thesis, University of Cambridge, Cambridge, UK, 2010; p. 373. [Google Scholar]
- Diab, R.D.; Prause, A.; Bencherif, H. Analysis of SO2 pollution in the south Durban industrial basin. S. Afr. J. Sci. 2002, 98, 543–546. [Google Scholar]
- Simpson, A.J.; McGee, O.S. Air pollution over Pietermaritzburg during the passage of cold fronts. S. Afr. J. Sci. 1996, 92, 45–46. [Google Scholar]
- Simpson, A.J.; McGee, O.S. Analysis of the fumigation effect on pollutants over Pietermaritzburg. S. Afr. Geogr. J. 1996, 78, 41–46. [Google Scholar] [CrossRef]
- Burrows, J.P.; Platt, U.; Borrell, P. (Eds.) The Remote Sensing of Tropospheric Composition from Space; Springer: Berlin, Germany, 2011; p. 536. [Google Scholar]
- Krotkov, N.A.; McLinden, C.A.; Li, C.; Lamsal, L.N.; Celarier, E.A.; Marchenko, S.V.; Swartz, W.H.; Bucsela, E.J.; Joiner, J.; Duncan, B.N.; et al. Aura OMI observations of regional SO2 and NO2 pollution changes from 2005 to 2015. Atmos. Chem. Phys. 2016, 16, 4605–4629. [Google Scholar] [CrossRef] [Green Version]
- Sundström, A.-M.; Nikandrova, A.; Atlaskina, K.; Nieminen, T.; Vakkari, V.; Laakso, L.; Beukes, J.P.; Arola, A.; Van Zyl, P.G.; Josipovic, M.; et al. Characterization of satellite-based proxies for estimating nucleation mode particles over South Africa. Atmos. Chem. Phys. 2015, 15, 4983–4996. [Google Scholar] [CrossRef] [Green Version]
- Korhonen, K.; Giannakaki, E.; Mielonen, T.; Pfüller, A.; Laakso, L.; Vakkari, V.; Baars, H.; Engelmann, R.; Beukes, J.P.; Van Zyl, P.G.; et al. Atmospheric boundary layer top height in South Africa: Measurements with lidar and radiosonde compared to three atmospheric models. Atmos. Chem. Phys. 2014, 14, 4263–4278. [Google Scholar] [CrossRef] [Green Version]
- Ukhov, A.; Mostamandi, S.; Krotkov, N.; Flemming, J.; Da Silva, A.; Li, C.; Fioletov, V.; McLinden, C.; Anisimov, A.; Alshehri, Y.M.; et al. Study of SO2 Pollution in the Middle East Using MERRA-2, CAMS Data Assimilation Products, and High-Resolution WRF-Chem Simulations. J. Geophys. Res. Atmos. 2020, 125, e2019JD031993. [Google Scholar] [CrossRef]
- Molod, A.; Takacs, L.; Suarez, M.; Bacmeister, J. Development of the GEOS-5 atmospheric general circulation model: Evolution from MERRA to MERRA2. Geosci. Model Dev. 2015, 8, 1339–1356. [Google Scholar] [CrossRef] [Green Version]
- GEOS-5 Data Assimilation System. 2016. Available online: http://gmao.gsfc.nasa.gov/pubs/docs/GEOS-5.0.1_Documentation_r3.pdf (accessed on 20 June 2021).
- Wells, R.B.; Lloyd, S.M.; Turner, C.R. National Air Pollution Source Inventory. Air Pollution and its Impacts on the South African Highveld; Held, G., et al., Eds.; Environmental Scientific Association: Pretoria, South Africa, 1996; pp. 3–9. [Google Scholar]
- World Health Organization. WHO Global Ambient Air Pollution Database. 2021. Available online: www.who.int/data/gho/data/themes/air-pollution/who-air-quality-database# (accessed on 20 June 2021).
- World Bank Data. Statistical Database. 2021. Available online: https://data.worldbank.org/indicator/%20EN.ATM.CO2E.KT?%20locations=ZA (accessed on 20 June 2021).
- Josipovic, M.; Annegarn, H.J.; Kneen, M.A.; Pienaar, J.J.; Piketh, S.J. Atmospheric dry and wet deposition of sulphur and nitrogen species and assessment of critical loads of acidic deposition exceedance in South Africa. S. Afr. J. Sci. 2011, 107, 1–10. [Google Scholar] [CrossRef]
- Conradie, E.; Van Zyl, P.; Pienaar, J.; Beukes, J.; Galy-Lacaux, C.; Venter, A.; Mkhatshwa, G. The chemical composition and fluxes of atmospheric wet deposition at four sites in South Africa. Atmos. Environ. 2016, 146, 113–131. [Google Scholar] [CrossRef] [Green Version]
- eThekwini. Greenhouse Gas Emissions Inventory. 2019. Available online: www.durban.gov.za/City_Services/energyoffice (accessed on 20 June 2021).
- Randles, C.A.; Da Silva, A.M.; Buchard, V.; Colarco, P.R.; Darmenov, A.; Govindaraju, R.; Smirnov, A.; Holben, B.; Ferrare, R.; Hair, J.; et al. The MERRA-2 Aerosol Reanalysis, 1980 Onward. Part I: System Description and Data Assimilation Evaluation. J. Clim. 2017, 30, 6823–6850. [Google Scholar] [CrossRef]
- Bucsela, E.J.; Krotkov, N.A.; Celarier, E.A.; Lamsal, L.N.; Swartz, W.H.; Bhartia, P.K.; Boersma, K.F.; Veefkind, J.P.; Gleason, J.F.; Pickering, K.E. A new stratospheric and tropospheric NO2 retrieval algorithm for nadir-viewing satellite instruments, applications to OMI. Atmos. Meas. Tech. 2013, 6, 2607–2626. [Google Scholar] [CrossRef] [Green Version]
- Levy, R.C.; Mattoo, S.; Munchak, L.A.; Remer, L.A.; Sayer, A.M.; Patadia, F.; Hsu, N.C. The Collection 6 MODIS aerosol products over land and ocean. Atmos. Meas. Tech. 2013, 6, 2989–3034. [Google Scholar] [CrossRef] [Green Version]
- Lamsal, L.N.; Krotkov, N.A.; Celarier, E.A.; Swartz, W.H.; Pickering, K.E.; Bucsela, E.J.; Gleason, J.F.; Martin, R.V.; Philip, S.; Irie, H.; et al. Evaluation of OMI operational standard NO2 column retrievals using in situ and surface-based NO2 observations. Atmos. Chem. Phys. 2014, 14, 11587–11609. [Google Scholar] [CrossRef] [Green Version]
- DAQM. Durban Air Constituents. 2021. Available online: http://aqicn.org/city/Durban (accessed on 20 June 2021).
- Saha, S.; Moorthi, S.; Wu, X.; Wang, J.; Nadiga, S.; Tripp, P.; Behringer, D.; Hou, Y.-T.; Chuang, H.-Y.; Iredell, M.; et al. The NCEP Climate Forecast System Version 2. J. Clim. 2014, 27, 2185–2208. [Google Scholar] [CrossRef]
- Hersbach, H.; Bell, B.; Berrisford, P.; Hirahara, S.; Horanyi, A.; Muñoz-Sabater, J.; Nicolas, J.; Peubey, C.; Radu, R.; Schepers, D.; et al. The ERA5 global reanalysis. Q. J. R. Meteorol. Soc. 2020, 146, 1999–2049. [Google Scholar] [CrossRef]
- Gelaro, R.; McCarty, W.; Suárez, M.J.; Todling, R.; Molod, A.; Takacs, L.; Randles, C.A.; Darmenov, A.; Bosilovich, M.G.; Reichle, R.; et al. The modern-era retrospective analysis for research and applications, v2 (MERRA-2). J. Clim. 2017, 30, 5419–5454. [Google Scholar] [CrossRef]
- World Meteorological Organization. WMO Satellite Air Chemistry; World Meteorological Organization: Geneva, Switzerland, 2021. [Google Scholar]
- South Africa Department of Health. Monthly Provincial Respiratory Mortality Data; South Africa Department of Health: Pretoria, South Africa, 2021. [Google Scholar]
- Stein, A.F.; Draxler, R.R.; Rolph, G.D.; Stunder, B.J.B.; Cohen, M.D.; Ngan, F. NOAA HYSPLIT atmospheric transport and dispersion modelling system, Bull. Amer. Meteorol. Soc. 2015, 96, 2059–2077. [Google Scholar] [CrossRef]
- Winker, D.M.; Hunt, W.H.; McGill, M.J. Initial performance assessment of CALIOP. Geophys. Res. Lett. 2007, 34, L19803. [Google Scholar] [CrossRef] [Green Version]
- Shikwambana, L.D.; Sivakumar, V. Investigation of various aerosols over different locations in South Africa using satellite, model simulations and LIDAR. Meteorol. Appl. 2019, 26, 275–287. [Google Scholar] [CrossRef] [Green Version]
- IEM. Iowa Environmental Mesonet, Wind Rose Analysis from Durban Airport. 2021. Available online: http://mesonet.agron.iastate.edu/sites/windrose.phtml?station=FALE&network=ZA__ASOS (accessed on 20 June 2021).
- Piketh, S.J.; Annegarn, H.J.; Tyson, P.D. Lower tropospheric aerosol loadings over South Africa: The relative contribution of aerosol dust, industrial emissions, and biomass burning. J. Geophys. Res. 1999, 104, 1597–1607. [Google Scholar] [CrossRef]
- Hersey, S.P.; Garland, R.M.; Crosbie, E.; Shingler, T.; Sorooshian, A.; Piketh, S.J.; Burger, R. An overview of regional and local characteristics of aerosols in South Africa using satellite, ground, and modeling data. Atmos. Chem. Phys. 2015, 15, 4259–4278. [Google Scholar] [CrossRef] [Green Version]
- Zubkova, M.; Boschetti, L.; Abatzoglou, J.T.; Giglio, L. Changes in Fire Activity in Africa from 2002 to 2016 and Their Potential Drivers. Geophys. Res. Lett. 2019, 46, 7643–7653. [Google Scholar] [CrossRef] [Green Version]
- FIRMS. Fire Information Resource Management System. 2021. Available online: https://firms.modaps.eosdis.nasa.gov/ (accessed on 20 June 2021).
- Scott, G.M.; Diab, R. Forecasting Air Pollution Potential: A Synoptic Climatological Approach. J. Air Waste Manag. Assoc. 2000, 50, 1831–1842. [Google Scholar] [CrossRef]
- GSFC 2021: Satellite Monitored Fires. Available online: https://svs.gsfc.nasa.gov/14108 (accessed on 20 June 2021).
- Jury, M.R.; Whitehall, K. Warming of an elevated layer over Africa. Clim. Chang. 2009, 99, 229–245. [Google Scholar] [CrossRef]
- Zunckel, M.; Robertson, L.; Tyson, P.; Rodhe, H. Modelled transport and deposition of sulphur over Southern Africa. Atmos. Environ. 2000, 34, 2797–2808. [Google Scholar] [CrossRef]
- Yamagata, T.; Behera, S.K.; Luo, J.-J.; Masson, S.; Jury, M.R.; Rao, S.A. Coupled Ocean-Atmosphere Variability in the Tropical Indian Ocean, in Earth Climate: The Ocean-Atmosphere Interaction; Wang, C., Xie, S.P., Carton, J.A., Eds.; American Geophysical Union: Washington, DC, USA, 2003; pp. 189–212. [Google Scholar]
- Jury, M.R.; Huang, B. The Rossby wave as a key mechanism of Indian Ocean climate variability. Deep Sea Res. 2004, 51, 2123–2136. [Google Scholar] [CrossRef]
- Shikwambana, L.D. Lidar and Satellite Observation of Aerosols and Clouds over South Africa. Ph.D. Thesis, University of KwaZulu-Natal, Durban, South Africa, 2017; p. 158. Available online: https://ukzn-dspace.ukzn.ac.za/ (accessed on 20 June 2021).
- Pielke, R.A.; Segal, M. Mesoscale Circulations Forced by Differential Terrain Heating. In Mesoscale Meteorology & Forecasting; Ray, P.S., Ed.; American Meteorological Society: Boston, MA, USA, 1986; pp. 516–548. [Google Scholar]
- Nagura, M.; McPhaden, M.J. Dynamics of zonal current variations associated with the Indian Ocean dipole. J. Geophys. Res. Earth Surf. 2010, 115, C11026. [Google Scholar] [CrossRef]
- Jury, M.R. South Indian Ocean Rossby Waves. Atmosphere-Ocean 2018, 56, 322–331. [Google Scholar] [CrossRef]
- De Wet, A. N3 Freeway on its final approach into Durban, Spaghetti Junction (N3-N2) in foreground 2011. Available online: https://commons.wikimedia.org/wiki/File:DurbanN3-aerial.jpg (accessed on 20 June 2021).




| Acronym | Name | Space, Time Resolution | Quantity |
|---|---|---|---|
| AIRS * | Atmospheric Infrared Sounder | 100 km, twice daily | Near-surface CO concentration |
| CALIPSO | Cloud-Aerosol Lidar & Infrared Pathfinder Satellite Observation | ~1 km on N-S slice, weekly | Particulate density |
| CFSr2 | Coupled Forecast System reanalysis version 2 | ~25 km, hour to month | Near-surface meteorology |
| DAQM | Durban air quality monitoring network | Station, hourly intermittent | Surface PM2.5, SO2 |
| ERA5 | European Community reanalysis version 5 | ~25 km, hour to month | Near-surface meteorology |
| HYSPLIT | Hybrid Single Particle Lagrangian Integrated Trajectory Model | ~10 km, along track | Emission transport & dispersion |
| MERRA2 | NASA Meteorology reanalysis version 2 with GEOS-5 air chemistry | ~50 km, hour to month | Near-surface CO, O3, PM2.5, SO2, meteorology |
| MODIS * | Moderate Imaging Spectrometer | 100 km, twice daily | Aerosol Optical Depth (AOD) column |
| OMI * | Ozone Monitoring Instrument | 25 km, twice daily | Near-surface NO2 concentration |
| SADH | South Africa Dept of Health | KZN prov. monthly | Diagnosed respiratory mortality |
| SAWS | South African Weather Service | Radiosonde, surface obs. | Air & dew temp, wind velocity, SLP |
| Monthly | AOD s | CO | NO2 s | O3 | PM2.5 | SO2 | API |
|---|---|---|---|---|---|---|---|
| CO | 0.21 | ||||||
| NO2 s | 0.04 | 0.65 | |||||
| O3 | −0.27 | 0.30 | 0.43 | ||||
| PM2.5 | −0.18 | 0.27 | 0.30 | 0.21 | |||
| SO2 | −0.23 | 0.65 | 0.71 | 0.65 | 0.37 | ||
| API | 0.05 | 0.87 | 0.89 | 0.48 | 0.45 | 0.83 | |
| U wind | −0.11 | 0.46 | 0.54 | 0.38 | 0.40 | 0.46 | 0.57 |
| V wind | −0.43 | −0.24 | −0.02 | 0.27 | −0.06 | 0.11 | −0.10 |
| Temp | 0.10 | −0.43 | −0.65 | −0.39 | −0.16 | −0.57 | −0.59 |
| Humid | 0.08 | −0.69 | −0.79 | −0.56 | −0.33 | −0.82 | −0.84 |
| H flux | 0.24 | −0.37 | −0.47 | −0.58 | −0.32 | −0.67 | −0.52 |
| PBL ht | 0.17 | −0.47 | −0.51 | −0.58 | −0.31 | −0.78 | −0.60 |
| Daily | AOD s | CO s | O3 | NO2 s | SO2 | API |
|---|---|---|---|---|---|---|
| CO s | 0.32 | |||||
| O3 | 0.19 | 0.62 | ||||
| NO2 s | 0.20 | 0.14 | 0.30 | |||
| SO2 | 0.06 | 0.15 | 0.04 | 0.11 | ||
| API | 0.53 | 0.57 | 0.59 | 0.82 | 0.14 | |
| T dew | 0.02 | −0.13 | −0.54 | −0.45 | 0.00 | −0.42 |
| Humid | 0.01 | −0.16 | −0.56 | −0.44 | −0.01 | −0.43 |
| U wind * | 0.01 | 0.05 | 0.38 | 0.29 | 0.01 | 0.29 |
| V wind | −0.11 | −0.07 | −0.03 | −0.04 | 0.02 | −0.09 |
| Temp | 0.04 | −0.14 | −0.19 | −0.15 | −0.02 | −0.12 |
| SLP | −0.01 | 0.01 | 0.14 | 0.20 | 0.03 | 0.15 |
| delta T * | 0.14 | 0.21 | 0.14 | 0.02 | −0.02 | 0.18 |
| Top-10 days | Ranked API (Σ ppb) |
|---|---|
| 13 July 2005 | 167 |
| 15 July 2006 | 165 |
| 11 July 2015 | 164 |
| 01 Aug 2009 | 157 |
| 12 July 2012 | 156 |
| 30 May 2015 | 150 |
| 10 Aug 2016 | 149 |
| 11 June 2006 | 140 |
| 24 July 2015 | 139 |
| 15 July 2015 | 138 |
| Diurnal | PM2.5 i | SO2 i |
|---|---|---|
| U wind | −0.37 | 0.75 |
| V wind | 0.26 | −0.96 |
| speed | −0.67 | −0.02 |
| Temp | 0.64 | −0.90 |
| Humid | −0.48 | 0.60 |
| delta T | −0.63 | 0.88 |
| H flux | 0.57 | −0.93 |
| PBL ht | 0.41 | −0.95 |
| PRES | GPH | T | Td | DIR | SPD |
|---|---|---|---|---|---|
| hPa | m | C | C | deg | m/s |
| Night | |||||
| 1000 | 151 | 15.8 | 10.8 | 220 | 3 |
| 984 | 289 | 17.8 | 13.3 | 239 | 4 |
| 970 | 412 | 18.2 | 7.2 | 255 | 4 |
| 962 | 482 | 17.6 | 7.6 | 265 | 3 |
| 941 | 671 | 17.2 | 7.2 | 290 | 4 |
| 925 | 817 | 17.4 | 8.4 | 310 | 5 |
| 906 | 995 | 20.4 | 6.4 | 317 | 6 |
| 900 | 1052 | 21.6 | 5.6 | 319 | 7 |
| 868 | 1363 | 19.3 | 5.2 | 330 | 8 |
| 850 | 1543 | 18.0 | 5.0 | 340 | 10 |
| Day | |||||
| 1000 | 109 | 22.0 | 17.0 | 090 | 4 |
| 985 | 239 | 19.6 | 15.6 | 065 | 4 |
| 970 | 372 | 22.4 | 9.4 | 039 | 5 |
| 955 | 507 | 23.8 | 5.8 | 013 | 5 |
| 948 | 571 | 23.4 | 6.4 | 001 | 5 |
| 925 | 784 | 24.4 | 4.4 | 320 | 6 |
| 910 | 926 | 23.5 | 3.5 | 325 | 7 |
| 890 | 1119 | 22.2 | 2.2 | 336 | 9 |
| 870 | 1315 | 21.4 | −0.1 | 340 | 12 |
| 850 | 1516 | 20.6 | −2.4 | 350 | 16 |
| Hourly | PM2.5 i | SO2 i | PBL ht | U Wind | V Wind | Temp | Humid | SLP | Delta T |
|---|---|---|---|---|---|---|---|---|---|
| SO2 i | 0.51 | ||||||||
| PBL ht | −0.13 | −0.21 | |||||||
| U wind | 0.32 | 0.06 | −0.38 | ||||||
| V wind | −0.09 | −0.53 | 0.33 | −0.12 | |||||
| Temp | 0.61 | 0.65 | −0.16 | 0.15 | −0.40 | ||||
| Humid | −0.49 | −0.43 | 0.08 | −0.26 | 0.29 | −0.40 | |||
| SLP | −0.73 | −0.45 | −0.14 | −0.07 | 0.06 | −0.62 | 0.39 | ||
| delta T | 0.51 | 0.43 | −0.73 | 0.55 | −0.41 | 0.48 | −0.35 | −0.21 | |
| H flux | −0.20 | −0.03 | 0.58 | −0.60 | 0.25 | −0.03 | −0.04 | −0.06 | −0.62 |
Publisher’s Note: MDPI stays neutral with regard to jurisdictional claims in published maps and institutional affiliations. |
© 2022 by the authors. Licensee MDPI, Basel, Switzerland. This article is an open access article distributed under the terms and conditions of the Creative Commons Attribution (CC BY) license (https://creativecommons.org/licenses/by/4.0/).
Share and Cite
Jury, M.R.; Buthelezi, M.S. Air Pollution Dispersion over Durban, South Africa. Atmosphere 2022, 13, 811. https://doi.org/10.3390/atmos13050811
Jury MR, Buthelezi MS. Air Pollution Dispersion over Durban, South Africa. Atmosphere. 2022; 13(5):811. https://doi.org/10.3390/atmos13050811
Chicago/Turabian StyleJury, Mark R., and Mandisa S. Buthelezi. 2022. "Air Pollution Dispersion over Durban, South Africa" Atmosphere 13, no. 5: 811. https://doi.org/10.3390/atmos13050811
APA StyleJury, M. R., & Buthelezi, M. S. (2022). Air Pollution Dispersion over Durban, South Africa. Atmosphere, 13(5), 811. https://doi.org/10.3390/atmos13050811


