Abstract
Emissions trading schemes (ETSs) are effective measures that facilitate economic growth and carbon mitigation, especially for developing countries such as China. These schemes can further affect the cash flow, production, and investment decisions of regulated companies. However, few empirical studies have explored how ETSs promote companies’ market value. We systematically evaluate the influence of the carbon emission trading (CET) policy on companies’ market value and explore the influential mechanism. We use the data of listed companies from the Chinese stock “A” markets and employ the difference-in-difference method to account for the unobserved cause of the CET policy regarding companies’ market value. Robust benchmark regression results reveal that the CET policy promotes companies’ market value significantly. The mechanism analysis reveals that the CET policy can improve the market value of listed companies by influencing the carbon price, innovative activities, and carbon disclosure. The results of the heterogeneity analysis show that the CET policy’s impact on companies’ market value is heterogeneous in terms of marketization degree, industry, firm ownership, and different regions. We suggest that the carbon pricing mechanism, degree of market perfection, carbon disclosure policy, and carbon finance should be optimized to improve the efficiency of ETSs.
1. Introduction
As a market-oriented environmental regulation policy, the carbon emission trading (CET) policy internalizes the cost of carbon emission reduction of enterprises, which will be transmitted to the securities market and may affect the market value of enterprises. Based on the outcomes of some previous studies, a CET policy will lead to a reduction in an enterprise’s market value [1,2,3]. Implementing a CET policy increases the production and operation costs of enterprises, which would crowd out their investment expenditure. This cost information is exposed to the capital market via corporate financial reports. This results in a reduction in the market value of enterprises. For example, Liu et al. (2021) showed that the implementation of carbon emission trading reduced the value of the current capital market. However, other studies have shown that the CET policy will enhance an enterprise’s market value [4]. As carbon emission permits are freely allocated, the sale of the remaining permits could be accounted for by higher cash flows due to free permits, which would increase the market value of enterprises [5,6]. According to the price signals of carbon emission permits, some enterprises will adapt to the new direction of industrial development policy, increase investment in innovative activities, and conform to environmental legitimacy to improve their sustainable development ability, thereby enhancing their market value. In addition, certain companies with better carbon emission abatement performance and comparative advantages in terms of abatement cost will provide detailed information disclosures to attract the attention of investors, thereby exerting a positive impact on the corporation’s market value. As the effect of emission trading schemes (ETSs) on a company’s market value is difficult to determine accurately, it is necessary to evaluate this effect thoroughly at the micro-level, especially for developing countries such as China.
After implementing a CET policy, a carbon emission permits market is established, wherein the equilibrium of supply and demand determines the price of carbon emission permits. The carbon emission permit price provides companies with a signal to choose between investing in emissions reduction or purchasing emission allowances on the carbon trading market. Accordingly, companies will invest in abatement until the marginal cost equals the CET permit price [7,8]. On the one hand, CET prices may affect enterprises’ investment behaviors and expectations of investors, and these influences would be reflected in the stock market [9]. On the other hand, many companies involved in carbon emission trading can shift the carbon emission permit price to their product prices, thus influencing the return rate of their stock prices [10]. Accordingly, there is a strong link between the stock market and the carbon emission trading market [11]. Based on this price signal and its productivity, a company will decide whether to purchase carbon emission rights to meet the government’s emission reduction requirements or reduce emissions per unit of output through innovation. First, companies with low productivity can only purchase carbon emission rights to meet the government’s emission reduction requirements, which will bring compliance costs to the company and reduce its profits [12]. Carbon emission trading restricts the carbon emissions of these companies and increases the costs of emission reduction, compliance, and technology updates, thereby reducing the company’s market value [13,14]. Second, companies with higher productivity can carry out innovative activities that meet the government’s emission reduction requirements, and enhance product competitiveness and profits, thereby increasing the company’s market value [12,13]. Therefore, there are many mechanisms by which EST affects the market value of companies, and it has a heterogeneous impact on companies with different productivities, which needs to be deeply explored.
As the world’s largest carbon emitter, China actively seeks to promote carbon emission reduction through a carbon ETS. Since the European Union introduced the ETS in 2005, this policy has been widely adopted in the US, New Zealand, Australia, Japan, South Korea, and China [15,16]. The development and history of the international and Chinese CET markets are shown in Table 1. At the end of 2011, the Chinese National Development and Reform Commission (NDRC) issued a notice and authorized seven administrative areas at different levels of economic growth and industrial structure to pilot and build projects incorporating carbon emission trading [17]. The pilots cover all four province-level municipalities (Beijing, Shanghai, Tianjin, and Chongqing), two provinces (Guangdong and Hubei), and one special economic zone (Shenzhen) [18]. The preparation and launch of the seven ETS pilots were set to take place within three years (2011–2014) [19]. The seven ETS pilot projects were independently designed and operated, featuring a wide heterogeneity in economic and energy conditions in terms of population, income, the share of manufacturing, and energy consumption [18,20]. Thus, China’s CET pilot initiatives offer an excellent opportunity for policy evaluation to investigate the impact of ETS on companies’ market value.

Table 1.
The development of history of international and China’s CET market.
Previous studies have extensively investigated the relationship between CET policies and the market value of enterprises. Many studies have investigated the impact of CET policy on enterprises’ market value from the perspective of cost and innovation effects, but they obtained contradicting results. Studies from the perspective of the cost effect showed that the impact of CET policy on enterprises’ market value is negative. On the contrary, studies from the perspective of innovation effects showed that the impact of CET policy on enterprises’ market value is positive [5,10,21]. Furthermore, many studies have explored this effect from the perspective of the transmission effect of the carbon emission permit price. Flora and Vargiolu (2020) confirmed that the carbon price stability mechanism in the European Union (EU) ETS significantly affects the timing of investment decisions and helps reduce investment related to carbon emissions [18]. Brouwers et al. (2016) found that following the EU’s carbon verification, the capital market had a significantly negative response to companies whose carbon emissions exceeded their quotas [22]. Some studies showed that EU allowances price changes and stock returns of the most important European electricity corporations are positively related [1,2]. In addition, many other studies have examined the relationship between the carbon price and the stock returns of the electricity market. Ji et al. (2017) believed that there is strong information interdependence between carbon price returns and electricity stock returns, evidenced by a high total connected index [23]. Veith et al. (2009) measured the economic consequences of ETS using investors’ expectations regarding the regulatory impact of firm value. They showed that returns on the common stock of the power generation industry are positively correlated with rising prices for emission rights [2]. However, little is known about the internal mechanism by which the ETS influences companies’ market value. To address this research gap, we explore the influence mechanism of ETS on companies’ market value by taking the CET pilot policy as a natural experiment.
This study aims to investigate the effect of the CET policy on companies’ market value and explore the influential mechanism. Exploring this influence effect and mechanism is conducive to realizing the synergistic effect of economic growth and carbon mitigation for policymakers in China and potentially other developing countries. Our study’s contributions are the following: (1) we systematically evaluate the CET policy’s influence on companies’ market value and explore the influential mechanism; (2) we employ the difference-in-difference (DID) method to account for unobserved trends in the CET policy’s effect on companies’ market value across pilot and non-pilot regions. In addition, we select the study sample from listed companies on China’s Shanghai and Shenzhen stock exchanges.
The remainder of this paper is organized as follows: the Section 2 provides a theoretical foundation. The Section 3 presents the empirical model and data. The Section 4 describes the benchmark results and a robustness check. The Section 5 presents the mechanism analysis. The Section 6 presents the heterogeneity analysis. Finally, the conclusions and policy recommendations are derived from the empirical outcomes.
2. Theoretical Foundation
2.1. Carbon Price
CET permits are traded as commodities in the exchange market to form an equilibrium carbon price. The carbon price signals emission reduction costs for enterprises [24]. The carbon price and its changes have a major impact on enterprises’ investment decision-making [25].
First—the effect of the carbon price on a company’s market value because the trading scheme puts compliance costs on the companies subject to it [2,26]. Carbon prices can influence companies’ cash flows, as they can incorporate their carbon emission reduction costs in their sale offers [27]. If companies can pass on any additional costs arising from the trading scheme to their customers, then carbon prices have almost no effect on companies’ cash flows [28]. The CET scheme will likely lead to additional costs for regulated companies when they cannot completely pass on the costs to their customers. Such circumstances will affect the companies’ cash flows and their cost structure and production decision-making behaviors [3]. Companies need to arrange some part of their cash flows to purchase the CET permits, or to invest in emissions abatement equipment and measures, reducing their output [29]. Accordingly, capital market participants expect decreasing profits of regulated firms due to a rising carbon price for CET permits [1,2].
Second, the CET policy may provide appropriate carbon price signals to industrial operators who can select a strategy of capital investments in clean technology rather than operational practices, such as installing abatement equipment to minimize the sum of abatement costs and permit expenses [24]. When a company’s productivity and competitiveness are relatively high, a rising carbon price in emission permits could encourage the company to invest in clean technology to meet emissions abatement requirements by the government [30]. This further results in an increase in the company’s investors’ expectations of future profits, leading to a higher market value for the company.
Finally, price fluctuations may affect investors’ expectations, thereby affecting companies’ market value. A variation in carbon prices is reflected in companies’ output prices as well as in their costs [31]. Carbon price fluctuations can alter the preferred input combination that companies use in their production processes, thereby affecting their profitability and market value. In addition, according to some studies, a price floor for CET permits reduces uncertainty over companies’ future profitability and influences the long-term price signal distribution, while a minimum carbon price creates incentives to invest in new low-carbon technologies [32,33]. Some studies have suggested that the effect of carbon price variations on companies’ market value could be asymmetric [34,35].
2.2. Innovative Activities
The CET policy is an environmental instrument that gives individual firms flexibility how they achieve compliance [36]. This policy is expected to generate dynamic incentives to increase companies’ innovative activities, mainly in terms of research, development, and demonstration (RD&D) and the adoption and diffusion of abatement technologies or low-carbon technologies [37,38]. Some companies with high abatement costs would purchase permits or conduct innovative activities to meet regulatory requirements. When regulated companies are not able to pass on the additional costs arising from the CET policy to their customers, while at the same time the imposed regulatory costs could even be overcompensated by the buyers, companies could be incentivized to undertake innovative activities [2,39]. In this setting, companies are inclined to increase investment in emission reduction technologies and low-carbon technologies to achieve emission reduction targets [40]. This increases companies’ fixed assets and technology levels, and enhances the value of their products, thereby promoting an increase in their market value [41].
Furthermore, improving companies’ emission reduction performance will improve their image and help adjust the expectations of investors and other stakeholders, which will further increase the value of their products and the return in the stock market. Consequently, we can draw a research hypothesis that the CET policy could incentivize some companies to carry out innovative emissions abatement, clean, or low-carbon technologies, thereby enhancing their market value [42]. However, it is worth noting that the innovation effect of the CET policy also depends on market participants, networks, institutions, cumulative learning processes between users and producers, and companies’ technology levels [36,40]. Accordingly, the government should improve the degree of marketization by improving laws and regulations related to the CET policy and formulating relevant implementation rules to reduce the impact of institutional uncertainty and institutional transaction costs [43]. Concurrently, the government can subsidize the innovation activities of companies, particularly costly innovation, which requires promotion from the government.
2.3. Carbon Disclosure
Carbon disclosure is a tool that describes companies’ carbon-related activities and information to stakeholders. There are generally two types of theories regarding the impact of carbon disclosure on the market value of companies: legitimacy theory and voluntary disclosure theory. According to the legitimacy theory, the cost of environmental information collection, management, and disclosure may outweigh the benefits. To meet various stakeholders’ requirements, companies with inferior carbon performance would make soft and unverifiable qualitative disclosure about their performance to maintain legitimacy [44,45]. When the legitimacy of a company is threatened, stakeholders may perceive the company as unsustainable.
Furthermore, information about process inefficiency and environmental initiatives accessible to competitors may weaken firm competition and financial performance, while misleading information or errors in reports can also increase litigation costs significantly [46,47]. Conversely, the voluntary disclosure theory posits that carbon disclosure is positively associated with market value [48]. Under the CET scheme, mandatory carbon reporting [regarding corporate social responsibility (CSR)] helps companies communicate their carbon emissions information and increase information transparency [10]. The improved transparency of high-quality disclosure reduces the information gap to stakeholders, thereby resulting in financial consequences through lower risk [49]. Consequently, carbon disclosure can help stakeholders, such as shareholders and creditors, to make better investment decisions.
Finally, carbon disclosure can also help stakeholders, such as regulatory agencies, institutional investors, and the public, to better monitor and regulate a company’s carbon emissions [42,50]. A company’s high-quality carbon disclosure often leads to high carbon performance, thus affecting its market value. Therefore, we can hypothesize that the relationship between the CET policy and companies’ market value by enhancing carbon disclosure seems to be mixed and inconsistent.
3. Data, Variables, and the Empirical Model
3.1. Data Source
The research sample is obtained from the Chinese Stock “A” markets (Shanghai Stock Exchange and Shenzhen Stock Exchange). The sample period ranges from 2000 to 2019. Data to measure companies’ market value (denoted by “MV”) and control variables are obtained from the WIND system and the China Stock Market & Accounting Research (CSMAR) system. We consider 2013 the start date of China’s CET policy, as Liu et al. (2015) did [51]. We take Beijing, Shanghai, Tianjin, Chongqing, Hubei Province, Guangdong Province, and Shenzhen as trading pilots. The carbon price data are obtained by initially crawling the daily transaction price data of the carbon market from the exchange websites of each pilot region and then taking the annual average value. The patent and green patent data of listed companies used to measure their innovative activities come from the Chinese Research Data Service (CNRDS) platform, containing multiple sub-databases. The ones used in this study are the China Innovation Research Database (CIRD) and the Green Patent Research Database (GPRD). We derive the patent data of the listed companies from the CIRD. The green patent data of listed companies conform to the GPRD. We use the evaluation data of listed companies’ social responsibility reports by Hexun index to represent companies’ carbon disclosure [52]. Finally, we eliminate the sample data of listed companies in the financial industry, as their businesses do not involve substantial carbon emissions [42,53]. Listed companies marked with ST, *ST, or PT are deleted from the sample. Additionally, we exclude the sample data of listed companies whose asset-liability ratio is greater than one and eliminate incomplete or omitted sample data, such as company registration location [47]. Ultimately, the final sample consists of 3283 firms.
3.2. Variables
This study uses a series of financial variables, such as financial leverage, return, and profitability, as control variables, owing to their potential impact on companies’ market value. Simultaneously, characteristic variables of individual companies, such as age, size, and management shareholding ratio, are used to control their impact on companies’ market value. Variables and data descriptions are shown in Table 2.
Table 2.
Variables and data descriptions.
- (1)
- SIZE. Large-scale companies have greater resource allocation capabilities and are more capable of conducting innovative activities, enhancing their market value [14].
- (2)
- BM. The book-to-market ratio is calculated by the total assets divided by the market value, denoted by BM [54].
- (3)
- ROE. The firm’s equity return is measured by the net profit divided by total assets, denoted by ROE [55].
- (4)
- DAR. Financial leverage is a symbol of financial risk in firms and affects the decision-making of important stakeholders [56]. Accordingly, companies with high financial leverage face greater financial pressures and higher risks, and they are prone to losing investment opportunities, which could reduce their market value. Financial leverage is measured by liabilities divided by total assets and is denoted by DAR in our study.
- (5)
- fix. Fixed assets are the core assets of companies that can resist market risks; thus, their proportion in total assets affects companies’ market value. In this study, we control for the ratio of fixed assets, which is measured by companies’ fixed assets to their total assets and is denoted as “fix”.
- (6)
- ROA. Return on assets (ROA) reflects the profitability of companies’ total assets. ROA identifies how a company’s market value is influenced by improving its operational efficiency [57]. We measure ROA using net income before preferred dividends divided by total assets.
- (7)
- MSR. Corporate governance factors affect a company’s merger and acquisition (M&A) decisions. The proportion of management holdings positively correlates with the probability of M&A. A company with a higher management shareholding ratio has a stronger motivation for external mergers, affecting the company’s investment and market value [58,59]. It is measured by the number of shares owned by the management divided by the total number of shares (denoted as “MSR”).
- (8)
- lnage. Older companies have greater motivation and capacity to participate in more carbon emissions abatement activities as they have adequate resources at a relatively lower cost [12,14,60]. Hence, we use the natural logarithm of company age to measure enterprise maturity, denoted by lnage.
- (9)
- cash and subsidy. Finally, we control companies’ operating cash flow (cash) and subsidies obtained from the government (subsidy).
3.3. Descriptive Statistics
Figure 1 shows the market value of listed companies for the pilot and non-pilot ETS regions. As shown in Figure 1, the market value of listed companies between pilot and non-pilot regions has been presented since 2011, while the trend is parallel before 2011. Although the pilot of the CET policy was only completed in 2013–2014, the Chinese NDRC proposed this policy officially at the end of 2011. Companies in the pilot regions would have behaved rationally and adopted forward-looking decision-making processes to reduce their emissions costs or taking innovative activities such as investing in abatement technologies [61]. Accordingly, the companies’ market value difference between the pilot and non-pilot regions shows no significant change after 2013. Nevertheless, these results demonstrate that the parallel trend hypothesis of the DID model can be roughly confirmed graphically.
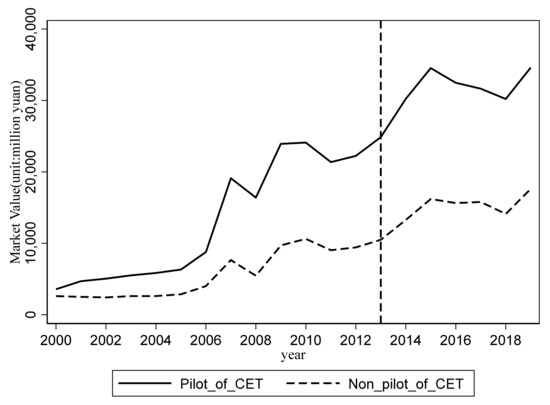
Figure 1.
The market value of listed companies for pilot and non-pilot regions of ETS.
Table 3 presents the descriptive statistics of the dependent variable (MV) and control variables for the treatment and control groups. The results indicate that the average market value of companies in the treatment group is significantly higher than that in the control group. However, the differences in control variables, such as SIZE, BM, ROE, DAR, fix, ROA, MSR, lnage, cash, and subsidy, between the treatment and control group are not significant.
Table 3.
Summary descriptive statistics of the main variables.
3.4. Empirical Model
An effective method to explore the net effect of a policy using the DID model is by comparing treatment and control groups before and after implementing the policy. In this study, the following DID model is constructed to analyze the heterogeneous effect of the market value of listed companies in pilot regions (i.e., treatment group) and non-pilot regions (i.e., control group) before and after the implementation of the CET policy:
where , , and denote the listed companies, city, and time, respectively. is the natural logarithm of market value of the company at period . is equal to 1 if a company is located in one of the seven pilot provinces and cities; otherwise, it is 0. equals one for every year after 2013; otherwise, it equals 0. represents all the control variables, including SIZE, BM, ROE, DAR, fix, ROA, MSR, lnage, cash, and subsidy. is the constant term and is the core explanatory variable that indicates the net causal impact of the CET policy on companies’ market value. represents the coefficients of all control variables. denotes the fixed effects of listed companies, is the time fixed effect, and is the standard error term.
4. Empirical Results
4.1. Benchmark Regression Results
Table 4 shows the benchmark regression results of the effect of the pilot CET policy on companies’ market value according to the empirical model shown in Equation (1). Column (1) shows the estimation results without controlling for any variable and by controlling for the fixed effects of the firm, while column (2) displays the outcomes without controlling for any variables, while the fixed effects of the firm and year are controlled. Column (3) presents the results with all control variables, and the fixed effects of firm and year are controlled. Column (4) outlines the results by controlling for the fixed effects of firm and industry. Column (5) displays the results by controlling for the fixed effects of the firm, year, and industry [14]. The coefficient of the core explanatory variable is significantly positive after adding control variables and fixing various effects, indicating that the result is relatively robust.
Table 4.
The regression results of the effect of the pilot CET policy on companies’ market value.
The benchmark regression results show that the market value of listed companies in the pilot regions is significantly higher than that of listed companies in the non-pilot regions. The market-oriented trading mechanism provides the price signals of carbon emissions permits to encourage companies to increase their investment in innovative activities and conform to the carbon emissions abatement requirements, thereby improving companies’ market value. Additionally, the free allocation of carbon emissions permits could be accounted for by higher cash flows, which would also increase the market value of companies. These findings are in accordance with those of previous studies, such as those of Oberndorfer (2009), Veith et al. (2009), Oestreich and Tsiakas (2015), and Bui et al. (2019), who stated that the ETS scheme is positively related to companies’ market value [1,2,5,6].
4.2. Robustness Test
4.2.1. Parallel Trend Test and Dynamic Effect
To ensure the effectiveness of the DID model, it is essential to prove that the common trend assumption is satisfied between the treatment and control groups. To test whether the parallel hypothesis was satisfied, we replace the dummy variable in Equation (1) with one corresponding to several years before and after implementing the CET policy [12,61,62]. The regression model is estimated as follows:
where is 1 when in the -th year before the implementation of the pilot CET policy () or in the -th year after the implementation of the pilot CET policy () for treatment groups, and 0 otherwise. Since the number of periods before 2013 is very large in our sample, the effects of the 9 to 13 years before 2013 are combined in a single group. If the coefficients of are insignificant before 2013 and significant after 2013, then the parallel trend hypothesis is satisfied. Figure 2 shows the test results of the parallel trend hypothesis and the dynamic trend of the pilot CET policy and companies’ market value. The results indicate no significant difference between the treatment and control groups before the policy is implemented, while it implies a significant increase in companies’ market value after implementing the pilot CET policy. The results confirm the parallel trend hypothesis.
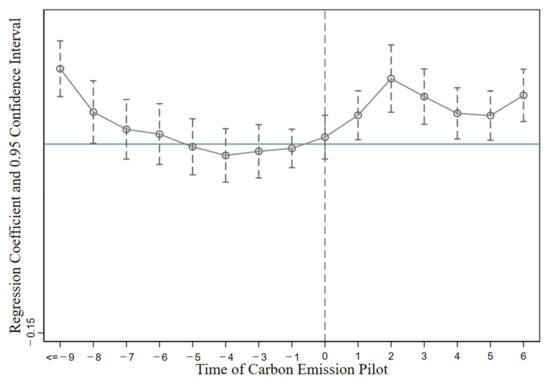
Figure 2.
The test of parallel trend hypothesis and the dynamic trend of the pilot CET policy and companies’ market value.
4.2.2. Placebo Test
We further perform a placebo test to exclude the effect of the pilot CET policy on a firm’s market value from the interference of other non-observable omitted variables. This involved random selection of certain regions as virtual “pilot regions” to enable the comparison of the differences of the effects between the real treatment group and the randomly generated group [61]. More specifically, if there are n firms in 2013 located in the area where the pilot CET policy is launched, keeping the time of the pilot CET policy constant, we randomly select n sample firms from the entire sample of firms as the treatment group to conduct a counterfactual test. We repeat 500 estimates based on the benchmark regression results in column (3) of Table 4. Figure 3 illustrates the probability density distribution of the regression coefficients for the placebo test. Based on random samples, the estimated coefficients are distributed centrally around 0, while the benchmark regression result (0.016) falls almost outside the possible range estimated from the virtual pilot regions shown in Figure 3. Hence, the results indicate that the pilot CET policy has no policy effect when randomly set up. Therefore, the placebo test reveals that the benchmark regression results of the DID method are reliable.
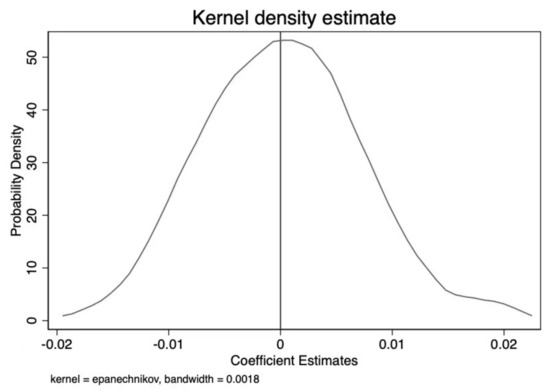
Figure 3.
Results of the distribution of the DID estimator for the placebo test.
4.2.3. Other Robustness Tests
Next, we conduct a series of robustness tests to enhance the reliability of the benchmark results.
- (1)
- Time-lag analysis of companies’ market value. To prevent the lag effect of the CET policy, we further examine the effect of the CET policy on companies’ market value with a lag of one year [14]. As is shown in column (1) of Table 5, the results indicate that the coefficient of “did” is also significant, implying that the CET policy has a significant lagging effect on promoting companies’ market value.
Table 5. Regression results of the other robustness check.
- (2)
- Policy shocks under changes at the pilot time point. After the CET mechanism is implemented, a certain process and cycle will be required to affect the companies’ market value [14]. Hence, we move the treatment year to 2014 (the variable did is changed to did1) to conduct a robustness check. We find the regression results to be similar to our benchmark results, as reported in column (3) of Table 4, indicating robust benchmark results.
- (3)
- Changes in the sample period. As the sample period before implementing the pilot policy is too long, we restrict the sample period from 2009 to 2019 and perform a DID regression for robustness checks [14]. Column (3) of Table 5 displays the regression outcomes, suggesting that the estimated conclusions are still robust.
5. Mechanism Analysis
5.1. Carbon Price
Implementing the CET policy has created a carbon trading market in which a carbon price is formed when the supply and demand of permits are balanced. As a signal of the carbon emission reduction cost, the carbon price may positively or negatively impact the market value of companies. Therefore, we empirically analyze the mechanism by which the CET policy affects companies’ market value from the perspective of carbon prices. The empirical model used in the mechanism analysis is as follows:
where m_price is obtained by aggregating daily carbon prices to yearly averages for pilot regions, and the data are collected from China Carbon Information Technology Research Institute.
The regression results of the mediation mechanism analysis are presented in Table 6. The regression results in columns (1) and (2) of Table 6 indicate that the carbon price has a negative mediation effect in the CET policy process, affecting the market value of listed companies. This is mainly because the CET policy will likely lead to additional compliance costs for regulated companies. To achieve carbon mitigation targets, regulated companies must arrange some part of their cash flows to purchase the CET permits or invest in emission abatement equipment and measures, reducing companies’ output. This does not only affect companies’ cash flows but also their cost structure and decision-making behaviors of production and R&D investment. A rising carbon price for CET permits lowers investors’ expectations of profits, which results in a decrease in companies’ market value. These results are consistent with those of previous studies, such as those of Oberndorfer (2009), Veith et al. (2009), Keppler and Cruciani (2010), Mo et al. (2012), and Chan et al. (2013), who found that carbon price variations are negatively correlated with companies’ stock market value, returns, or revenue [1,2,35,63,64].
Table 6.
Regression results of mediation mechanism analysis based on carbon price.
Companies in regulated high-carbon industries are more affected by CET policies than those in low-carbon industries. To this end, we compare the impact of the CET policy on the market value of companies in high-carbon and low-carbon industries. We regard the eight industries, including the petrochemical sector (C25), chemical industry (C26), construction materials (C30), steel (C31), non-ferrous metals (C32), papermaking (C22), electricity (D44, D45), and aviation (G56) as high-carbon industries; the rest are regarded as low-carbon industries according to Chen et al. (2021) [14]. Columns (3) and (4) of Table 6 show the regression results for the high-carbon and low-carbon industries, respectively. It can be observed that the coefficient of “did” for high-carbon industries is negative and insignificant, while that for low-carbon industries is significantly positive. This is because companies in high-carbon industries face stronger carbon constraints and bear more compliance costs under the CET policy, compared with the low-carbon industries. Accordingly, the CET policy has a negative impact on the market value of companies in high-carbon industries, while it has a positive effect on the market value of companies in low-carbon industries. These results are in accordance with those of previous studies, such as those of Veith et al. (2009), da Silva et al. (2016), and Wen et al. (2020), which revealed that the effect of carbon price change on the stock market returns in the power industry was asymmetric [2,9,27].
5.2. Innovative Activities
Implementing the CET policy has brought flexible arrangements to achieve carbon emission reductions for relevant listed companies. Companies can maintain their carbon emissions within the designated limits by installing abatement equipment or purchasing carbon permits. However, the cost of such emission reduction will increase with the increase in the carbon price and the reduction of carbon permits, which will reduce companies’ profits [65,66]. In this regard, if the cost of investing in cleaner technology is relatively low for some competitive companies, these will choose to invest in innovative activities to minimize carbon emission reduction costs [67]. Implementing the CET policy is conducive to incentivizing companies to increase their innovative activities in cleaner technologies or low-carbon technologies, thereby enhancing companies’ market value. Thus, we should investigate the influential mechanism by which innovation affects the CET policy’s effect on companies’ market value. The empirical model used in the mechanism analysis is as follows:
where the mediation variable innovation represents the number of green patent applications (denoted as innovation1) and green patents granted (denoted as innovation2). It is used to measure the innovative activities of companies.
The regression results are shown in Table 7. The results indicate that ETS has significantly promoted green innovation, and the improvement of green innovation can significantly increase companies’ market value. The CET policy could enhance the market value of listed companies by promoting green innovation. These results are in line with those of previous studies, such as those of Weber and Neuhoff (2010), Brauneis et al. (2013), and Gersbach and Riekhof (2021), who found that the carbon price signal creates incentives to invest in cleaner, low-carbon, or green technologies under the CET policy, thus enhancing companies’ stock market value or returns [30,32,43].
Table 7.
Regression results of mediation mechanism analysis based on technological innovation.
5.3. Carbon Disclosure
In recent years, listed companies have been obliged to disclose carbon information related to their production and operation processes and their products to satisfy the concerns of relevant stakeholders, such as shareholders, consumers, and regulatory authorities [68,69]. According to the legitimacy and voluntary disclosure theories, the relationship between carbon disclosure and companies’ market value presents two conflicting results. Specifically, we should empirically identify how carbon disclosure affects companies’ market value for Chinese CET policies. The empirical model of mechanism model is as follows:
where disclosure represents the degree of companies’ carbon disclosure. We used the evaluation data of listed companies’ social responsibility reports by Hexun index to represent the degree of companies’ carbon disclosure.
The regression results are shown in Table 8. The results indicate that carbon disclosure plays a negative role in the mechanism by which the CET policy affects companies’ market value. According to the legitimacy theory, there is an invisible contract between companies and society, which makes listed companies increase carbon disclosure to meet investors’ expectations, thereby maintaining legitimacy. However, the cost of environmental information collection and disclosure is likely to be greater than the benefits obtained by enterprises, especially when enterprises increase costs and improve carbon performance to meet relevant stakeholders’ needs. Obviously, a large increase in enterprise costs will reduce companies’ market value. These results are consistent with those of previous studies, such as those of Aragon-Correa et al. (2016) and Liu and Zhang (2017), who stated that carbon disclosure enhances cost legitimation and reduces companies’ market value [44,45]. Columns (3) and (4) of Table 8 show the regression results after dividing the sample into high-carbon and low-carbon industries. The results indicate that carbon disclosure has a significantly negative correlation with companies’ market value for low-carbon industries, while the reduction effect in the market value of high-carbon industries is insignificant.
Table 8.
Regression results of mediation mechanism analysis based on carbon disclosure.
6. Heterogeneity Analysis
6.1. The Impact of Firm Ownership
It is generally believed that non-state-owned firms are more flexible in their production, operation, and investment decisions than state-owned firms [70]. Therefore, non-state-owned firms are likely to enhance their market value by implementing a CET policy [14,71]. To this end, we conduct a heterogeneity analysis of the impact of firm ownership on the relationship between CET policy and companies’ market value. The regression results are listed in Table 9. The results show that the implementation of the CET policy has a positive and significant impact on the market value of non-state-owned enterprises, while it has an insignificant positive impact on the market value of state-owned enterprises. This is because companies face greater pressure on emission reduction costs, incentivizing them to invest in more advanced cleaner technologies or low-carbon technologies. Non-state-owned companies that are encouraged to invest in clean technologies often convey information to investors that they are more productive and competitive, increasing investors’ expectations of the company’s future profits, leading to an increase in their market value. By contrast, state-owned enterprises enjoy more government subsidies, financial support, and more free carbon permits, making them lose their motivation to innovate. Thus, the effect of the CET policy on the market value of state-owned enterprises is insignificant.
Table 9.
Heterogeneous analysis of the impact of firm ownership.
6.2. Heterogeneity Analysis of Different Regions
Chinese provinces are categorized into three regions according to their locations and economic development: eastern, central, and western. The eastern region includes the provinces of Beijing, Tianjin, Hebei, Shanghai, Jiangsu, Zhejiang, Fujian, Shandong, Guangdong, and Hainan. The central region encompasses the provinces of Jilin, Heilongjiang, Shanxi, Henan, Anhui, Hubei, Jiangxi, and Hunan. The western region includes the remaining provinces. Therefore, we conduct a heterogeneity analysis of different regions by dividing the entire sample into eastern, central, and western regions according to the companies’ locations. The results are presented in Table 10. The results indicate that the implementation of the CET policy has the most significant effect on enhancing the market value of companies in the eastern and central regions of China, while this effect is not significant in the western region of China. This may be because the economic development, technological level, and marketization degree of the eastern and central regions are higher than those of the western region. Thus, companies in the eastern and central regions are more inclined to conduct innovative activities to achieve carbon emission reduction targets than those in the western region, enhancing their market value. Conversely, companies in the western region are more dependent on natural resources and produce more carbon emissions, thus the impact of the CET policy on companies’ market value is negative.
Table 10.
Heterogeneous analysis of the different regions.
6.3. The Impact of Different Industries
Companies in the manufacturing industries are mainly regulated by the CET policy, which makes it necessary to invest a large number of funds to purchase carbon permits or install emissions abatement equipment. This could squeeze out companies’ original production investments, reducing their market value. Accordingly, we identify the impact of the CET policy on the market value of companies in manufacturing and non-manufacturing industries by using the difference-in-difference-in-difference (DDD) model. We multiply did by industry to obtain the dummy variable ddd of the DDD model for the manufacturing and non-manufacturing industries. The dummy variable industry is 1 if the company belongs to high-carbon industries (including the eight industries, C25, C26, C30, C31, C32, C22, D44, D45, and G56), and 0 otherwise. The regression results are listed in Table 11. The results indicate that the estimated coefficients of both the manufacturing and non-manufacturing companies are significantly negative, and the suppression effect of the manufacturing companies is greater than that of the non-manufacturing companies; the CET policy has a significantly negative impact on companies’ market value for high-carbon industries. China’s ETS pilot policy mainly involves manufacturing and supply industries, including transportation. Manufacturing companies face greater carbon constraints, and the implementation of the CET policy brings about a great cost effect for them, thereby reducing their market value even more.
Table 11.
Heterogeneous analysis of the different industries.
6.4. Heterogeneity Analysis of the Marketization Degree
The enhancement of companies’ market value by the market-oriented mechanism is affected by the perfection of the market system. When market transaction costs, market power, and information asymmetry exist, the role of market-oriented mechanisms is weakened [72]. Accordingly, we evaluate the heterogeneity analysis of the marketization degree using the DDD model. We use data from the “Marketization Index for China’s Provinces of Gang Fan for 2000–2017” to measure the degree of marketization in a certain region [73]. We divide the sample into two groups depending on whether the marketization index score in the region where the company is located is higher or lower than the median of all regions, then conduct a heterogeneity analysis. The regression results are listed in Table 12. These results indicate that the CET policy significantly affects companies’ market value when the marketization degree is high. Conversely, the CET policy has a negative and insignificant impact on companies’ market value when the marketization degree is low. These findings are in line with those of Jaraitė–Kažukauskė and Kazukauskas (2015), Hu et al. (2020), and Ren et al. (2020) [74,75,76]. Companies in a region with a high degree of marketization demonstrate increased flexibility in response to market changes and the ability to profit from the carbon emission trading market. When the market system is not perfect, it affects the price of carbon emissions trading and the company’s costs, benefits, and expectations. Hence, the degree of marketization influences companies’ investment decisions on carbon emission reduction and innovative activities, and in turn, their market value.
Table 12.
Heterogeneous analysis of marketization degree.
6.5. Heterogeneity Analysis of Financial Constraints
Under the carbon emission reduction pressure, companies have had to install carbon abatement equipment or upgrade their production progress by investing in low-carbon technologies, which undoubtedly aggravates their financial constraints [77]. Companies suffering from tight financial constraints cannot obtain sufficient financial resources to respond flexibly to the requirements of the CET policy. At the same time, this also affects the carbon emission reduction, production, and innovative activities of companies, thereby affecting their market value. We use the size-age (SA) index to measure the financing constraints of companies and divide the sample into two groups according to whether the SA index is higher than or lower than the median value for heterogeneity analysis. Companies with an SA index greater than the median value face loose financial constraints, while those with an SA index less than the median value face tight financial constraints. The SA index is calculated according to the formula: SA = 0.043 × size × size − 0.737 × size − 0.04 × age, where size is the logarithm of companies’ total assets [74]. The regression results are listed in Table 13. The results indicate that the CET policy has a significantly positive impact on the market value of companies with an SA index greater than the median. Conversely, the CET policy has no significant effect on the market value of companies with an SA index less than the median. Companies with loose financial constraints have more flexibility and better financial resources, they can optimize their decisions and strategies to enhance their market value in the CET market.
Table 13.
Heterogeneous analysis of financial constraints.
7. Discussions, Conclusions, and Policy Recommendations
Using China’s CET policy as a quasi-natural experiment, we innovatively explore the effect of this policy on companies’ market value. We investigate how the ETS scheme promotes companies’ market value from the carbon price, technological innovation, and carbon disclosure angle. Additionally, we conduct a heterogeneity analysis of the marketization degree, industries, firm ownership, and different regions. We use the data of listed companies from the Chinese stock “A” markets and match the data with patent and green patent data from the CNRDS platform. We employ the DID method to account for the unobserved cause of the CET policy regarding companies’ market value. Understanding this mechanism is important for advancing the performance of the carbon markets in China and potentially those in other developing countries that consider emission trading in their policy mix. The results of our study will help policymakers take full account of matching and coordinating existing laws, rules, and various policy instruments to create synergies. In addition, the findings of this study may be important for investors to optimize their decision-making and enhance their market value under the ETS mechanism.
Through theoretical and empirical analysis, we drew a series of conclusions:
- The benchmark regression results reveal that the CET policy promoted companies’ market value significantly. A series of robustness tests (e.g., parallel trend, dynamic effects, and placebo tests) show robust outcomes.
- The mechanism analysis of carbon price indicate that the CET policy could improve the market value of listed companies by influencing carbon price signals, and that carbon prices have a greater impact on the market value of companies in high-carbon industries. The mechanism analysis of technological innovation reveals that the CET policy has promoted green innovation considerably, and the improvement of green innovation can significantly increase companies’ market value. The mechanism analysis of carbon disclosure shows that carbon disclosure plays a negative role in the mechanism by which the CET policy affects companies’ market value, and that the reduction effect in the market value of high-carbon industries is less than that of low-carbon industries.
- The heterogeneity analysis of the marketization degree demonstrates that the CET policy significantly affects companies’ market value when the market system is perfect.
- The CET policy’s impact on companies’ market value is heterogeneous in industry, firm ownership, and different regions.
Our findings have important implications for regulators, policymakers, investors, and managers.
First, China’s CET market’s carbon pricing mechanism needs to be further improved to form a reasonable and effective carbon price. For the carbon market, a reasonable carbon price mechanism is of great significance to give full play to the role of the carbon market in energy saving and emission reduction. It is useful to set up a mechanism wherein the carbon prices are determined by the market and regulated by government. It is necessary to form a reasonable carbon price to reflect the scarcity of carbon permits and form effective incentives for companies. A carbon price that is too low cannot form a compelling incentive for companies, while a carbon price that is too high will increase the cost of companies.
Second, the government should improve the degree of market perfection and reduce market transaction costs. Perfecting the market rules of ETSs, including the carbon discharge permit system and monitoring system, is critical for improving their efficiency. It is also necessary for the government to set up and improve ETSs implementing policy and system development. The government should improve the information quality of carbon trading, which in turn will provide accurate supply and demand information and lower the costs of collecting information.
Third, regulators may consider the adverse impact of carbon disclosure on stakeholders and devise a carbon disclosure policy to encourage companies to disclose carbon emissions voluntarily. The government should strengthen and optimize the corporate social responsibility disclosure systems or utilize external institutions, such as media and public attention, to magnify the potential value losses of companies’ socially irresponsible behaviors.
Fourth, the government should further improve policies and regulations that encourage investors and companies to participate in cleaner and low-carbon innovative activities. The government is committed to establishing an incentive mechanism and strengthening the support of innovative capital, market systems, talents, and other elements to promote sustainable economic development effectively.
Finally, we propose that the Chinese government further improve carbon trading regulations and incorporate carbon finance into the carbon trading policy system. The role of tools such as carbon forwards and carbon futures should be further used to assist the carbon market in generating timely, true, and effective carbon price signals.
Author Contributions
Conceptualization, M.T.; methodology, W.M. and S.C.; software, S.C. and W.G.; validation, S.C.; formal analysis, S.C., W.M. and W.G.; investigation, S.C.; resources, M.T.; data curation, S.C.; writing—original draft preparation, M.T.; writing—review and editing, M.T.; visualization, W.M.; supervision, F.H.; project administration, F.H.; funding acquisition, M.T. All authors have read and agreed to the published version of the manuscript.
Funding
This research was funded by the Major Project of the Chinese National Social Science Fund “Research on improving the development mechanism of urban-rural integration” (21AZD036), the General Project of the Chinese National Social Science Fund “Land development right transaction, land resource allocation mechanism and high-quality economic development” (21FJYB052), and the National Natural Science Foundation of China (72073045).
Institutional Review Board Statement
Not applicable.
Informed Consent Statement
Not applicable.
Data Availability Statement
The data presented in this study are available on request from the corresponding author.
Conflicts of Interest
The authors declare no conflict of interest in this article.
References
- Oberndorfer, U. EU Emission Allowances and the stock market: Evidence from the electricity industry. Ecol. Econ. 2009, 68, 1116–1126. [Google Scholar] [CrossRef]
- Veith, S.; Werner, J.R.; Zimmermann, J. Capital market response to emission rights returns: Evidence from the European power sector. Energy Econ. 2009, 31, 605–613. [Google Scholar] [CrossRef]
- Fabra, N.; Reguant, M. Pass-Through of Emissions Costs in Electricity Markets. Am. Econ. Rev. 2014, 104, 2872–2899. [Google Scholar] [CrossRef]
- Liu, M.; Zhou, C.; Lu, F.; Hu, X. Impact of the implementation of carbon emission trading on corporate financial performance: Evidence from listed companies in China. PLoS ONE 2021, 16, e0253460. [Google Scholar] [CrossRef]
- Bui, B.; Moses, O.; Houqe, M.N. Carbon disclosure, emission intensity and cost of equity capital: Multi-country evidence. Account. Financ. 2020, 60, 47–71. [Google Scholar] [CrossRef]
- Oestreich, A.M.; Tsiakas, I. Carbon emissions and stock returns: Evidence from the EU Emissions Trading Scheme. J. Bank. Financ. 2015, 58, 294–308. [Google Scholar] [CrossRef]
- Clarkson, P.M.; Li, Y.; Pinnuck, M.; Richardson, G.D. The Valuation Relevance of Greenhouse Gas Emissions under the European Union Carbon Emissions Trading Scheme. Eur. Account. Rev. 2015, 24, 551–580. [Google Scholar] [CrossRef]
- Matisoff, D.C. The Adoption of State Climate Change Policies and Renewable Portfolio Standards: Regional Diffusion or Internal Determinants? Rev. Policy Res. 2008, 25, 527–546. [Google Scholar] [CrossRef]
- Wen, F.; Zhao, L.; He, S.; Yang, G. Asymmetric relationship between carbon emission trading market and stock market: Evidences from China. Energy Econ. 2020, 91, 104850. [Google Scholar] [CrossRef]
- Velte, P.; Stawinoga, M.; Lueg, R. Carbon performance and disclosure: A systematic review of governance-related determinants and financial consequences. J. Clean. Prod. 2020, 254, 120063. [Google Scholar] [CrossRef]
- Jiménez-Rodríguez, R. What happens to the relationship between EU allowances prices and stock market indices in Europe? Energy Econ. 2019, 81, 13–24. [Google Scholar] [CrossRef]
- Tang, M.; Li, Z.; Hu, F.; Wu, B.; Zhang, R. Market failure, tradable discharge permit, and pollution reduction: Evidence from industrial firms in China. Ecol. Econ. 2021, 189, 107180. [Google Scholar] [CrossRef]
- Liu, C.; Ma, C.; Xie, R. Structural, Innovation and Efficiency Effects of Environmental Regulation: Evidence from China’s Carbon Emissions Trading Pilot. Environ. Resour. Econ. 2020, 75, 741–768. [Google Scholar] [CrossRef]
- Chen, Z.; Zhang, X.; Chen, F. Do carbon emission trading schemes stimulate green innovation in enterprises? Evidence from China. Technol. Forecast. Soc. Chang. 2021, 168, 120744. [Google Scholar] [CrossRef]
- Martin, R.; Muuls, M.; Wagner, U.J. The Impact of the European Union Emissions Trading Scheme on Regulated Firms: What Is the Evidence after Ten Years? Rev. Environ. Econ. Policy 2016, 10, 129–148. [Google Scholar] [CrossRef]
- Zhu, J.; Fan, Y.; Deng, X.; Xue, L. Low-carbon innovation induced by emissions trading in China. Nat. Commun. 2019, 10, 4088. [Google Scholar] [CrossRef]
- Liu, L.; Wang, Y.; Wu, C.; Wu, W. Disentangling the determinants of real oil prices. Energy Econ. 2016, 56, 363–373. [Google Scholar] [CrossRef]
- Zhang, J.; Wang, Z.; Du, X. Lessons learned from China’s regional carbon market pilots. Econ. Energy Environ. Policy 2017, 6, 19–38. [Google Scholar] [CrossRef]
- Zhang, D.; Karplus, V.J.; Cassisa, C.; Zhang, X. Emissions trading in China: Progress and prospects. Energy Policy 2014, 75, 9–16. [Google Scholar] [CrossRef]
- Descheemaeker, K.; Oosting, S.J.; Tui, S.H.-K.; Masikati, P.; Falconnier, G.N.; Giller, K.E. Climate change adaptation and mitigation in smallholder crop–livestock systems in sub-Saharan Africa: A call for integrated impact assessments. Reg. Environ. Chang. 2016, 16, 2331–2343. [Google Scholar] [CrossRef]
- Flora, M.; Vargiolu, T. Price dynamics in the European Union Emissions Trading System and evaluation of its ability to boost emission-related investment decisions. Eur. J. Oper. Res. 2020, 280, 383–394. [Google Scholar] [CrossRef]
- Brouwers, R.; Schoubben, F.; Van Hulle, C.; Van Uytbergen, S. The initial impact of EU ETS verification events on stock prices. Energy Policy 2016, 94, 138–149. [Google Scholar] [CrossRef]
- Ji, J.; Zhang, Z.; Yang, L. Carbon emission reduction decisions in the retail-/dual-channel supply chain with consumers’ preference. J. Clean. Prod. 2017, 141, 852–867. [Google Scholar] [CrossRef]
- Stigler, G.J.; Friedland, C. What Can Regulators Regulate? The Case of Electricity. J. Law Econ. 1962, 5, 1–16. [Google Scholar] [CrossRef]
- Cui, J.; Zhang, J.; Zheng, Y. Carbon Pricing Induces Innovation: Evidence from China’s Regional Carbon Market Pilots. AEA Pap. Proc. 2018, 108, 453–457. [Google Scholar] [CrossRef]
- Da Silva, P.P.; Moreno, B.; Figueiredo, N.C. Firm-specific impacts of CO2 prices on the stock market value of the Spanish power industry. Energy Policy 2016, 94, 492–501. [Google Scholar] [CrossRef]
- Abrell, J.; Cludius, J.; Lehmann, S.; Schleich, J.; Betz, R. Corporate Emissions-Trading Behaviour During the First Decade of the EU ETS. Environ. Resour. Econ. 2021, 1–37. [Google Scholar] [CrossRef]
- Montgomery, W.D. Markets in licenses and efficient pollution control programs. J. Econ. Theory 1972, 5, 395–418. [Google Scholar] [CrossRef]
- Brauneis, A.; Mestel, R.; Palan, S. Inducing low-carbon investment in the electric power industry through a price floor for emissions trading. Energy Policy 2013, 53, 190–204. [Google Scholar] [CrossRef]
- Boersen, A.; Scholtens, B. The relationship between European electricity markets and emission allowance futures prices in phase II of the EU (European Union) emission trading scheme. Energy 2014, 74, 585–594. [Google Scholar] [CrossRef]
- Weber, T.A.; Neuhoff, K. Carbon markets and technological innovation. J. Environ. Econ. Manag. 2010, 60, 115–132. [Google Scholar] [CrossRef]
- Grüll, G.; Taschini, L. Cap-and-trade properties under different hybrid scheme designs. J. Environ. Econ. Manag. 2011, 61, 107–118. [Google Scholar] [CrossRef]
- Zachmann, G.; von Hirschhausen, C. First evidence of asymmetric cost pass-through of EU emissions allowances: Examining wholesale electricity prices in Germany. Econ. Lett. 2008, 99, 465–469. [Google Scholar] [CrossRef]
- Mo, J.-L.; Zhu, L.; Fan, Y. The impact of the EU ETS on the corporate value of European electricity corporations. Energy 2012, 45, 3–11. [Google Scholar] [CrossRef]
- Rogge, K.S.; Hoffmann, V.H. The impact of the EU ETS on the sectoral innovation system for power generation technologies—Findings for Germany. Energy Policy 2010, 38, 7639–7652. [Google Scholar] [CrossRef]
- Fischer, C.; Parry, I.W.H.; Pizer, W.A. Instrument choice for environmental protection when technological innovation is endogenous. J. Environ. Econ. Manag. 2003, 45, 523–545. [Google Scholar] [CrossRef]
- Rogge, K.S.; Schneider, M.; Hoffmann, V.H. The innovation impact of the EU Emission Trading System—Findings of company case studies in the German power sector. Ecol. Econ. 2011, 70, 513–523. [Google Scholar] [CrossRef]
- Golombek, R.; Hoel, M. Endogenous technology and tradable emission quotas. Resour. Energy Econ. 2008, 30, 197–208. [Google Scholar] [CrossRef][Green Version]
- Greaker, M.; Hagem, C. Strategic Investment in Climate Friendly Technologies: The Impact of Global Emissions Trading. Environ. Resour. Econ. 2014, 59, 65–85. [Google Scholar] [CrossRef]
- Kemp, R.; Pontoglio, S. The innovation effects of environmental policy instruments—A typical case of the blind men and the elephant? Ecol. Econ. 2011, 72, 28–36. [Google Scholar] [CrossRef]
- Siddique, M.A.; Akhtaruzzaman, M.; Rashid, A.; Hammami, H. Carbon disclosure, carbon performance and financial performance: International evidence. Int. Rev. Financ. Anal. 2021, 75, 101734. [Google Scholar] [CrossRef]
- Gersbach, H.; Riekhof, M.-C. Permit markets, carbon prices and the creation of innovation clusters. Resour. Energy Econ. 2021, 65, 101229. [Google Scholar] [CrossRef]
- Aragón-Correa, J.A.; Marcus, A.; Hurtado-Torres, N. The Natural Environmental Strategies of International Firms: Old Controversies and New Evidence on Performance and Disclosure. Acad. Manag. Perspect. 2016, 30, 24–39. [Google Scholar] [CrossRef]
- Liu, X.; Zhang, C. Corporate governance, social responsibility information disclosure, and enterprise value in China. J. Clean. Prod. 2017, 142, 1075–1084. [Google Scholar] [CrossRef]
- Matsumura, E.M.; Prakash, R.; Vera-Muñoz, S.C. Firm-Value Effects of Carbon Emissions and Carbon Disclosures. Account. Rev. 2013, 89, 695–724. [Google Scholar] [CrossRef]
- Wang, S.; Wang, H.; Wang, J.; Yang, F. Does environmental information disclosure contribute to improve firm financial performance? An examination of the underlying mechanism. Sci. Total Environ. 2020, 714, 136855. [Google Scholar] [CrossRef]
- Khlif, H.; Chalmers, K. A review of meta-analytic research in accounting. J. Account. Lit. 2015, 35, 1–27. [Google Scholar] [CrossRef]
- Lueg, K.; Krastev, B.; Lueg, R. Bidirectional effects between organizational sustainability disclosure and risk. J. Clean. Prod. 2019, 229, 268–277. [Google Scholar] [CrossRef]
- Shen, F.; Ma, Y.; Wang, R.; Pan, N.; Meng, Z. Does environmental performance affect financial performance? Evidence from Chinese listed companies in heavily polluting industries. Qual. Quant. 2019, 53, 1941–1958. [Google Scholar] [CrossRef]
- Liu, L.; Chen, C.; Zhao, Y.; Zhao, E. China’s carbon-emissions trading: Overview, challenges and future. Renew. Sustain. Energy Rev. 2015, 49, 254–266. [Google Scholar] [CrossRef]
- Luo, L. The influence of institutional contexts on the relationship between voluntary carbon disclosure and carbon emission performance. Account. Financ. 2019, 59, 1235–1264. [Google Scholar] [CrossRef]
- Yi, Y.; Zhang, Z.; Yan, Y. Kindness is rewarded! The impact of corporate social responsibility on Chinese market reactions to the COVID-19 pandemic. Econ. Lett. 2021, 208, 110066. [Google Scholar] [CrossRef]
- Lv, M.; Bai, M. Evaluation of China’s carbon emission trading policy from corporate innovation. Financ. Res. Lett. 2021, 39, 101565. [Google Scholar] [CrossRef]
- Zhang, Y.-J.; Wang, W. How does China’s carbon emissions trading (CET) policy affect the investment of CET-covered enterprises? Energy Econ. 2021, 98, 105224. [Google Scholar] [CrossRef]
- Xu, X.D.; Zeng, S.X.; Zou, H.L.; Shi, J.J. The Impact of Corporate Environmental Violation on Shareholders’ Wealth: A Perspective Taken from Media Coverage. Bus. Strat. Environ. 2016, 25, 73–91. [Google Scholar] [CrossRef]
- Busch, T.; Hoffmann, V.H. How Hot Is Your Bottom Line? Linking Carbon and Financial Performance. Bus. Soc. 2011, 50, 233–265. [Google Scholar] [CrossRef]
- Malmendier, U.; Tate, G.; Yan, J. Overconfidence and Early-Life Experiences: The Effect of Managerial Traits on Corporate Financial Policies. J. Financ. 2011, 66, 1687–1733. [Google Scholar] [CrossRef]
- Malmendier, U.; Tate, G. Who makes acquisitions? CEO overconfidence and the market’s reaction. J. Financ. Econ. 2008, 89, 20–43. [Google Scholar] [CrossRef]
- Huergo, E.; Jaumandreu, J. Firms’ age, process innovation and productivity growth. Int. J. Ind. Organ. 2004, 22, 541–559. [Google Scholar] [CrossRef]
- Gao, Y.; Li, M.; Xue, J.; Liu, Y. Evaluation of effectiveness of China’s carbon emissions trading scheme in carbon mitigation. Energy Econ. 2020, 90, 104872. [Google Scholar] [CrossRef]
- Li, P.; Lu, Y.; Wang, J. Does flattening government improve economic performance? Evidence from China. J. Dev. Econ. 2016, 123, 18–37. [Google Scholar] [CrossRef]
- Keppler, J.H.; Cruciani, M. Rents in the European power sector due to carbon trading. Energy Policy 2010, 38, 4280–4290. [Google Scholar] [CrossRef]
- Chan, R.; Li, S.; Zhang, F. Firm competitiveness and the European Union emissions trading scheme. Energy Policy 2013, 63, 1056–1064. [Google Scholar] [CrossRef]
- Popp, D. Induced Innovation and Energy Prices. Am. Econ. Rev. 2002, 92, 160–180. [Google Scholar] [CrossRef]
- Zeng, S.; Nan, X.; Liu, C.; Chen, J. The response of the Beijing carbon emissions allowance price (BJC) to macroeconomic and energy price indices. Energy Policy 2017, 106, 111–121. [Google Scholar] [CrossRef]
- Popp, D. Innovation and Climate Policy. Annu. Rev. Resour. Econ. 2010, 2, 275–298. [Google Scholar] [CrossRef]
- Meng, X.; Zeng, S.; Shi, J.J.; Qi, G.; Zhang, Z. The relationship between corporate environmental performance and environmental disclosure: An empirical study in China. J. Environ. Manag. 2014, 145, 357–367. [Google Scholar] [CrossRef] [PubMed]
- Li, D.; Huang, M.; Ren, S.; Chen, X.; Ning, L. Environmental Legitimacy, Green Innovation, and Corporate Carbon Disclosure: Evidence from CDP China 100. J. Bus. Ethics 2018, 150, 1089–1104. [Google Scholar] [CrossRef]
- Brandt, L.; Van Biesebroeck, J.; Zhang, Y. Challenges of working with the Chinese NBS firm-level data. China Econ. Rev. 2014, 30, 339–352. [Google Scholar] [CrossRef]
- Hahn, R.W. Market Power and Transferable Property Rights. Q. J. Econ. 1984, 99, 753–765. [Google Scholar] [CrossRef]
- Jaffe, A.B.; Newell, R.G.; Stavins, R.N. A tale of two market failures: Technology and environmental policy. Ecol. Econ. 2005, 54, 164–174. [Google Scholar] [CrossRef]
- Wang, K.; Wei, Y.-M.; Huang, Z. Potential gains from carbon emissions trading in China: A DEA based estimation on abatement cost savings. Omega 2016, 63, 48–59. [Google Scholar] [CrossRef]
- Jaraitė-Kažukauskė, J.; Kažukauskas, A. Do Transaction Costs Influence Firm Trading Behaviour in the European Emissions Trading System? Environ. Resour. Econ. 2014, 62, 583–613. [Google Scholar] [CrossRef]
- Hu, Y.; Ren, S.; Wang, Y.; Chen, X. Can carbon emission trading scheme achieve energy conservation and emission reduction? Evidence from the industrial sector in China. Energy Econ. 2020, 85, 104590. [Google Scholar] [CrossRef]
- Ren, S.; Hu, Y.; Zheng, J.; Wang, Y. Emissions trading and firm innovation: Evidence from a natural experiment in China. Technol. Forecast. Soc. Chang. 2020, 155, 119989. [Google Scholar] [CrossRef]
- An, S.; Li, B.; Song, D.; Chen, X. Green credit financing versus trade credit financing in a supply chain with carbon emission limits. Eur. J. Oper. Res. 2021, 292, 125–142. [Google Scholar] [CrossRef]
- Hadlock, C.J.; Pierce, J.R. New Evidence on Measuring Financial Constraints: Moving Beyond the KZ Index. Rev. Financ. Stud. 2010, 23, 1909–1940. [Google Scholar] [CrossRef]


Publisher’s Note: MDPI stays neutral with regard to jurisdictional claims in published maps and institutional affiliations. |
© 2022 by the authors. Licensee MDPI, Basel, Switzerland. This article is an open access article distributed under the terms and conditions of the Creative Commons Attribution (CC BY) license (https://creativecommons.org/licenses/by/4.0/).