
Rapid Diagnosis of Nitrogen Nutrition Status in Summer Maize over Its Life Cycle by a Multi-Index Synergy Model Using Ground Hyperspectral and UAV Multispectral Sensor Data


Abstract
:1. Introduction
2. Materials and Methods
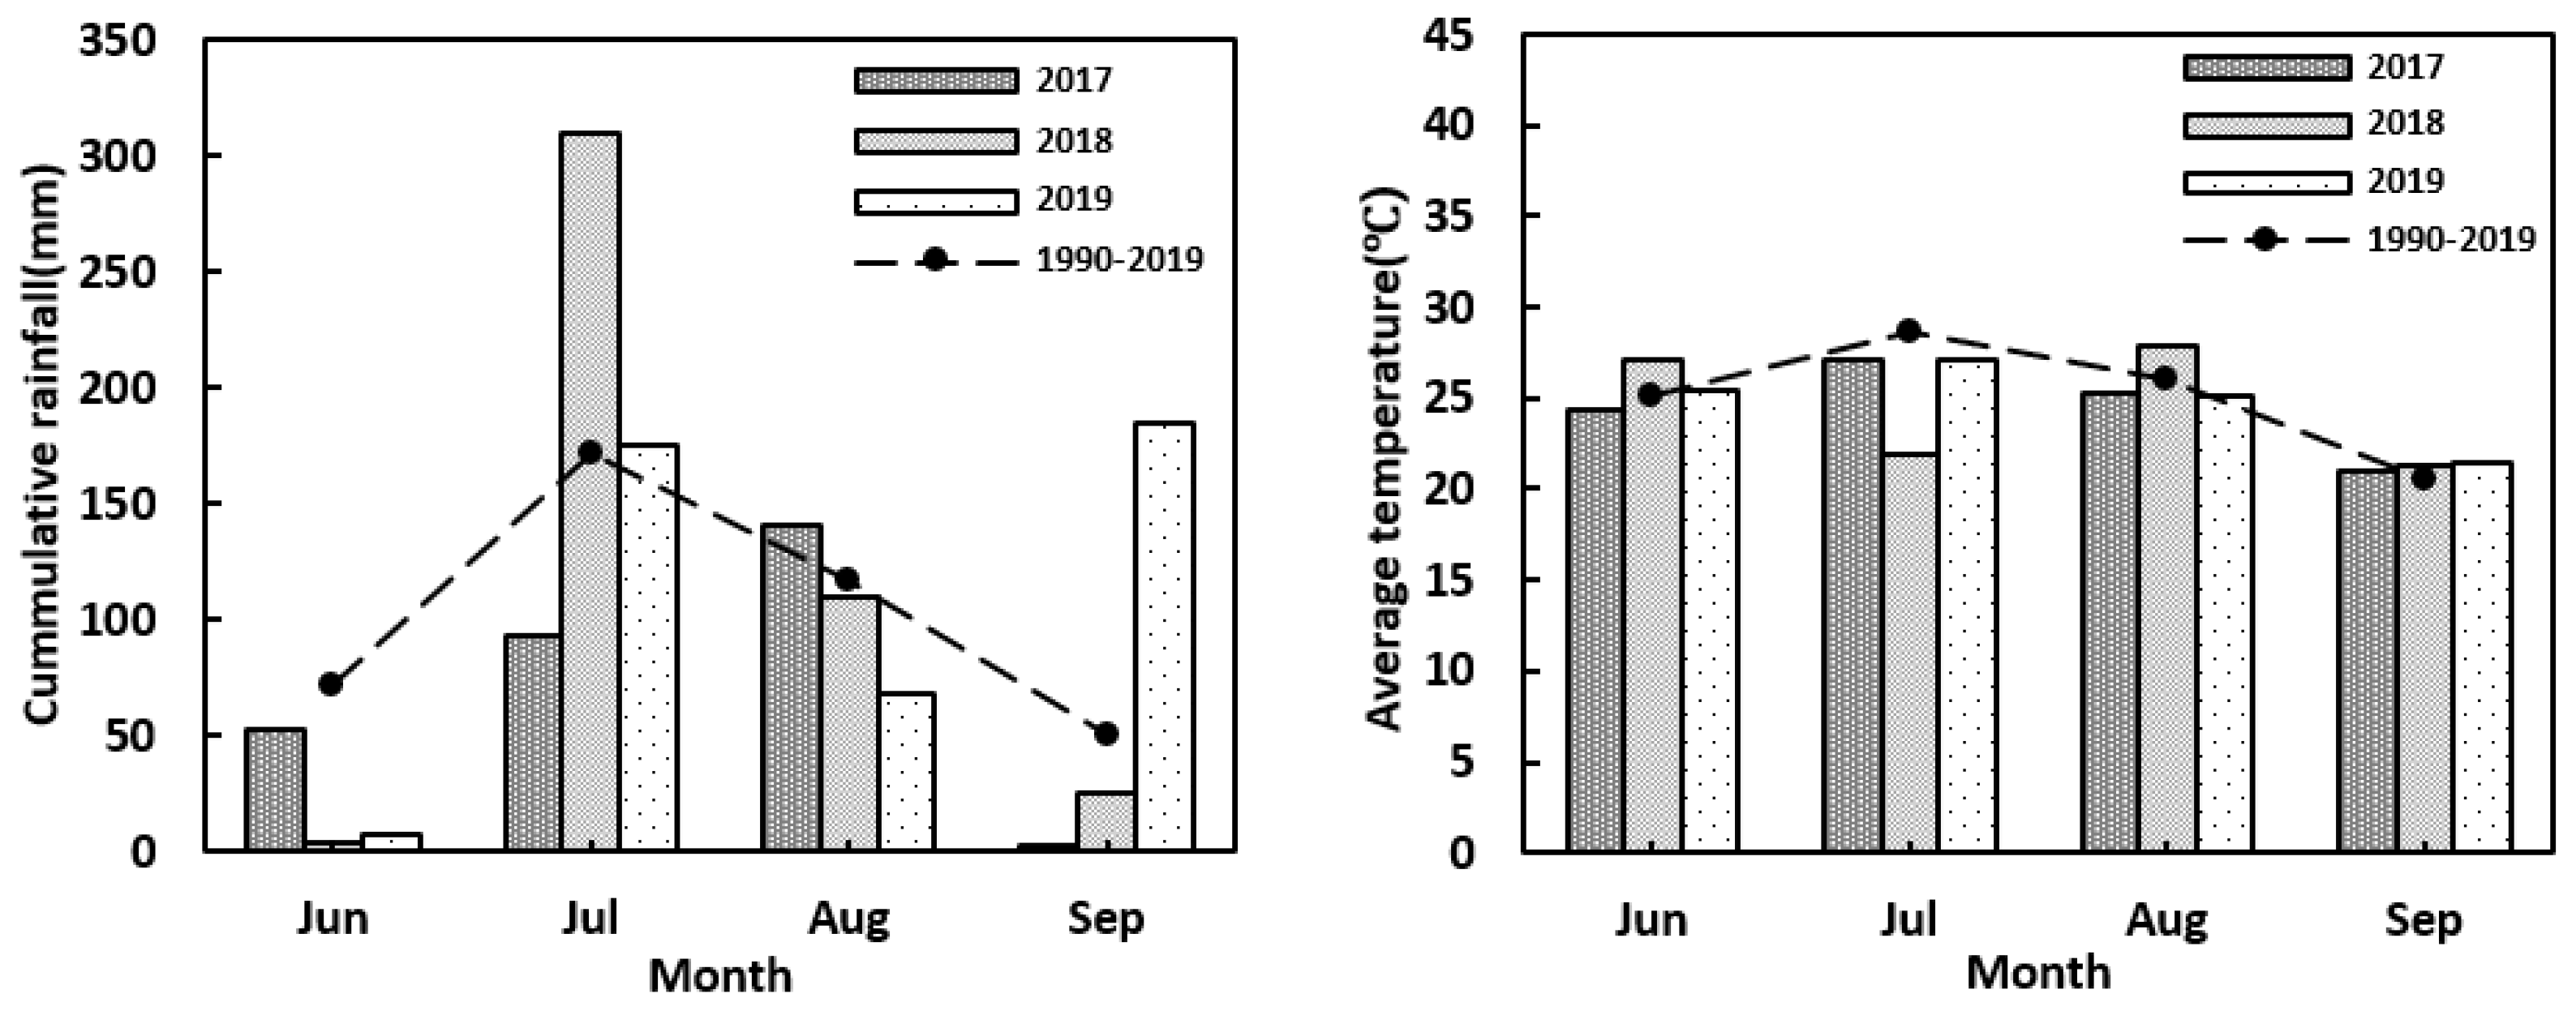
2.1. Field Experiments and Environmental Conditions
2.2. Plant Sampling and Spectral Measurements
2.3. Data Processing and Analysis
2.3.1. Calculation of Simulated Multispectral Reflectance
2.3.2. Multispectral Index
2.3.3. Critical Nitrogen Content Curve
2.3.4. Leaf Area Index (LAI)
2.4. Model Evaluation
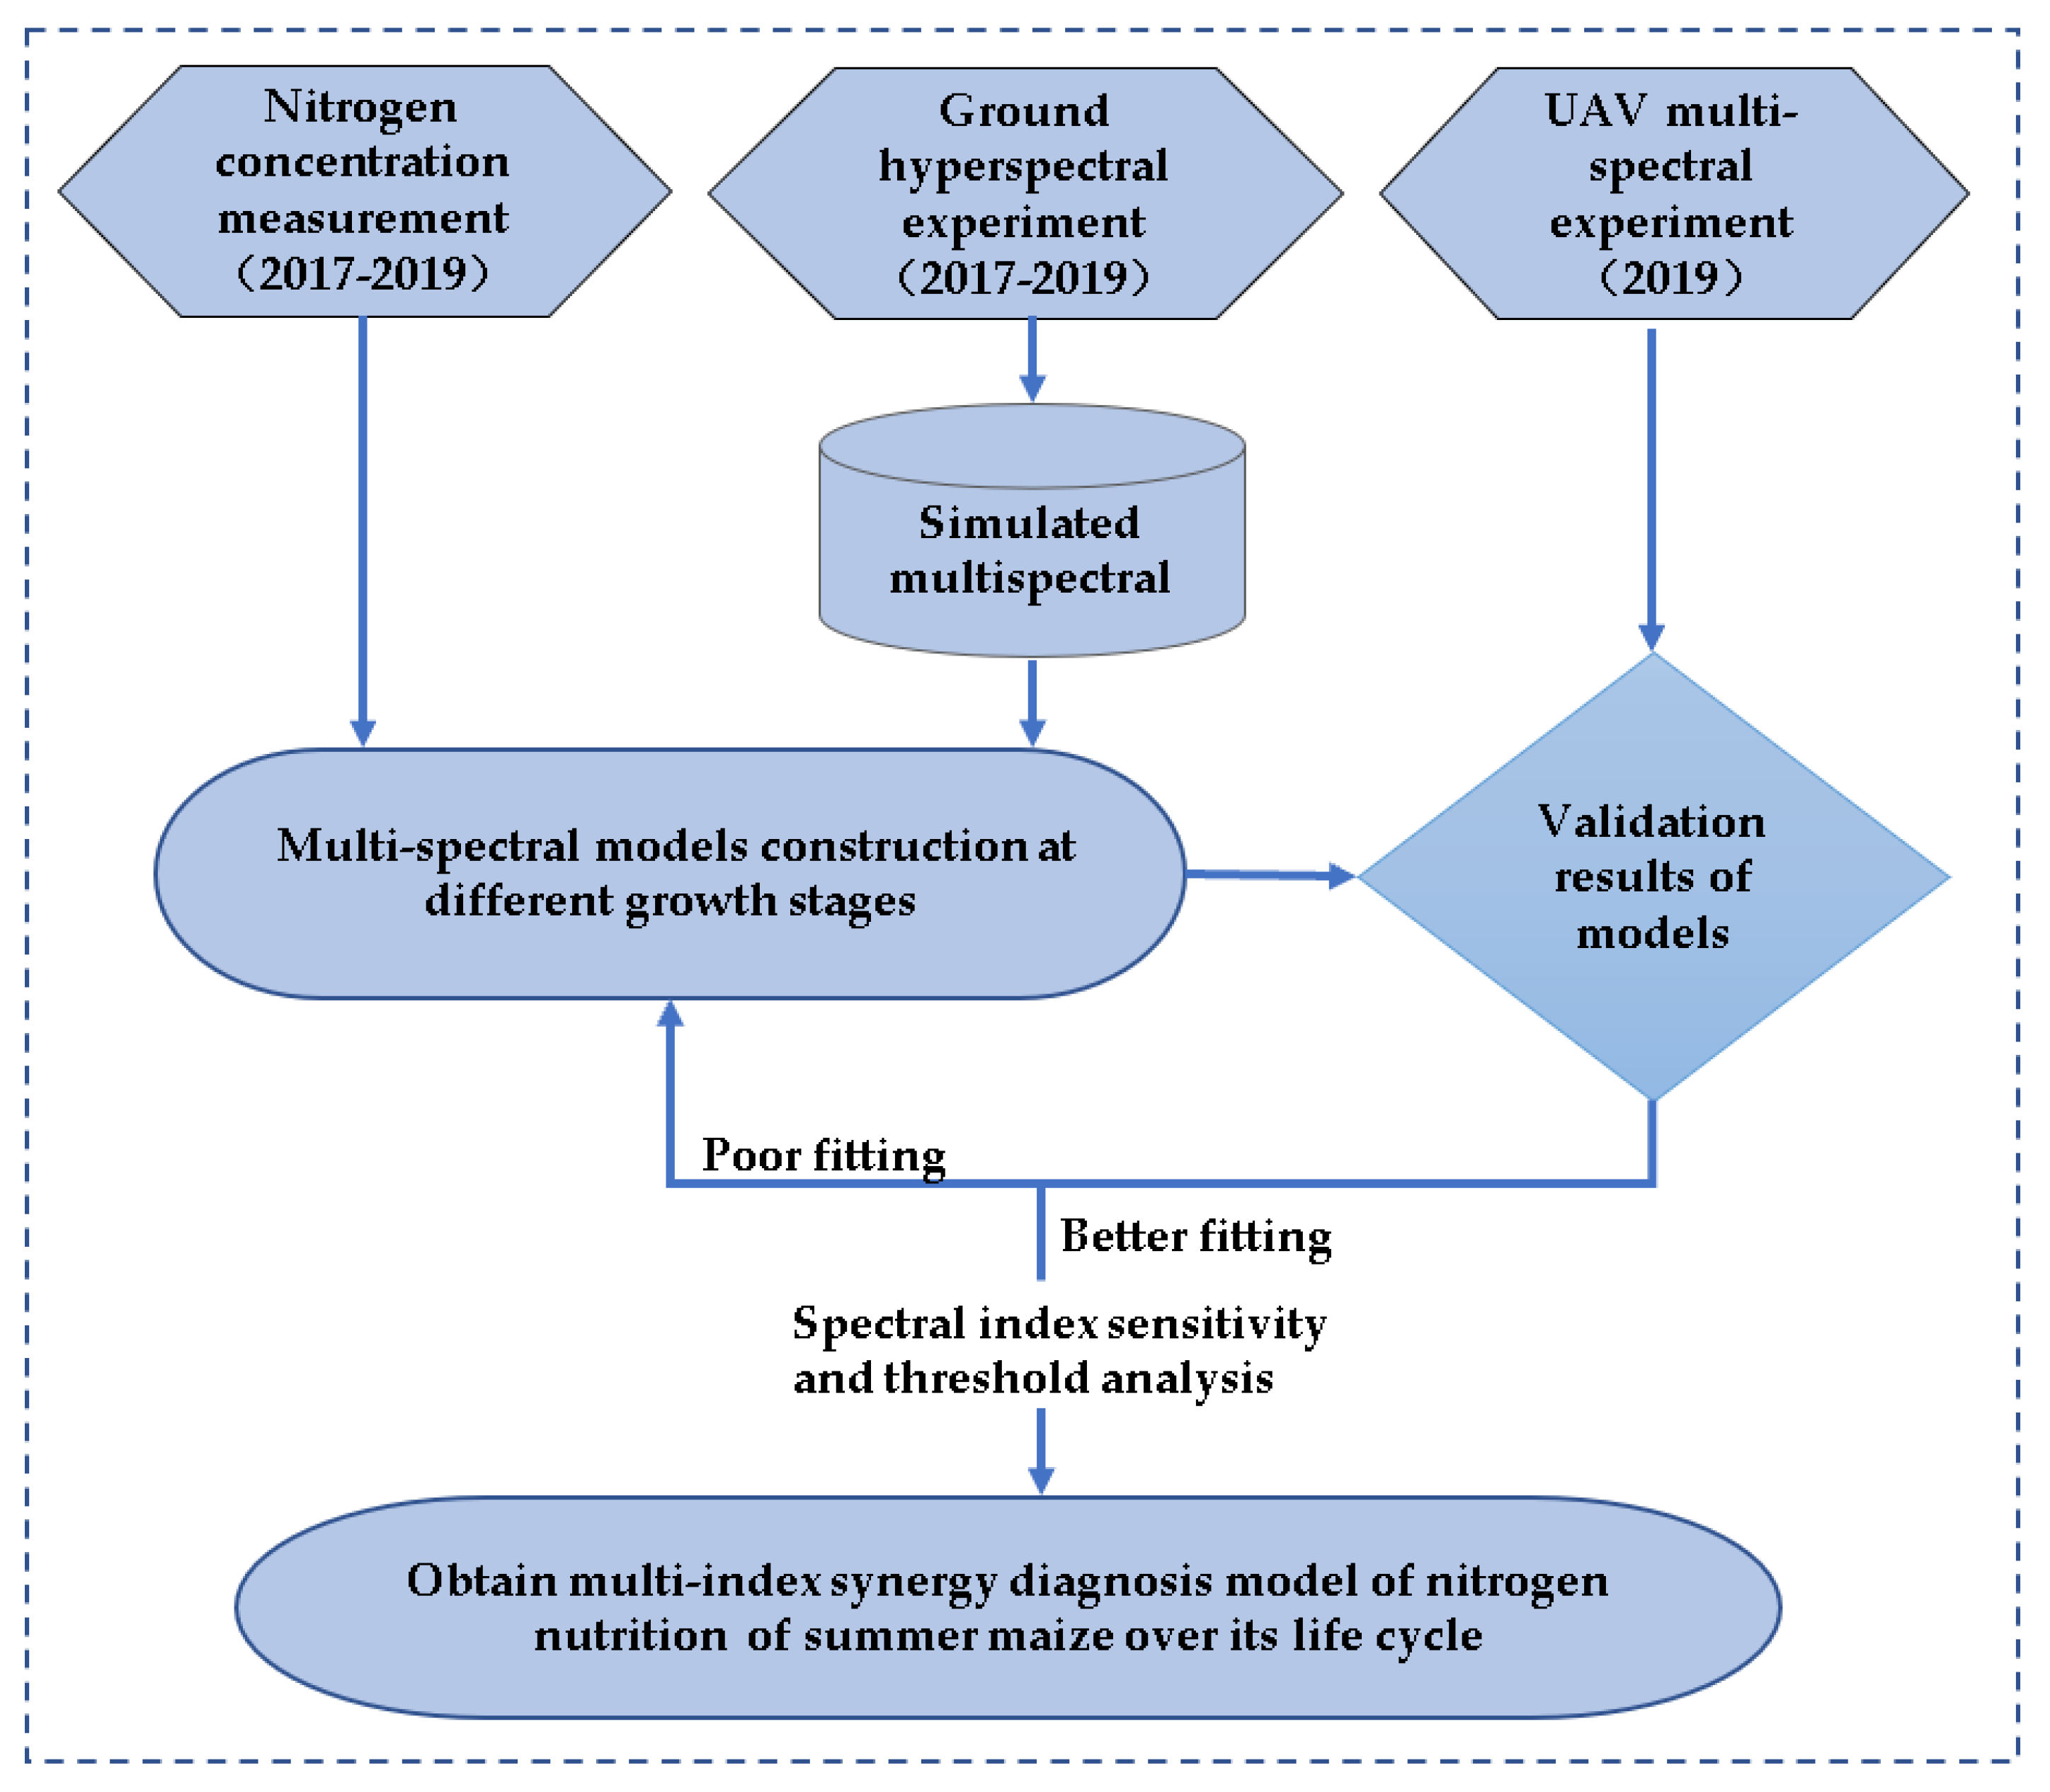
2.5. Diagnosis Flow of Nitrogen Nutrition Status
3. Results
3.1. Model Construction and Optimization
3.2. Model Evaluation
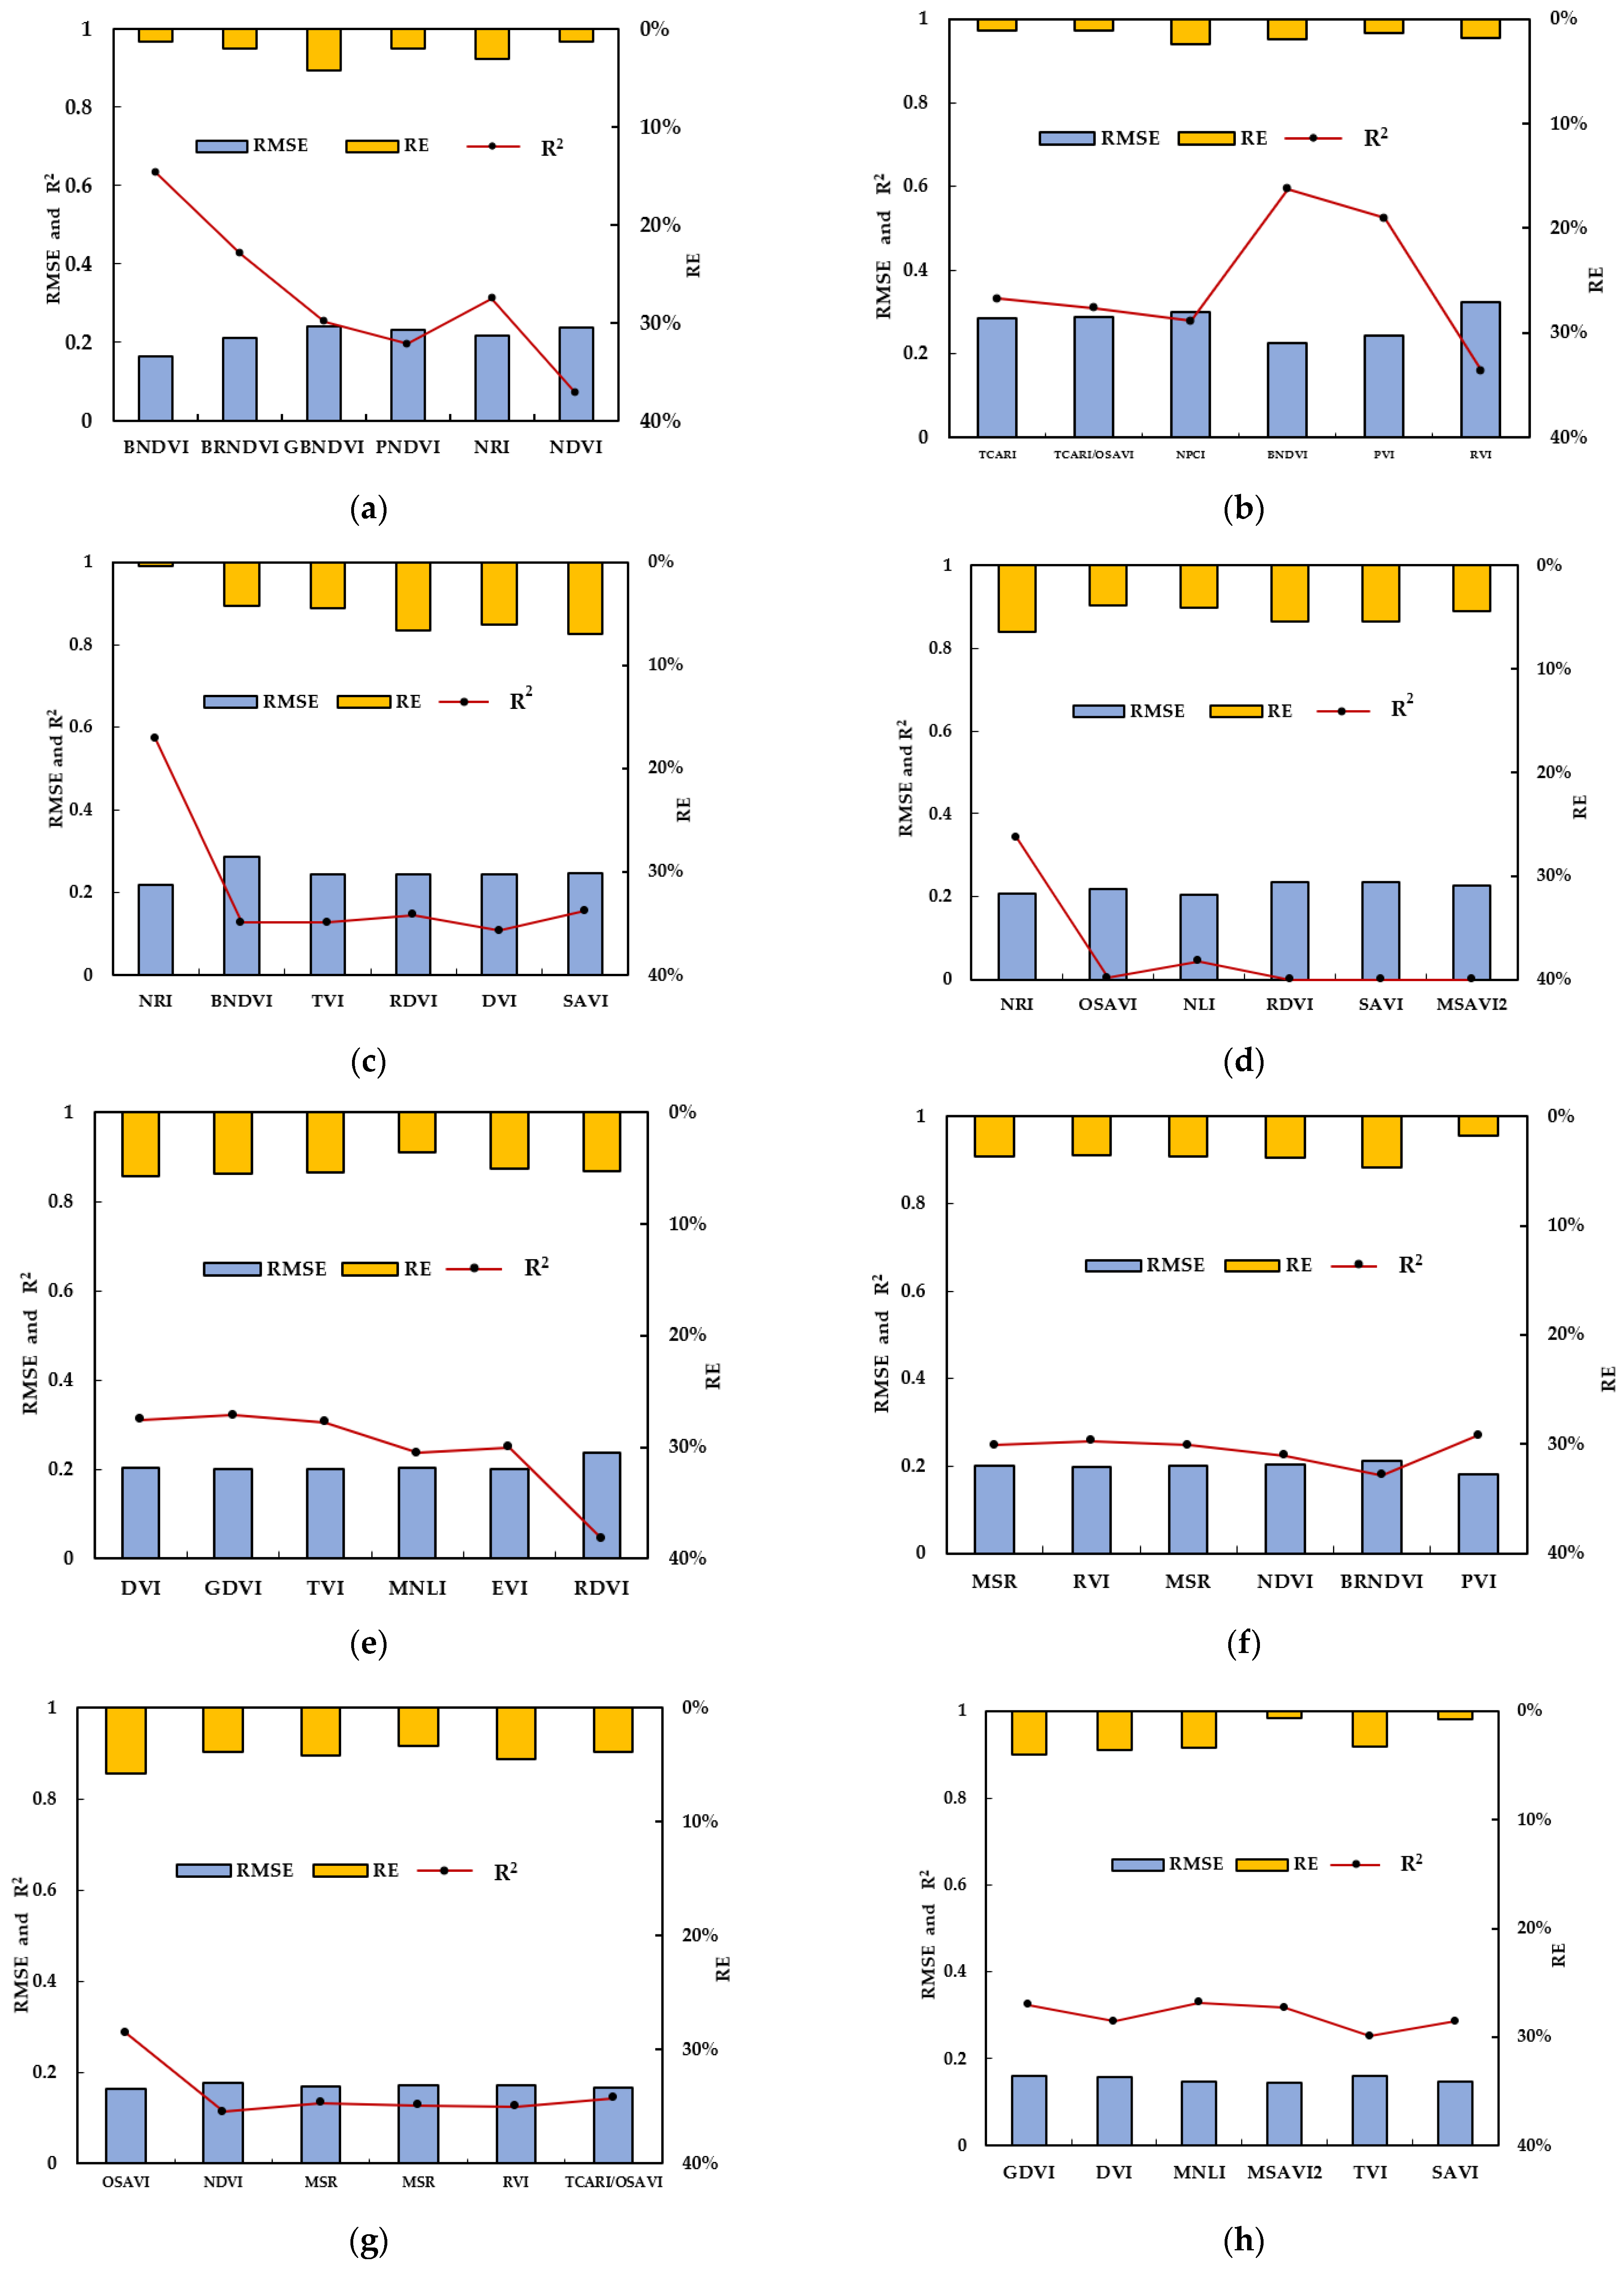
3.2.1. Evaluation of Eight-Stage Model
3.2.2. Evaluation of Optimized Four-Stage Model
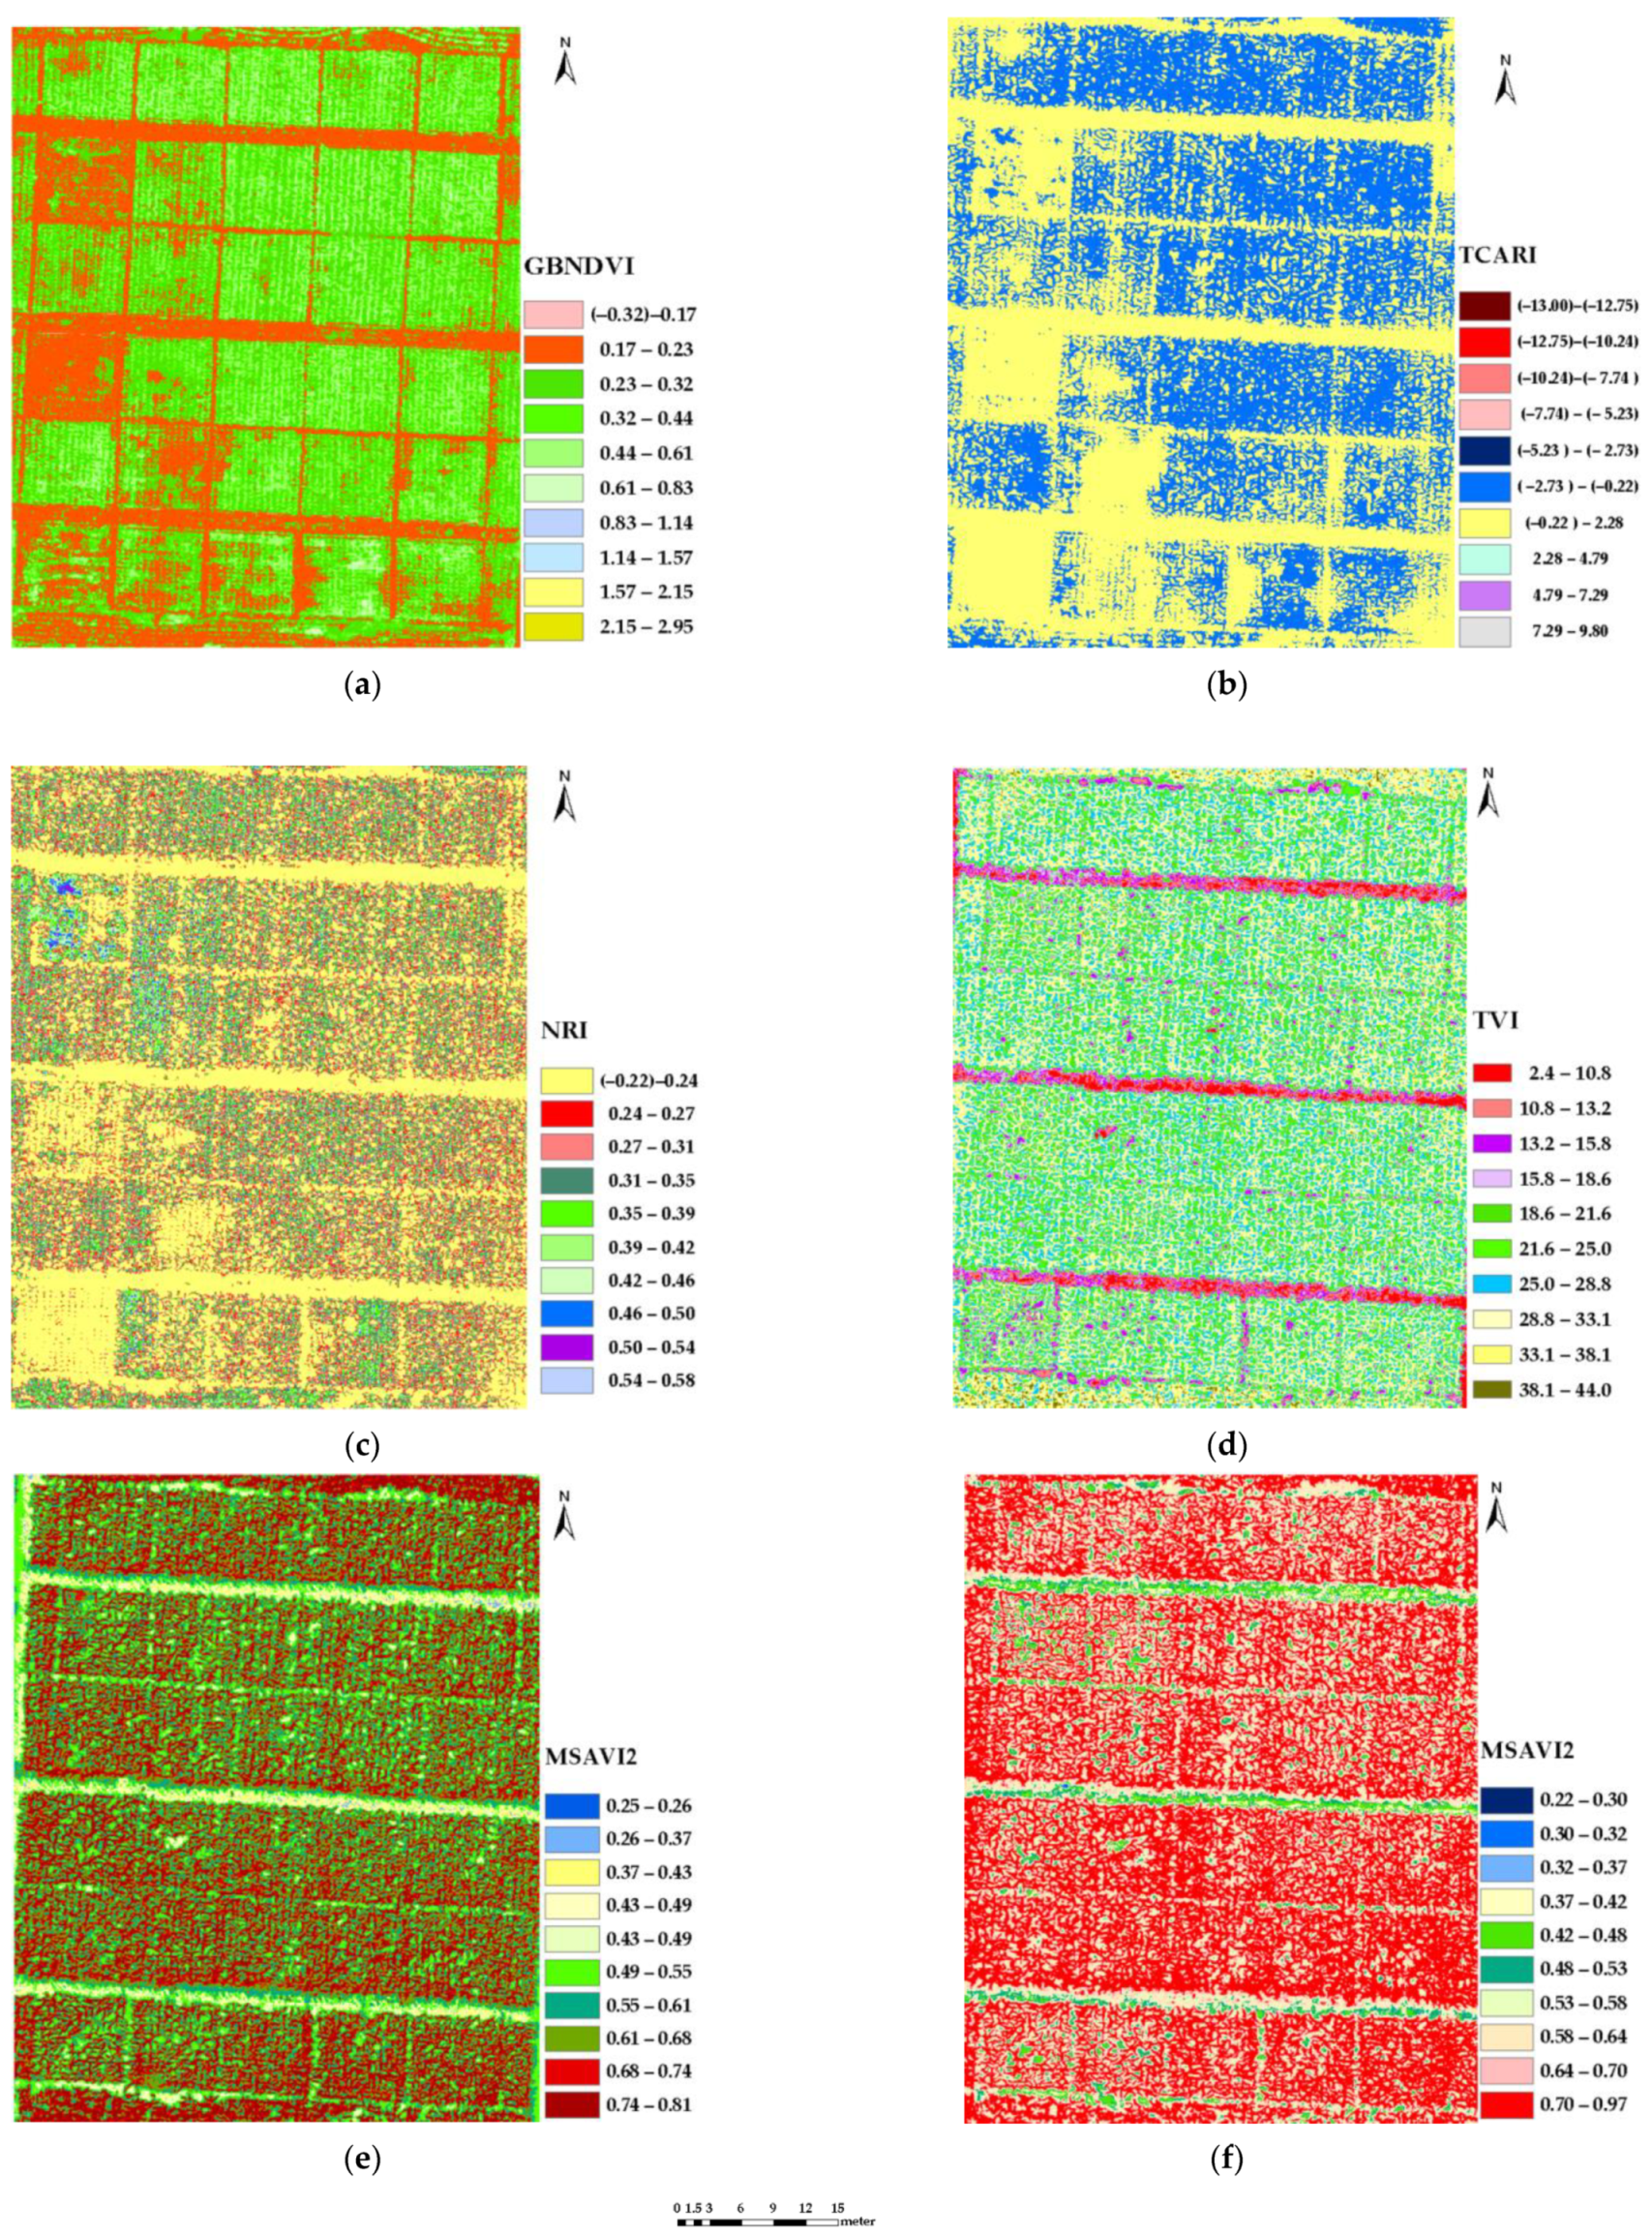
3.3. Model Inversion Results Based on UAV Images
4. Discussion
4.1. Difficulties and Rationality of Experiment Implementation
4.2. Sensitivity, Validity, and Applicability of the Model
4.3. Feasibility of Data Acquisition
4.4. Limitations of the Method and the Focus of Future Work
5. Conclusions
Supplementary Materials
Author Contributions
Funding
Institutional Review Board Statement
Informed Consent Statement
Data Availability Statement
Acknowledgments
Conflicts of Interest
References
- Duarte, A.G.; Longstaffe, F.J.; Way, D.A. Nitrogen fertilisation influences low CO2 effects on plant performance. Funct. Plant Biol. 2020, 47, 134–144. [Google Scholar] [CrossRef]
- Dier, M.; Hüther, L.; Schulze, W.X.; Erbs, M.; Koehler, P.; Weigel, H.-J.; Manderscheid, R.; Zörb, C. Elevated atmospheric CO2 concentration has limited effect on wheat grain quality regardless of nitrogen supply. J. Agric. Food Chem. 2020, 68, 3711–3721. [Google Scholar] [CrossRef]
- Córcoles, H.L.; Juan, J.; Picornell, M.R. Biomass production and yield in irrigated maize at different rates of nitrogen in a semi-arid climate. NJAS-Wang J. Life Sci. 2020, 92, 10032. [Google Scholar] [CrossRef]
- Dong, K.W.; Riley, W.J.; Wu, Y. More fertilizer and impoverished roots required for improving wheat yields and profits under climate change. Field Crops Res. 2020, 249, 107756. [Google Scholar]
- Gao, Y.; Liang, A.; Zhang, Y.; Mclaughlin, N.; Fan, R. Dynamics of microbial biomass, nitrogen mineralization and crop uptake in response to placement of maize residue returned to chinese mollisols over the maize growing season. Atmosphere 2021, 12, 1166. [Google Scholar] [CrossRef]
- Noh, H.; Zhang, Q.; Shin, B.; Han, S.; Feng, L. A neural network model of maize crop nitrogen stress assessment for a multi-spectral imaging sensor. Biosyst. Eng. 2006, 94, 477–485. [Google Scholar] [CrossRef]
- Hatfield, J.L.; Gitelson, A.A.; Schepers, J.S.; Walthall, C.L. Application of spectral remote sensing for agronomic decisions. Agron. J. 2008, 100, 117–131. [Google Scholar] [CrossRef] [Green Version]
- Lu, D.J.; Lu, F.F.; Pan, J.X.; Cui, Z.N.; Zou, C.Q.; Chen, X.P.; He, M.; Wang, Z. The effects of cultivar and nitrogen management on wheat yield and nitrogen use efficiency in the North China Plain. Field Crops Res. 2015, 171, 157–164. [Google Scholar] [CrossRef]
- Meng, Q.F.; Peng, H.; Wu, L.; Chen, X.P.; Cui, Z.L.; Zhang, F.S. Understanding production potentials and yield gaps in intensive maize production in China. Field Crops Res. 2013, 143, 91–97. [Google Scholar] [CrossRef] [Green Version]
- Wang, H.; Guo, Z.; Shi, Y.; Wang, H.G.; Zhen, W. Impact of tillage practices on nitrogen accumulation and translocation in wheat and soil nitrate-nitrogen leaching in drylands. Soil Till. Res. 2015, 153, 20–27. [Google Scholar] [CrossRef]
- Serrano, L.; Filella, I.; Penuelas, J. Remote sensing of biomass and yield of winter wheat under different nitrogen supplies. Crop. Sci. 2000, 40, 723–731. [Google Scholar] [CrossRef] [Green Version]
- Luo, J.; Ma, R.; Feng, H.; Li, X. Estimating the total nitrogen concentration of reed canopy with hyperspectral measurements considering a non-uniform vertical nitrogen distribution. Remote Sens. 2016, 8, 789. [Google Scholar] [CrossRef] [Green Version]
- Huang, W.; Yang, Q.; Pu, R.; Yang, S. Estimation of nitrogen vertical distribution by bi-directional canopy reflectance in winter wheat. Sensors 2004, 14, 20347–20359. [Google Scholar] [CrossRef] [PubMed] [Green Version]
- Kayad, A.; Sozzi, M.; Gatto, S.; Whelan, B.; Sartori, L.; Marinello, F. Ten years of corn yield dynamics at field scale under digital agriculture solutions: A case study from north Italy. Comput. Electron. Agric. 2021, 185, 106126. [Google Scholar] [CrossRef]
- Wei, P.F.; Xu, X.G.; Li, Z.Y.; Yang, G.J.; Li, Z.H.; Feng, H.K.; Chen, G.; Fan, L.L.; Wang, Y.L.; Liu, S.B. Remote sensing estimation of nitrogen content in summer maize leaves based on multispectral images of UAV. Trans. Chin. Soc. Agric. Eng. 2019, 35, 126–133. (In Chinese) [Google Scholar]
- Jeong, H.; Bhattarai, R. Exploring the effects of nitrogen fertilization management alternatives on nitrate loss and crop yields in tile-drained fields in Illinois. J. Environ. Manag. 2018, 213, 341–352. [Google Scholar] [CrossRef] [PubMed]
- Colorado, J.D.; Cera-Bornacelli, N.; Caldas, J.S.; Petro, E.; Jaramillo-Botero, A. Estimation of nitrogen in rice crops from UAV-captured images. Remote Sens. 2020, 12, 3396. [Google Scholar] [CrossRef]
- Corti, M.; Cavalli, D.; Cabassi, G.; Vigoni, A.; Degano, L.; Gallina, P.M. Application of a low-cost camera on a UAV to estimate maizenitrogen-related variables. Precis. Agric. 2019, 20, 675–696. [Google Scholar] [CrossRef]
- Olfs, H.-W.; Blankenau, K.; Brentrup, F.; Jasper, J.; Link, A.; Lammel, J. Soil- and plant-based nitrogen-fertilizer recommendations in arable farming. J. Plant Nutr. Soil. Sci. 2005, 168, 414–431. [Google Scholar] [CrossRef]
- Li, L.T.; Wang, S.Q.; Ren, T.; Wei, Q.Q.; Ming, J.; Li, J.; Li, X.; Cong, R.; Lu, J. Ability of models with effective wavelengths to monitor nitrogen and phosphorus status of winter oilseed rape leaves using in situ canopy spectroscopy. Field Crops Res. 2018, 215, 173–186. [Google Scholar] [CrossRef]
- Chen, P.F.; Haboudane, D.; Tremblay, N.; Wang, J.H.; Vigneault, P.; Li, B.G. New spectral indicator assessing the efficiency of crop nitrogen treatment in corn and wheat. Remote Sens. Environ. 2010, 114, 1987–1997. [Google Scholar] [CrossRef]
- Wójtowicz, M.; Wójtowicz, A.; Piekarczyk, J. Application of remote sensing methods in agriculture. Commun. Biol. Crop Sci. 2016, 11, 31–50. [Google Scholar]
- Li, F.; Miao, Y.; Hennig, S.D.; Gnyp, M.L.; Chen, X.P.; Jia, L.L.; Bareth, G. Evaluating hyperspectral vegetation indices for estimating nitrogen concentration of winter wheat at different growth stages. Precis. Agric. 2010, 11, 335–357. [Google Scholar] [CrossRef]
- Lulu, M.; Xin, L.; Ze, Z. Establishment of nitrogen nutrition diagnosis model for drip-irrigation cotton based on critical nitrogen concentration. Trans. Chin. Soc. Agric. Eng. 2018, 49, 277–284. (In Chinese) [Google Scholar]
- Mistele, B.; Schmidhalter, U. Estimating the nitrogen nutrition index using spectral canopy reflectance measurements. Eur. J. Agron. 2008, 29, 184–190. [Google Scholar] [CrossRef]
- Bagheri, N.; Ahmadi, H.; Alavipanah, S.K.; Omid, M. Multispectral remote sensing for site-specific nitrogen fertilizer management. Pesqui. Agropecu. Bras. 2013, 48, 1394–1401. [Google Scholar] [CrossRef] [Green Version]
- Sims, D.A.; Gamon, J.A. Relationships between leaf pigment content and spectral reflectance across a wide range of species, leaf structures and developmental stages. Remote Sens. Environ. 2002, 81, 337–354. [Google Scholar] [CrossRef]
- Zhang, J.J.; Du, P.; Guo, J.B.; Cao, R.; Zhang, J.; Ma, X.M. Study of critical nitrogen concentration model and nitrogen nutrition diagenosis in winter wheat with different N efficiency. J. Triticeae Crops 2017, 11, 86–94. (In Chinese) [Google Scholar]
- Palka, M.; Manschadi, A.M.; Koppensteiner, L.; Neubauer, T.; Fitzgerald, G.J. Evaluating the performance of the CCCI-CNI index for estimating N status of winter wheat. Eur. J. Agron. 2021, 130, 126346. [Google Scholar] [CrossRef]
- Nigon, T.J.; Yang, C.; Paiao, G.D.; Mulla, D.J.; Fernández, F.G. Prediction of early season nitrogen uptake in maize using high-resolution aerial hyperspectral imagery. Remote Sens. 2020, 12, 1234. [Google Scholar] [CrossRef] [Green Version]
- Geipel, J.; Link, J.; Wirwahn, J.A.; Claupein, W. A programmable aerial multispectral camera system for in-season crop biomass and nitrogen content estimation. Agriculture 2016, 6, 4. [Google Scholar] [CrossRef] [Green Version]
- Huang, Y.; Thomson, S.J.; Lan, Y.; Maas, S.J. Multispectral imaging systems for airborne remote sensing to support agricultural production management. Int. J. Agric. Biol. Eng. 2010, 3, 50–62. [Google Scholar]
- Ge, H.; Xiang, H.; Ma, F.; Li, Z.; Du, C. Estimating plant nitrogen concentration of rice through fusing vegetation indices and color moments derived from UAV-RGB images. Remote Sens. 2021, 13, 1620. [Google Scholar] [CrossRef]
- Wang, Y.P.; Chang, Y.C.; Shen, Y. Estimation of nitrogen status of paddy rice at vegetative phase using unmanned aerial vehicle based multispectral imagery. Precis. Agric. 2021, 23, 1–17. [Google Scholar] [CrossRef]
- Tao, H.; Feng, H.; Xu, L.; Miao, M.; Yang, G.; Yang, X. Estimation of the yield and plant height of winter wheat using UAV-based hyperspectral images. Sensors 2020, 20, 1231. [Google Scholar] [CrossRef] [Green Version]
- Gilliot, J.M.; Michelin, J.; Hadjard, D.; Houot, S. An accurate method for predicting spatial variability of maize yield from UAV-based plant height estimation: A tool for monitoring agronomic field experiments. Precis. Agric. 2021, 22, 897–921. [Google Scholar] [CrossRef]
- Caturegli, L.; Corniglia, M.; Gaetani, M.; Grossi, N.; Magni, S.; Migliazzi, M.; Angelini, L.; Mazzoncini, M.; Silvestri, N.; Fontanelli, M. Unmanned aerial vehicle to estimate the nitrogen status of turfgrasses. PLoS ONE 2016, 11, e0158268. [Google Scholar]
- Liu, H.Y.; Zhu, H.; Wang, P. Quantitative modeling for leaf nitrogen content of winter wheat using UAV-based hyperspectral data. Int. J. Remote Sens. 2017, 38, 2117–2134. [Google Scholar] [CrossRef]
- Hunt, E.R.; Horneck, D.A.; Spinelli, C.B.; Turner, R.W.; Bruce, A.E.; Gadler, D.J. Monitoring nitrogen status of potatoes using small unmanned aerial vehicles. Precis. Agric. 2018, 19, 314–333. [Google Scholar] [CrossRef]
- Singh, S.K.; Houx, J.H.; Maw, M.J.W.; Fritschi, F.B. Assessment of growth, leaf N concentration and chlorophyll content of sweet sorghum using canopy reflectance. Field Crops Res. 2017, 209, 47–57. [Google Scholar] [CrossRef]
- Sylvain, J.; Fabienne, M.; Ryad, B.; Nathalie, G. Retrieving LAI, chlorophyll and nitrogen contents in sugar beet crops from multiangular optical remote sensing: Comparison of veg- etation indices and PROSAIL inversion for field phenotyping. Field Crops Res. 2017, 210, 33–46. [Google Scholar]
- Liu, C.H.; Ma, W.Y.; Chen, Z.C.; Wang, C.Y.; Lu, J.J.; Yue, X.Z.; Wang, Z.; Fang, Z.; Miao, Y. Nitrogen nutrition diagnosis of winter wheat based on the UAV remote sensing. J. Henan Poly. Univ. 2018, 37, 45–53. (In Chinese) [Google Scholar]
- Swain, K.C.; Thomson, S.J.; Jayasuriya, H.P. Adoption of an unmanned helicopter for low-altitude remote sensing to estimate yield and total biomass of a rice crop. Trans. ASABE 2010, 53, 21–27. [Google Scholar] [CrossRef] [Green Version]
- Gabriel, J.L.; Zarco-Tejada, P.J.; López-Herrera, P.J.; Perez-Martín, E.; Alonso-Ayuso, M.; Quemada, M. Airborne and ground level sensors for monitoring nitrogen status in a maize crop. Biosyst. Eng. 2017, 160, 124–133. [Google Scholar] [CrossRef]
- Diker, K.; Bausch, W.C. Potential Use of Nitrogen Reflectance Index to estimate Plant Parameters and Yield of Maize. Biosyst. Eng. 2003, 85, 437–447. [Google Scholar] [CrossRef]
- He, D.; Wang, E.; Wang, J.; Robertson, M.J. Data requirement for effective calibration of process-based crop models. Agric. For. Metorol. 2017, 234, 136–148. [Google Scholar] [CrossRef]
- Mittermayer, M.; Gilg, A.; Maidl, F.X.; Ntscher, L.; Hülsbergen, K.J. Site-specific nitrogen balances based on spatially variable soil and plant properties. Precis. Agric. 2021, 22, 1416–1436. [Google Scholar] [CrossRef]
- Huang, S.; Miao, Y.; Yuan, F.; Martin, G.; Yao, Y.; Qiang, C. Potential of rapideye and worldview-2 satellite data for improving rice nitrogen status monitoring at different growth stages. Remote Sens. 2017, 9, 227. [Google Scholar] [CrossRef] [Green Version]
- Li, F.L.; Chang, Q.R.; Shen, J.; Wang, L. Remote sensing estimation of winter wheat leaf nitrogen content based on GF-1 satellite data. Trans. Chin. Soc. Agric. Eng. 2016, 32, 157–164. (In Chinese) [Google Scholar]
- Cao, Q.; Miao, Y.M.; Li, F.; Gao, X.W.; Liu, B.; Lu, D.J.; Chen, X.P. Developing a new crop circle active canopy sensor-based precision nitrogen management strategy for winter wheat in the North China Plain. Precis. Agric. 2016, 18, 2–18. [Google Scholar] [CrossRef]
- Chen, J.M. Evaluation of vegetation indices and modified simple ratio for boreal applications. Can. J. Remote Sens. 1996, 22, 229–242. [Google Scholar] [CrossRef]
- Daughtry, C.S.T.; Walthall, C.L.; Kim, M.S. Estimating corn leaf chlorophyll concentration from leaf and canopy reflectance. Remote Sens. Environ. 2000, 74, 229–239. [Google Scholar] [CrossRef]
- Tucker, C.J. Red and photographic infrared linear combinations for monitoring vegetation. Remote Sens. Environ. 1979, 8, 127–150. [Google Scholar] [CrossRef] [Green Version]
- Gitelson, A.A.; Kaufman, Y.J.; Stark, R.; Rundquista, D. Novel algorithms for remote estimation of vegetation fraction. Remote Sens. Environ. 2002, 80, 76–87. [Google Scholar] [CrossRef] [Green Version]
- Gong, P.; Pu, R.; Biging, G.S.; Larrieu, M.R. Estimation of forest leaf area index using vegetation indices derived from Hyperion hyperspectral data. IEEE Trans. Geosci. Remote Sens. 2003, 41, 1355–1362. [Google Scholar] [CrossRef] [Green Version]
- Haboudane, D.; Miller, J.R.; Tremblay, N.; Zarco-Tejada, P.J.; Dextraze, L. Integrated narrow—Band vegetation indices for prediction of crop chlorophyll content for application to precision agriculture. Remote Sens. Environ. 2002, 81, 416–426. [Google Scholar] [CrossRef]
- Haboudane, D.; Miller, J.R.; Pattey, E.; Zarco-Tejada, P.J.; Strachan, I.B. Hyperspectral vegetation indices and novel algorithms for predicting green LAI of crop canopies: Modeling and validation in the context of precision agriculture. Remote Sens. Environ. 2004, 90, 337–352. [Google Scholar] [CrossRef]
- Huete, A.R. A soil adjusted vegetation index SAVI. Remote Sens. Environ. 1988, 25, 295–309. [Google Scholar] [CrossRef]
- Jordan, C.F. Derivation of leaf—Area index from quality of light on the forest floor. Ecology 1969, 50, 663–666. [Google Scholar] [CrossRef]
- Liu, H.Q.; Huete, A.A. Feedback-based modification of the NDVI to minimize canopy background and atmospheric noise. IEEE Trans. Geosci. Remote Sens. 1995, 33, 457–465. [Google Scholar] [CrossRef]
- Navarro, G.; Caballero, M.; Silva, G.; Parra, P.C.; Águeda, V.; Caldeira, R.M.A. Evaluation of forest fire on Madeira Island using Sentinel-2A MSI imagery. Int. J. Appl. Earth. OBS 2017, 58, 97–106. [Google Scholar] [CrossRef] [Green Version]
- Penuelas, J.; Gamon, J.A.; Fredeen, A.L.; Merino, J.; Field, C.B. Reflectance indices associated with physiological changes in nitrogen and water-limited sunflower leaves. Remote Sens. Environ. 1994, 48, 135–146. [Google Scholar] [CrossRef]
- Qi, J.; Chehbouni, A.; Huete, A.R.; Kerr, Y.H.; Sorooshian, S. A modified soil adjusted vegetation index (MSAVI). Remote Sens. Environ. 1994, 48, 119–126. [Google Scholar] [CrossRef]
- Rouse, J.W.; Haas, R.H.; Schell, J.A.; Deering, D.W.; Harlan, J.C. Monitoring the vernal advancements and retrogradation of natural vegetation. NASA/GSFCT Type III Final. Rep. 1974, 1. Available online: https://ntrs.nasa.gov/citations/19730017588 (accessed on 27 November 2021).
- Schleicher, T.D.; Bausch, W.C.; Delgado, J.A.; Ayer, P.D. Evaluation and refinement of the nitrogen reflectance index (NRI) for site specific fertilizer management. In Proceedings of the 2001 ASAE Annual International Meeting, Sacramento, CA, USA, 30 July–1 August 2001. [Google Scholar]
- Li, X.C.; Xu, X.G.; Bao, Y.S.; Huang, W.J.; Luo, J.H.; Dong, Y.Y.; Song, X.Y.; Wang, J.H. Retrieving LAI of Winter Wheat Based on Sensitive Vegetation Index by the Segmentation Method. Sci. Agric. 2012, 45, 3486–3496. (In Chinese) [Google Scholar]
- Wang, F.M.; Huang, J.F.; Tang, Y.l.; Wang, X.Z. New vegetation index and its application in estimating leaf area index of rice. Chin. J. Rice Sci. 2007, 21, 159–166. (In Chinese) [Google Scholar] [CrossRef]
- Viña, A.; Gitelson, A.A.; Nguy-Robertson, A.L.; Peng, Y. Comparison of different vegetation indices for the remote assessment of green leaf area index of crops. Remote Sens. Environ. 2011, 115, 3468–3478. [Google Scholar] [CrossRef]
- Fan, L.; Zhao, J.; Xu, X.; Liang, D.; Yang, G.; Feng, H.; Yang, H.; Wang, Y.; Chen, G.; Wei, P. Hyperspectral-Based Estimation of Leaf Nitrogen Content in Corn Using Optimal Selection of Multiple Spectral Variables. Sensors 2019, 19, 2898. [Google Scholar] [CrossRef] [Green Version]
- Torino, M.S.; Ortiz, B.V.; Fulton, J.P.; Balkcom, K.S.; Wood, C.W. Evaluation of vegetation indices for early assessment of corn status and yield potential in the southeastern united states. Agron. J. 2014, 106, 1389–1401. [Google Scholar] [CrossRef]
- Li, F.; Miao, Y.; Feng, G.; Yuan, F.; Yue, S.; Gao, X.; Liu, Y.; Liu, B.; Ustin, S.L.; Chen, X. Improving estimation of summer maize nitrogen status with red edge-based spectral vegetation indices. Field Crops Res. 2014, 157, 111–123. [Google Scholar] [CrossRef]
- Osco, L.P.; José, M.J.; Ramos, A.P.M.; Furuya, D.E.G.; Teodoro, P.E. Leaf nitrogen concentration and plant height prediction for maize usingUAV-based multispectral imagery and machine learning techniques. Remote Sens. 2020, 12, 3237. [Google Scholar] [CrossRef]
- Lu, J.; Cheng, D.; Geng, C.; Zhang, Z.; Xiang, Y.; Hu, T. Combining plant height, canopy coverage and vegetation index from uav-based rgb images to estimate leaf nitrogen concentration of summer maize. Biosyst. Eng. 2021, 202, 42–54. [Google Scholar] [CrossRef]
- Sun, J.Y.; Huang, Y.; Cao, H.X.; Jiao, Y.G. Correlation analysis between aboveground biomass of rape andcanopy spectral vegetation index. Guangxi Agric. Sci. 2009, 40, 716–723. (In Chinese) [Google Scholar]
- Wang, J.B.; Zhang, J.; Ma, Y. Study on the above ground vegetation biomass estimation model basedon GF-1 WFV satellite image in the Yellow River estuary wetland. Acta Laser Biol. Sin. 2014, 23, 604–608. (In Chinese) [Google Scholar]
- Cohen, Y.; Alchanatis, V.; Zusman, Y.; Dar, Z.; Onfil, D.J.; Karnieli, A.; Zilberman, A.; Moulin, A.; Ostrovsky, V.; Levi, A.; et al. Leaf nitrogen estimation in potato based on spectral data and on simulated bands of the VENμS satellite. Precis. Agric. 2010, 11, 520–537. [Google Scholar] [CrossRef]
- Wang, W.; Yao, X.; Yao, X.; Tian, Y.; Liu, X.; Ni, J.; Cao, W.; Zhu, Y. Estimating leaf nitrogen concentration with three-band vegetation indices in rice and wheat. Field Crops Res. 2012, 129, 90–98. [Google Scholar] [CrossRef]


| Number | Multispectral Index | Formula | Literature Source |
|---|---|---|---|
| 1 | GOSAVI | (1 + 0.16) (Rnir − Rg)/(Rnir + Rg + 0.16) | [50] |
| 2 | MSR1 | [(Rnir/Rr) − 1]/[ (Rnir/Rr)0.5 + 1] | [51] |
| 3 | DVI | Rnir − Rr | [52] |
| 4 | GDVI | Rnir − Rg | [53] |
| 5 | VARI | (Rg − Rr)/(Rg + Rr − Rb) | [54] |
| 6 | GRVI | (Rnir/Rg) − 1 | [54] |
| 7 | MNLI | (1.5 R2nir − 1.5 Rg)/(R2nir + Rr + 0.5) | [55] |
| 8 | OSAVI | 1.16 (Rnir − Rr)/(0.16 + Rnir + Rr) | [56] |
| 9 | TCARI | 3 [(Rnir − Rr) − 0.2 (Rnir − Rg) (Rnir/Rr)] | |
| 10 | TCARI/OSAVI | TCARI/OSAVI | |
| 11 | RDVI | (Rnir − Rr)/(Rnir + Rr)0.5 | [57] |
| 12 | TVI | 0.5 [120 (Rnir − Rg)−200 (Rr − Rg)] | |
| 13 | SAVI | 1.5 (Rnir − Rr)/(Rnir + Rr + 0.5) | [58] |
| 14 | RVI | Rnir/Rr | [59] |
| 15 | EVI | 2.5 (Rnir − Rr)/(Rnir + 6 Rr − 7.5 Rb + 1) | [60] |
| 16 | GNDVI | (Rnir − Rg)/(Rnir + Rg) | [61] |
| 17 | NPCI | (Rr − Rb)/(Rr + Rb) | [62] |
| 18 | MSAVI2 | 0.5 [(2 Rnir + 1) − [(2 Rnir + 1)2 − 8 (Rnir − Rr)]0.5] | [63] |
| 19 | NDVI | (Rnir − Rr)/(Rnir + Rr) | [64] |
| 20 | NRI | (Rg − Rr)/(Rg + Rr) | [65] |
| 21 | NLI | (R2nir + Rr)/(R2nir − Rr) | [66] |
| 22 | BNDVI | (Rnir − Rb)/(Rnir + Rb) | [67] |
| 23 | BRNDVI | [Rnir − (Rr + Rb)]/[Rnir + (Rg + Rb)] | |
| 24 | GBNDVI | [Rnir − (Rg + Rb)]/[Rnir + (Rg + Rb)] | |
| 25 | GRNDVI | [Rnir − (Rg + Rr)]/[Rnir + (Rg + Rr)] | |
| 26 | PNDVI | [Rnir − (Rg + Rr + Rb)]/[Rnir + (Rg + Rr + Rb)] |
| Growth Stage | Multispectral Index | Diagnosis Model | R2 |
|---|---|---|---|
| V6 | GBNDVI | y = −1.112ln(x) + 2.963 | 0.643 |
| BNDVI | y = −3.686x + 6.488 | 0.571 | |
| BRNDVI | y = −1.194ln(x) + 2.927 | 0.536 | |
| PNDVI | y = −0.560ln(x) + 2.940 | 0.472 | |
| NRI | y = −2.993x + 4.297 | 0.547 | |
| NDVI | y = −1.997ln(x) + 3.101 | 0.543 | |
| V10 | TCARI | y = −0.0998x + 2.228 | 0.552 |
| BNDVI | y = 4.8586x − 1.6217 | 0.448 | |
| TCARI/OSAVI | y = −0.0874x + 2.209 | 0.423 | |
| PVI | y = 12.764x + 10.388 | 0.372 | |
| NPCI | y = 1.725x + 2.660 | 0.295 | |
| RVI | y = 2.118e0.0115x | 0.274 | |
| V12 | NRI | y = −5.833x + 4.457 | 0.587 |
| TVI | y = 4.021e−0.018x | 0.395 | |
| DVI | y = 4.029e−1.153x | 0.377 | |
| RDVI | y = 7.343e−1.753x | 0.371 | |
| SAVI | y = 8.028e−1.790x | 0.353 | |
| BNDVI | y = −6.90ln(x) + 1.545 | 0.340 | |
| VT | NRI | y = −2.816x + 2.121 | 0.424 |
| OSAVI | y = −2.525x + 3.400 | 0.334 | |
| NLI | y = −1.414x + 2.490 | 0.331 | |
| RDVI | y = 2.835e−1.026x | 0.323 | |
| SAVI | y = 2.956e−1.042x | 0.315 | |
| MSAVI2 | y = −1.414x + 2.489 | 0.309 | |
| R1 | DVI | y = 2.983e−1.992x | 0.328 |
| TVI | y = 2.933e−0.031x | 0.343 | |
| GDVI | y = 3.035e−2.170x | 0.297 | |
| EVI | y = 3.563e−1.379x | 0.235 | |
| MNLI | y = −1.889x + 1.870 | 0.229 | |
| RDVI | y = 4.061e−1.941x | 0.227 | |
| R2 | NDVI | y = 3.544x3.731 | 0.376 |
| MSR1 | y = 0.632x1.290 | 0.367 | |
| MSR2 | y = 0.412x1.425 | 0.367 | |
| RVI | y = 0.167x1.014 | 0.363 | |
| BRNDVI | y = 3.052x1.708 | 0.343 | |
| PVI | y = 586.49e16.675x | 0.279 | |
| R3 | OSAVI | y = 1.946x1.303 | 0.522 |
| NDVI | y = 1.649x1.387 | 0.513 | |
| RVI | y = 0.490ln(x) + 0.153 | 0.500 | |
| MSR2 | y = 0.815x0.605 | 0.498 | |
| MSR1 | y = 0.341x + 0.380 | 0.493 | |
| TCARI/OSAVI | y = −0.276x + 0.934 | 0.490 | |
| R6 | DVI | y = 2.860x0.889 | 0.347 |
| GDVI | y = 3.055x0.950 | 0.343 | |
| TVI | y = 0.093x0.815 | 0.334 | |
| MNLI | y = 0.690e2.654x | 0.330 | |
| MSAVI2 | y = 2.241x1.031 | 0.325 | |
| SAVI | y = 2.563x1.225 | 0.317 |
| Growth Stage | Multispectral Index | Diagnosis | |
|---|---|---|---|
| Model | R2 | ||
| VT-R6 | MSAVI2 | y = 2.115x0.879 | 0.682 |
| GRNDVI | y = 2.198x0.774 | 0.523 | |
| MSR | y = 0.925x0.480 | 0.501 | |
| NDVI | y = 2.010x1.506 | 0.492 | |
| NRI | y = 1.926x + 1.092 | 0.481 | |
| VARI | y = 1.190x + 1.105 | 0.452 | |
| Growth Stage | Multispectral Index | Relationship | RMSE (%) | RE (%) | R2 |
|---|---|---|---|---|---|
| V6 | BNDVI | y = 0.443x + 1.801 | 0.28 | 5.15 | 0.798 |
| BRNDVI | y = 0.551x + 1.453 | 0.24 | 4.13 | 0.843 | |
| GBNDVI | y = 0.734x + 1.162 | 0.26 | 5.97 | 0.833 | |
| PNDVI | y = 0.559x + 1.434 | 0.23 | 3.88 | 0.861 | |
| NRI | y = 0.491x + 1.707 | 0.24 | 2.99 | 0.689 | |
| NDVI | y = 0.324x + 2.224 | 0.31 | 5.27 | 0.845 | |
| V10 | TCARI | y = 0.590x + 1.085 | 0.03 | 5.42 | 0.547 |
| TCARI/OSAVI | y = 0.223x + 1.817 | 0.01 | 4.11 | 0.292 | |
| NPCI | y = −0.169x + 3.105 | 0.05 | 8.83 | 0.211 | |
| BNDVI | y = 0.384x + 1.709 | 0.06 | 7.59 | 0.277 | |
| PVI | y = 0.176x + 2.031 | 0.01 | 0.14 | 0.307 | |
| RVI | y = 0.361x + 1.643 | 0.04 | 2.67 | 0.249 | |
| V12 | NRI | y = 0.997x–0.244 | 0.31 | 9.51 | 0.612 |
| BNDVI | y = 0.265x + 1.517 | 0.49 | 16.11 | 0.143 | |
| TVI | y = 0.242x + 1.700 | 0.37 | 11.42 | 0.232 | |
| RDVI | y = 0.315x + 1.469 | 0.40 | 12.86 | 0.282 | |
| DVI | y = 0.230x + 1.699 | 0.40 | 12.66 | 0.225 | |
| SAVI | y = 0.334x + 1.408 | 0.41 | 13.32 | 0.283 | |
| VT | NRI | y = −0.011x + 0.216 | 1.53 | 88.51 | 0.001 |
| OSAVI | y = −0.025x + 2.742 | 1.02 | 57.83 | 0.002 | |
| NLI | y = −0.111x + 2.762 | 0.92 | 50.34 | 0.010 | |
| RDVI | y = −0.015x + 2.299 | 0.61 | 32.92 | 0.002 | |
| SAVI | y = −0.014x + 2.575 | 0.87 | 49.14 | 0.001 | |
| MSAVI2 | y = −0.0045x + 2.347 | 0.67 | 36.73 | 0.001 | |
| R1 | DVI | y = 0.408x + 0.757 | 0.18 | 7.24 | 0.636 |
| GDVI | y = 0.333x + 0.846 | 0.20 | 8.52 | 0.602 | |
| TVI | y = 0.447x + 0.718 | 0.16 | 6.00 | 0.648 | |
| MNLI | y = 0.259x + 0.947 | 0.21 | 9.03 | 0.536 | |
| EVI | y = 0.329x + 0.890 | 0.18 | 5.98 | 0.611 | |
| RDVI | y = 0.260x + 0.911 | 0.23 | 11.49 | 0.578 | |
| R2 | MSR | y = 0.608x + 1.453 | 0.99 | 79.54 | 0.689 |
| RVI | y = 0.851x + 1.569 | 1.40 | 113.3 | 0.698 | |
| MSR | y = 0.695x + 1.611 | 1.25 | 101.1 | 0.706 | |
| NDVI | y = 0.383x + 1.680 | 0.94 | 75.57 | 0.727 | |
| BRNDVI | y = 0.253x + 1.727 | 0.84 | 66.38 | 0.715 | |
| PVI | y = 0.263x + 1.695 | 0.82 | 64.84 | 0.707 | |
| R3 | OSAVI | y = 0.081x + 1.192 | 0.43 | 46.47 | 0.081 |
| NDVI | y = 0.185x + 1.140 | 0.46 | 50.76 | 0.532 | |
| MSR | y = 0.303x + 0.947 | 0.37 | 40.26 | 0.532 | |
| MSR | y = 0.327x + 1.306 | 0.74 | 84.31 | 0.533 | |
| RVI | y = 0.269x + 1.129 | 0.52 | 57.91 | 0.534 | |
| TCARI/OSAVI | y = 0.481x + 1.067 | 0.63 | 71.88 | 0.497 |
| Multispectral Index | UAV Data Evaluation | |||
|---|---|---|---|---|
| Relationship | RMSE (%) | RE (%) | R2 | |
| MSAVI2 | y = 0.848x + 0.331 | 0.22 | 6.38 | 0.735 |
| GRNDVI | y = 0.306x + 1.962 | 0.53 | 6.88 | 0.491 |
| MSR | y = 0.121x + 1.517 | 0.42 | 18.30 | 0.373 |
| NDVI | y = 0.085x + 1.521 | 0.39 | 15.03 | 0.497 |
| NRI | y = 0.736x + 0.689 | 0.49 | 21.83 | 0.332 |
| VARI | y = 0.787x + 0.621 | 0.50 | 22.20 | 0.311 |
| Growth Stage | Four-Stage Combined Diagnostic Model | |
|---|---|---|
| Multispectral Index | Model | |
| V6 | GBNDVI | y = −1.112ln(x) + 2.963 |
| V10 | TCARI | y = −0.0998x + 2.228 |
| V12 | NRI | y = −5.833x + 4.457 |
| VT-R6 | MSAVI2 | y = 2.116x0.879 |
Publisher’s Note: MDPI stays neutral with regard to jurisdictional claims in published maps and institutional affiliations. |
© 2022 by the authors. Licensee MDPI, Basel, Switzerland. This article is an open access article distributed under the terms and conditions of the Creative Commons Attribution (CC BY) license (https://creativecommons.org/licenses/by/4.0/).
Share and Cite
Han, N.; Zhang, B.; Liu, Y.; Peng, Z.; Zhou, Q.; Wei, Z. Rapid Diagnosis of Nitrogen Nutrition Status in Summer Maize over Its Life Cycle by a Multi-Index Synergy Model Using Ground Hyperspectral and UAV Multispectral Sensor Data. Atmosphere 2022, 13, 122. https://doi.org/10.3390/atmos13010122
Han N, Zhang B, Liu Y, Peng Z, Zhou Q, Wei Z. Rapid Diagnosis of Nitrogen Nutrition Status in Summer Maize over Its Life Cycle by a Multi-Index Synergy Model Using Ground Hyperspectral and UAV Multispectral Sensor Data. Atmosphere. 2022; 13(1):122. https://doi.org/10.3390/atmos13010122
Chicago/Turabian StyleHan, Nana, Baozhong Zhang, Yu Liu, Zhigong Peng, Qingyun Zhou, and Zheng Wei. 2022. "Rapid Diagnosis of Nitrogen Nutrition Status in Summer Maize over Its Life Cycle by a Multi-Index Synergy Model Using Ground Hyperspectral and UAV Multispectral Sensor Data" Atmosphere 13, no. 1: 122. https://doi.org/10.3390/atmos13010122
APA StyleHan, N., Zhang, B., Liu, Y., Peng, Z., Zhou, Q., & Wei, Z. (2022). Rapid Diagnosis of Nitrogen Nutrition Status in Summer Maize over Its Life Cycle by a Multi-Index Synergy Model Using Ground Hyperspectral and UAV Multispectral Sensor Data. Atmosphere, 13(1), 122. https://doi.org/10.3390/atmos13010122