Abstract
In the CO2 differential absorption lidar (DIAL) system, signals are simultaneously collected through analog detection (AD) and photon counting (PC). These two kinds of signals have their own characteristics. Therefore, a combination of AD and PC signals is of great importance to improve the detection capability (detection range and accuracy) of CO2-DIAL. The traditional signal splicing algorithm cannot meet the accuracy requirements of CO2 inversion due to unreasonable data fitting. In this paper, a piecewise least square splicing algorithm is developed to make signal splicing more flexible and efficient. First, the lidar signal is segmented, and according to the characteristics of each signal, the best fitting parameters are obtained by using the least square fitting with different steps. Then, all the segmented and fitted signals are integrated to realize the effective splicing of the near-field AD signal and the far-field PC signal. A weight gradient strategy is also adopted in signal splicing, and the weights of the AD and PC signals in the spliced signal change with the height. The splicing effect of the improved algorithm is evaluated by the measured signal, which are obtained in Wuhan, China, and the splice of the AD and PC signals in the range of 800–1500 m are completed. Compared with the traditional method, the evaluation parameter R2 and the residual sum of squares of the spliced signal are greatly improved. The linear relationship between the AD and PC signals is improved, and the fitting R2 of differential absorption optical depth reaches 0.909, indicating that the improved signal splicing algorithm can well splice the near-field AD signal and the far-field PC signal.
1. Introduction
The accurate detection of atmospheric CO2 concentration is an important foundation for clarifying carbon sources and sinks, deepening the understanding of carbon transmission, and formulating reasonable emission reduction policies [1,2,3,4,5,6]. Differential absorption lidar (DIAL) is a powerful means of CO2 detection, which is less affected by the environment and can obtain high-precision, high spatial-temporal resolution of atmospheric CO2 concentration information. Ground-based DIAL can obtain the vertical profile information of CO2 concentration distribution, which is more meaningful for the study of carbon cycle [7,8,9,10].
In our CO2-DIAL system, a Licel transient recorder is used to collect data. The Licel transient recorder is a powerful data acquisition system, which can reach the best dynamic range together with a high temporal resolution at fast signal repetition rates. It uses analog detection (AD) and photon counting (PC) modes to collect lidar signals simultaneously. These two kinds of signals have their own characteristics due to the difference in data acquisition principles. The AD signal has good data quality at low altitudes, but the signal-to-noise ratio (SNR) at high altitudes is greatly reduced. PC signal can maintain good detection performance at high altitudes, but signal saturation is likely at low altitudes. Therefore, a combination of AD and PC signals is of great importance to improve the detection range and the accuracy of CO2-DIAL.
At present, many researchers have studied lidar signal splicing. Newsom et al. specified the analog voltage as the dependent variable and the dead time correction count rate as an independent variable to calculate the fitting coefficient [11]. Zhang et al. presented an approach centered on the slope coefficient to realize the splicing of signals [12]. Veberič et al. used the maximum likelihood function to establish the likelihood between AD signals and PC signals to obtain their splicing parameters [13]. Walker et al. used the lamp mapping technique (LMT) to determine glue coefficients in a manner that does not require atmospheric profiles to be acquired [14]. Lange et al. proposed an enhanced data-gluing formulation, which automatically finds the spatial range where both analog and PC signals are more similar based on Euclidian distance minimization over piece-wise range intervals along the whole acquisition spatial range [15]. Most splicing methods focus on how to establish the linear relationship between AD and PC signals to obtain their accurate splicing coefficient (i.e., slope and slant distance). These methods have a high stitching accuracy for lidar signals with a linear relationship between AD and PC signals. However, due to the influence of the detection environment and the system itself, the relationship between AD and PC signals is usually nonlinear [16]. Zhang et al. used the optimal uniform approximation polynomial for AD and PC signal splicing, but it is an integral polynomial, and the accuracy is reduced when the echo signal fluctuates greatly [17]. CO2-DIAL receives two beam echo signals of online and offline wavelengths, and the relationship between AD and PC signals is more complex. In this case, the traditional linear signal splicing method cannot obtain high-quality echo signals. In addition, in the traditional splicing method, AD is typically preferred in the near field or where signals are high. PC is generally preferred in the far field or where signals are low, and the mean value of AD and PC signals is generally adopted in the signal splicing region. On the one hand, this method makes the connection between the three splicing segments less accurate. On the other hand, all the splicing areas are averaged, that is, the photon and simulation weights are both 0.5, which is not very reasonable, and errors are likely at the front and rear ends.
In this paper, a more flexible and efficient piecewise nonlinear splicing algorithm is developed. According to the characteristics of the signal, the lidar signal is segmented, and nonlinear fitting is adopted to obtain the best fitting parameters. Then, all the segmented and fitted signals are integrated. In the final signal fusion, AD signal is used in the near field, and PC signal is used in the far field, which is the same as the traditional signal splicing method. For the signal splicing region, weight change splicing is adopted. During the splicing from the near field to the far field, the weight of the AD signal gradually decreases while the weight of the PC signal gradually increases. Thus, the error generated by signal splicing is minimized, which is conducive to the subsequent inversion of CO2 concentration.
According to the research content, the structure of paper is as follows: Section 2 mainly introduces the basic structure and the inversion algorithm of the CO2-DIAL detection system. Section 3 discusses the basic theory and the algorithm flow of piecewise nonlinear splicing algorithm. Section 4 evaluates the accuracy of the algorithm by measured signals. Section 5 presents the conclusions.
2. System and Inversion Algorithm of CO2-DIAL
The CO2-DIAL system works by using the absorption phenomenon of CO2 molecules to the detection laser, and the concentration information of CO2 is retrieved according to the attenuation of laser energy after absorption. It receives the Mie scattering echo signal of atmospheric particles and retrieves the CO2 concentration information according to the absorption of CO2 molecules to the laser. In the CO2-DIAL system, two laser pulses with similar wavelengths are transmitted. One laser, called the online wavelength (λon), is located at the absorption peak of the detected component to obtain the maximum absorption. The other, called the offline wavelength (λoff), is near the valley of absorption to obtain the minimum absorption.
The lidar equations of the online and offline wavelengths can be written as:
where r is the detection range, P(λ, r) is the received power of range r (λ can be both online and offline wavelengths), P0 is the laser output power, K is the calibration constant for lidar, A is the light area of the receiving telescope, c is the speed of light, τ is the laser pulse duration, β(λ, r) is the backscatter coefficient of the atmosphere, α0(λ, r) is the extinction coefficient of the atmosphere (excluding the trace gas under study), Ng(r) is the number of trace gas density, and σg(r) is the absorption cross section of the trace gas [18,19].
In the CO2-DIAL system, Equation (1) with the online wavelength is divided by that with the offline wavelength. The number density of the range-resolved CO2 can then be derived from the following equation:
where r1 and r2 are the beginning and the end of the integration interval, respectively, and Δr = r2 − r1 is the range resolution. When the laser wavelength range is small and the time frame is short, several atmospheric parameters change slightly with the wavelength, which can be regarded as constant in the DIAL system.
To carry out the subsequent CO2 concentration inversion analysis more easily, the concepts of optical depth (OD) and differential absorption optical depth (DAOD) are introduced here. The OD of CO2 gas is the energy attenuation caused by the absorption of the laser through the absorption cell filled with CO2 gas. Assuming that P0 is the initial intensity of the detection laser and P is the residual laser intensity after CO2 absorption, then OD can be expressed by Equation (3):
In this paper, OD represents the absorption of CO2 to the laser energy. DAOD refers to the difference between online and offline wavelength in the CO2-DIAL system, which is used to represent the difference between the two laser echo signals caused by CO2 absorption. Then, Equation (2) can also be expressed as the following equation by OD and DAOD:
The importance of signal splicing can also be seen from the CO2-DIAL inversion algorithm. The echo signals of online and offline wavelengths need to be spliced in the CO2-DIAL system.
The configurations of our ground-based CO2-DIAL system is shown in Figure 1 [20]. It is composed of the laser transmitter system, the optical reception detection system, and the data acquisition and processing system. The laser launch system consists of a tunable laser, a wavelength control unit, and a precision optical adjustment platform to achieve a high power and stable output of the detection laser. The optical receiver system is composed of a large aperture receiving telescope, a filter bank and near-infrared PMT for echo signal reception, background noise removal, and photoelectric conversion. The data acquisition and processing system is mainly based on a Licel transient recorder to realize data acquisition and processing functions.

Figure 1.
Configurations of ground-based CO2-DIAL system.
Figure 2 shows the AD and PC detection of the same laser echo signal, and Figure 3 shows the DAOD value calculated from the AD and PC signals. The two figures show that the quality of the AD signal is better at low altitudes, but the SNR drops rapidly as detection distance increases; PC signal still has a high SNR at high altitudes, whereas signal saturation occurs at low altitude, which cannot be used for data processing. The limitations of using only AD or PC signals for CO2 concentration inversion are large.

Figure 2.
Lidar echo signal after distance correction (left: AD signal, right: PC signal).
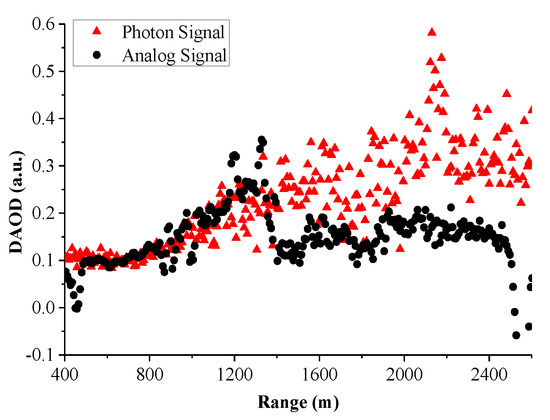
Figure 3.
DAOD value calculated from AD and PC signals.
3. Piecewise Nonlinear Signal Splicing of CO2-DIAL
3.1. Methodology
The process of AD and PC combination can be expressed as follows: First, within a certain detection range, a high correlation exists between the AD and PC signals, such that a section of the region can be found as the best splicing region according to the judgment conditions. Second, the conversion coefficient between the two signals is calculated by a certain fitting method in the splicing area. Finally, the splicing rules are used to splice the two fitted signals in the optimal splicing area [13,21,22,23]. Figure 4 is the basic flow chart of signal splicing.

Figure 4.
Basic flow chart of signal splicing.
Three main problems are observed in traditional signal splicing: The first is the selection of the fitting interval. The traditional algorithm selects a fixed region in interval fitting. However, the detection height corresponding to the saturation of photon signal is not fixed due to the change in the detection environment. Therefore, finding the height where the photon signal is completely free from the interference of the saturation effect before selecting the signal splicing region is necessary. The second is the selection of the fitting method. The global linear fitting method is adopted in traditional splicing. However, in the actual experiment, the lidar signal sometimes has a large fluctuation due to the influence of clouds and aerosols. Therefore, the traditional global linear fitting method is not accurate enough to the lidar signal combination, which greatly affects the subsequent inversion. The third is the selection and connection of splicing signals. In the traditional method, the AD signal is adopted in the near field, and the PC signal is adopted in the far field while the mean value of the AD and PC signals is usually adopted in the splicing part. This conduction may make the connection between them less precise, resulting in a large error. In addition, the splicing part adopts the mean value, that is, the weight of AD and PC is 0.5, which is inconsistent with the actual situation, resulting in errors.
In this paper, a piecewise nonlinear signal splicing algorithm is developed based on the traditional splicing methods. First, according to the response equation of the PC signal, the height of the signal that is completely free from the interference of saturation effect is found, and the signal splicing region is determined. Second, the lidar signal in the splicing area is segmented according to the fluctuation of the signal. When the signal is smooth, a larger range of signal segmentation is used. For the part with greater signal volatility, the segmentation range is smaller. Then, the AD and the PC of each signal are fitted with local polynomial to obtain the best fitting parameters, and all the fitted signals are spliced together. Finally, the AD signal is used in the near field, and the PC signal is used in the far field for the selection and connection of splicing signals, which is the same as the traditional algorithms. However, for the signal splice region, the fixed mean value of AD and PC signal is no longer adopted, but the weight gradient strategy is adopted. The weight of near-field AD signal is relatively large while that of far-field PC signal is relatively large, and the transition from the near-field AD signal to the far-field PC signal is gradual, which improves the cohesion and accuracy of signals. The improved piecewise nonlinear signal splicing flow is shown in Figure 5.

Figure 5.
Flow chart of piecewise nonlinear splicing algorithm.
In this paper, piecewise nonlinear splicing is adopted, and the least squares polynomial fitting is used in signal fitting. The least squares algorithm is a basic parameter estimation method that estimates the unknown parameters in the model based on least square sum of errors according to the observation data and finds the best function match of the data by minimizing the square sum of the errors [24,25,26]. Its basic idea is to select the estimator to minimize the sum of squares of the difference between the output of the model (including static or dynamic, linear or nonlinear) and the measured output.
3.2. Measured Signal Splicing
The measured lidar echo signals are spliced by the method in this paper to evaluate the splicing effect. The data used are the echo signals of online and offline wavelengths obtained in Wuhan, China, on 3 May 2016. Figure 6 is the original signal diagram of AD and PC, which can clearly show their advantages and disadvantages.
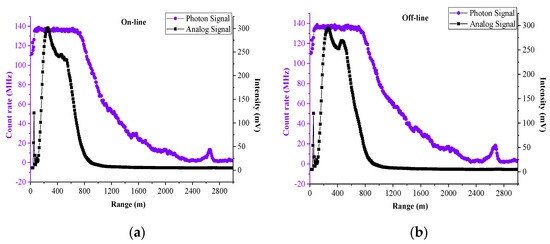
Figure 6.
Original signal diagram of AD and PC signals (3 May 2016), (a,b) are online wavelength and offline wavelength, respectively.
At a low altitude, the PC signal is saturated, and the quality of the AD signal is high. With the increase of altitude, the intensity of AD signal decreases rapidly, with the decreases of SNR, while PC signal still has a high SNR at high altitude. Therefore, using PC at high altitude is more advantageous, and inversion accuracy is higher. Figure 6 illustrates the necessity of signal splicing. The figure also shows that the AD and PC signals are very similar in a certain area and have a great correlation; thus, signal splicing can be carried out completely.
3.2.1. Dead Time Correction
Dead time is a unique phenomenon produced in PC, which refers to the discrimination and response time required by the PC detector to receive signals. If the time interval between two photons received by the detector is very short, it will cause problems in the detector’s response to the previous photon and cannot effectively process and output. Therefore, the PC signal needs to be corrected for dead time. The dead time of the PC in our CO2-DIAL system is 7.5 ns. It is corrected according to Equation (5), and the final result is shown in Figure 7. In Figure 7, the blue line is the original PC signal, which shows that its saturation effect at a low altitude is evident, whereas the red line is the PC signal after the dead time correction:
where N is the observed value, S is the real value, and τd is the dead time of the system.
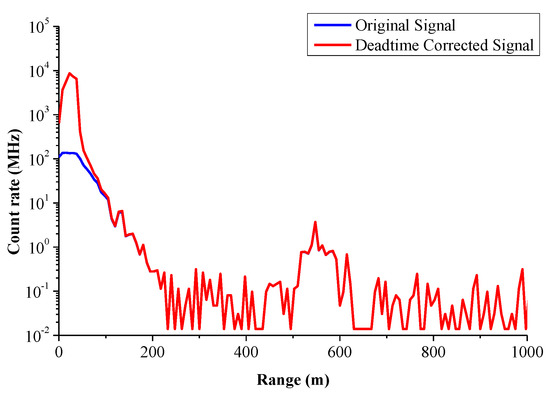
Figure 7.
Results of dead time correction of PC signal.
3.2.2. Displacement Correction
In addition to the dead time problem of PC, the problem of asynchronous signal reception between AD and PC signals in signal acquisition is observed. This problem is mainly caused by the different circuit timings of the two detection modes, which shows a displacement difference between AD and PC signals, and this displacement difference needs to be corrected before signal splicing.
Although the two detection modes are not synchronized, the displacement difference generated by them is a fixed value, and the displacement difference of the system can be obtained and corrected through the observation and analysis of the signal. In practice, the difference of the cloud position in the two signals is generally used to determine the displacement. When no cloud exists, the displacement can also be determined by observing the details of the two signals.
In this paper, according to several eye-catching positions between AD and PC signals, such as the bulge in the signal, multiple adjustments are performed, and a good coincidence between AD and PC signals is observed when the displacement value between the two signals is 8. Therefore, before the splicing operation, the two signals are corrected with a displacement value of 8 in our CO2-DIAL system.
3.2.3. Splicing Area Selection
The selection of the splicing area mainly aims to find the region where the two signals change smoothly and have the same trend according to the change trend between two signals. According to the echo signal, this paper finally determines that the fitting area is between 800 and 1500 m. A great correlation is noted between the AD and PC signals in this range, and signal splicing can be carried out.
3.2.4. Data Fitting
Figure 8 shows the overall nonlinear relationship between the AD and PC signals in the splicing area. It can be found that the relationship between them is nonlinear on the whole. Therefore, the error of the traditional overall linear fitting method is large, and piecewise fitting and splicing the AD and PC signals is necessary.
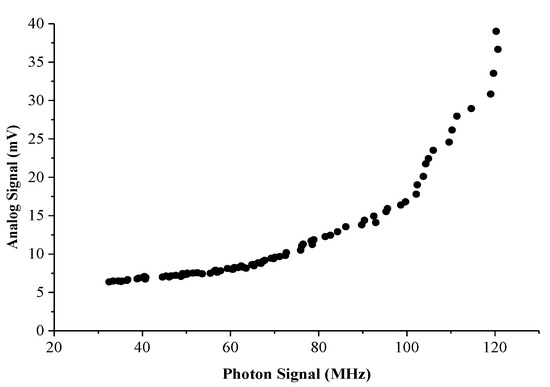
Figure 8.
Line relationship diagram of AD and PC signals in the splicing area.
3.2.5. Signal Splicing
Finally, the spliced signal is composed of three parts, namely, the signal in the low-altitude area (i.e., near-field signal), the signal in the spliced area (i.e., merging signal), and the signal in the high-altitude area (i.e., far-field signal). The AD and PC signals are adopted as the near-field signal and the far-field signal, respectively, and the signal in the spliced area is the combination of the AD and PC signals. Different from the traditional splicing algorithm, the fixed mean value of AD and PC signals is no longer adopted but replaced by the weight gradient strategy. The AD signal has a high weight in the near-field signal and a low weight in the far-field signal; the opposite is true for the PC signal. In this paper, the weights of the AD and PC signals in the spliced signal change with the height, and the weight coefficients are calculated as follows:
where WAD is the weight of the AD signal, WPC is the weight of the PC signal, H is the height of the signal, Hbottom is the starting height of the splicing area, and Htop is the ending height of the splicing area. In this paper, Hbottom is 800, and Htop is 1500.
Figure 9 and Figure 10 show the splicing effect of AD and PC signals obtained by overall fitting and piecewise fitting of online and offline wavelengths, respectively. The signal before 800 m is the AD signal, which is represented by the black line. After 1500 m, it is the PC signal, which is represented by the purple line. The signal values of spliced area are calculated by Equation (7), which is represented by the red line:
where IH is the intensity at height H, and IAD and IPC are the intensities of the AD and PC signals at that height, respectively.
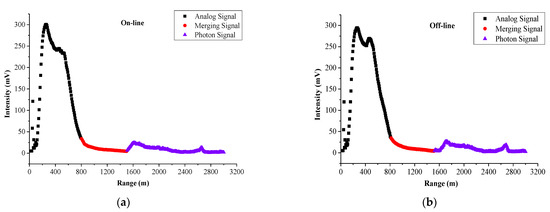
Figure 9.
Overall splicing effect of AD and PC signals, (a,b) are online wavelength and offline wavelength, respectively.
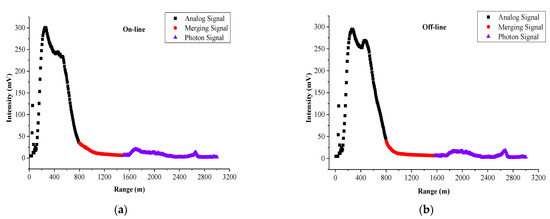
Figure 10.
Piecewise splicing effect of AD and PC signals, (a,b) are online wavelength and offline wavelength, respectively.
4. Evaluation and Discussion
In this paper, the accuracy of the algorithm is evaluated from two aspects: On the one hand, the coefficient of determination (R2) and the residual sum of squares (RSS) are used for direct evaluation. On the other hand, DAOD is used to evaluate the quality of the signal indirectly.
In statistics, R2 is used to describe the nonlinear or correlation between two or more independent variables and is an evaluation indicator of the fitting regression effect. The magnitude of R2 determines the closeness of the correlation. The closer R2 is to 1, the better the fitting regression effect and the higher the reference value of the relevant results; on the contrary, the closer R2 is to 0, the lower the reference value is indicated. RSS is a measure of the model fitting degree in the linear model. It is a data processing method that describes or compares discrete point groups on plane approximately with continuous curves to express functional relations between coordinates. In order to clarify the effects of explanatory variables and random errors, statistically, the difference between the data point and its corresponding position on the regression line is called residual, and the sum of the squares of each residual is called the RSS, which represents the effect of random errors. The smaller the RSS of a set of data, the better the fit. In this experiment, higher R2 and lower RSS indicate better signal quality.
The parameters R2 and RSS of the spliced signal are recorded in Table 1. It can be clearly found that the piecewise fitting method has better evaluation parameters and higher accuracy than the overall fitting method.

Table 1.
Evaluation parameters of spliced signal.
Figure 11 shows the linear relationship between the AD signal and the AD signal converted from the PC signal in the splicing area after piecewise fitting. Compared with Figure 8, linearity is improved, indicating that the proposed splicing algorithm is better than the traditional signal splicing algorithm.
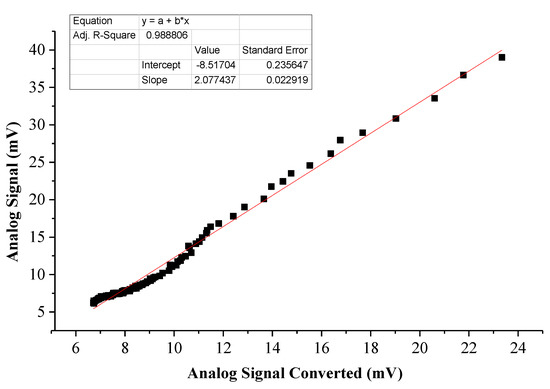
Figure 11.
Linear relationship between AD signal and AD signal converted from PC signal after piecewise fitting.
Finally, the DAOD of the spliced signals is calculated, and the results are shown in Figure 12. The fitting effect of the DAOD is good, indicating that the proposed splicing algorithm can well complete the splicing work of the near-field AD signal and the far-field PC signal.
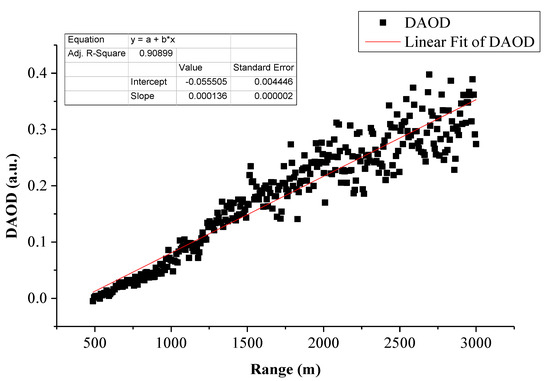
Figure 12.
DAOD of the spliced signal.
The measured results show that the piecewise nonlinear algorithm proposed in this paper can accurately splice the AD and PC signal of ground-based CO2-DIAL. At the same time, it cannot be denied that there are some defects in the current method, such as the large artificial interference factors in the splicing process, which will lead to some errors. At present, we are working on new algorithms to realize fully automatic nonlinear piecewise signal splicing and real-time display of inversion results.
5. Conclusions
In this paper, a segmented nonlinear signal splicing algorithm is proposed to extend the dynamic detection range and improve the signal quality for the problem of low SNR and short detection range of echo signals in the ground-based CO2-DIAL data acquisition. Compared with the traditional signal splicing algorithm, this paper mainly made improvements in the following aspects. First, the traditional signal splicing algorithms are mostly overall linear splicing, whereas the measured AD and PC signals are generally not linear; thus, splicing errors are likely. The piecewise nonlinear splicing algorithm is used to splice AD and PC signals. Signal volatility (coefficient of variation between adjacent points) is used to segment the signal, and then polynomial fitting is performed on each segment to improve the accuracy of signal splicing. Second, the traditional method uses AD signals in the near field and PC signals in the far field, whereas the splicing part generally uses the mean value of AD and PC signals, which may make the connection between these three parts less accurate. In addition, the splicing part adopts the mean value of AD and PC signals, that is, the weight of AD and PC is fixed at 0.5, which is unreasonable and prone to large errors. The weight coefficients of the AD and PC signals are assigned according to the height of the spliced signal. The AD signal in the low-altitude signal takes up more weight while the PC signal in the high-altitude signal takes up more weight. This algorithm is designed to ensure that the signal of each segment is spliced accurately and smoothly, improving the quality of the signal.
Finally, R2 and RSS are used to evaluate the quality of signal splicing. The results show that compared with the traditional overall linear splicing of signals, the proposed piecewise nonlinear splicing algorithm has a great improvement in accuracy. The R2 and RSS of the online wavelength are increased from 0.905 and 263.65 in the traditional splicing algorithm to 0.992 and 76.963, respectively. The R2 and RSS of offline wavelength are increased from 0.890 and 335.39 in the traditional splicing algorithm to 0.988 and 53.322, respectively. Then, the DAOD of the spliced signal is calculated. The R2 of the DAOD reaches 0.909, indicating that the quality is high, which is conducive to the high-precision inversion of CO2. The proposed signal splicing algorithm is not only applicable to ground-based CO2-DIAL but can also be used for signal splicing in other systems to expand the dynamic detection range and improve signal quality.
Author Contributions
The study was completed with cooperation between all authors. C.X. and A.L. designed the research topic; C.X. conducted the experiment; A.L. checked and analyzed the experimental results; C.X. wrote the paper. All authors have read and agreed to the published version of the manuscript.
Funding
This research was funded in part by the Natural Science Foundation of Jiangsu Province, China under Grants BK20180809 and BK20190779; in part by the National Natural Science Foundation of China under Grants 41901274 and 42001273; in part by the Talent Launch Fund of Nanjing University of Information Science and Technology under Grant 2017r066; and in part by the General Projects of Natural Science Research in Colleges and Universities of Jiangsu Province under Grant 19KJB170021.
Institutional Review Board Statement
Not applicable.
Informed Consent Statement
Not applicable.
Data Availability Statement
Not applicable.
Conflicts of Interest
The authors declare no conflict of interest.
References
- Cox, P.M.; Betts, R.A.; Jones, C.D.; Spall, S.A.; Totterdell, I.J. Acceleration of global warming due to carbon-cycle feedbacks in a coupled climate model. Nature 2000, 408, 184–187. [Google Scholar] [CrossRef]
- Friedlingstein, P.; Cox, P.; Betts, R.A.; Bopp, L.; Von Bloh, W.; Brovkin, V.; Cadule, P.; Doney, S.C.; Eby, M.; Fung, I.; et al. Climate–Carbon Cycle Feedback Analysis: Results from the C4MIP Model Intercomparison. J. Clim. 2006, 19, 3337–3353. [Google Scholar] [CrossRef]
- Ballantyne, A.P.; Alden, C.B.; Miller, J.B.; Tans, P.P.; White, J.W.C. Increase in observed net carbon dioxide uptake by land and oceans during the past 50 years. Nature 2012, 488, 70–72. [Google Scholar] [CrossRef]
- Sabine, C.L.; Feely, R.A.; Gruber, N.; Key, R.M.; Lee, K.; Bullister, J.L.; Wanninkhof, R.; Wong, C.S.; Wallace, D.W.R.; Tilbrook, B.; et al. The Oceanic Sink for Anthropogenic CO2. Science 2004, 305, 367–371. [Google Scholar] [CrossRef] [PubMed]
- Shi, T.; Han, G.; Ma, X.; Gong, W.; Chen, W.; Liu, J.; Zhang, X.; Pei, Z.; Gou, H.; Bu, L. Quantifying CO2 Uptakes Over Oceans Using LIDAR: A Tentative Experiment in Bohai Bay. Geophys. Res. Lett. 2021, 48, e2020GL091160. [Google Scholar] [CrossRef]
- Xiang, C.; Ma, X.; Zhang, X.; Han, G.; Zhang, W.; Chen, B.; Liang, A.; Gong, W. Design of inversion procedure for the airborne CO2-IPDA LIDAR: A preliminary study. IEEE J. Sel. Top. Appl. Earth Obs. Remote Sens. 2021, 14, 11840–11852. [Google Scholar] [CrossRef]
- Amediek, A.; Fix, A.; Wirth, M.; Ehret, G. Development of an OPO system at 1.57 μm for integrated path DIAL measurement of atmospheric carbon dioxide. Appl. Phys. A 2008, 92, 295–302. [Google Scholar] [CrossRef]
- Sakaizawa, D.; Nakajima, M.; Sawa, Y.; Matsueda, H.; Kawakami, S. Ground-based demonstration of a CO2 remote sensor using a 1.57μm differential laser absorption spectrometer with direct detection. J. Appl. Remote Sens. 2010, 4, 043548. [Google Scholar] [CrossRef]
- Han, G.; Gong, W.; Lin, H.; Ma, X.; Xiang, Z. Study on Influences of Atmospheric Factors on Vertical CO2 Profile Retrieving From Ground-Based DIAL at 1.6 μm. IEEE Trans. Geosci. Remote Sens. 2014, 53, 3221–3234. [Google Scholar] [CrossRef]
- Shi, T.; Han, G.; Ma, X.; Gong, W.; Pei, Z.; Xu, H.; Qiu, R.; Zhang, H.; Zhang, J. Potential of Ground-based multi-wavelength differential absorption LIDAR to measure δ13C in open detected path. IEEE Geosci. Remote Sens. Lett. 2021, 1. [Google Scholar] [CrossRef]
- Newsom, R.K.; Turner, D.; Mielke, B.; Clayton, M.; Ferrare, R.; Sivaraman, C. Simultaneous analog and photon counting detection for Raman lidar. Appl. Opt. 2009, 48, 3903–3914. [Google Scholar] [CrossRef]
- Zhang, Y.; Yi, F.; Kong, W.; Yi, Y. Slope characterization in combining analog and photon count data from atmospheric lidar measurements. Appl. Opt. 2014, 53, 7312–7320. [Google Scholar] [CrossRef]
- Veberic, D. Maximum-likelihood reconstruction of photon returns from simultaneous analog and photon-counting lidar measurements. Appl. Opt. 2012, 51, 139–147. [Google Scholar] [CrossRef][Green Version]
- Walker, M.; Venable, D.; Whiteman, D.N. Gluing for Raman lidar systems using the lamp mapping technique. Appl. Opt. 2014, 53, 8535–8543. [Google Scholar] [CrossRef]
- Lange, D.; Kumar, D.; Rocadenbosch, F.; Sicard, M.; Comerón, A. Optimized data-gluing method for mixed analog/photon-counting lidar signals. Rev. Boliv. De Física 2012, 20, 4–6. Available online: http://hdl.handle.net/2117/87322 (accessed on 18 May 2021).
- Whiteman, D.N.; Demoz, B.; Rush, K.; Schwemmer, G.; Gentry, B.; Di Girolamo, P.; Comer, J.; Veselovskii, I.; Evans, K.; Melfi, S.H.; et al. Raman Lidar Measurements during the International H2O Project. Part I: Instrumentation and Analysis Techniques. J. Atmos. Ocean. Technol. 2006, 23, 157–169. [Google Scholar] [CrossRef]
- Qi, Z.; Zhang, T.; Han, G.; Li, D.; Ma, X.; Gong, W. A nonlinear merging method of analog and photon signals for CO2 detection in lower altitudes using differential absorption lidar. Opt. Commun. 2016, 388, 68–76. [Google Scholar] [CrossRef]
- Xiang, C.; Ma, X.; Liang, A.; Han, G.; Gong, W.; Yan, F. Feasibility Study of Multi-Wavelength Differential Absorption LIDAR for CO2 Monitoring. Atmosphere 2016, 7, 89. [Google Scholar] [CrossRef]
- Guo, J.; Liu, B.; Gong, W.; Shi, L.; Zhang, Y.; Ma, Y.; Zhang, J.; Chen, T.; Bai, K.; Stoffelen, A.; et al. Technical note: First comparison of wind observations from ESA’s satellite mission Aeolus and ground-based radar wind profiler network of China. Atmos. Chem. Phys. 2021, 21, 2945–2958. [Google Scholar] [CrossRef]
- Xiang, C.; Han, G.; Zheng, Y.; Ma, X.; Gong, W. Improvement of CO2-DIAL Signal-to-Noise Ratio Using Lifting Wavelet Transform. Sensors 2018, 18, 2362. [Google Scholar] [CrossRef] [PubMed]
- Lifeng, H.; Wei, G.; Jun, L.; Feiyue, M.; Lianfa, L. Signal splicing of dual-receiver Mie scattering lidar in atmospheric remote sensing. J. Remote Sens. 2012, 16, 705–719. [Google Scholar]
- Petty, D.; Turner, D. Combined analog-to-digital and photon counting detection utilized for continous Raman lidar measurements. In Proceedings of the 23rd International Laser Radar Conference, Nara City, Japan, 24–28 July 2006. [Google Scholar]
- Liu, Z.; Li, Z.; Liu, B.; Li, R. Analysis of saturation signal correction of the troposphere lidar. Chin. Opt. Lett. 2009, 7, 1051–1054. [Google Scholar] [CrossRef] [PubMed]
- Shen, Y.; Li, B.; Chen, Y. An iterative solution of weighted total least-squares adjustment. J. Geod. 2011, 85, 229–238. [Google Scholar] [CrossRef]
- Marco, A.; Martı, J.J. Polynomial least squares fitting in the Bernstein basis. Linear Algebra Its Appl. 2010, 433, 1254–1264. [Google Scholar] [CrossRef]
- Zhang, H.; Guo, C.; Su, X.; Zhu, C. Measurement Data Fitting Based on Moving Least Squares Method. Math. Probl. Eng. 2015, 2015, 195023. [Google Scholar] [CrossRef]
Publisher’s Note: MDPI stays neutral with regard to jurisdictional claims in published maps and institutional affiliations. |
© 2022 by the authors. Licensee MDPI, Basel, Switzerland. This article is an open access article distributed under the terms and conditions of the Creative Commons Attribution (CC BY) license (https://creativecommons.org/licenses/by/4.0/).