Article

Emission Determination by Three Remote Sensing Methods in Two Release Trials

Institute for Sanitary Engineering, Water Quality and Solid Waste Management, University of Stuttgart, 70174 Stuttgart, Germany
*
Author to whom correspondence should be addressed.
Atmosphere 2022, 13(1), 53; https://doi.org/10.3390/atmos13010053
Submission received: 13 December 2021 / Revised: 22 December 2021 / Accepted: 24 December 2021 / Published: 29 December 2021
(This article belongs to the Special Issue Novel Techniques for Measuring Greenhouse Gases)

Abstract

:
Concentrations of greenhouse gases such as carbon dioxide (CO2), nitrous dioxide (N2O) and methane (CH4) in the atmosphere are rising continuously. The first step to reduce emissions from landfills is to gain better knowledge about the quantities emitted. There are several ways to quantify CH4 emissions at landfills. Comprehensive quality analyses of individual methods for emission rate quantification at landfills are few to date. In the present paper, the authors conducted two field trials with three different remote sensing methods to gain more knowledge about the possibilities and challenges in quantification of CH4 emissions from landfills. One release trial was conducted with released N2O as tracer and CH4 for quality assessment of the methods. In the second trial, the N2O tracer was released on a landfill to gain experience under field conditions. The well-established inverse dispersion modelling method (IDMM) was used based on concentration data of TDLAS (Tunable Diode Laser Absorption Spectroscopy)-instruments and on concentration data of a partly drone based Fourier-Transformation-Infrared-Spectroscopy (FTIR)-instrument. Additionally, a tracer-method with N2O-tracer and FTIR measurements was conducted. In both trials, IDMM based on TDLAS data and FTIR data provided the best results for high emission rates (15% deviation) and low emission rates (47% deviation). However, both methods have advantages, depending on the field of application. IDMM based on TDLAS measurements is the best choice for long-term measurements over several hours with constant wind conditions (8% deviation). The IDMM based on drone based FTIR measurements is the means of choice for measurements under changing wind conditions and where no linear measurement distances are possible.

1. Introduction

1.1. Basics

Concentrations of greenhouse gases such as carbon dioxide (CO2), nitrous oxide (N2O) and methane (CH4) in the atmosphere are rising continuously [1,2]. Germany emitted 907,000 Gg CO2-equivalents in 2017. From these, 330 Gg CH4 originate from landfilling [3]. CH4- and N2O-emissions are especially relevant to the global climate. One mole of CH4 has a 27 times higher global warming potential than 1 mole CO2, and for N2O this factor is even 273 higher [4].
According to the results of the COP26 in November 2021 in Glasgow, 100 countries agreed on reducing their CH4-emissions by one third [5]. In order to achieve this goal, precise knowledge of the location and quantity of CH4 emissions generated is necessary.
When waste is stored or deposited at landfill sites, climate-damaging gases such as CO2 and CH4 are produced. How much is dependent on several factors, including age and amount of the waste, surroundings and management of the landfill [6,7,8]. There are metrological and computational methods for the determination of landfill gas emissions. The computational methods are based upon the first order microbial degradation of organic substance. The influencing parameters such as waste amounts, organic fraction and age of the deposition are estimated. Via these estimations, great errors can arise. The result is a gas formation prognosis. This gas formation prognosis leads, by further specification of parameters such as migration over landfill boarders, storage in the landfill body and oxidation in landfill surfaces, to an emission prognosis [9,10].
The potential errors for this emission prognosis are great, because neither the input parameters, such as amount of waste, organic fraction of deposited waste and exact age of deposited waste, nor the parameters concerning oxidation in the surface, migration and storage of produced gas are definitely known.
These reasons make a metrological method for assessing emissions from landfills necessary [11,12].
In this paper, these problems are solved by using remote sensing technologies. On the one hand, a Lagrangian dispersion model based on TDLAS and FTIR data was used. On the other hand, the authors used a tracer method.
Both methods are widely known in the literature. A brief overview shows the most important publications in the field of Lagrangian dispersion modelling based on concentration data and concerning the tracer method.

1.2. Inverse Dispersion Modelling

The inverse dispersion modelling is an indirect method for diffusive emission determination of a known emission source with unknown source strength from measured immission-side concentrations. For the concentration measurements, point measurements as well as measurements over a distance are possible. Depending on the goal, these models can model in forward or backward mode. In addition to the immission-side concentration measurements, the models need input data concerning wind conditions and source geometry [13].
Point-like particles represent those substances whose concentration or emission strength the model evaluates. The model watches these particles move through the atmosphere. Basically, two movement types act on the particles: the particles move with the mean wind velocity, and turbulence additionally affects them by an arbitrary motion. This arbitrary motion is individual for each observed particle. Within the simulation, the computer program calculates the position of each particle after Equation (1):
x new =   x old +   t × ( V   +   u   +   U )
where xnew is the new position of the particle and xold the former position. The mean wind velocity is represented by V, the turbulent velocity by u, the additional velocity by U and all of these for each time increment t.
The simulation for the dispersion modelling is based on the following Equation (2):
Q   = c     c BG ( c Q ) sim
where Q is the unknown, but constant emission rate is in mass per time. At a certain position in the plume of the source is c, the measured concentration. For the calculation, the measured background concentration cBG is subtracted from c. The simulation calculates, with the help of an atmospheric dispersion model, back to the source emission rate ( c Q ) sim [14,15,16,17].
In the study of Flesch et al. [14], the authors used methane release trials to evaluate their backward Lagrangian stochastic (bLs) model. The basis of WindTrax (used in the present paper) is a bLs model. They released CH4 over a 6 × 6 m area and measured concentration downwind with TDLAS instruments. Flesch et al. recorded meteorological data with an ultrasonic anemometer at a height of 2 m. The ratio between Q (gas release with the source) and QbLs (emission estimation with the bLs model) amounts to 0.96. This means that in this representative period the bLs underestimated the released CH4 amount by 4% [14]. The Inverse Dispersion modelling method, as the authors use it, was established and described a few times in the literature. Han Zhu et al. describe a method for determination of CH4-emissions at a landfill in southern Germany [18]. The described method is already similar to the IDMM based on TDLAS data, which the authors used for their measurements. Nevertheless, Vesenmaier improved and quality assured the method [19]. A recent study evaluated and approved the IDMM based on TDLAS data in comparison with similar methods [20]. None of these recent studies used any other measurement device than ground based ones. As mentioned in [16], sometimes it is difficult to find proper measurement distances for the concentration measurements. That is the reason for the partly drone based evolution of the FTIR. This offers high flexibility. Whether the results are of good enough quality to recommend the FTIR for emission measurements is shown in the following sections.

1.3. Tracer Method

Tracer methods belong to the indirect approaches for emission determination at landfills. A release with a known mass-flow of a tracer gas, which does not occur as landfill emission, takes place. Measurements in the plume determine the concentrations of tracer gas and the relevant emission gas from the landfill. The emission mass flow (QM) is the result of the ratio between relevant gas (CH4, cM) subtracted by its background concentration (cM,BG) and the tracer gas concentration (cTracer) and multiplied by the known tracer mass-flow (QTracer), as given in Equation (3) [21].
Q M = c M   c M , BG c Tracer × Q Tracer
Emission determination with the tracer method is possible by sampling and by on site measurements. Concentration measurements are possibly static at a certain point leeward of the source as well as dynamic through the plume cross section. Measurements conducted far enough from the source ensure a good mixture between tracer and landfill gas plume and minimize the mistakes from a potentially misplaced source [22].
In France, a measurement campaign compared four methods for emission determination at a landfill in 2007 [23]. Two methods used N2O tracers. For the mobile plume method, a TDLAS instrument measures CH4 and N2O concentrations from a car, which goes perpendicular to the plume. The other method is the stationary plume method. For that method, 14 evacuated bottles are along the driveway of the mentioned car. The bottles fill within 4 h via valves. One bottle is at the same time upwind of the source to determine background concentration. Afterwards, the TDLAS device analyzed the content of the full bottles. The source strength is supposed to be constant. Via the known dispersion of the tracer, in this case N2O, the CH4 concentration determines, via Equation (3), the CH4 emission rate. In this study, as well, a release trial for quality assurance was conducted. The mobile plume method overestimated the emission of 0.5 g/s by three times. With a four times overestimation, the overestimation by the static plume method even higher [23].
For concentration determination, there are a couple of possibilities for the positioning of measurement devices. As mentioned above, it is possible to have the measurement device in a car. A prerequisite for the use of this measurement technique is the availability of a road within a relevant distance to the measurement object. If this is not the case, flying might be a solution, as shown by Allen et al. [24]. The drawback of the measurement technique used by Allen et al. is that the measurement devices only measure CO2. An important prerequisite for the tracer method is a measurement device which is able to measure two gas concentrations simultaneously [25,26].
With the help of tracer releases, Galle et al. [27] determined that the CH4 emissions of smaller landfills were comparable to the one investigated in this paper. Galle et al. found the following advantage of the tracer method during changing meteorological conditions: data are recorded over the whole day. During a time interval when emission gas and tracer gas behave the same way, it can be assumed that both gases originate in the same region. With the help of this information via the dispersion of the tracer gas and the known release rate, again, the emission rate of the target gas can be calculated. With this method, no further meteorological measurements are necessary [27].
In the present paper, the authors used the tracer method with the FTIR measurement device to compare the modelling based methods with a modelling-independent method.

2. Materials and Methods

2.1. Methods and Metrology

Two methods were used to determine emission rates from an artificial source and from a landfill. One method is the inverse dispersion modelling method (IDMM). The other method is a tracer method.
The IDMM used here for data evaluation consists of two parts. One part is the acquisition of concentration data on the immission-side of the source. The second part is a computer-based simulation for the recalculation from the concentration data to CH4 amounts occurring on the emission-side. The measurements record concentration data for the immission-side and for the natural background of CH4 and N2O, respectively. An Ultrasonic Anemometer collects meteorological data. The computer program then releases imaginary particles along the measurement path and traces their movement back in space and time. If the particle experienced a touch-down on the defined emission area, the program counts it as emission from this area. By the tracing ten thousand particles, the emission rate from the area is calculated.
Two types of measurement devices measured the concentrations. Two TDLAS instruments measured line concentrations of methane upwind and downwind of the source. These instruments use open path absorption spectroscopy. The combined receiver–sender device sends an infrared beam to the reflector, which reflects the beam back to the receiver–sender device. From the difference in intensity, the internal computer calculates the absorption over the distance. It counts every molecule which is within this distance. The unit for these open path measurements is ppm × m. There are TDLAS instruments for more than one substance, but we used one only for CH4, according to wavelengths between 1600 nm and 1700 nm. TDLAS instruments are ground based and are frequently used in future studies for emission quantification.
On the other side, one portable FTIR measured the concentration of CH4 and N2O. In the field trial conducted on the landfill, the FTIR was combined with a heavy-duty drone for higher flexibility. The combination of this lightweight FTIR with a heavy-duty drone is innovative in the field of emission quantification. So far, no research concerning the quality of such drone measurements has been published.
The tracer method uses a known dispersion of a tracer gas, in this case N2O, to determine the emission of the target gas, in this case CH4. Under the presupposition that both gases behave the same way and mix equally in the atmosphere, this is valid. Equation (3) shows the calculation for the tracer method. The tracer method was chosen to obtain a comparison to a method which does not rely on modelling. The tracer method represents the low-tech approach compared to computer based modeling.

2.2. Measurement Devices and Software

For the linear concentration measurements, two TDLAS instruments were available: one Gasfinder 2.0 (GF2) and one Gasfinder 3.0 (GF3) from Boreal Laser Inc. Edmonton, Canada. GF2 and GF3 measure concentrations with a frequency of 1 Hz over a distance between several tens of meters up to about 500 m. These measurement distances are built up between a retroreflector and the receiver–sender unit of the TDLAS instrument. The concentration measurement is conducted by the laser light’s absorption over this distance (L). The Beer–Lambert Law calculates from the reduction in intensity (I) compared to the original intensity (I0) to the concentration, in this case of CH4 (c). The calculation is specific for one wavelength λ and for the absorption coefficient α, specific to the medium. Equation (4) shows the Beer–Lambert Law [28]:
I ( λ , L ) = I 0 ( λ ) × exp ( α ( λ ) × c × L )
The unit for the concentration measurement in this case is ppm × m, which means a concentration integration over the distance.
The FTIR, well used for concentration measurements, was a GT5000 Terra from Gasmet Technologies GmbH, Karlsruhe, Germany. The FTIR technology allows the acquisition of concentration-data for more than 50 substances, including CH4 and N2O. In this study, we used only the data for CH4 and N2O. The FTIR determines, each 5 s, one concentration value for CH4 and N2O in ppm. The center of the FTIR forms a beam splitter. An IR source emits IR light of all wavelengths at the same time. The beam splitter divides the beam sent from the IR source into two parts. The two beams hit either the moving mirror or the fixed mirror. By that, two beams are again created, but due to the movement of the mirror, with different phases. These two beams merge again at the beam splitter. The beam splitter sends them through the sample cell with the gas sample. Behind the sample gas cell is an IR detector. This detector registers the incoming time-dependent signal. The signal is called the interferogram. A Fourier Transformation turns the time-dependent original signal into a frequency-dependent signal. The outcome is a signal which is dependent on the frequency of the IR light. An absorption spectrum of each target gas is recorded before the measurements. By comparing individual absorption spectra with that of the gas mixture, the quantification of the individual gases can be accomplished [29].
In both field trials, a 3D Ultrasonic anemometer (USA) by Metek Meteorlogische Messtechnik GmbH, Elmshorn, Germany collected the meteorological data with a frequency of 10 Hz. The USA is installed at a height of 5 m. The weather station WH1080Se from the HS Group GmbH & Co. KG, Cologne, Germany measured the atmospheric pressure at a 1.5 m height. The heavy-duty drone used in the second field trial was from the type HD6-1500 by exabotix GmbH, Bad Lauterberg, Germany. The accumulators included a weight of around 14 kg, and it can be loaded with 10 kg weighing GT5000. Measurement data are transmitted via Bluetooth to the ground station of the FTIR. The open source computer program WindTrax 2.0 (V 2.0.9.7 from 5 November 2020) by Thunderbeach Scientific calculated back from the measured concentrations to the emission rates.

2.3. Release Trial

The release trial took place on 21 April 2020 on the fields of a nursery business in Filderstadt, Germany. Weather conditions were bright sunshine and wind speeds between 4 m/s and 6.5 m/s from northeastern directions. The source consisted of a flow meter and a diffuser with an area of 573 cm2. The flowmeter was fabricated for air at 1 bar pressure and 20 °C air temperature for volume flows between 0 m3 i.N./h and 10 m3 i.N./h. For the released gases, the volume flows were corrected according to Equation (5).
Q N 2 O =   Q Air × K ρ × K T × K p
In Equation (5), Q are the volume flows for N2O and air and K are the correction factors for density ( K ρ = ρ air ρ N 2 O ), for atmospheric pressure ( K p = p p fabricated ) and temperature ( K T = 273 +   T fabricated 273 + T ) equally for CH4.
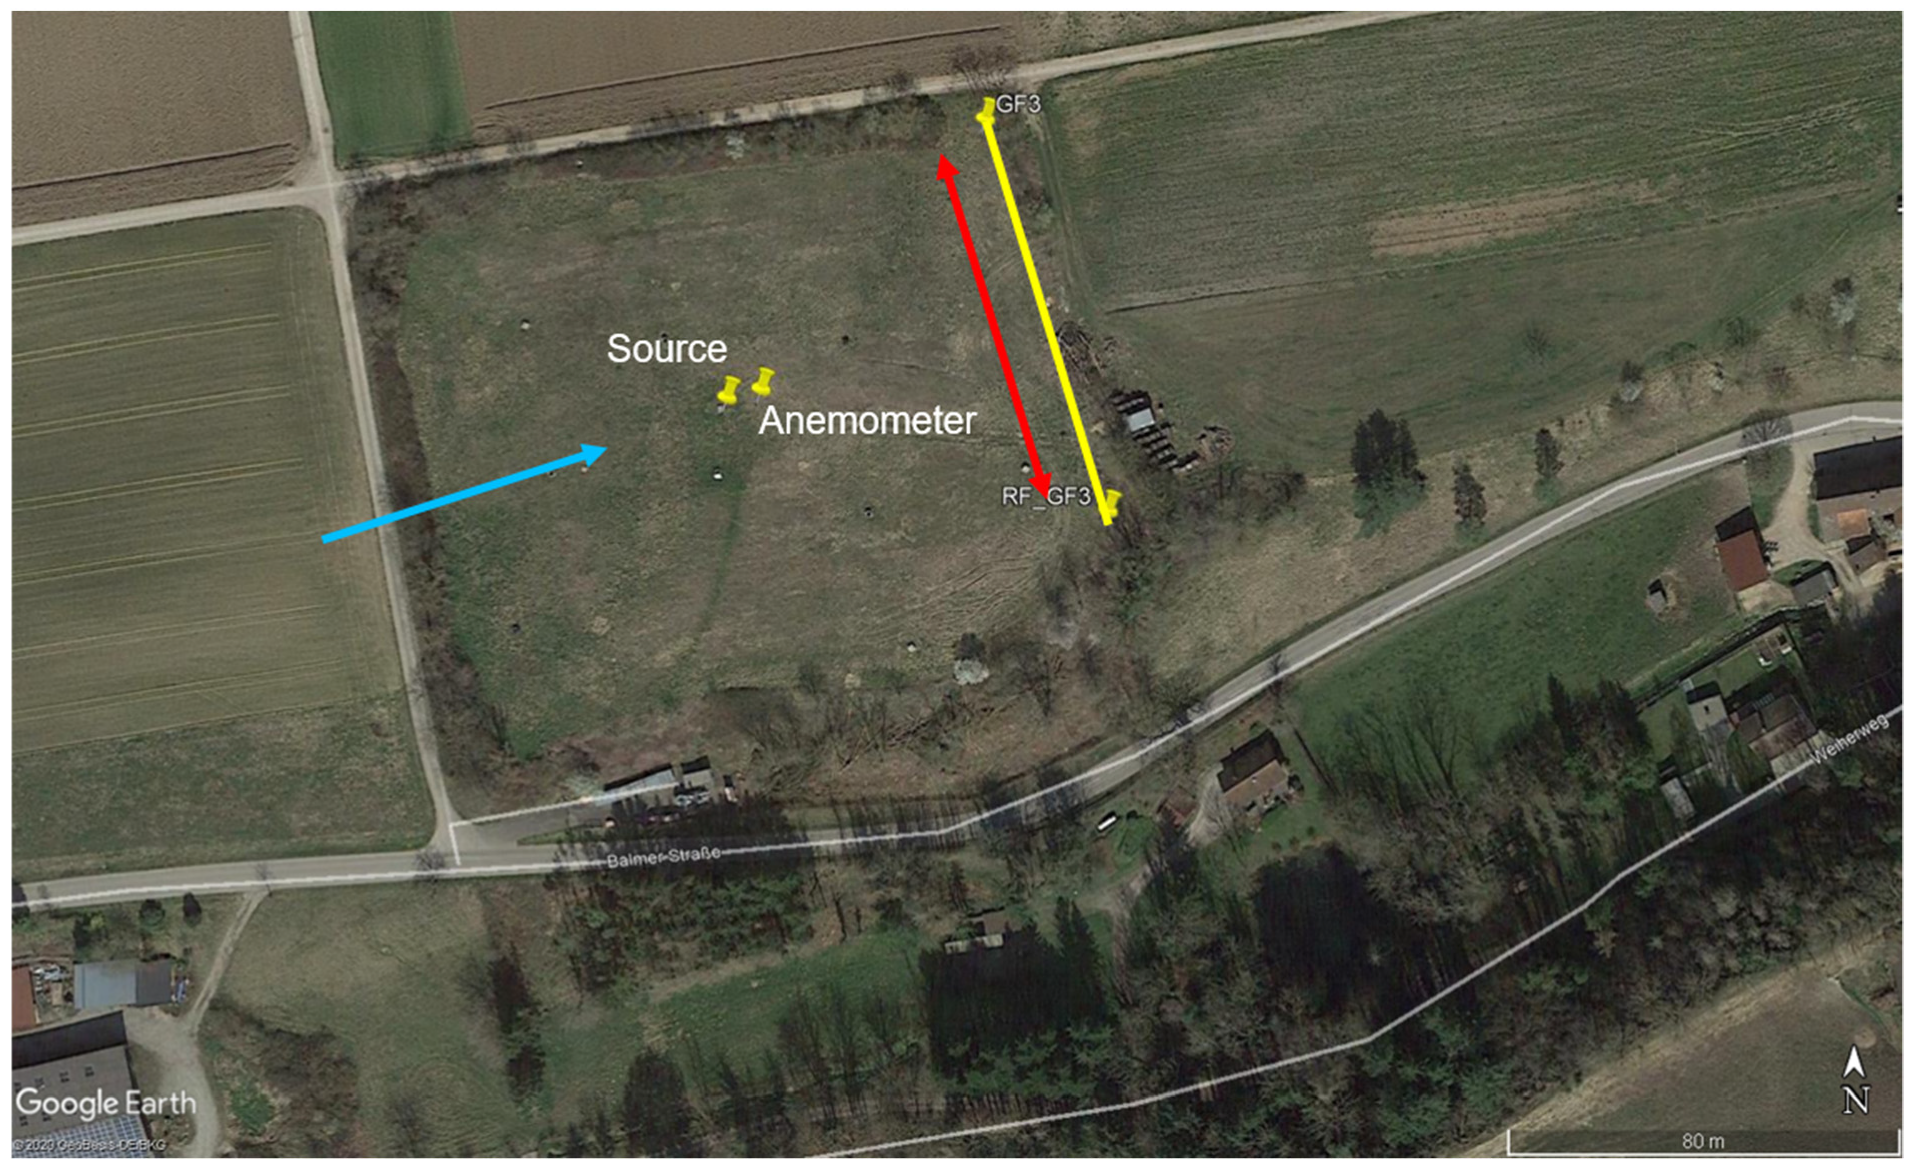
The source released ultrapure N2O gas from Air Liquide Deutschland GmbH, Düsseldorf, Germany with a N2O content of 100%. For the CH4 release, fuel-gas with purity of 2.5 was used. In Figure 1, the position of the source and the anemometer is shown. The source released, in five ten-minute intervals, N2O and CH4 at distinct rates, which were controlled by the flow meter. Table 1 shows the release rates and the time intervals.
The GF2 system measured continuously, with a frequency of 1 Hz, the CH4 concentrations over a distance of 111 m downwind. The GF3 system measured equally the CH4 background concentration. At the time when the trial took place the heavy-duty drone was not yet available. Due to this, the FTIR system had to be carried along the measurement distance. The FTIR system was transported during the release intervals at walking speed between the start and end, marked in Figure 1.
After, the data-acquisition mean values for all data (concentration data from TDLAS instruments, FTIR data and meteorological data) were calculated for ten-minute time intervals. Following this, the evaluation occurred twice with the IDMM, once for TDLAS data and once for the FTIR data. WindTrax calculated from the measured concentrations back to the release rates, which were compared afterwards.
For the tracer method, we used the CH4 and N2O concentration of the FTIR. With Equation (3) we calculated from the known release rates of the N2O (QTracer) and the measured concentrations for CH4 downwind (cM) and downwind (cM,BG), as well as for N2O (cTracer), back to the emission rate of CH4 (QM). The emission rate in this case was also artificially produced by a CH4 release, as mentioned above.

2.4. Field Trial at Landfill

The second field trial took place at an old landfill. The landfill is located in the south of Germany in the department of Waldshut. From 1975 to 1992, the landfill was used to deposit about 114,000 Mg of waste on an area of 1.8 ha. The landfill has a mineral surface sealing with grass cover. An active gas recovery system has been installed since 1992. Ten gas wells suck landfill gas and transport it to the gas flare. Since the end of 2018, a thermic system for weak gas treatment has been in place. At the time of the measurement, the weak gas treatment system had been broken for two months. No gas was sucked from the landfill for two months. Thus, the landfill was in its original state, without degassing. Here, the source released only N2O in known amounts and the landfill released unknown amounts of CH4. The goal was to quantify the unknown CH4 amounts emitted from the landfill.
For this purpose, GF3 measured CH4 concentrations continuously from 10:55 a.m. to 2:55 p.m. over a distance of 81 m to the east (downwind) of the landfill (see also Figure 2). Background concentrations were also measured in parallel on the opposite side of the landfill by GF2. The D-FTIR flew parallel to the measurement line of the GF3 over a mean distance of 77 m and each 5 s measured one concentration value for CH4 and N2O. The source as well as the anemometer were placed in the center of the landfill area. The mean wind direction was west. The source was manually connected to the drone. Every time the drone took off, the N2O release started. Release rates were twice 1.1 g/s and twice 1.7 g/s.
The data were evaluated by IDMM for TDLAS data and FTIR CH4 data and by tracer method according to Equation (3) for the FTIR CH4 and N2O data.

3. Results and Discussion

3.1. Release Trial

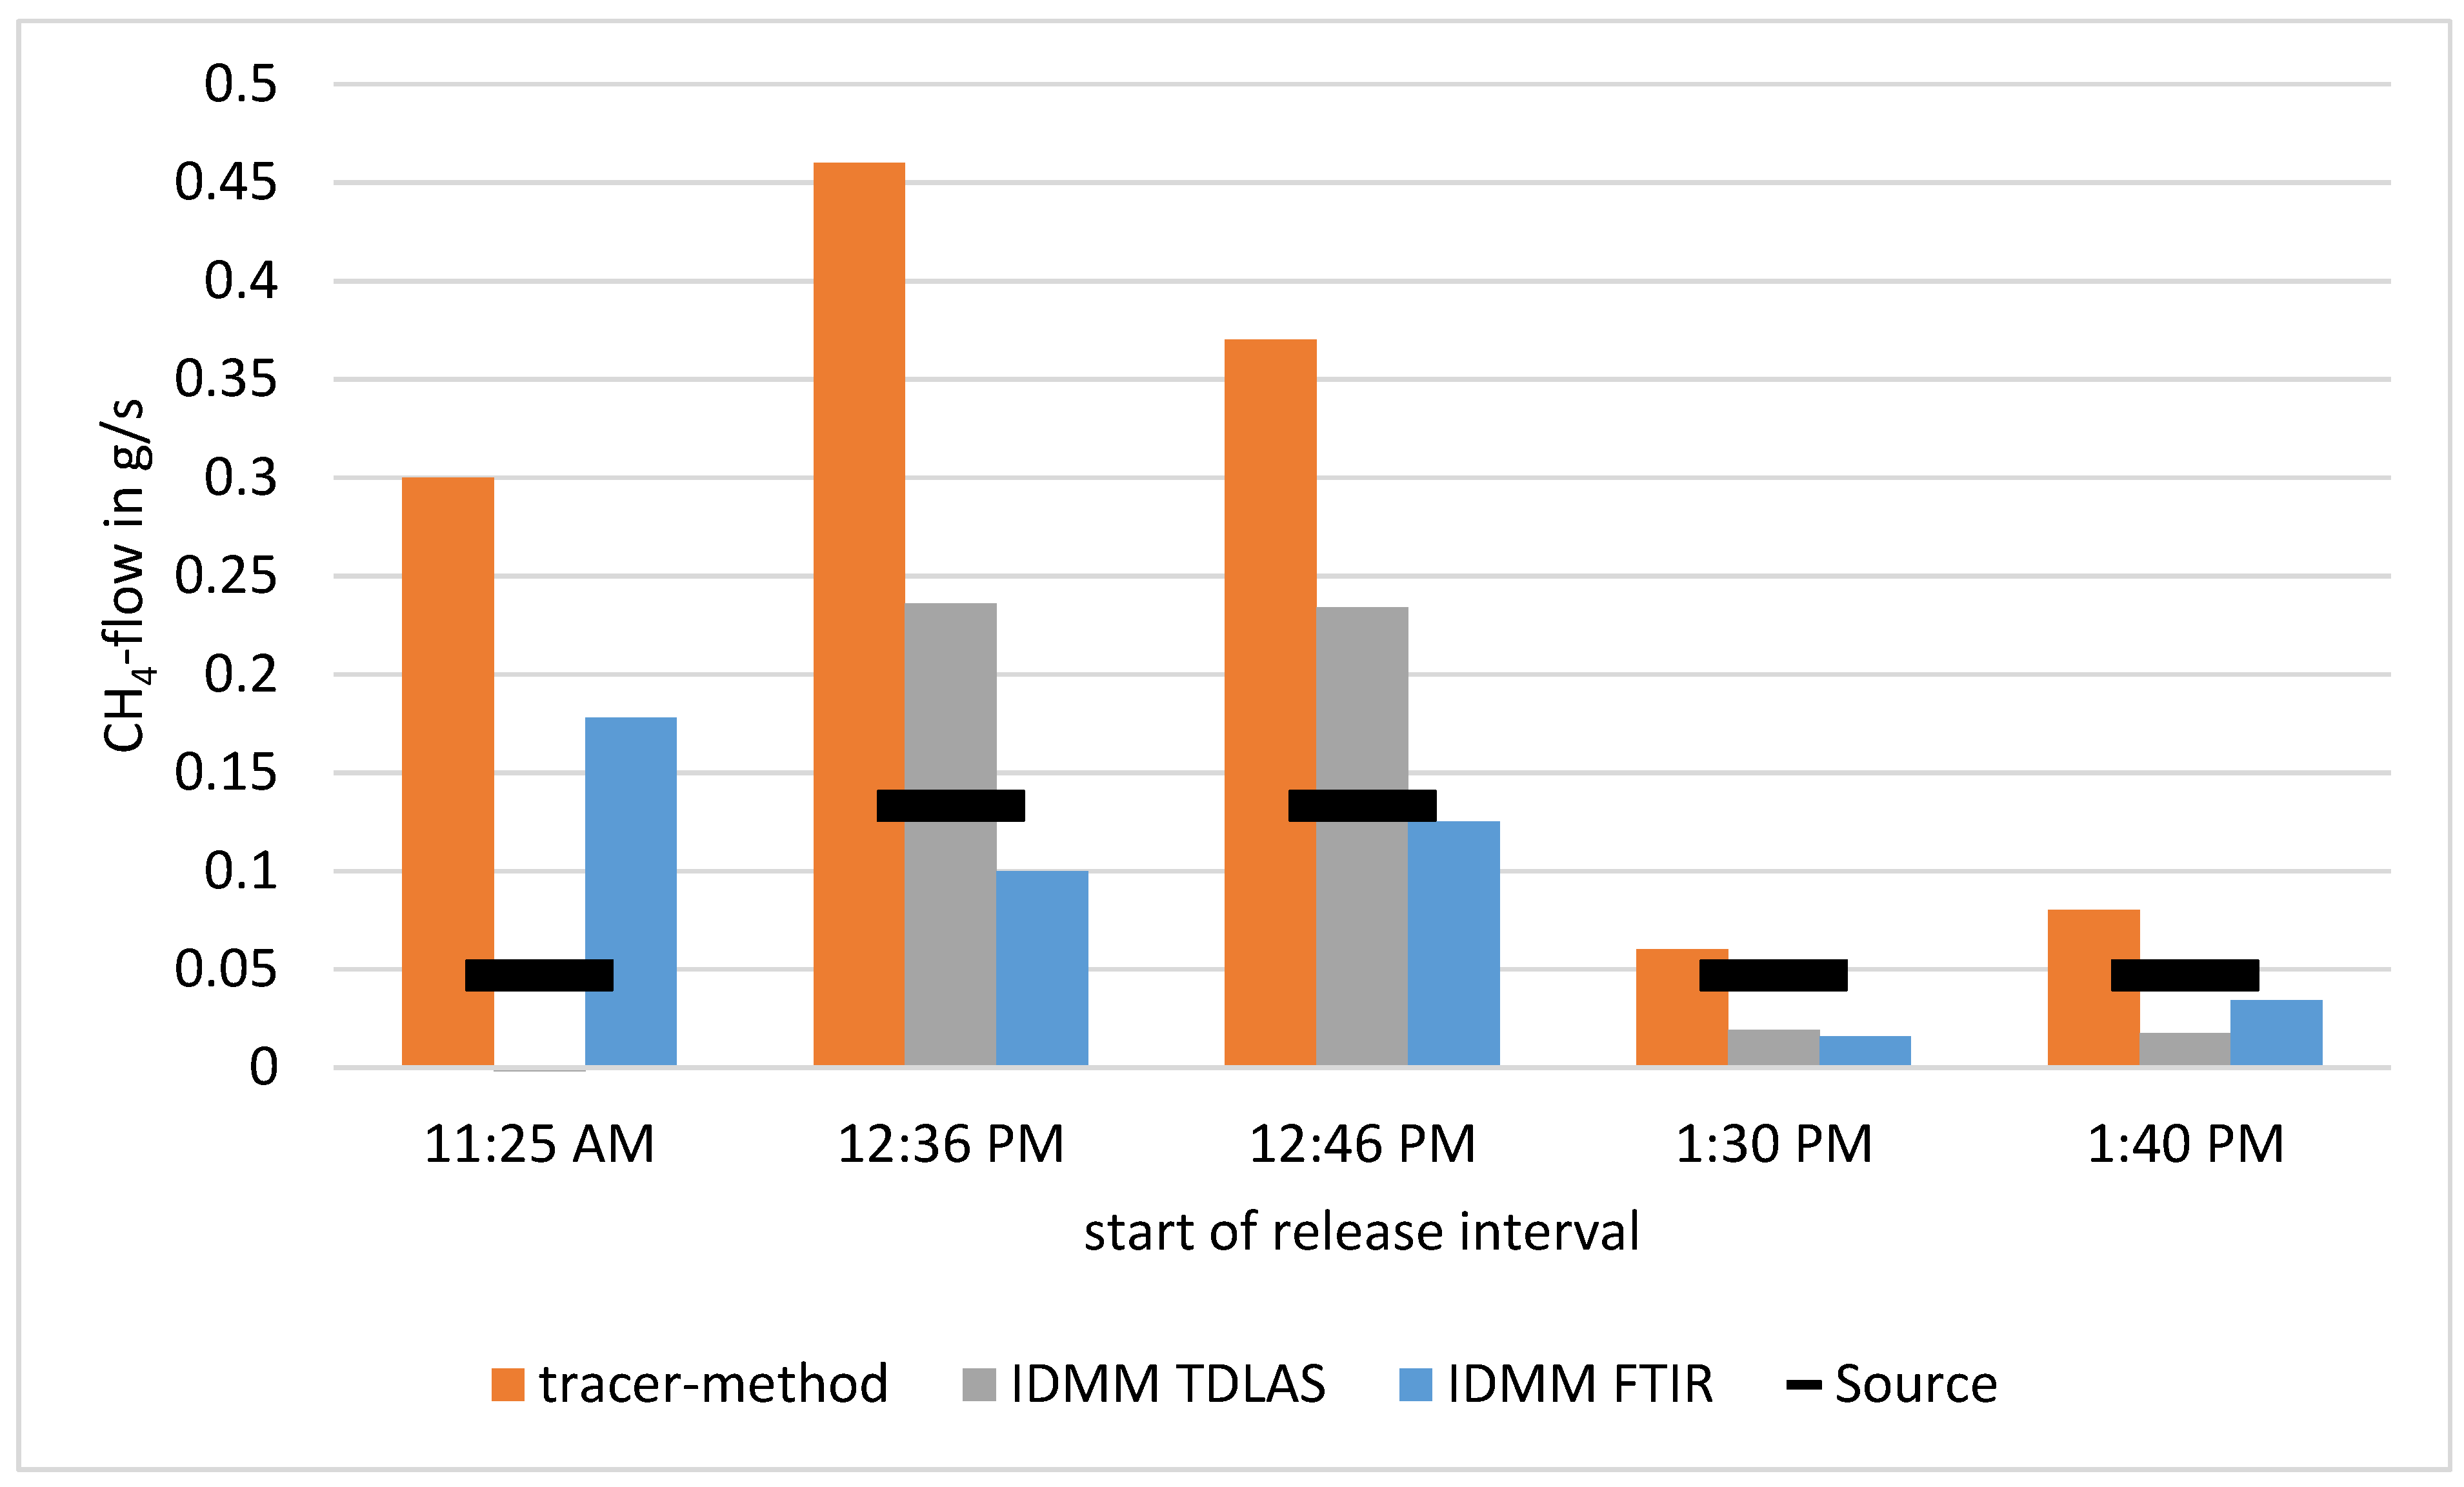
Figure 3 shows the results of the release trial at the nursery business. For the interpretation of the results, it is important to know on what to focus. If the goal is to very quickly reach good results, another quantification method might be better than if the goal is to reach a quantification of low emission rates, accurately and over a longer time span. This is the reason why the result is interpreted on two time scales, first for each single time interval and then over the whole time of the measurement. The orange columns present the CH4 amounts determined by the tracer method. The blue columns display the CH4 amounts deduced by the IDMM based on FTIR data. The grey columns show the amounts of CH4 calculated by IDMM based on TDLAS data. The black line in Figure 3 represents the released amounts of CH4 from the source.
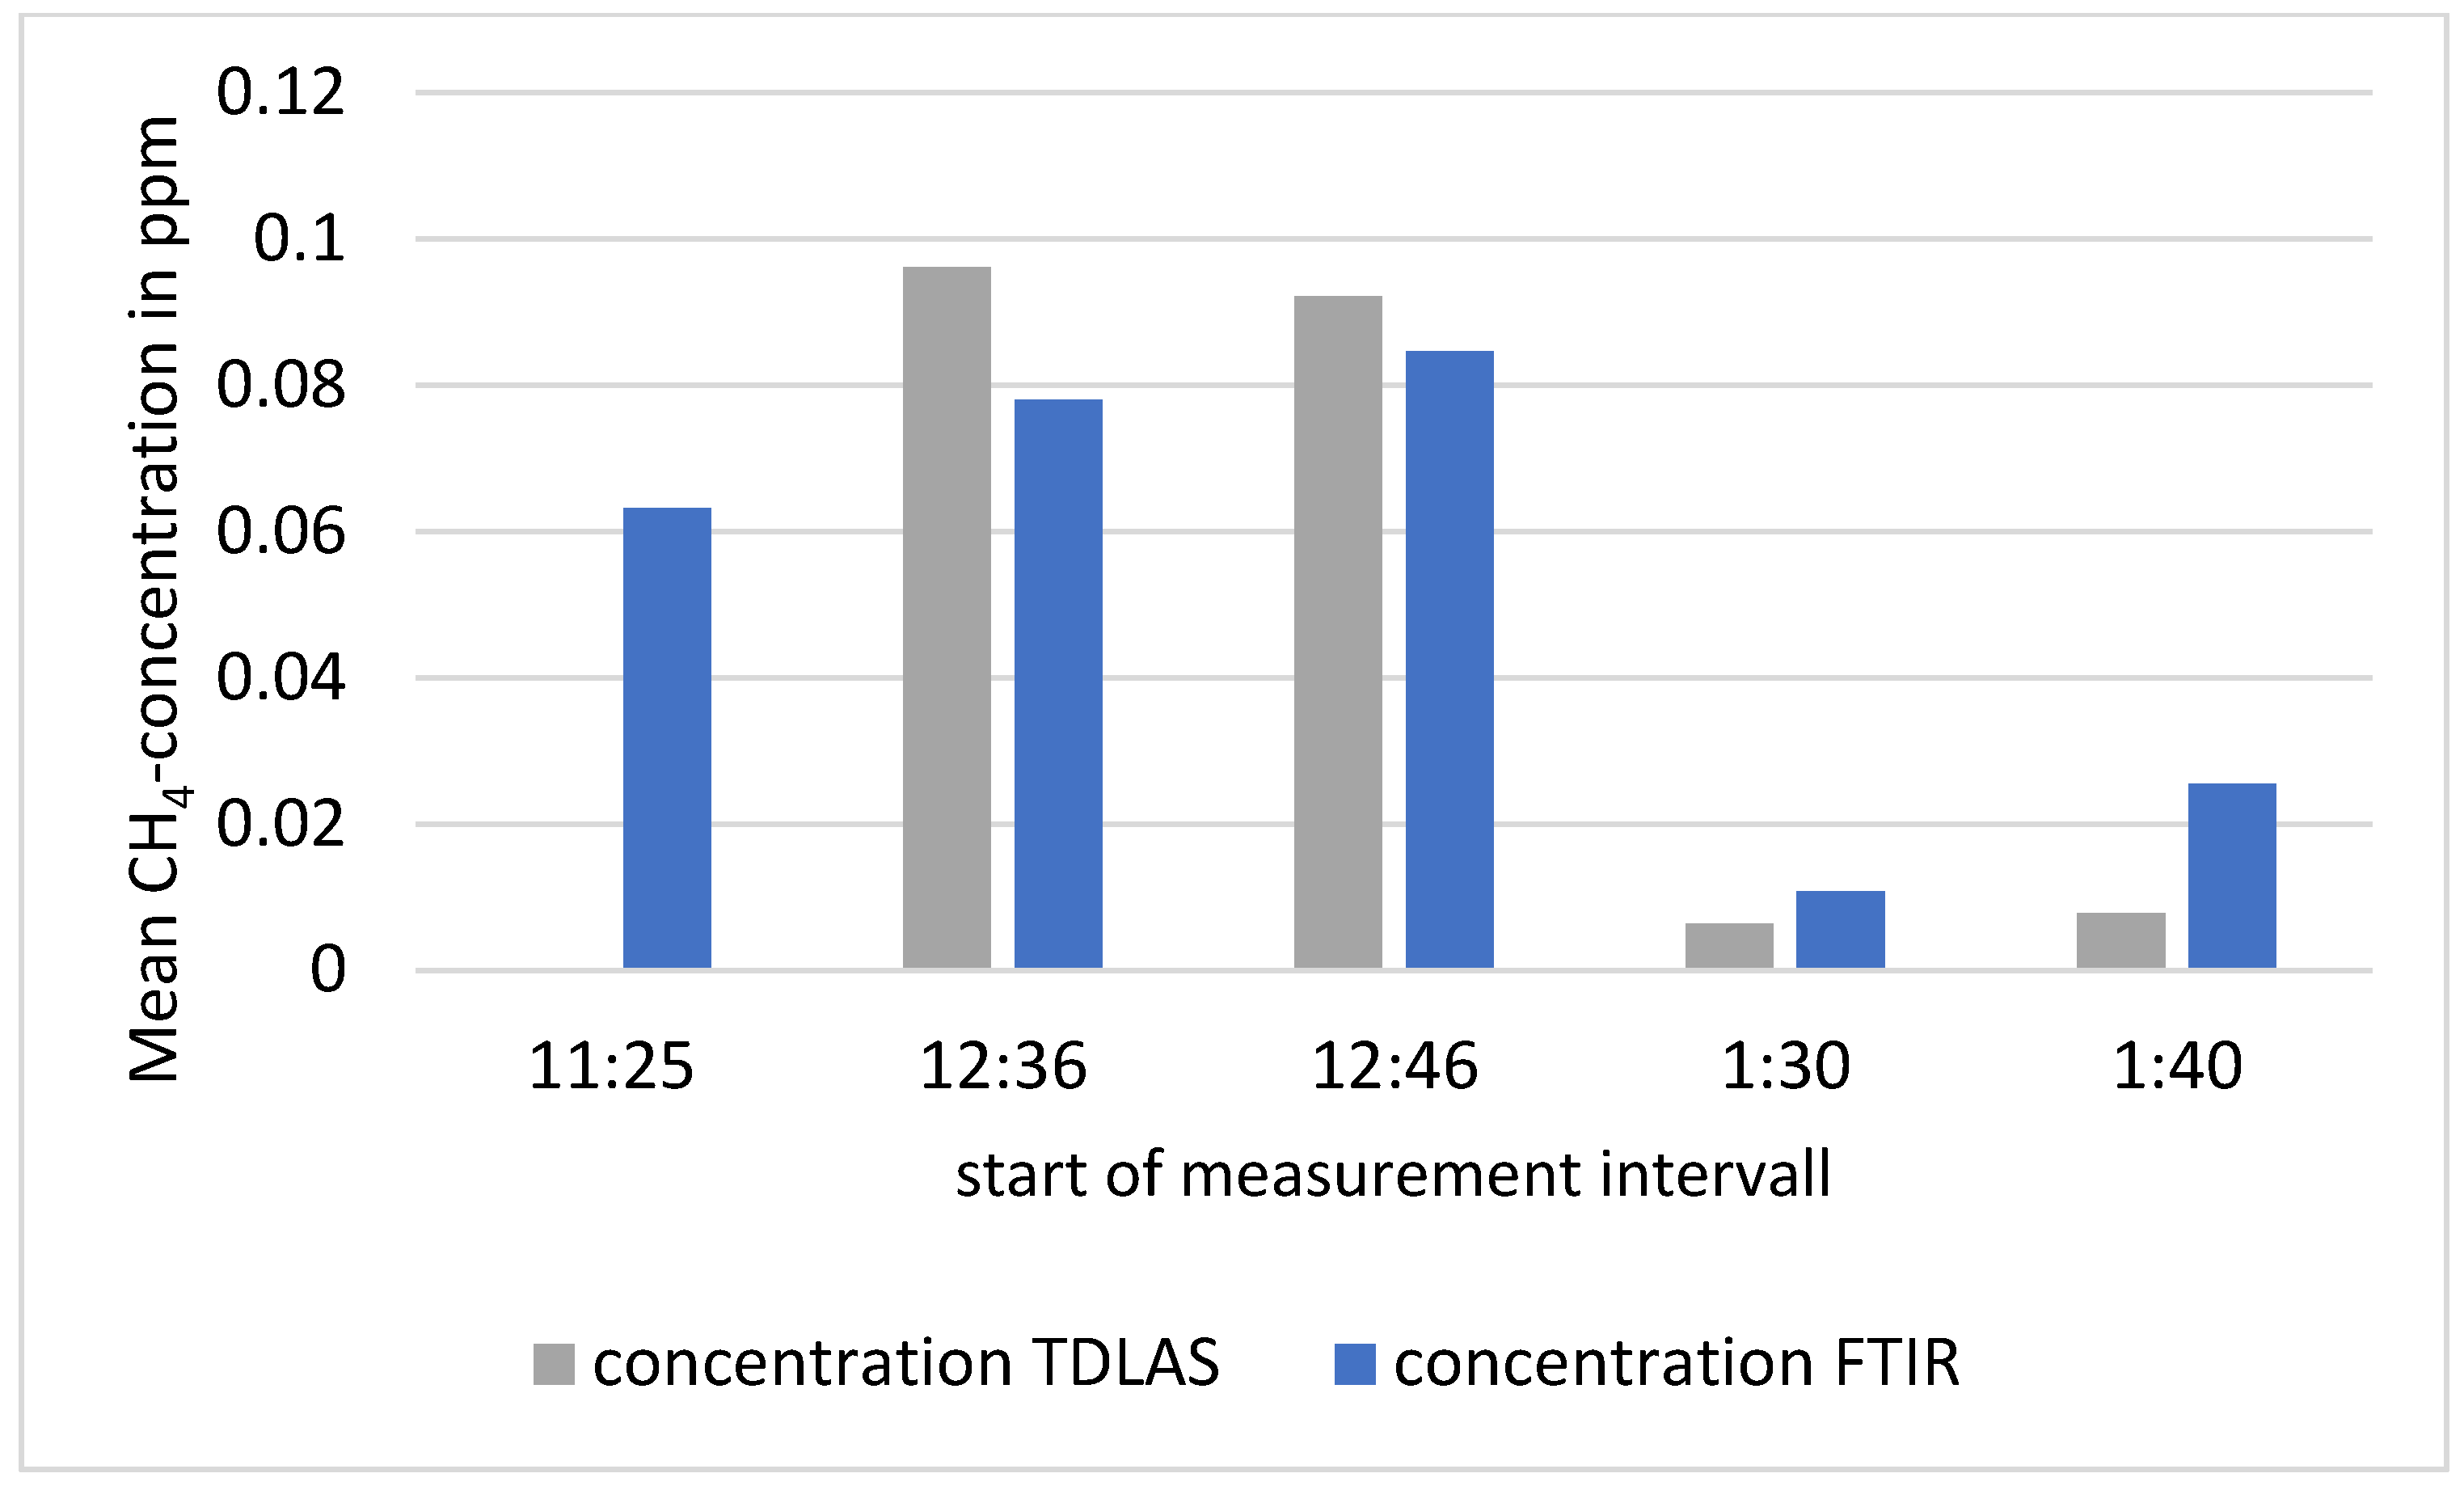
In Figure 3, the IDMM with TDLAS data could not determine an emission from the source for the interval starting from 11:25 a.m. An analysis of the raw concentration data of this interval showed that background concentration measured by GF3 and immission-side concentration measured by GF2 were identical (see also Figure 4). Probably, wind direction or a secondary source lead to this mismeasurement. The CH4 flow was also overestimated by the other two methods in this time interval, supporting the consideration of the bad wind direction. With respect to the results in the other intervals, this interval is dismissed from further observations. For the basic interpretation of the results shown in Figure 3 and Figure 4 shows the concentration data for the TDLAS instrument and the FTIR. For better comparison, the mean concentrations with compensated background were taken.
For the comparison of the concentration measurement, Figure 4 aids in interpretation of the results in Figure 3.
In the two intervals starting from 12:36 and 12:46, the tracer method overestimates the release by more than 200%, on average. For the low release-rates from 1:30 p.m. and 1:40 p.m., the overestimation is less than 50% lower, on average. The lowest overestimation occurs at the interval of 1:30 p.m., with an overestimation of less than 30% for the tracer method. Over all four intervals, the deviation of the calculated emission from the real release rate is 130% overestimation.
The IDMM based on TDLAS data also overestimates the emission released in the first two intervals. In the two intervals from 12:36 p.m. and 12:46 p.m., the overestimation is on average 77% from the real value. In the last two intervals from 1:30 p.m. and 1:40 p.m., the deviation is a 61% underestimation. Over all four intervals, the IDMM based on TDLAS has an 8% deviation from the real value. This deviation is very low, and not only in terms of percentage. The deviation in terms of emission is also very low. In this case, the release rates were between 0.16 g/s and 0.05 g/s. A deviation of 8% from 0.16 g/s gives a deviation of 0.01 g/s CH4. As the results from the release trial at the landfill show (see Section 3.2), this is much less than the fluctuations observed during the day. This result is in the same order of magnitude as that obtained by Wong et al. in their study [30]. They used a helicopter based measurement device and an artificial gas release at a landfill to calibrate their method. They found a deviation of −5.7% [30].
The IDMM with FTIR data seems to calculate the released amount of CH4 more precisely. The deviation in the two intervals from 12:36 p.m. and 12:46 p.m. accounts an underestimation of 15%, and in the second two intervals from 1:30 p.m. and 1:40 p.m., the deviation is on average 47%. This deviation can also be seen from the concentration measurements. The FTIR measured in the first two time intervals (12:36 and 12:46) had lower average concentrations than the TDLAS device. Especially of interest is the time interval starting from 1:30 p.m. Here, the FTIR measured a higher mean concentration than the TDLAS device, but the calculation with the IDMM gives slightly lower emission rates. One possible explanation can give the slightly different fetches of the measuring distances (see also discussion below and Figure 1). Over all four intervals, the deviation for the IDMM based on FTIR data amounts to a 31% underestimation.
As a short conclusion: For low emission rates, the tracer method seems to be the best choice. For higher emission rates, the IDMM based on FTIR data performed best, and for the overall look, the IDMM based on TDLAS data gave the best results.
For further control, the same methods were used to determine emissions from a landfill (see also Section 2.4 and Section 3.2).
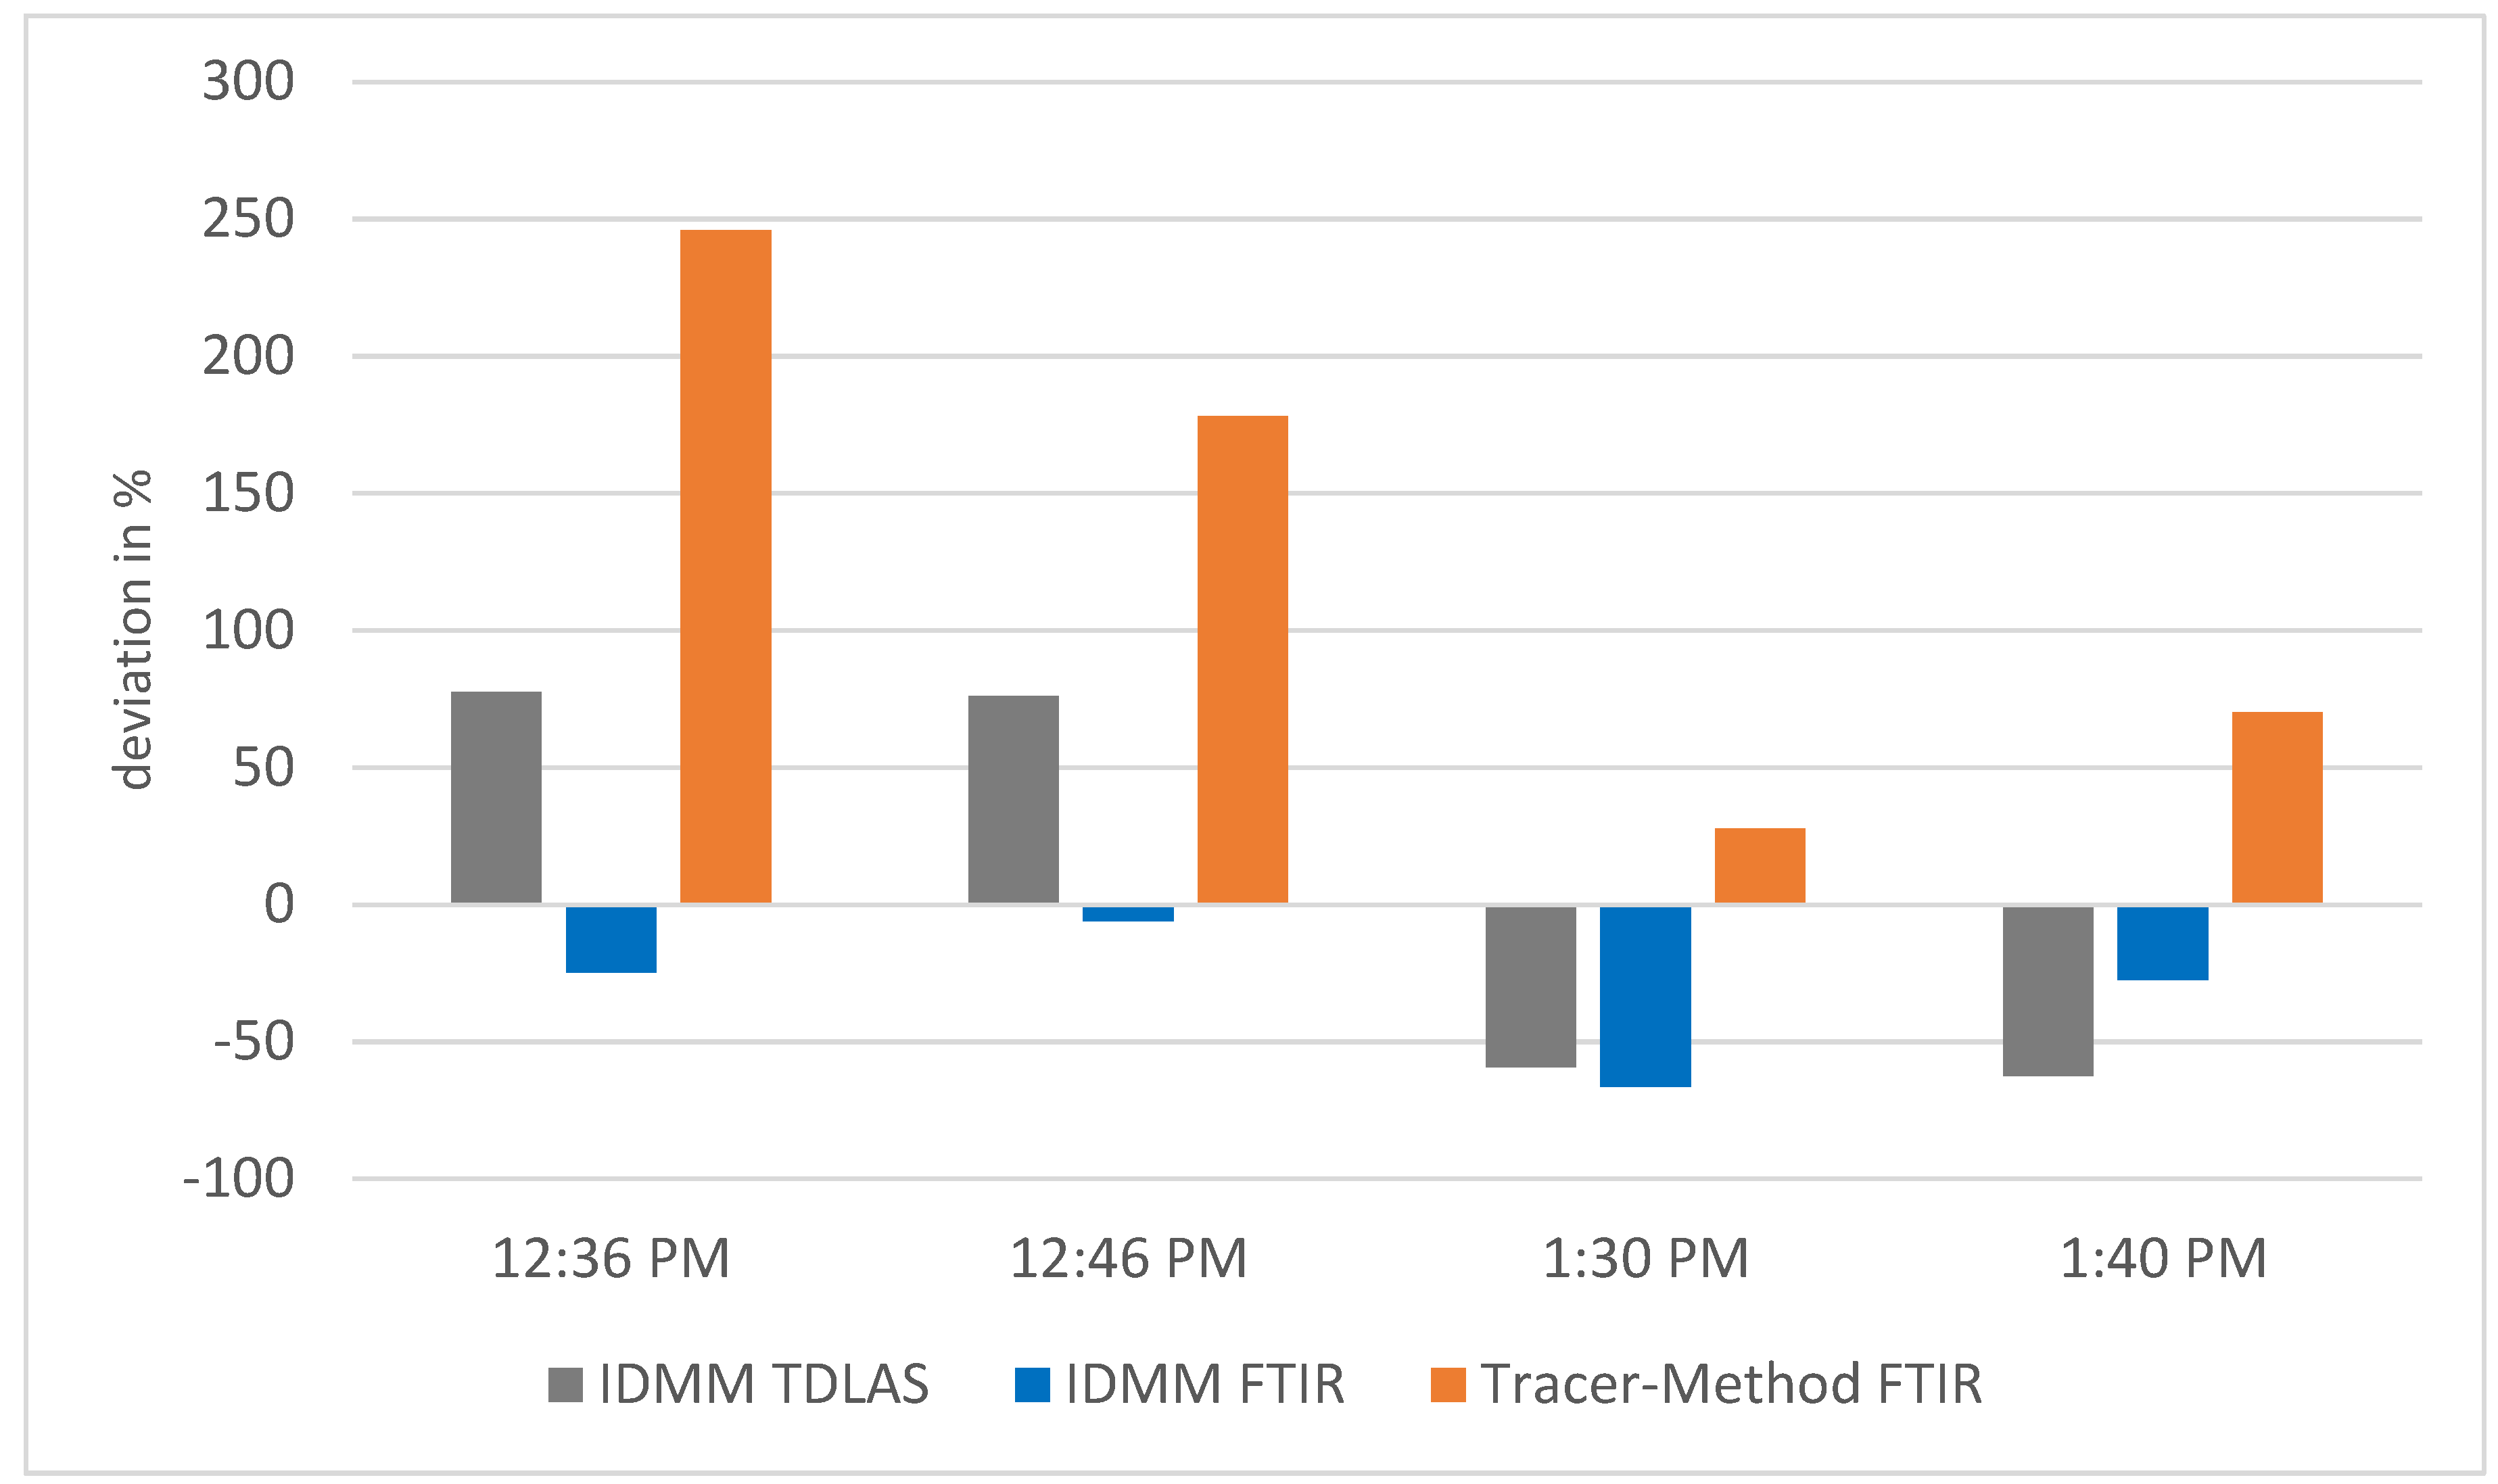
Figure 5 shows the calculated deviations from the released rates.
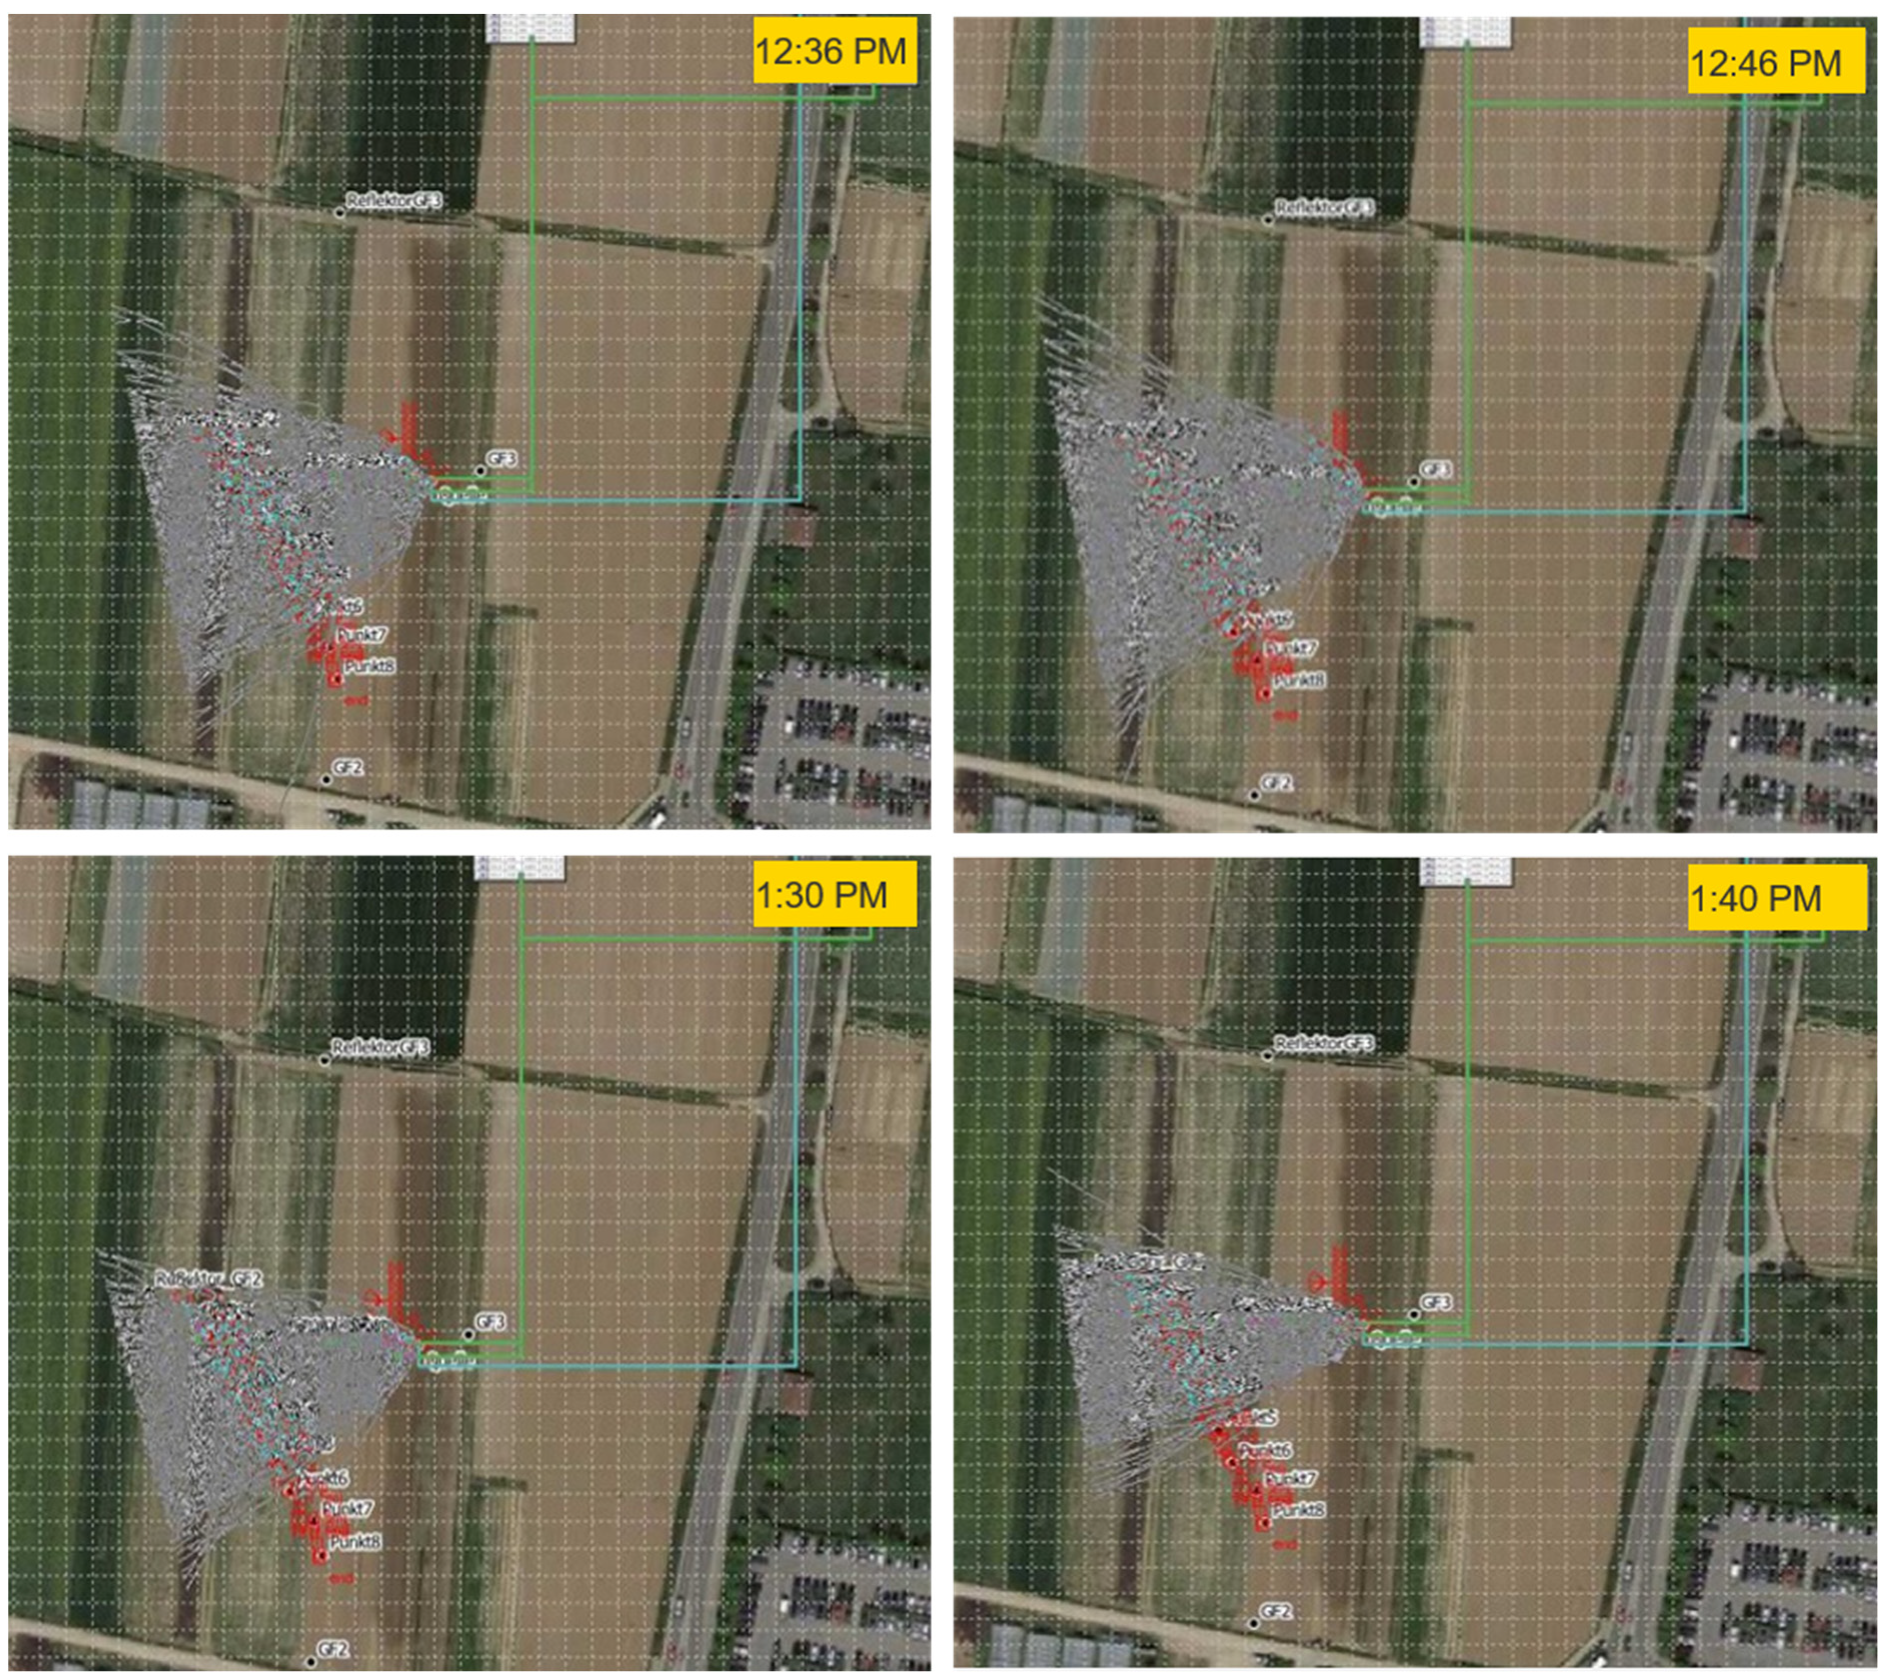
Within the time periods with the release of high amounts of CH4, the IDMM with TDLAS data overestimated the released CH4 amounts, whereas the IDMM with FTIR data obtained results with lower deviations. Figure 6 shows the dispersion situation for all four time intervals. Here, the dispersion situation shows a large fetch of the plume. The plume is wide, followed by high dilution of released gas and surrounding air. The measurement path with the TDLAS instrument covers a high percentage but not the whole plume intersect. By that, the program assumes that the whole plume is within the measurement path and the mistake occurs. The IDMM with the FTIR data obtains better results in this dispersion situation due to the high dilution factor in the wide plume. By carrying the FTIR and turning at the edges of the measurement path, more measurements occur in the edge regions than while walking the line. The edge concentration is counted as more important. In the dispersion situation with the wide plume, the FTIR measurement path covers a large part of the plume intersect and, due to the high dilution, the higher number of concentration measurements at the northern edge results in lower deviations than in a dispersion situation with a smaller plume intersect. In such a situation, the whole plume intersect is also not covered by the measurement path but, due to the lower dilution and hence higher concentrations in the plume, this results in higher deviations. The smaller plume is covered to a higher percentage with the measurement path for the IDMM with TDLAS data. This leads to lower deviations of the results. Figure 5 shows the associated percentage deviations.
Figure 6 shows the comparison of the dispersion situation in the two time periods with a release of high amounts of CH4 (Figure 6, upper) and in the two time periods with a release of lower amounts of CH4 (Figure 6, lower).

3.2. Emission Measurements at Landfill

Figure 7 shows the results of the emission measurements at a landfill on 19 November 2020. The blue line presents the continuously determined CH4 emissions from the landfill by IDMM based on TDLAS data. The red dots show the calculated CH4 emission by the IDMM based on D-FTIR data. The green dot represents the CH4 emission determined by the tracer method in the 10 min time interval starting from 1:45 p.m.
The results of all three emission quantification methods applied show a good agreement. The results of the emission measurements in Figure 5 show a gap for the intervals starting from 1:15 p.m. and 1:25 p.m. This gap is the result of filtering criteria regarding surface coverage with touchdowns of particles because of bad wind conditions. As explained above, the IDMM based on TDLAS data seen over long periods is the method with the lowest deviations. Therefore, the IDMM based on TDLAS data is here seen as a reference. The mean value of the emissions determined with the IDMM based on TDLAS data over the whole day is 0.63 g/s. For the IDMM with FTIR data, the lowest deviation is in the time interval from 12:25 p.m., with 13% underestimation compared to the emissions determined by IDMM with TDLAS data over the whole measurement time. The highest deviation from the emissions determined by IDMM with TDLAS data over the whole day occurred in the interval from 2:25 p.m., with 60% underestimation for the IDMM based on FTIR data.
Over the whole day, the emission deviations between IDMM based on TDLAS data and based on FTIR data are only 11%. The emissions determined with the tracer method deviates from the IDMM based on TDLAS data by 37%.
Because landfill emissions are not constant over time, the deviations between the determined emissions for each time-interval will also be compared. From that point, the lowest deviation from the IDMM based on TDLAS data is reached by the IDMM based on FTIR data, with a deviation of 14% in the time interval starting from 2:25 p.m. Seen over all three methods, the IDMM based on FTIR data’s deviations are 10% lower than the tracer method in the time interval starting from 1:45 p.m. The reason why the lowest deviation here is between two methods, where data acquisition is conducted by the D-FTIR, lies in the wind direction. With the D-FTIR, it is easy to react quickly to changing wind directions. With the TDLAS systems, this is due to the ground-based technique not being possible. While the drone was in the air, the wind was watched and, for changing wind conditions, the flight track was slightly adjusted to the wind direction. However, the main flight track marked in Figure 2 was not left.

3.3. Discussion

In general, the results of the measurements performed at the landfill show a higher agreement than the results of the release trial. The reasons for that are the following: For the release trial, a diffusor for the better dispersion of the gases was used. Nevertheless, the source is a small area. From the measurement distance and further downwind the diffusor can be equated with a point source. The gases disperse from this point source. In contrast, the landfill is a surface source. The emissions occur diffusely over the area and the plume is significantly wider. The other difference is that, at the landfill, the measurement is conducted on the surface of the landfill. Meaning, that the plume is not as dispersed as within the measurements for the emission quantification for the far away point source in the release trial.
Another reason is the higher emission releases of the landfill compared to the artificial point source in the release trial. Higher emissions and, therefore, concentrations are much easier to quantify correctly than very low emissions over far distances.
In comparison with the most widely used and established method of calculating the emission rates, the measurement based techniques used in this paper show a higher concordance, according to Scharff et al. [31]. In their study, Scharff et al. investigated that the deviations between calculated emissions and measured emissions are between 20% and 570% [31]. Compared to that, the deviations of the released gas and by measurement based methods determined that emissions were only between 8% and 130%. The uncertainties with calculating the emissions are much higher than with the measurement based method’s quantification.

4. Conclusions

This paper shows the results of two conducted trials. The pure release trial, without a landfill as a source, demonstrated that emission determination is possible with all three methods used. Over four release intervals, the IDMM based on TDLAS gave the best results. For low release rates, the results of the tracer method had the lowest deviations. For higher release rates, the IDMM based on FTIR data provided the best results. With these results, the second field trial with N2O release at a landfill was conducted. All three methods are suitable for emission rate quantification depending on the emission level and source location. In this trial, the results also matched well. The comparison between the three methods further shows that data acquisition with a drone based measurement device, here the FTIR, has the advantage of high flexibility and adaptability during changing wind conditions.
Depending on the explored site and the wind conditions, the IDMM based on both TDLAS measurements as well as based on FTIR measurements can deliver results with about the same accuracy and measurements and about the same effort.
The tracer method is only recommended for expected low emissions with unknown dispersion situations. The application of the tracer method must always be weighed due to the relatively large expenditure of the method (personnel, measuring instrument) and due to the climatic effect of the N2O released as a tracer.

Author Contributions

Conceptualization: D.M. and I.E.-W.; methodology: M.R., D.M. and I.E.-W.; software: I.E.-W.; validation: D.M., I.E.-W.; formal analysis: I.E.-W.; investigation: I.E.-W.; resources: M.R., D.M., I.E.-W.; data curation: M.R., D.M., I.E.-W.; Writing—original draft preparation: I.E.-W.; writing—review and editing: M.R., I.E.-W.; visualization: I.E.-W.; supervision: M.K.; project administration: M.K., M.R.; funding acquisition: M.K., M.R. All authors have read and agreed to the published version of the manuscript.

Funding

This research received no external funding.

Data Availability Statement

Not applicable.

Conflicts of Interest

The authors declare no conflict of interest.

References

  1. Dlugokencky, E.J. Global CH4 Monthly Means. Available online: https://www.esrl.noaa.gov/gmd/ccgg/trends_ch4/#global_data (accessed on 9 February 2021).
  2. IPCC. Klimaänderung 2014: Synthesebericht: Beitrag der Arbeitsgruppen I, II und III zum Fünften Sachstandsbericht des Zwischenstaatlichen Ausschusses für Klimaänderungen; IPCC: Genf, Schweiz, 2016. [Google Scholar]
  3. UBA. Nationale Trendtabellen für die Treibhausgas-Emissionen nach Sektoren des Klimaschutzgesetzes 1990–2018: Stand zur Vorjahresschätzung: 11.03.2020; Umweltbundesamt: Dessau-Roßlau, Germany, 2020. [Google Scholar]
  4. IPCC. Climate Change 2021: The Physical Science Basis; IPCC: Genf, Schweiz, 2021. [Google Scholar]
  5. United Nations. UN climate Change conference: COP 26. Available online: https://ukcop26.org/ (accessed on 23 December 2021).
  6. Nastev, M.; Therrien, R.; Lefebvre, R.; Gélinas, P. Gas production and migration in landfills and geological materials. J. Contam. Hydrol. 2001, 52, 187–211. [Google Scholar] [CrossRef]
  7. Rettenberger, G. Untersuchung zur Entstehung, Ausbreitung und Ableitung von Zersetzungsgasen im Abfallablagerungen; Umweltbundesamt: Dessau-Roßlau, Germany, 1982. [Google Scholar]
  8. Rettenberger, G.; Mezger, H. Der Deponiegashaushalt in Altablagerungen: Leitfaden Deponiegas. In Handbuch Altlasten und Grundwasserschadensfälle, 1st ed.; LFUBW, Ed.; AlfaWeb: Karlsruhe, Germany, 1992. [Google Scholar]
  9. Butz, W. Ansatz für die Schätzung der Luftseitigen Deponieemissionen für das E-PRTR., Umweltbundesamt, F. 3.3G [III]. 2006. Available online: https://wiki.prtr.bund.de/images/6/66/E-PRTR_CH4_Schaetzmethode_Deponien.pdf (accessed on 22 December 2021).
  10. Oonk, J.; Boom, A. Landfill Gas Formation, Recovery and Emissions. Dutch National Research Programm on Global Air Pollution and Climate Change. 1995. Available online: https://www.osti.gov/etdeweb/biblio/574892 (accessed on 13 December 2021).
  11. Figueroa, V.K.; Mackie, K.R.; Guarriello, N.; Cooper, C.D. A Robust Method for Estimating Landfill Methane Emissions. J. Air Waste Manag. Assoc. 2009, 59, 925–935. [Google Scholar] [CrossRef] [PubMed]
  12. Monster, J.; Scheutz, C. Quantification of the Methane Emission from Masons Landfill–Part II; Technical University of Denmark (DTU): Kongens Lyngby, Denmark, 2015. [Google Scholar]
  13. VDI 3790 Blatt 2. Umweltmeteorologie Emissionen von Gasen, Gerüchen und Stäuben aus diffusen Quellen Deponien: VDI-Richtlinie. Kommission Reinhaltung der Luft im VDI und DIN—Normenausschuss KRdL 2000. Available online: https://www.yumpu.com/de/document/view/31986572/table-of-contents-pdf-vdi (accessed on 13 December 2021).
  14. Flesch, T.K.; Wilson, J.D.; Harper, L.A.; Crenna, B.P.; Sharpe, R.R. Deducing Ground-to-Air Emissions from Observed Trace Gas Concentrations: A Field Trial. J. Appl. Meteorol. 2004, 43, 487–502. [Google Scholar] [CrossRef] [Green Version]
  15. Flesch, T.K.; Wilson, J.D.; Harper, L.A.; Crenna, B.P. Estimating gas emissions from a farm with an inverse-dispersion technique. Atmos. Environ. 2005, 39, 4863–4874. [Google Scholar] [CrossRef]
  16. Flesch, T.K.; Wilson, J.D.; Harper, L.A. Deducing Ground-to-Air Emissions from observed trace gas concentrations: A field trial with wind disturbance. J. Appl. Meteorol. 2005, 44, 475–485. [Google Scholar] [CrossRef]
  17. Flesch, T.K.; Harper, L.A.; Powell, J.M.; Wilson, J.D. Inverse-Dispersion Calculation of Ammonia Emissions from Wisconsin Dairy Farms. Trans. Am. Soc. Agric. Biol. Eng. 2009, 52, 253–265. [Google Scholar] [CrossRef]
  18. Zhu, H.; Letzel, M.O.; Reiser, M.; Kranert, M.; Bachlin, W.; Flassak, T. A new approach to estimation of methane emission rates from landfills. Waste Manag. 2013, 33, 2713–2719. [Google Scholar] [CrossRef] [PubMed]
  19. Vesenmaier, A. Validierung und Weiterentwicklung einer Methode zur Inversen Dispersionsmodellierung für die Quantifizierung von Methanemissionen. Doktorarbeit; Universität Stuttgart: Stuttgart, Germany, 2020. [Google Scholar]
  20. Hrad, M.; Vesenmaier, A.; Flandorfer, C.; Piringer, M.; Stenzel, S.; Huber-Humer, M. Comparison of forward and backward Lagrangian transport modelling to determine methane emissions from anaerobic digestion facilities. Atmos. Environ. X 2021, 12, 100131. [Google Scholar] [CrossRef]
  21. VDI 4285 Blatt 1. Messtechnische Bestimmung der Emissionen diffuser Quellen Grundlagen. VDI-Richtlinie. Kommission Reinhaltung der Luft im VDI und DIN—Normenausschuss KRdL 2005. Available online: https://www.vdi.de/fileadmin/pages/vdi_de/redakteure/richtlinien/inhaltsverzeichnisse/9601467.pdf (accessed on 13 December 2021).
  22. VDI 3790 Blatt 2. Umweltmeteorologie Emissionen von Gasen, Gerüchen und Stäuben aus diffusen Quellen Deponien. VDI-Richtlinie. Kommission Reinhaltung der Luft im VDI und DIN—Normenausschuss KRdL 2017. Available online: https://www.vdi.de/fileadmin/pages/vdi_de/redakteure/richtlinien/inhaltsverzeichnisse/2629351.pdf (accessed on 13 December 2021).
  23. Babilotte, A.; Lagier, T.; Fiani, E.; Taramini, V. Fugitive Methane Emissions from Landfills: Field Comparison of Five Methods on a French Landfill. J. Environ. Eng. 2010, 136, 777–784. [Google Scholar] [CrossRef]
  24. Allen, G.; Hollingsworth, P.; Kabbabe, K.; Pitt, J.R.; Mead, M.I.; Illingworth, S.; Roberts, G.; Bourn, M.; Shallcross, D.E.; Percival, C.J. The development and trial of an unmanned aerial system for the measurement of methane flux from landfill and greenhouse gas emission hotspots. Waste Manag. 2019, 87, 883–892. [Google Scholar] [CrossRef] [PubMed]
  25. Fredenslund, A.M.; Scheutz, C.; Kjeldsen, P. Tracer method to measure landfill gas emissions from leachate collection systems. Waste Manag. 2010, 30, 2146–2152. [Google Scholar] [CrossRef] [PubMed]
  26. Monster, J.; Kjeldsen, P.; Scheutz, C. Methodologies for measuring fugitive methane emissions from landfills—A review. Waste Manag. 2019, 87, 835–859. [Google Scholar] [CrossRef] [PubMed]
  27. Galle, B.; Samuelsson, J.; Svensson, B.H.; Börjesson, G. Measurements of Methane Emissions from Landfills Using a Time Correlation Tracer Method Based on FTIR Absorption Spectroscopy. Environ. Sci. Technol. 2001, 35, 21–25. [Google Scholar] [CrossRef] [PubMed]
  28. DIN EN 16253. Luftqualität—Messungen in der bodennahen Atmosphäre mit der aktiven Differentiellen Optischen Absorptionsspektroskopie (DOAS)-Immissionsmessungen und Messungen von diffusen Emissionen; Deutsche Norm. Kommission Reinhaltung der Luft im VDI und DIN—Normenausschuss KRdL 2013. Available online: https://www.beuth.de/de/norm/din-en-16253/170299920 (accessed on 13 December 2021).
  29. Gasmet Technologies Oy. FTIR Gas Analysis: White Paper. 2020. Available online: https://info.gasmet.com/download-ftir-technology-white-paper (accessed on 26 October 2020).
  30. Wong, C.L.Y.; Ramkellawan, J. Calibration of a fugitive emission rate measurement of an area source. J. Air Waste Manag. Assoc. 2013, 63, 1324–1334. [Google Scholar] [CrossRef] [PubMed] [Green Version]
  31. Scharff, H.; Jacobs, J. Applying guidance for methane emission estimation for landfills. Waste Manag. 2006, 26, 417–429. [Google Scholar] [CrossRef] [PubMed]
Figure 1. Aerial view of the release trial with the measuring distances for GF2 (yellow) and FTIR (red), with the positions of the anemometer and the source. The wind direction was northeast (blue arrow).
Atmosphere 13 00053 g001
Figure 2. Second field trial at landfill with measurement distance for GF3 (yellow) and for the D-FTIR (red), together with the positions of anemometer and source. The wind direction was west (blue arrow).
Atmosphere 13 00053 g002
Figure 3. Results of release trial with CH4 and N2O.
Atmosphere 13 00053 g003
Figure 4. Comparison of raw concentration data for the TDLAS instrument and the FTIR instrument.
Atmosphere 13 00053 g004
Figure 5. Percentage deviations of the determined CH4 amounts from the actually released CH4 amounts.
Atmosphere 13 00053 g005
Figure 6. Comparison of the different dispersion situations during the release trial. Upper left and right: release of high amounts of CH4. Lower left and right: release of low CH4-amounts. Yellow is the measurement path for the TDLAS device (GF2) and red is the measurement path for the FTIR.
Atmosphere 13 00053 g006
Figure 7. Results of emission determination on landfill with N2O release.
Atmosphere 13 00053 g007
Table 1. Time intervals and release rates for CH4 and N2O.
Time IntervalCH4-Release Rate in g/sN2O-Release Rate in g/s
11:25 a.m.–11:35 a.m.0.051
12:36 p.m.–12:46 p.m.0.161
12:46 p.m.–12:56 p.m.0.161
1:30 p.m.–1:40 p.m.0.050.1
1:40 p.m.–1:50 p.m.0.050.1
Publisher’s Note: MDPI stays neutral with regard to jurisdictional claims in published maps and institutional affiliations.