Article

NDVI Variation and Yield Prediction in Growing Season: A Case Study with Tea in Tanuyen Vietnam

1
State Key Laboratory of Information Engineering in Surveying, Mapping, and Remote Sensing, Wuhan University, Wuhan 430079, China
2
The Faculty of Tourism, Thai Nguyen University of Science, Thai Nguyen 250000, Vietnam
3
Collaborative Innovation Center of Geospatial Technology, Wuhan 430079, China
4
Faculty of Geography, Thai Nguyen University of Education, 20 Luong Ngoc Quyen, Thai Nguyen 250000, Vietnam
5
Department of Hydrology and Water Resources, University of Science, Vietnam National University, Hanoi, 334 Nguyen Trai, Thanh Xuan, Hanoi 100000, Vietnam
*
Author to whom correspondence should be addressed.
Atmosphere 2021, 12(8), 962; https://doi.org/10.3390/atmos12080962
Submission received: 29 June 2021 / Revised: 17 July 2021 / Accepted: 21 July 2021 / Published: 27 July 2021
(This article belongs to the Special Issue Tropical Ocean-Atmosphere Interaction and Climate Change)

Abstract

:
Tea is one of the most significant cash crops and plays an important role in economic development and poverty reduction. On the other hand, tea is an optimal choice in the extreme weather conditions of Tanuyen Laichau, Vietnam. In our study, the NDVI variation of tea in the growing season from 2009 to 2018 was showed by calculating NDVI trend and the Mann-Kendall analysis to assess trends in the time series. Support Vector Machine (SVM) and Random Forest (RF) model were used for predicting tea yield. The NDVI of tea showed an increasing trend with a slope from −0.001–0.001 (88.9% of the total area), a slope from 0.001–0.002 (11.1% of the total area) and a growing rate of 0.00075/year. The response of tea NDVI to almost climatic factor in a one-month time lag is higher than the current month. The tea yield was estimated with higher accuracy in the RF model. Among the input variables, we detected that the role of Tmean and NDVI is stronger than other variables when squared with each of the independent variables into input data.

1. Introduction

Tea is a perennial crop, which has an economically significant value in agriculture, and is an important economic driving force in developing countries such as Vietnam. Laichau province has very suitable climatic and soil conditions for the growth and development of tea trees, where high quality tea products are created such as Oolong, Sencha and Matcha and are highly appreciated by domestic and foreign consumers. Laichau tea industry brings great economic and social benefits in the area. Tea plays an important role in hunger eradication, poverty reduction and enrichment of Laichau farmers in general and Tanuyen district in particular. The economy in Tanuyen district is mainly agriculture, so the district has focused on exploiting the potentials and strengths to promote the development of the agricultural sector, in which tea is the main economic crop. Tea plant for the mountain folk of Tanuyen Laichau has special significant when bring long-term economic value.
Normalized Difference Vegetation index (NDVI) is a vegetation index relied on the contrast of the near-infrared band reflection (NIR) and the red band absorption. Observing the change of NIR and red light can provide an accurate indication of chlorophyll activity, which correlates with plant health. Rouse [1] proposed the normalized difference vegetation index based on red and near-infrared reflectance. The range of NDVI is from −1 to 1. High NDVI value corresponds to dense vegetation. Low or negative NDVI values represent clouds, snow, water, or a bright, non-vegetated surface [2]. The NDVI was considered an important indicator for measuring the coverage of vegetation [3]. Due to high space and time resolution and accuracy, remotely sensed data can effectively support for monitoring vegetation dynamics [4,5]. With the development of remote sensing technology, many high resolution images were used for tea plantation extraction [6,7]. In previous studies, many scholars have studied surface vegetation coverage at different spatial and temporal scales [4] based on time series data and spatiotemporal changes of NDVI [8]. Ning et al. [4] analyzed temporal and spatial changes of NDVI and explored the impacts of human activities on the observed NDVI changes on the northern Loess Plateau. They showed that the spatial distribution of the annual maximum NDVI gradually decreased from east to west. NDVI variation was studied in many previous researches [4,9,10,11]. Wang et al. [11] investigated the NDVI variation in the growing season and its response to climate change. Guo et al. [12] determined the NDVI in growing-season from April to October to avoid low NDVI values in winter. The mean NDVI was calculated to detect the vegetation variation and its relation to climate change. Spatiotemporal changes of NDVI was studied by Pan et al. [8]. Their result show that the annual average of NDVI has an upward trend in northern China.
The NDVI-climate relationship at different scales has been carried out in many previous studies. The changing climate has caused negative effects on a large scale on global ecosystems recently in [13,14]. Assessing the sensitivity of vegetation due to climate change was examined in many previous studies [15]. Many studies have been carried out to investigate the relationships between NDVI and its influencing factors, including climate conditions. Guan et al. [16] studied the changes of NDVI in the Hexi Corridor and its surrounding areas and showed a close relationship between variations in vegetation and precipitation within the Qilian Mountains region. The relationship between NDVI and climate in the grassland region of Northern China was analyzed by Zhao et al. [17]. The results concluded the strongest positive driving force is precipitation, followed by average temperature while the strong negative driving force is sunshine duration. He et al. [9] showed that the relationship between NDVI and precipitation is less than that with temperature. Joshi et al. [18] analyzed the spatial-temporal distribution of vegetation cover, and examined the relationship of temperature and precipitation with vegetation in Nepal by creating a time series of NDVI monthly for six months [18]. In addition, Zhan et al. [19] showed that NDVI has relationship with terrain attributes, particularly the aspect, slope and altitude. NDVI and its lag time to climatic were analyzed to examine their relation and show the spatial distribution of NDVI values in the growing season and the effects of different climatic factors on NDVI [20]. Pan et al. [8] show a higher correlation between NDVI and air temperature in high altitude alpine and plateau areas, while NDVI has a higher correlation with precipitation in grassland and desert grassland areas. The impacts of human activities on the NDVI were investigated in existing studies [11,16]. Inter-annual trends and seasonal variation of vegetation are recognized as indicators to identify the climatic change [21,22,23]. These researches approached NDVI in the relationship with temperature and rainfall. In fact, there are many parameters that may correlate with NDVI are listed: precipitation, average temperature, sunshine duration, slope and human activity. In our study, we combined multiple climatic data, including mean temperature (Tmean), minimum temperature (Tmin), maximum temperature (Tmax), precipitation (Pre) and solar radiation (SL) in the study area to examine the response of NDVI to climate factors in the growing season. The informative foundation that brings the measurement of these parameters are provided by Hydro-Meteorological station in Laichau province [24].
For crop yield prediction, two methods were widely used, including the process-based “crop models” and the “machine learning models”. The crop model forecasted yield by using the physiological characteristics of plants based on extensive input data to simulate crop growth and yield [25]. Machine learning-based models used historical data and do not directly rely on known physiological mechanisms for individual crops [26,27]. Multiple vegetation indices from MODIS data were applied to estimate the crop yield for wheat, corn, soybean, maize almond and tea through many other methods. The NDVI time series extracted from MODIS data were used to predict the corn and soybean yield in the United States [28]. NDVI and the Enhanced Vegetation Index (EVI) were combined to predict wheat yield [29], which were demonstrated having a good correlation with crop yield and have contributed to prediction of crop yield [30]. Zhang et al. [25] used NDVI and EVI from Landsat satellite observations to predict early and mid-season almond yield. Ana Paula et al. [31] relied on the correlation parameter approach of VIs to predict the maize yield. NDVI is an important part of increasing ability prediction in their combination with random forest. N. Rama Rao et al. [32] used NDVI, simple ratio and TVI for tea yield prediction based on leaf area index and weather parameters. Saumitra et al. [33] applied the remote sensing and GIS as tool to infer the potential of tea product by using NDVI image. Nitin K. et al. [34] attempted to build a tea yield prediction model based on LAI value derived from IRS-1C LISS-III sensor. These researches are used NDVI and climatic data for predicting tea yield; however, the combine machine learning is largely unknown. In our research, Support Vector Machine (SVM) and Random Forest (RF) were applied for tea yield prediction in the growing season. Our main objectives in this study are: (1) to detect temporal variation of tea NDVI in growing season in Tanuyen from 2009 to 2018; (2) to find out relationship between tea NDVI and climate variables; (3) to identify the best model for tea yield prediction in Tanuyen; (4) to explore the importance of variables in prediction tea yield.

2. Materials and Methods
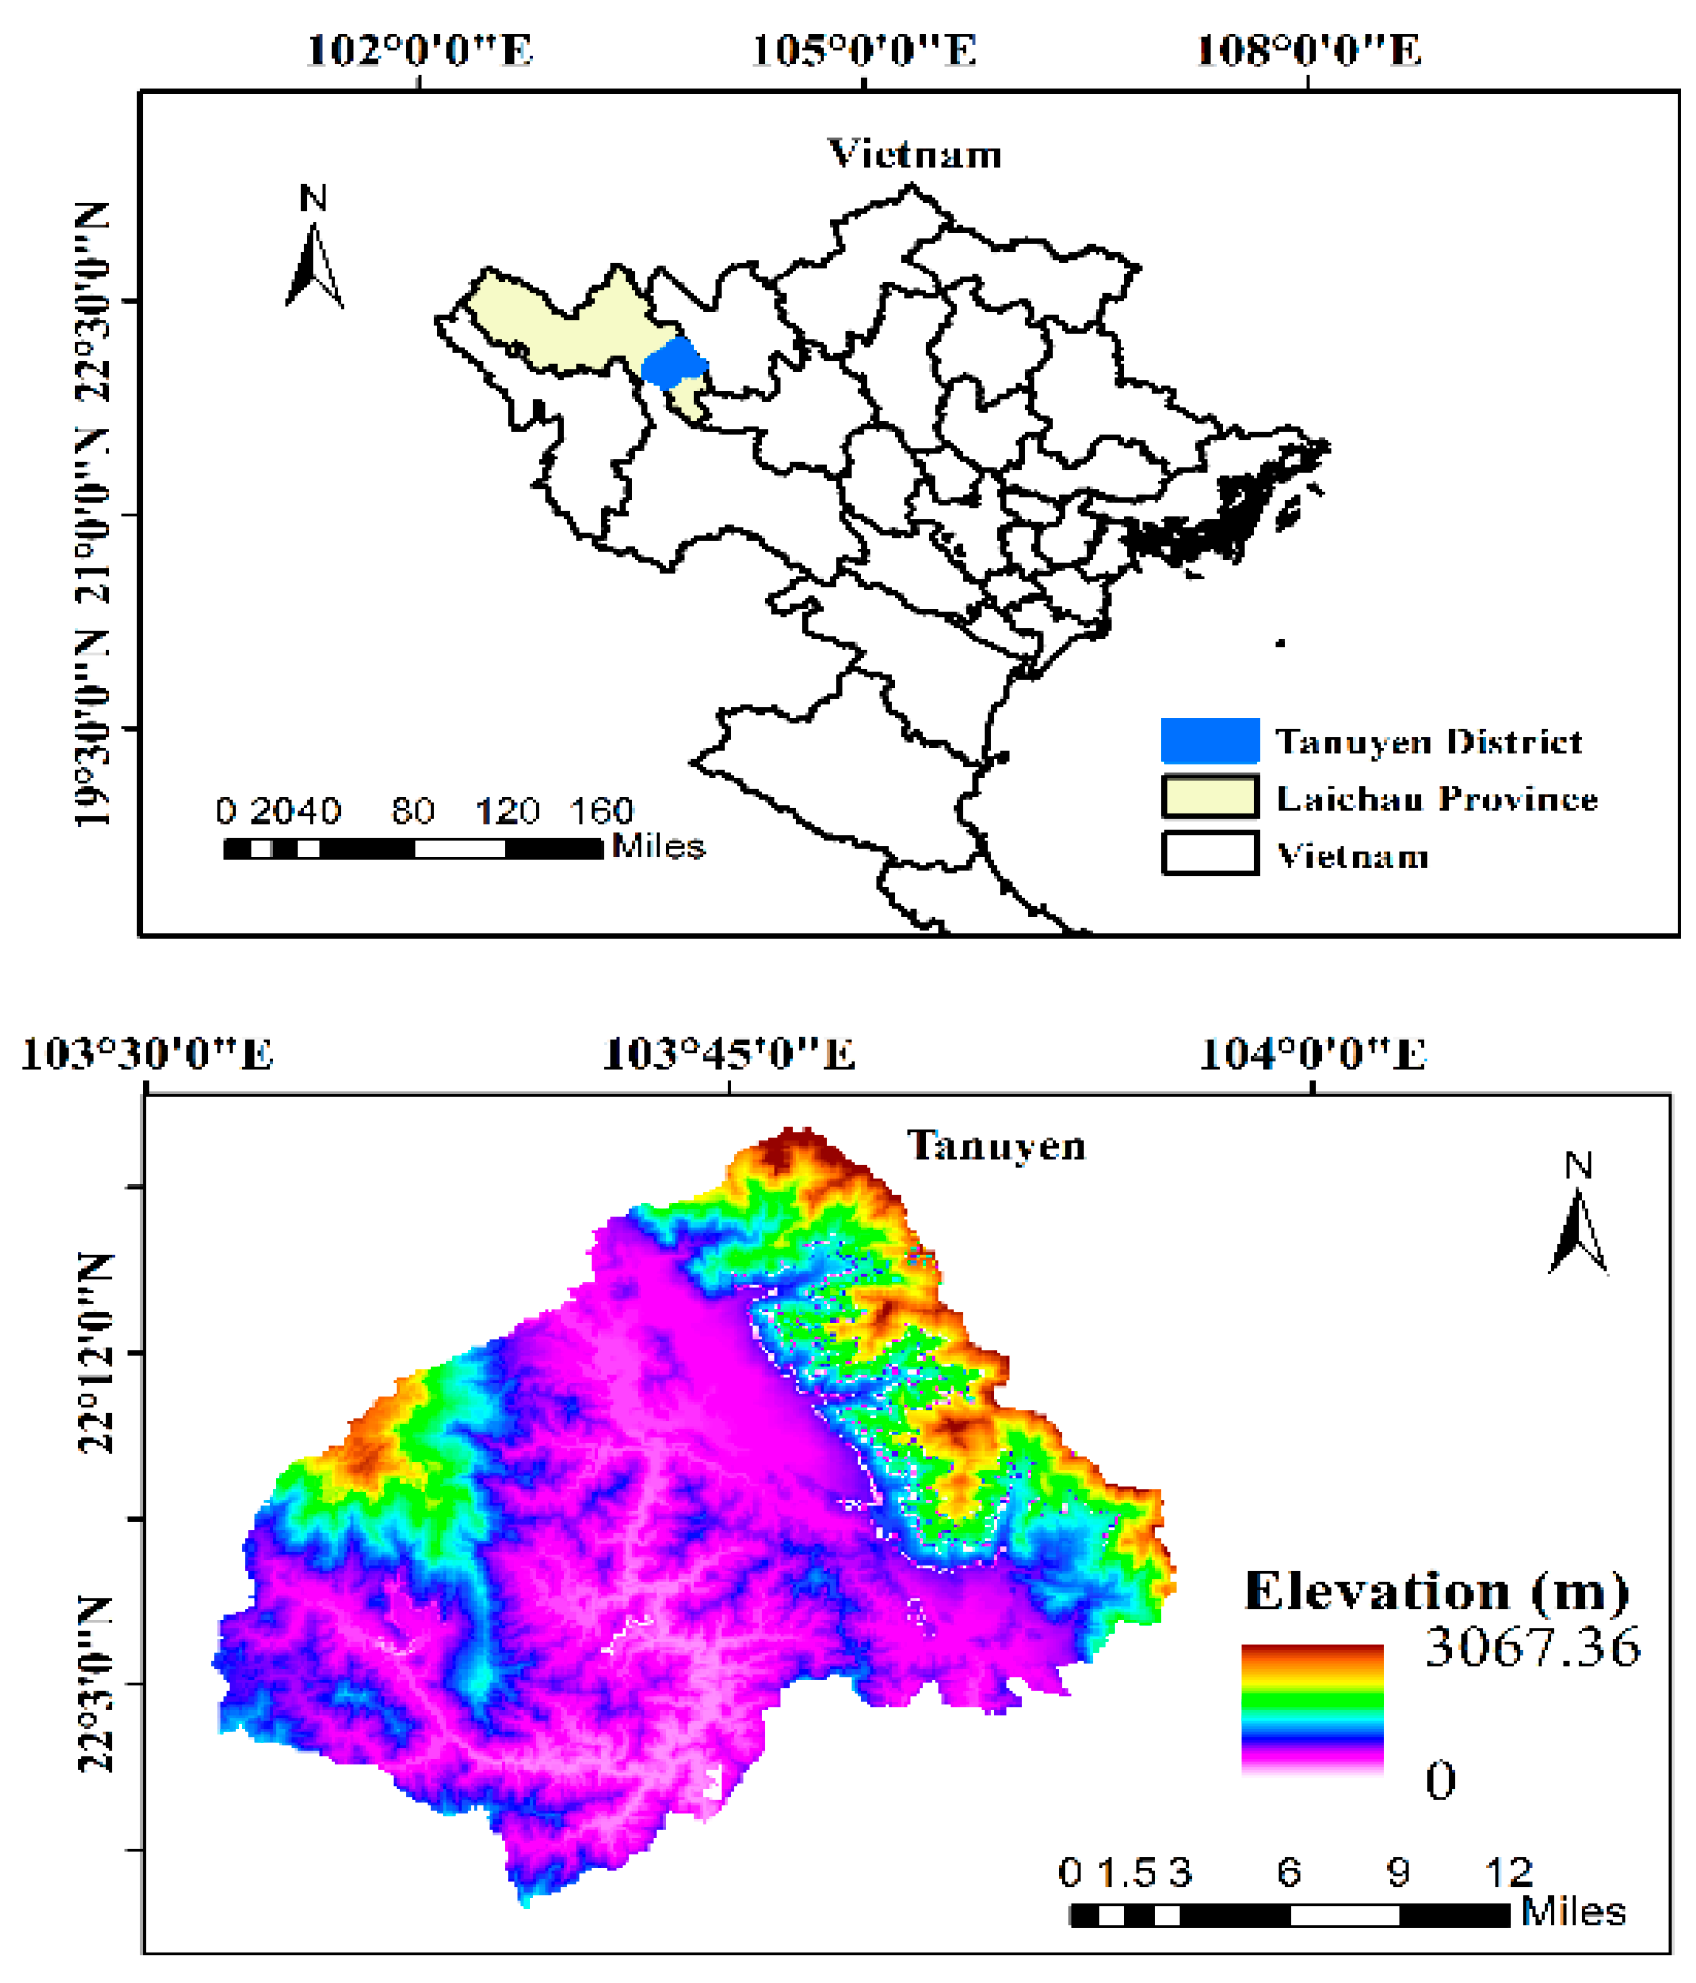
2.1. Study Area

Tanuyen is a district in the East region of Laichau Province, which was established in 2008 with an area of 903.27 km2 and 9 communes (Figure 1). There are 10 ethnic minorities, of which the Thai is predominant. Tea has been identified as an important crop and staple export in Tanuyen. The climate features tropical monsoons, hot days and cold nights. The climate of the year is divided into two distinct seasons: the rainy season from May to September, with high temperature and humidity and the dry season from November to March of the next year. The climate is cold, with low humidity and rainfall. The average annual temperature is about 21–23 °C. The average annual rainfall ranges from 2500–2700 m.

2.2. Data

NDVI data from 2010 to 2018 were obtained from the Terra Moderate Resolution Imaging Spectra radiometer (MODIS) Vegetation Indices (MOD13A3) Version 6 data, which are provided monthly at 1 kilometer (km) spatial resolution. In generating the monthly product, the algorithm ingests all the MOD13A2 products that overlap the month and employs a weighted temporal average. The average NDVI from April to October was examined as growing-season of NDVI, which reflect better the growth status of vegetation [35,36]. In the image processing step, geometric correction and radiometric correction procedures on NDVI were carried out. Then, NDVI value was extracted, aggregated on pixel by over tea area and mean value calculating.
Monthly meteorological data included precipitation, mean temperature (Tmean) minimum temperature (Tmin), maximum temperature (Tmax), precipitation (Pr) and solar radiation (SL) from Thanuyen weather stations for the period of 2010 to 2018, and has been subjected to quality control.
The land-use map in the year of 2018 were used in this study. It was produced from Sentinel-2 image using the supervised classification method with accuracy Kappa 95%. The tea area was extracted and aggregated from this map.
The tea yield (ton/ha) in growing season from 2009 to 2018 were calculated by total tea productivity (ton) per tea area (ha), which was provided by the Statistical Yearbook in Laichau and Department of Natural Resources and Environment, Tanuyen district. Therefore, the change of tea area in Tanuyen increased from 1208 ha (2009) to 2854 ha (2018) does not affect to tea yield in difference period.

2.3. Method

2.3.1. Calculation of NDVI Trends

The unitary linear regression method was used to estimate the NDVI trend which was calculate by ArcGIS 10.5 software to show the slope of NDVI period 2009 to 2018. The positive value of slope indicates an increasing trend of NDVI tea and the negative value of slope decreasing trend. The formula is expressed as follows:
θ s l o p e = n × i = 1 n i × N D V I i i = 1 n i × N D V I i n × i = 1 n i 2 ( i = 1 n i ) 2
where θ s l o p e represent the slope of the NDVI trend, i = 1 , 2 10 ,   n = 10 . θ s l o p e < 0 means that the average NDVI for growing-season from 2009–2018 is decreased and vice versa.
The Mann–Kendall analysis is a non-parametric test, which was developed by Mann and Kendall to assess trends in the time series. This trend analysis method was applied to determine the change of NDVI [11,37]. First, building a rank sequence d k for time series:
d k = i = 1 k r i
k is the dataset record length
r i = { 1 N D V I i > N D V I j 0 N D V I i < N D V I j } ( 1 j i )
The Z k statistic was calculated as in equation as follows:
Z k = d k M ( d k ) V a r ( d k )
M ( d k ) = k ( k 1 ) 4
V a r ( d k ) = k ( k 1 ) ( 2 k + 5 ) 72
where Z 1 is equal to 1. M ( d k ) calculates the mean of Z k statistic and V a r ( d k ) calculates the variance. The value of Z k is positive means an increasing trend, and vice versa.

2.3.2. Analysis of Relationship between NDVI and Meteorological Parameters

The Pearson correlation coefficients between the NDVI and the meteorological parameters were calculated to analyze their relationships. Considering the effects of interactions between air temperature, precipitation and net radiation on the NDVI, the partial correlation coefficients between the NDVI and meteorological variables were also calculated to determine the main meteorological driving factors that affect NDVI variations. The correlation coefficient, R can be expressed as follows:
R x y = i = 1 n [ ( x i x ¯ ) ( y i y ¯ ) ] i = 1 n ( x i x ¯ ) 2 i = 1 n ( x i x ¯ ) 2
where R x y is the Pearson correlation coefficients for x and y variable which have value from −1 to 1. x i is NDVI value in the ith month [38], y i is the mean monthly climate factor in the ith month [24] and x ¯ y ¯ are the average of x and y, respectively.

2.3.3. The Time Lags between NDVI and Meteorological Parameters

Vegetation is sensitive to climate change; however, the adaptability in different vegetation is under a specific environment. Braswell et al. [39] and Los et al. [40] show the time lag of vegetation growth on temperature. Meanwhile, the precipitation has a lag effect on vegetation growth in another study [41]. Many researches show that the lag time for NDVI response and climate factor [16,35,42,43,44]. Piao et al [35] indicated the temporal lag between NDVI and temperature with a time lag of 1 month, but there is only a 20-day period for a time lag in the three-river source region in the Qinghai-Tibetan Plateau in China according to Hu et al. [44]. Guan et al. [16] and Pei et al. [42] calculated the correlation coefficients in the corresponding period and the preceding 3 months between NDVI and climatic variables. In our study, we calculate the lag correlation coefficients of NDVI and climate variables of the previous 2 months, the previous month and current month. The expression is as follows:
R = m a x { R 0 , R 1 , R 2 , R n 1 , R n }
where R is the lag correlation coefficients, and n is the number of samples. R 0 , R 1 , R 2 , , R n are the lag coefficients of mean NDVI and the previous 2 months, the previous month and the current month, respectively.

2.3.4. Support Vector Machine and Random Forest for Estimating Tea Yield

SVM is a non-parametric supervised algorithm, which was firstly introduced for classification and then extended for regression problem [45]. SVM regression algorithm with input space was a non-linear mapping through a kernel function to balance between minimizing errors and the Gaussian kernel function is best performed in this study.
Random forest is a classification problem, including many decision trees while each tree is created from the choice random variable set and data set. From a large number of individual trees generated, they voted the most popular classes. Many research showed that RF may reach the best predictive performances compared to other methodologies [38,45,46].
In our study, the square of all independent variables were taken in turn to find the best performances in tea yield prediction.
We appraised accuracy of model by calculating the following metrics: the coefficient of determination ( R 2 ), the root-mean-square error (RMSE), mean Squared Error (MSE), and percentage errors of tea yield in each model (PETY):
MSE = i = 1 n ( x i y i ) 2 n
RMSE = i = 1 n ( x i y i ) 2 n
PETY = | x i y i | | y i | 100
where n (i = 1, 2,…, n) is the number of samples in growing season of tea used for SVM, RF, TLRM model, x i is the observed tea yield, y i is the predict tea yield.

3. Results

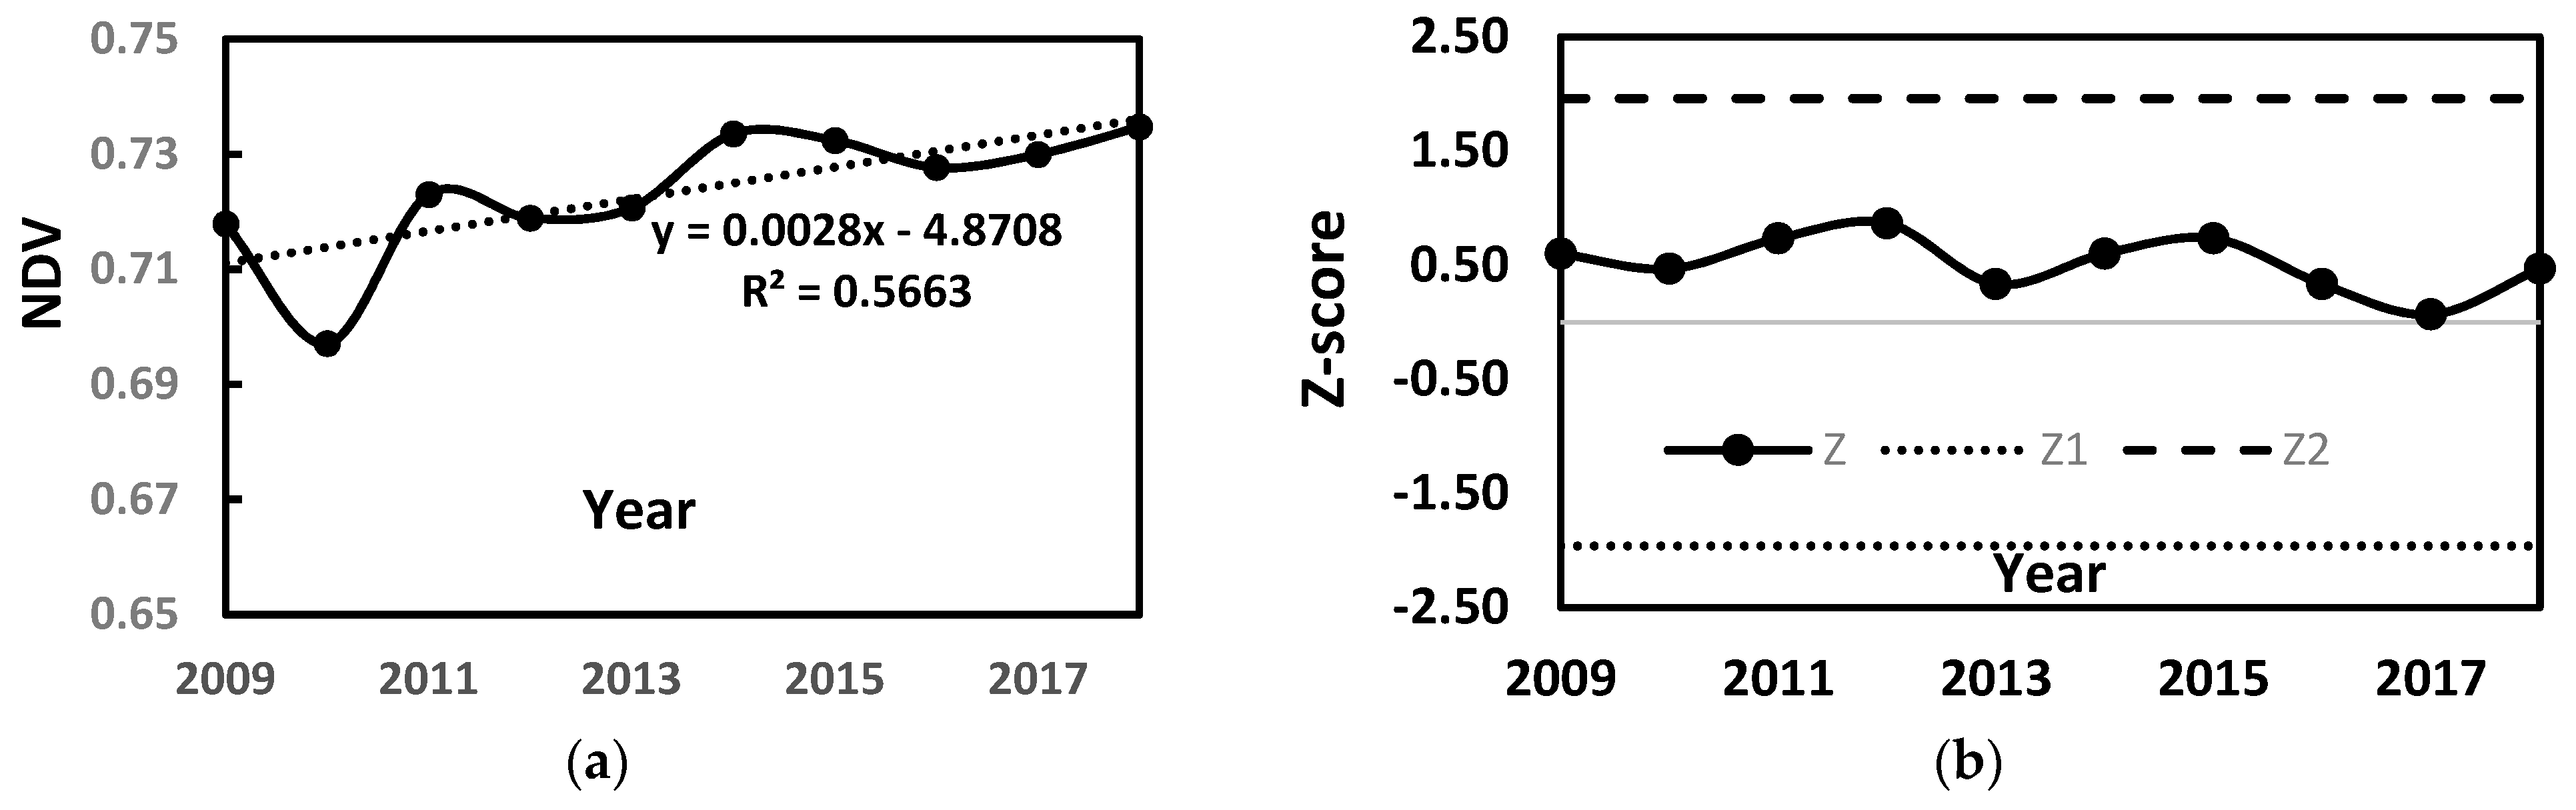
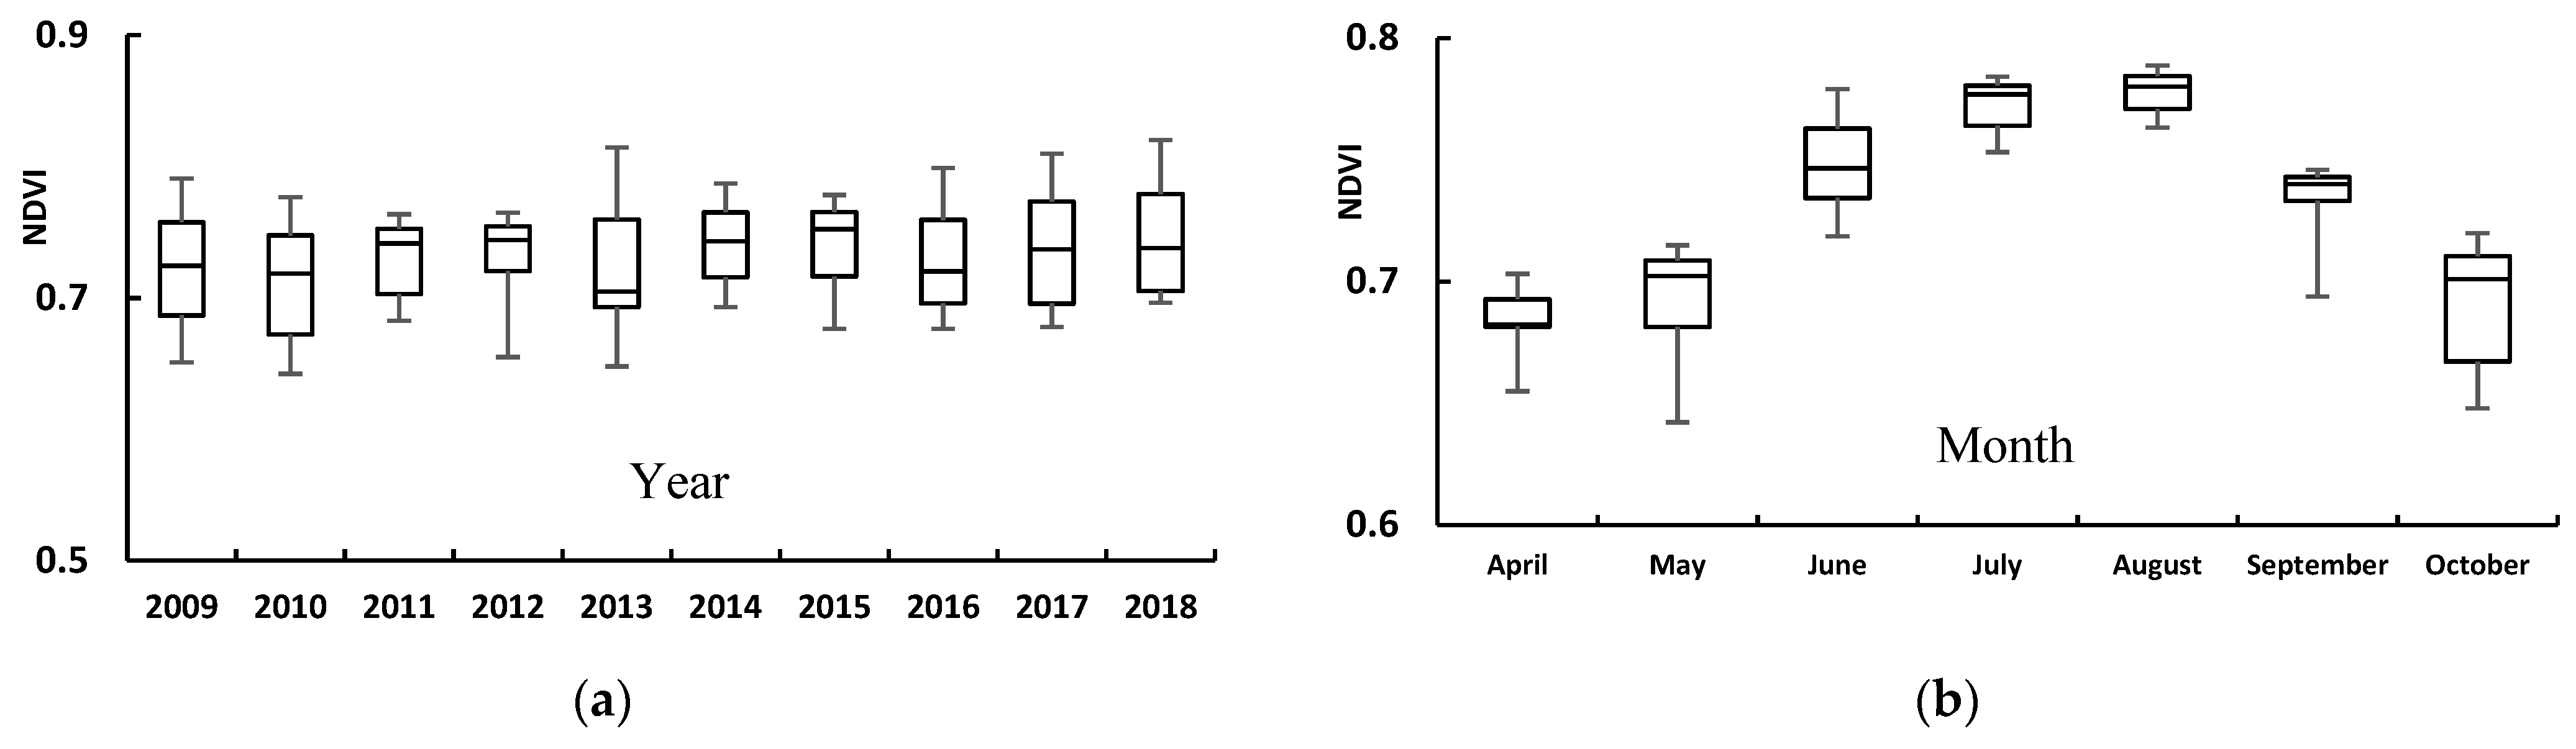
3.1. Temporal Variation in Normalized Difference Vegetation Index (NDVI) of Tea

The spatial distribution of the tea NDVI in the growing season in the Tanuyen from 2009 to 2018 showed not much regional difference with over 0.64 mean NDVI value. The maximum NDVI value was 0.77 which was a garden of central sub-area (CSA). The multiyear average NDVI in the growing season was 0.72, of which the area was 0.64 to 0.68 covering 7.6% of the total tea area, mainly including CSA and Phuc Khoa sub-area (PKSA). The area with NDVI values between 0.69 and 0.72 covered 41.8% of the area, including three sub-areas, of which is mainly CSA. The areas where NDVI was > 0.72 covered over 50% of the total tea area and was mainly distributed in CSA.
To monitor the variation trend of tea NDVI from 2009 to 2018, we calculated the NDVI slope value using Equation (1). The NDVI change trend is displayed in Figure 2b. We divided the NDVI slope into 5 grades, as shown in Table 1. According to the statistics, there can be seen an increasing trend of tea NDVI from Figure 2b and Table 1. There are no obvious regional differences in tea NDVI value, but a difference of NDVI value at some small garden of the in a sub-area. According to the statistic, from 2009 to 2018 (Table 1), the area of NDVI with an increasing trend cover 40.53% of the total tea area and mainly distributed in CSA. The fast-increasing area cover 11.03% of the total area and slow-increasing area cover 29.5%. The trend of NDVI remained basically unchanged account covered 32.6% total area, appears in three sub-areas. The decrease trend of tea NDVI mainly distributed in PKSA. The trend statistic of tea NDVI was shown that from 2009 to 2018 the mean grow rate of 0.0075/year, in which a slope of tea NDVI < 0 to 0.001 cover 88.9% total tea area, a slope from 0.001–0.002 cover 11.1%% total tea area.
In Figure 3a, we can see the change of tea NDVI following temporal in Tanuyen with increased slowly and unstable trend. The NDVI change was represent in the direction: decrease NDVI value from 2009 to 2010, and significant increase from 0.69 (2010) to 0.73 (2018). In this period, the maximum NDVI value in growing season is in 2018. From the Mann-Kendall test in Figure 3b we can see the NDVI of tea represent an increasing trend with positive z-score value and S > 0. However, according to the results of the Mann-Kendall test, the average month NDVI in the growing season only in 2011, 2012 and 2015 are statistically significant (p < 0.05). The NDVI showed a highest rising trend in 2012.
The increasing trends in NDVI was obvious in many regions in the world, but the NDVI changes of tea in Tanuyen were relatively small in spatio-temporal. This increasing trend was effected by climate factor or not we will have discussed in the subsequent analysis. The change of tea NDVI in within growing season and in the inter growing season were displayed in Figure 4. In Figure 4a, the mean NDVI of tea in growing season is higher 0.7 with the highest value of 0.73 in 2018 and the lowest value of 0.69 in 2010. This change has related with widen the building area in 2010 and the result of planning expand acreage tea of two periods: 2011–2015 and 2015–2020. In the Figure 4b, we can see that the mean NDVI in inter growing season increased gradually from about 0.68 (April) to about 0.78 (August) and decreased gradually from August to October. The mean NDVI is highest in July and August and lowest in April.

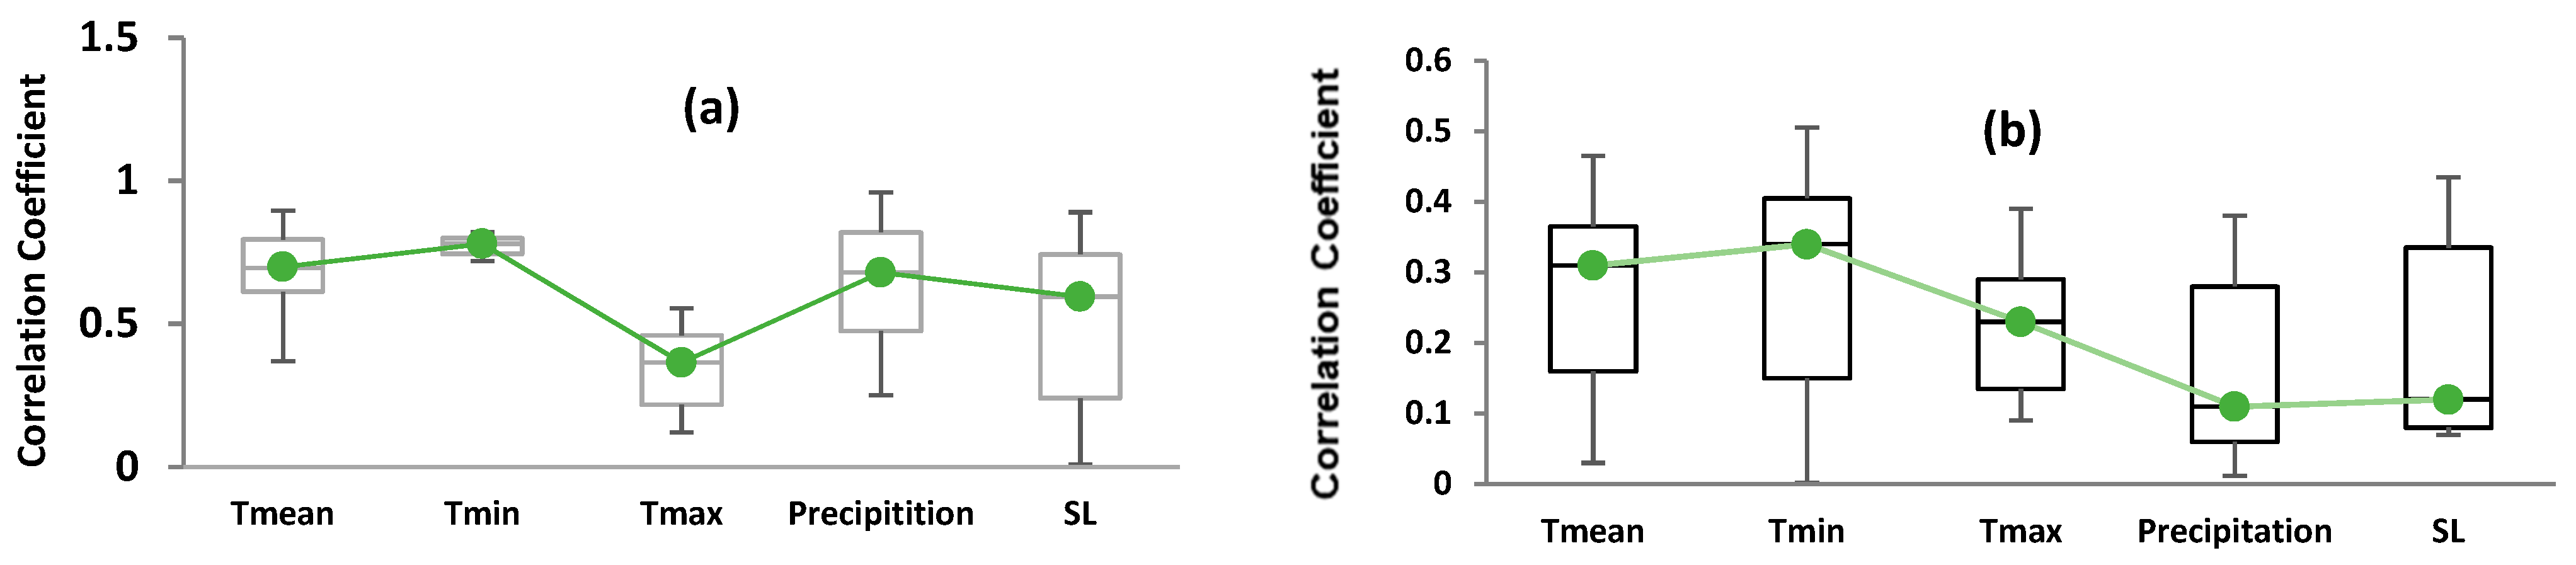
3.2. Relationship between NDVI and Climate Variables

3.2.1. Relationship between NDVI and Climate Variables in Current Month

The NDVI trends due to climate changes was determined different in the growth phase of vegetation types [35]. Therefore, we carried out Pearson correlation coefficients (R) for tea NDVI and the climatic variables to show the change of R between them at multiple time scales. From 2009 to 2018, the coefficient of determination ( R 2 ) between NDVI and climatic variables in growing season of study area is 0.63 (p < 0.0001). To understand the impact level of each variable, we analyzed the correlation of tea NDVI and the variables in growth season (April to October) from 2009 to 2018. In general, the correlation of NDVI and variables is relatively high and significant (except Tmax). In Table 2, the R of NDVI and the variables are 0.68 (p < 0.005) with Tmean, 0.72 (p < 0.0001) with Tmin, 0.01 (p > 0.005) with Tmax, 0.62 (p < 0.005) with Pre and 0.4 (p < 0.005) with SL.
In the inter-growing season the value R between tea NDVI and climate factors are not high but there is positive correlation (Table 3). In terms of temperature, the Tmean had a significant impact on tea in June, August, September, October but this value is low in April and July. In Tmin the value R is significant in May, July, August and highest in September and October. With Tmax, there is a highest significant positive correlation in June and July. In terms of precipitation, the precipitation is sensitive on tea in June and October. In solar radiation, the value had significant impact on tea in July and October.
We analyzed the modification in the R value between NDVI and climate variables in within growing season and in the inter growing season (Figure 5). In the two method, with the change of time series, the value of R has increased trends and fluctuated slightly in all factor. In multi time scales (Figure 5a), the value of R between tea NDVI and Tmin is highest (R = 0.8), and the fluctuation is relatively small. This value is decreases in order: Tmean > Pre > Solar > Tmax, in which a smallest the fluctuation on Tmax and a highest the fluctuation on SL. In the inter-growing season (Figure 5b), the impact level of the climatic variables on NDVI is smaller than in growing season. NDVI had a higher value of R with Tmin (0.31) and a largest fluctuation. The significant correlation between NDVI and other variables decreased in order: Tmean > SL > Precipitation and smallest in Tmax.

3.2.2. Relationship between NDVI and Climate Variables in Lag Time

We calculated the R value between NDVI and climate factor for the current month and previous month (Table 2), in which NDVI was positively correlated with all climatic variables of current month and previous month. With a 1-month time lag, the response between the NDVI and Tmean is an extremely significant. Compared with Tmax, Tmin had a higher impact on NDVI tea in current month and lagged month. The precipitation plays an important role in impact on NDVI tea in the current month and the lag month, but the R value of lag month is higher. NDVI was positively correlated with SL in current month and the lag month.
The NDVI response to each variable in the current month and lag month are different, and the higher R value is considered as the lag month. In Figure 6, the response of tea NDVI to almost climatic factors with general month lag time (except Tmin). In terms of mean temperature, its impact on NDVI is more sensitive in the current month than in a 1-month time lag (except September). For Tmin, the response of tea NDVI is mainly occurred in current month from May to October and the lag response occur in April. NDVI was mainly affected by the Tmax and SL of the previous month in all months of the growing season except August. NDVI was sensitive to the precipitation of the one-month time lag in April September, and NDVI was significantly affected by the precipitation of the current month in October.

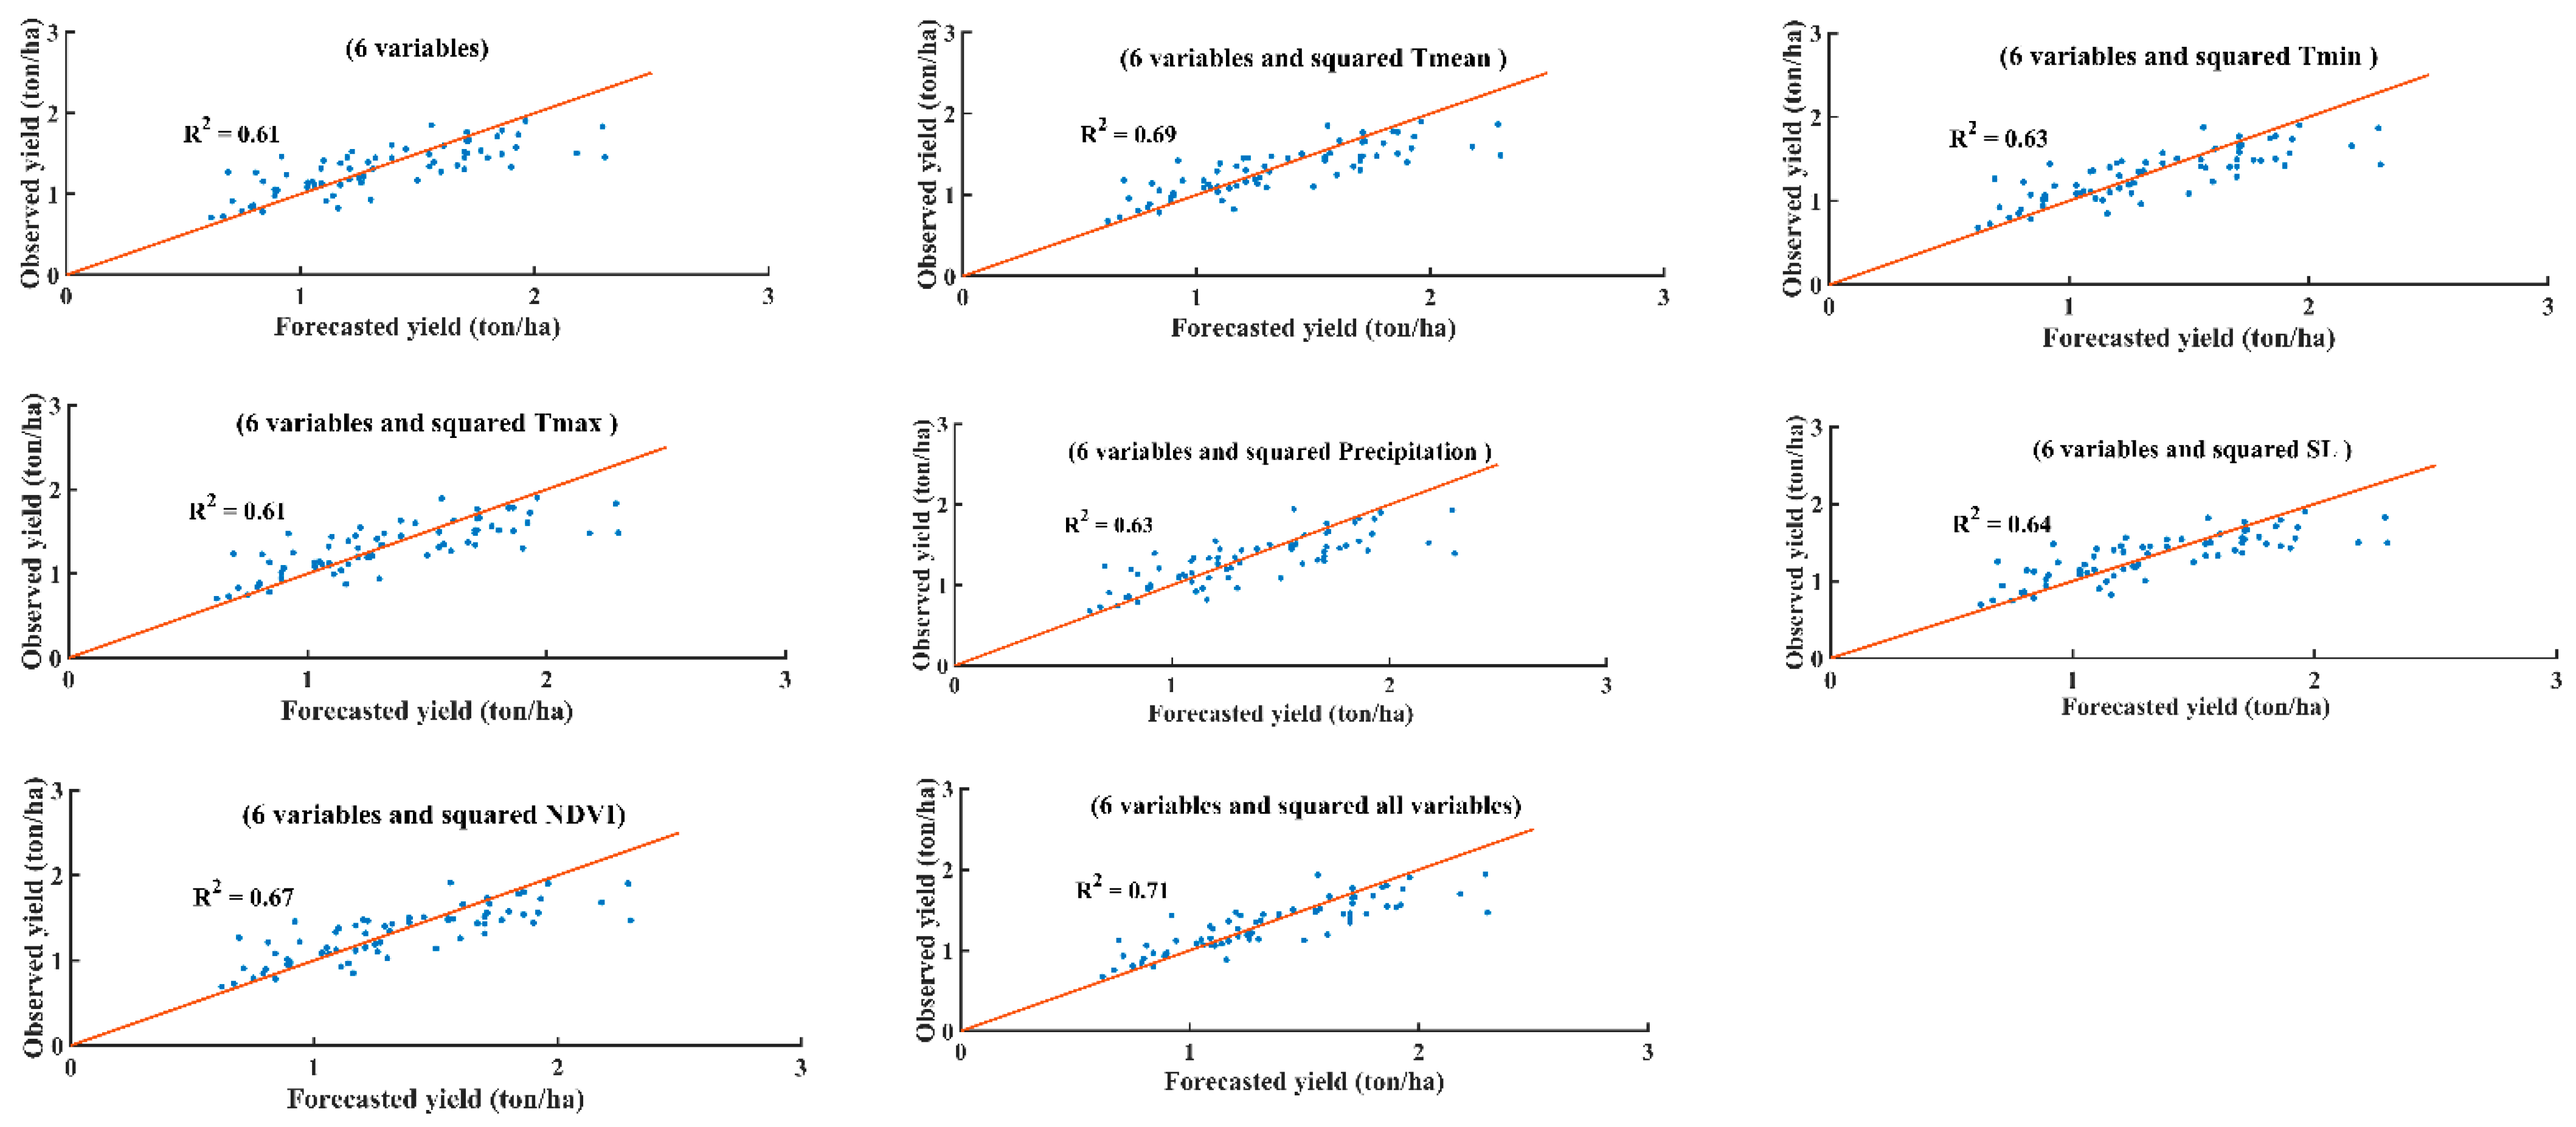
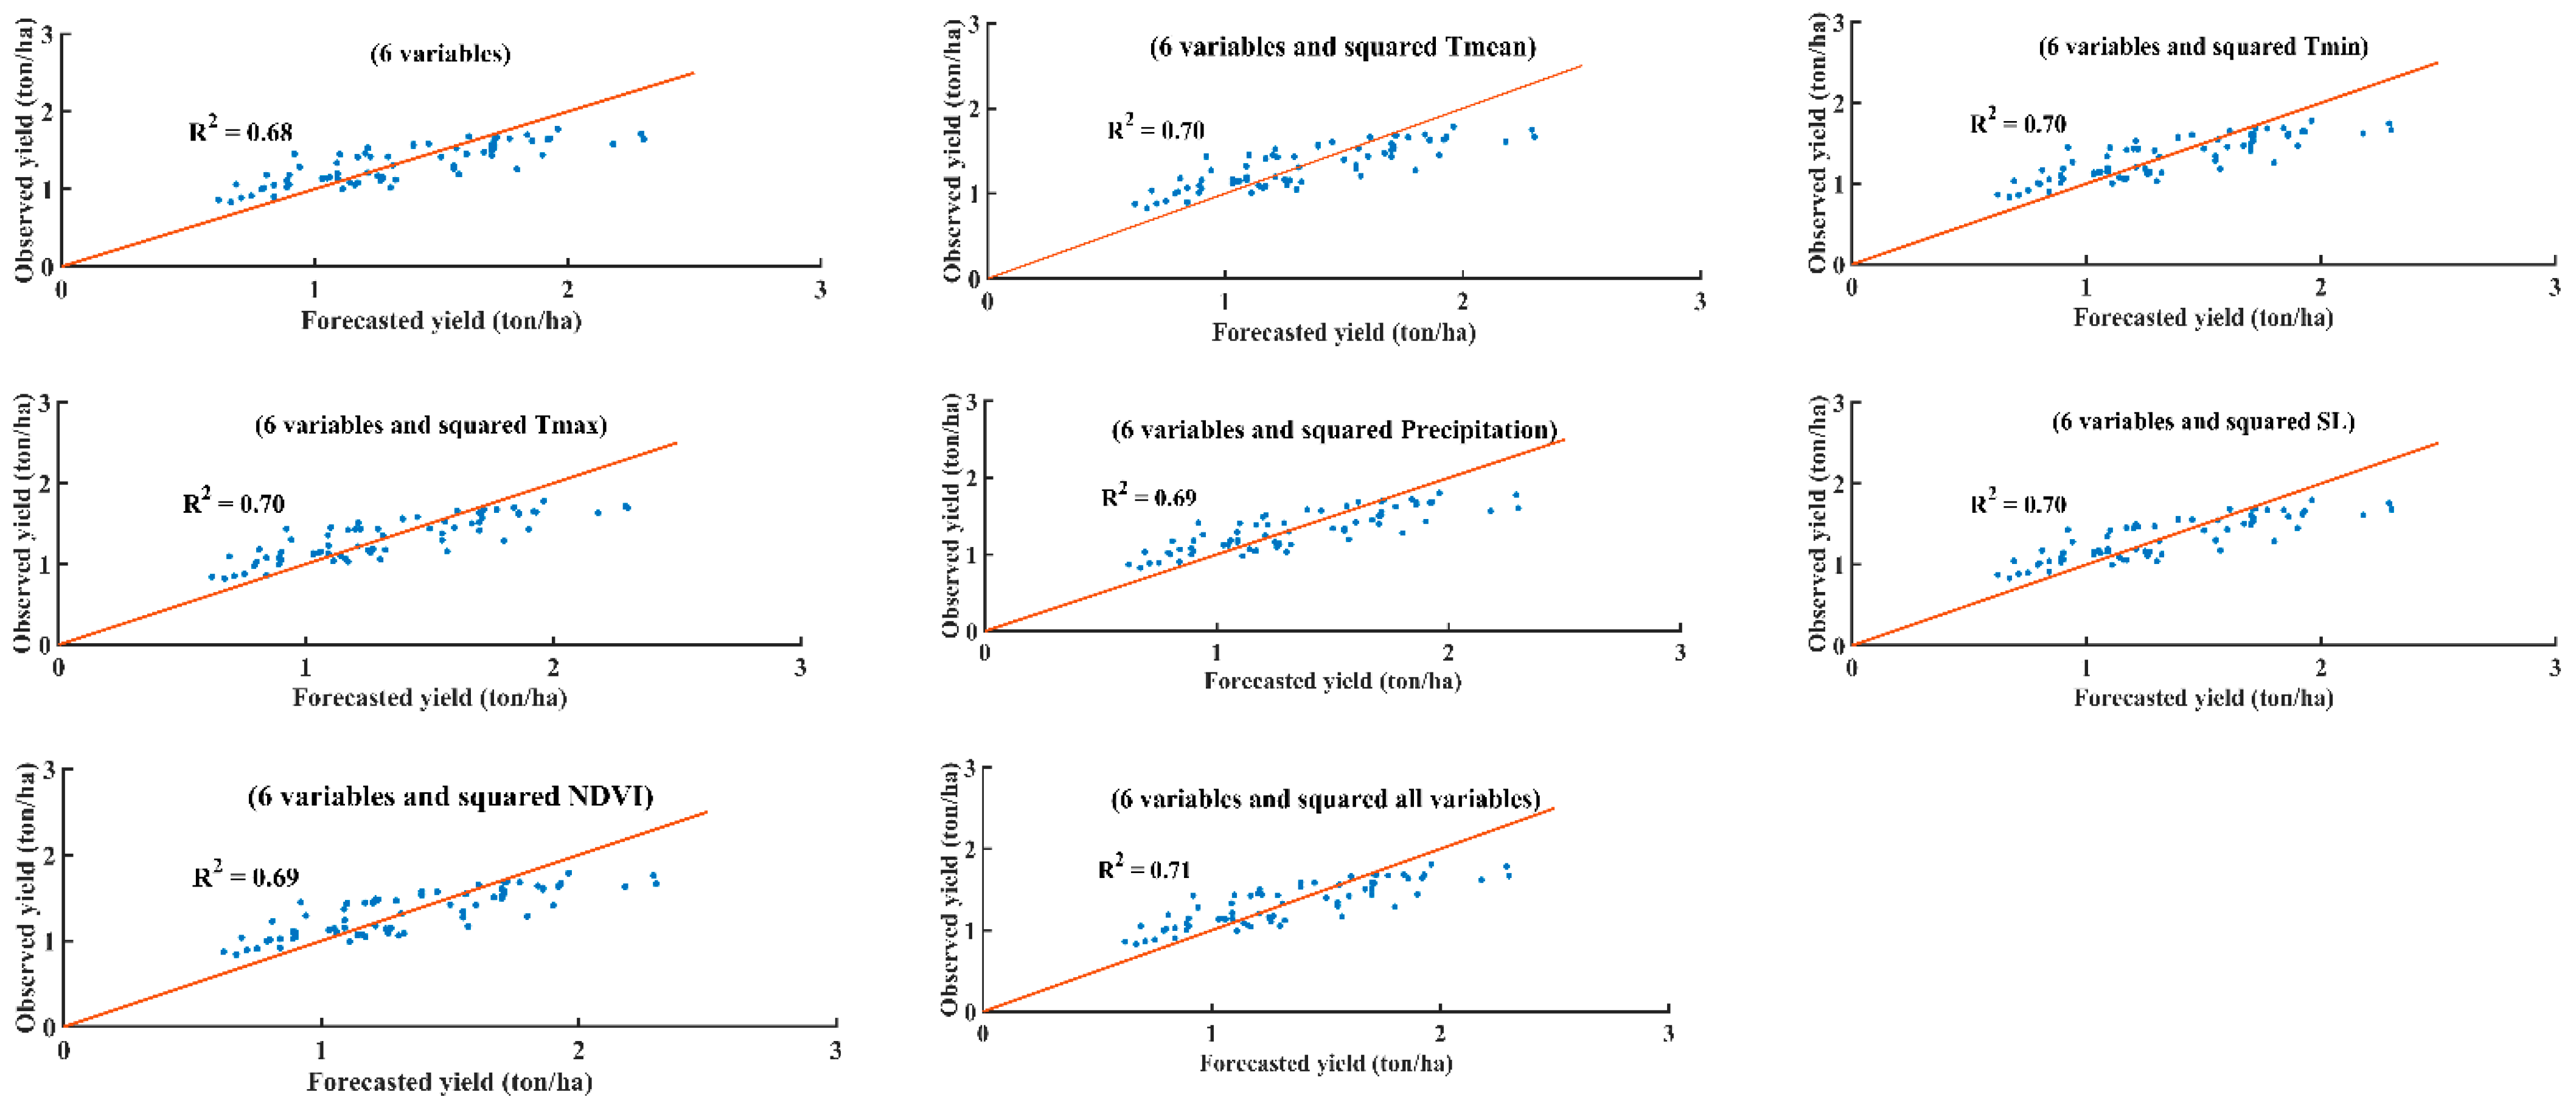
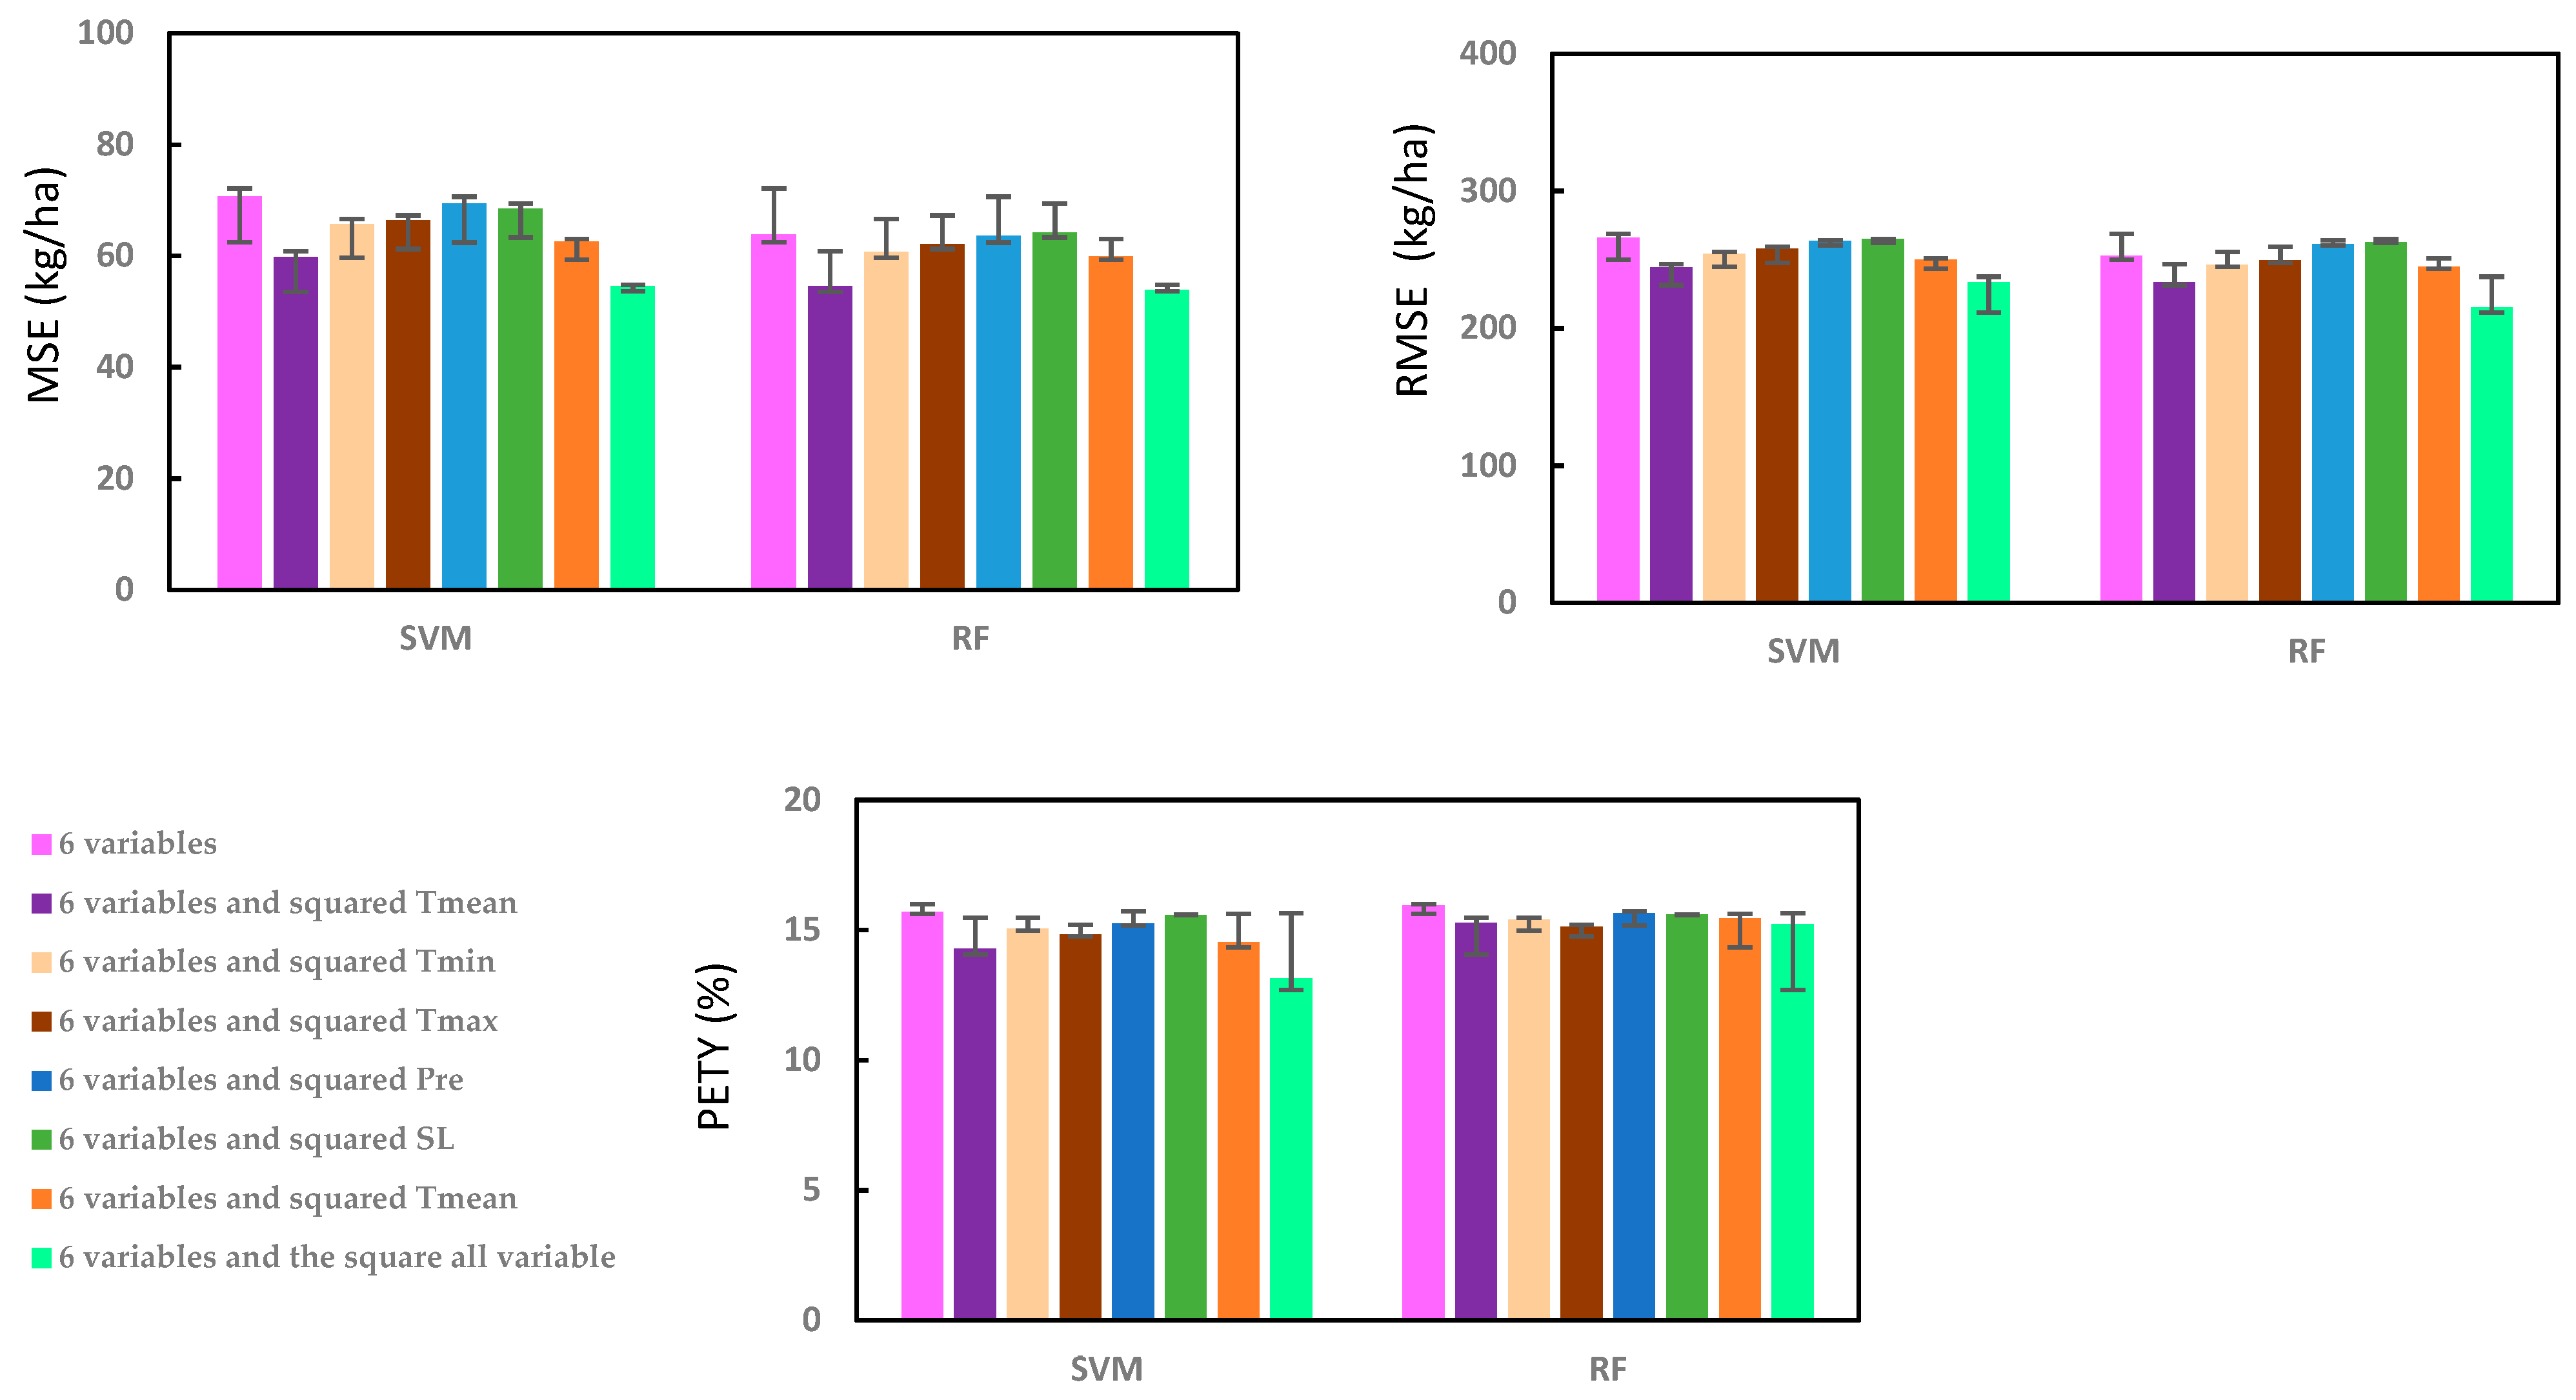
3.3. The Prediction of Tea Yield in Growing Season by SVM and RF

Based on the trained samples of SVM, RF, the tea yield in growing season was predicted. The scatter diagram of observed and predicted yield of each models in growing periods are shown in Figure 7 and Figure 8 in which abscissa is the forecasted yield and ordinate is the observed yield. Figure 7 shows the correlation coefficient ( R 2 ) between observed and predicted tea yield is 0.61 in SVM model. We calculated the increased accuracy after add one variable in prediction model. Follow Figure 7, the highest accuracy when squared all variables ( R 2 = 0.7), in the order is the square all variable > 6 variable input and squared Tmean > 6 variable input and squared NDVI > 6 variable input and squared Tmin or Precipitation > 6 variable input and squared Tmax > 6 variable input or 6 variable input and squared SL.
The scatter diagrams of observed and predicted yields of RF model are shown in Figure 8 with R 2 > 0.67. To improve accuracy of model, we take the square each of independent variable in turn in input data to find the best performances in yield prediction. Observed in Figure 8, the predict model by RF will be higher when any variable was squared. The correlation coefficient ( R 2 ) between observed and predicted tea yield are shown in the order of 6 variable input < 6 variable input and squared Precipitation or NDVI < 6 variable input and squared Tmean or Tmin or Tmax < the square all variable. In tea yield prediction, RF model accuracy was assess higher than SVM model.
We plotted the MSE, RMSE and PETY in growing period with 6 variables input and squared one of the variable (Figure 9) to examined impacts of different variable on yield prediction with the same algorithms or evaluation indicators. MSE, RMSE and PETY were displayed highest accuracy by squared all variables with the errors smallest. In addition, MSE, RMSE and PETY are smaller errors than other variables while squared Tmean. The variable importance in yield prediction is ordered as: Tmean > NDVI > Tmin > Tmax > Pre and SL.
We investigated the prediction errors according to machine learning variation by 6 variables input and squared one of another variable. The result displayed that the prediction errors is around 13.1–15.9%. The mean accuracy increased by which SVM or RF model’s prediction would be increase if one variable is included. The highest accuracy in SVM with 6 variables and squared all the variables (13.1%); RF shows the best perform with 6 variables and squared Tmax (15.1%).

4. Discussion

With extreme weather conditions in Tan uyen, low winter temperatures and insufficient water for irrigation in the dry season, tea plant exist as the optimal choice for economic development in Tanuyen district. According to tea statistics of countries around the world, tea grows optimally at a temperature of 18–25 °C and can grow without serious risks up to 35 °C [47]. Air temperatures is below 13 °C and over 30 °C may reduce shoot growth [48]. In Tanuyen, the Tmean is around 22–26 °C which consider as suitable threshold for growth of tea. The Tmin is below 18 °C in January and December when NDVI of tea achieved the smallest value. The rainy season from May to September is also a time of relatively high temperatures. This is the best time to grow and develop for tea.
The responses of vegetation on climate factor in the spatio-temporal indicate a difference in their behaviors by climate variability. At the local scale, this responses of tea on climatic change mainly occurs in the temporal scales with a current month and a typical lag time of one month. In our study, a lag time between NDVI and climate factors as Tmean, Tmax, precipitation and SL were possible during the period growing season. With Tmin, the R value of lag time is less than in the growing season of almost current months.
The relationship between tea NDVI and climatic factor and the variation of its may not represent for all vegetation in Tanuyen. On the other hand, tea NDVI may affect from human activities which may create some uncertainties of NDVI values in certain time. The changing tea planting areas such as expanding acreage, demolishing old trees or replacing building ground may cause heterogeneous distribution in tea NDVI. In small local scale, we don’t investigate the change of NDVI and the relationship with climatic factor in pixel.
The Pearson correlation coefficient which was based on the covariance method, is known as a good method for measuring variables association. However, the correlation coefficients obtained within growing season by Pearson analysis method which doesn’t reflect the impact on vegetation by water and heat condition [42]. So this analysis should be used with caution and combine with other analysis method in the future. In the inter growing season, Pearson correlation coefficient was considered more realistic in the response of NDVI to climate change when it may reduce the correlation synchronization of many climatic factor.
The conjunction of climatic variable with machine learning approaches were used to predict crop yield. The yield would be change from season to season and from location to location [49]. Han et al. [29] pointed out that the crop yield varied by different region and this spatial scales is large. In our study, the acreage plant of tea distributes in local scope and the change of climate, soil and management conditions is small so the prediction performance of regional differences doesn’t consider. The accuracy prediction will improve with the increase of inputting one variable. We recognized the role importance is higher of Tmin than of Tmax which was verify in previous studies [28,50]. Othieno et al. [51] showed that low air temperature and water deficits in the dry season limited the overall yield due to relation of shoot extension rates. The growth of tea bush is sensitive to climatic factors, the tea yield would decrease in warmer temperatures and negative effect if temperature above 26.6 °C [52]. In our study, we confirmed that the impact of Tmean and Tmin on tea yield are stronger than other variables when squared each input variable.
In statistical model, there are certain limitation in explaining the result of the black box models. The data set is need enough large to achieve acceptable predictions in learning models. The number of samples in this research is enlarged, which could be a result of model [25]. On the other hand, the source data such as remote sensing resolution, meteorological data, human activities can decrease the ability prediction of machine learning. We hope that the uncertainties of model will be improve as the data was collect full and increase the input variables.

5. Conclusions

NDVI variation of tea in the growing season and inter growing season were analyzed from 2009 to 2018 in Tanuyen, Laichau, Vietnam. However, the spatial variation of tea NDVI is relatively small. We compared the correlation coefficient between NDVI and climate variable in current month, finding that correlation between NDVI and Tmean, between NDVI and Tmin were much stronger than between NDVI and other climate variables. The response of the NDVI to climate variable in lag time show that almost variables response one-month lag time with NDVI in except Tmin.
RF model may estimate tea yield accurately in growing season that can be used for estimating tea yield before the harvesting dates in Tanuyen in the future. In addition, Tmean is detected as the most important predictor used in our study for predicting tea yield. NDVI time series and climatic data are a good method to study NDVI trend and forecast yield to the other crops in the world.

Author Contributions

Conceptualization, P.P. and L.X.; Methodology, P.P., L.X. and N.C.; Software, P.P. and L.X.; Validation, P.P, L.X. and D.M.D.; Formal analysis, P.P.; Investigation, P.P. and D.M.D.; Resources, P.P. and D.D.; Data curation, P.P. and D.D.; Writing—original draft preparation, P.P.; Writing—review and editing, N.C. and L.X.; Visualization, P.P.; Supervision, N.C.; Project administration, N.C. All authors have read and agreed to the published version of the manuscript.

Funding

Funding for this project was provided by the National Key R&D Program (2018YFB2100500), the National Natural Science Foundation of China Program (41890822), Creative Research Group of Natural Science Foundation of Hubei Province of China (2016CFA003), the Fundamental Research Funds of the Central Universities (2042017GF0057), and the National Nature Science Foundation of China Program (41771422, 41971351, 41601406, and 41801339).

Institutional Review Board Statement

Not applicate.

Informed Consent Statement

Not applicate.

Data Availability Statement

Data is contained within the article.

Acknowledgments

The authors would like to thank the hydro-meteorological station of Laichau Province and Department of Natural Resources and Environment, Tanuyen District, Laichau Province, Vietnam, which provided the data for this study.

Conflicts of Interest

The authors declare no conflict of interest.

References

  1. Rouse, J.W.; Haas, R.; Schell, J. Monitoring Vegetation Systems in the Great Plains with ERTS. NASA Spec. Publ. 1974, 351, 309. [Google Scholar]
  2. Yin, Z.; Lee, T.H.L. Obtaining Spatial and Temporal Vegetation Data from Landsat MSS and AVHRR/NOAA Satellite Images for a Hydrologic Model. Photogramm. Eng. Remote Sens. 1997, 63, 69–77. [Google Scholar]
  3. Higginbottom, T.; Symeonakis, E. Assessing Land Degradation and Desertification Using Vegetation Index Data: Current Frameworks and Future Directions. Remote Sens. 2014, 6, 9552–9575. [Google Scholar] [CrossRef] [Green Version]
  4. Ning, T.; Liu, W.; Lin, W.; Song, X. NDVI Variation and Its Responses to Climate Change on the Northern Loess Plateau of China from 1998 to 2012. Adv. Meteorol. 2015, 2015. [Google Scholar] [CrossRef] [Green Version]
  5. Li, J.; Pei, Y.; Zhao, S.; Xiao, R.; Sang, X.; Zhang, C. A Review of Remote Sensing for Environmental Monitoring in China. Remote Sens. 2020, 12, 1130. [Google Scholar] [CrossRef] [Green Version]
  6. Fauziana, F.; Danoedoro, P.; Murti, S.H. Linear Spectral Mixture Analysis of SPOT-7 for Tea Yield Estimation in Pagilaran Estate, Batang Central Java. In Proceedings of the IOP Conference Series Earth and Environmental Science, Yogyakarta, Indonesia, 7–19 October 2016. [Google Scholar] [CrossRef]
  7. Xu, W.; Sun, R.; Jin, Z. Extracting Tea Plantations Based on ZY-3 Satellite Data. Trans. Chin. Soc. Agric. Eng. 2016, 32, 161–168. [Google Scholar]
  8. Pan, S.; Zhao, X.; Yue, Y. Spatiotemporal Changes of NDVI and Correlation with Meteorological Factors in Northern China from 1985–2015. E3S Web Conf. 2019. [Google Scholar] [CrossRef]
  9. He, Y.; Guo, X.; Dixon, P.; Wilmshurst, J.F. NDVI Variation and Its Relations to Climate in Canadian Ecozones. Can. Geogr. 2012, 56, 492–507. [Google Scholar] [CrossRef]
  10. Fabricante, I.; Oesterheld, M.; Paruelo, J.M. Annual and Seasonal Variation of NDVI Explained by Current and Previous Precipitation across Northern Patagonia. J. Arid Environ. 2009, 73, 745–754. [Google Scholar] [CrossRef]
  11. Wang, M.; Fu, J.; Wu, Z.; Pang, Z. Spatiotemporal Variation of NDVI in the Vegetation Growing Season in the Source Region of the Yellow River, China. ISPRS Int. J. Geo Inf. 2020, 9, 282. [Google Scholar] [CrossRef] [Green Version]
  12. Guo, J.; Hu, Y.; Xiong, Z.; Yan, X.; Ren, B.; Bu, R. Spatiotemporal Variations of Growing-Season NDVI Associated with Climate Change in Northeastern China’s Permafrost Zone. Polish J. Environ. Stud. 2017, 26, 1521–1529. [Google Scholar] [CrossRef]
  13. Allen, C.D.; Macalady, A.K.; Chenchouni, H.; Bachelet, D.; McDowell, N.; Vennetier, M.; Kitzberger, T.; Rigling, A.; Breshears, D.D.; Hogg, E.; et al. A Global Overview of Drought and Heat-Induced Tree Mortality Reveals Emerging Climate Change Risks for Forests. For. Ecol. Manag. 2010, 259, 660–684. [Google Scholar] [CrossRef] [Green Version]
  14. Allen, C.D.; Breshears, D.D.; McDowell, N.G. On Underestimation of Global Vulnerability to Tree Mortality and Forest Die-off from Hotter Drought in the Anthropocene. Ecosphere 2015, 6, art129. [Google Scholar] [CrossRef]
  15. Xu, K.; Wang, X.; Jiang, C.; Sun, O.J. Assessing the Vulnerability of Ecosystems to Climate Change Based on Climate Exposure, Vegetation Stability and Productivity. For. Ecosyst. 2020, 7. [Google Scholar] [CrossRef] [Green Version]
  16. Guan, Q.; Yang, L.; Guan, W.; Wang, F.; Liu, Z.; Xu, C. Assessing Vegetation Response to Climatic Variations and Human Activities: Spatiotemporal NDVI Variations in the Hexi Corridor and Surrounding Areas from 2000 to 2010. Theor. Appl. Climatol. 2019, 135, 1179–1193. [Google Scholar] [CrossRef]
  17. Zhao, X.; Gao, Q.; Yue, Y.; Duan, L.; Pan, S. A System Analysis on Steppe Sustainability and Its Driving Forces-A Case Study in China. Sustainability 2018, 10, 233. [Google Scholar] [CrossRef] [Green Version]
  18. Joshi, N.; Gyawali, P.; Sapkota, S.; Neupane, D.; Shrestha, S.; Shrestha, N.; Tuladhar, F.M. ANALYZING the EFFECT of CLIMATE CHANGE (RAINFALL and TEMPERATURE) on VEGETATION COVER of Nepal USING TIME SERIES MODIS IMAGES. ISPRS Ann. Photogramm. Remote Sens. Spat. Inf. Sci. 2019, 4, 209–216. [Google Scholar] [CrossRef] [Green Version]
  19. Zhan, Z.-Z.; Liu, H.-B.; Li, H.-M.; Wu, W.; Zhong, B. The Relationship NDVI and Terrain Factors. Procedia Environ. Sci. 2011, 12, 765–771. [Google Scholar] [CrossRef] [Green Version]
  20. Huang, X.; Zhang, T.; Yi, G.; He, D.; Zhou, X.; Li, J.; Bie, X.; Miao, J. Dynamic Changes of Ndvi in the Growing Season of the Tibetan Plateau during the Past 17 Years and Its Response to Climate Change. Int. J. Environ. Res. Public Health 2019, 16, 3452. [Google Scholar] [CrossRef] [PubMed] [Green Version]
  21. Ichii, K.; Kawabata, A.; Yamaguchi, Y. Global Correlation Analysis for NDVI and Climatic Variables and NDVI Trends: 1982–1990. Int. J. Remote Sens. 2002, 23, 3873–3878. [Google Scholar] [CrossRef]
  22. Sarkar, S.; Kafatos, M. Interannual Variability of Vegetation over the Indian Sub-Continent and Its Relation to the Different Meteorological Parameters. Remote Sens. Environ. 2004, 90, 268–280. [Google Scholar] [CrossRef]
  23. Richard, Y.; Poccard, I. A Statistical Study of NDVI Sensitivity to Seasonal and Interannual Rainfall Variations in Southern Africa. Int. J. Remote Sens. 2010, 19, 2907–2920. [Google Scholar] [CrossRef]
  24. Hydrometeorological Station in Lai Chau Province. Available online: http://kttvtaybac.org/index.php/vi/gioi-thieu/Don-vi-truc-thuoc/Dai-KTTV-tinh-Lai-Chau-10/ (accessed on 20 July 2020).
  25. Zhang, Z.; Jin, Y.; Chen, B.; Brown, P. California Almond Yield Prediction at the Orchard Level with a Machine Learning Approach. Front. Plant Sci. 2019, 10. [Google Scholar] [CrossRef] [PubMed] [Green Version]
  26. Raj, E.E.; Ramesh, K.V.; Rajkumar, R.; Moral, M. Modelling The Impact Of Agrometeorological Variables On Regional Tea Yield Variability In South Indian Tea-Growing Regions: 1981–2015. Cogent Food Agric. 2019, 5, 5. [Google Scholar] [CrossRef]
  27. Crane-Droesch, A. Machine Learning Methods for Crop Yield Prediction and Climate Change Impact Assessment in Agriculture. Environ. Res. Lett. 2018, 13, 114003. [Google Scholar] [CrossRef] [Green Version]
  28. Li, A.; Liang, S.; Wang, A.; Qin, J. Estimating Crop Yield from Multi-Temporal Satellite Data Using Multivariate Regression and Neural Network Techniques. Photogramm. Eng. Remote Sens. 2007, 73, 1149–1157. [Google Scholar] [CrossRef] [Green Version]
  29. Han, J.; Zhang, Z.; Cao, J.; Luo, Y.; Zhang, L.; Li, Z.; Zhang, J. Prediction of Winter Wheat Yield Based on Multi-Source Data and Machine Learning in China. Remote Sens. 2020, 12, 236. [Google Scholar] [CrossRef] [Green Version]
  30. Huang, J.; Wang, H.; Dai, Q.; Han, D. Analysis of NDVI Data for Crop Identification and Yield Estimation. IEEE J. Sel. Top. Appl. Earth Obs. Remote Sens. 2014, 7, 4374–4384. [Google Scholar] [CrossRef]
  31. Ramos, A.P.M.; Osco, L.P.; Furuya, D.E.G.; Gonçalves, W.N.; Santana, D.C.; Teodoro, L.P.R.; Junior, C.A.D.S.; Capristo-Silva, G.F.; Li, J.; Baio, F.H.R.; et al. A Random Forest Ranking Approach to Predict Yield in Maize with Uav-Based Vegetation Spectral Indices. Comput. Electron. Agric. 2020, 178, 105791. [Google Scholar] [CrossRef]
  32. Rama Rao, N.; Kapoor, M.; Sharma, N.; Venkateswarlu, K. Yield Prediction and Waterlogging Assessment for Tea Plantation Land Using Satellite Image-based Techniques. Int. J. Remote Sens. 2007, 28, 1561–1576. [Google Scholar] [CrossRef]
  33. Mukherjee, S.; Kumara, A.; Aruna, D.; Kumara, P. Remote Sensing Applications to Infer Yield of Tea in a Part of Sri Lanka November 2013. In Crop Improvement under Adverse Conditions; Springer: New York, NY, USA, 2013. [Google Scholar]
  34. Nitin, K.; Tripathi, S.S.; RajapakseSpace, K.H. Tea Yield Modeling Based on Satellite Derived LAI. Geocarto Int. 2004, 19, 51–54. [Google Scholar]
  35. Piao, S.; Mohammat, A.; Fang, J.; Cai, Q.; Feng, J. NDVI-Based Increase in Growth of Temperate Grasslands and Its Responses to Climate Changes in China. Glob. Environ. Chang. 2006, 16, 340–348. [Google Scholar] [CrossRef]
  36. Chen, H.L. Variations of Vegetation Cover and Its Impact on Climate and Water Source in Huanghe-Huaihe-Haihe Zone; Nanjing University of Information Science & Technology: Nanjing, China, 2007. [Google Scholar]
  37. Hou, W.; Gao, J.; Wu, S.; Dai, E. Interannual Variations in Growing-Season NDVI and Its Correlation with Climate Variables in the Southwestern Karst Region of China. Remote Sens. 2015, 7, 11105–11124. [Google Scholar] [CrossRef] [Green Version]
  38. Phan, P.; Chen, N.; Xu, L.; Chen, Z. Using Multi-Temporal MODIS NDVI Data to Monitor Tea Status and Forecast Yield: A Case Study at Tanuyen, Laichau, Vietnam. Remote Sens. 2020, 12, 1814. [Google Scholar] [CrossRef]
  39. Braswell, B.H.; Schimel, D.S.; Linder, E.; III, B.M. The Response of Global Terrestrial Ecosystems to Interannual Temperature Variability. Science 1997, 278, 870–872. [Google Scholar] [CrossRef]
  40. Los, S.O.; Collatz, G.J.; Bounoua, L.; Sellers, P.J.; Tucker, C.J. Global Interannual Variations in Sea Surface Temperature and Land Surface Vegetation, Air Temperature, and Precipitation. J. Clim. 2001, 14, 1535–1549. [Google Scholar] [CrossRef]
  41. Jobbágy, E.G.; Sala, O.E.; Paruelo, J.M. Patterns and Controls of Primary Production in the Patagonian Steppe: A Remote Sensing Approach. Ecology 2002, 83, 307–319. [Google Scholar]
  42. Pei, Z.; Fang, S.; Yang, W.; Wang, L.; Wu, M.; Zhang, Q.; Han, W.; Khoi, D.N. The Relationship between NDVI and Climate Factors at Different Monthly Time Scales: A Case Study of Grasslands in Inner Mongolia, China (1982–2015). Sustainability 2019, 11, 7243. [Google Scholar] [CrossRef] [Green Version]
  43. Chen, J.; Yan, F.; Lu, Q. Spatiotemporal Variation of Vegetation on the Qinghai–Tibet Plateau and the Influence of Climatic Factors and Human Activities on Vegetation Trend (2000–2019). Remote Sens. 2020, 12, 3150. [Google Scholar] [CrossRef]
  44. Hu, M.Q.; Mao, F.; Sun, H.; Hou, Y.Y. Study of Normalized Difference Vegetation Index Variation and Its Correlation with Climate Factors in the Three-River-Source Region. Int. J. Appl. Earth Obs. Geoinf. 2011, 13, 24–33. [Google Scholar] [CrossRef]
  45. Gunn, S.R. Support Vector Machines for Classification and Regression. Tech. Report Sch. Electron. Comput. Sci. 1998, 14, 5–16. [Google Scholar]
  46. Cai, Y.; Guan, K.; Lobell, D.; Potgieter, A.B.; Wang, S.; Peng, J.; Xu, T.; Asseng, S.; Zhang, Y.; You, L. Integrating Satellite and Climate Data to Predict Wheat Yield in Australia Using Machine Learning Approaches. Agric. For. Meteorol. 2019, 274, 144–159. [Google Scholar] [CrossRef]
  47. Shoubo, H. Meteorology of the Tea Plant in China: A Review. Agric. For. Meteorol. 2003, 47, 19–30. [Google Scholar] [CrossRef]
  48. Carr, M.K.V. The Climatic Requirements of the Tea Plant: A Review. Exp. Agric. 1972, 8, 1–14. [Google Scholar] [CrossRef]
  49. Filippi, P.; Jones, E.J.; Wimalathunge, N.S.; Somarathna, P.D.S.N.; Pozza, L.; Ugbaje, S.U.; Jephcott, T.G.; Paterson, S.E.; Whelan, B.M.; Bishop, T. An Approach to Forecast Grain Crop Yield Using Multi-Layered, Multi-Farm Data Sets and Machine Learning. Precis. Agric. 2019, 20, 1015–1029. [Google Scholar] [CrossRef]
  50. Tao, F.; Xiao, D.; Zhang, S.; Zhang, Z.; Rötter, R.P. Wheat Yield Benefited from Increases in Minimum Temperature in the Huang-Huai-Hai Plain of China in the Past Three Decades. Agric. For. Meteorol. 2017, 239, 1–14. [Google Scholar] [CrossRef] [Green Version]
  51. Othieno, C.O.; Stephens, W.; Carr, M.K.V. Yield Variability at the Tea Research Foundation of Kenya. Agric. For. Meteorol. 1992, 61, 237–252. [Google Scholar] [CrossRef]
  52. Duncan, J.M.A.; Saikia, S.D.; Gupta, N.; Biggs, E.M. Observing Climate Impacts on Tea Yield in Assam, India. Appl. Geogr. 2016, 77, 64–71. [Google Scholar] [CrossRef]
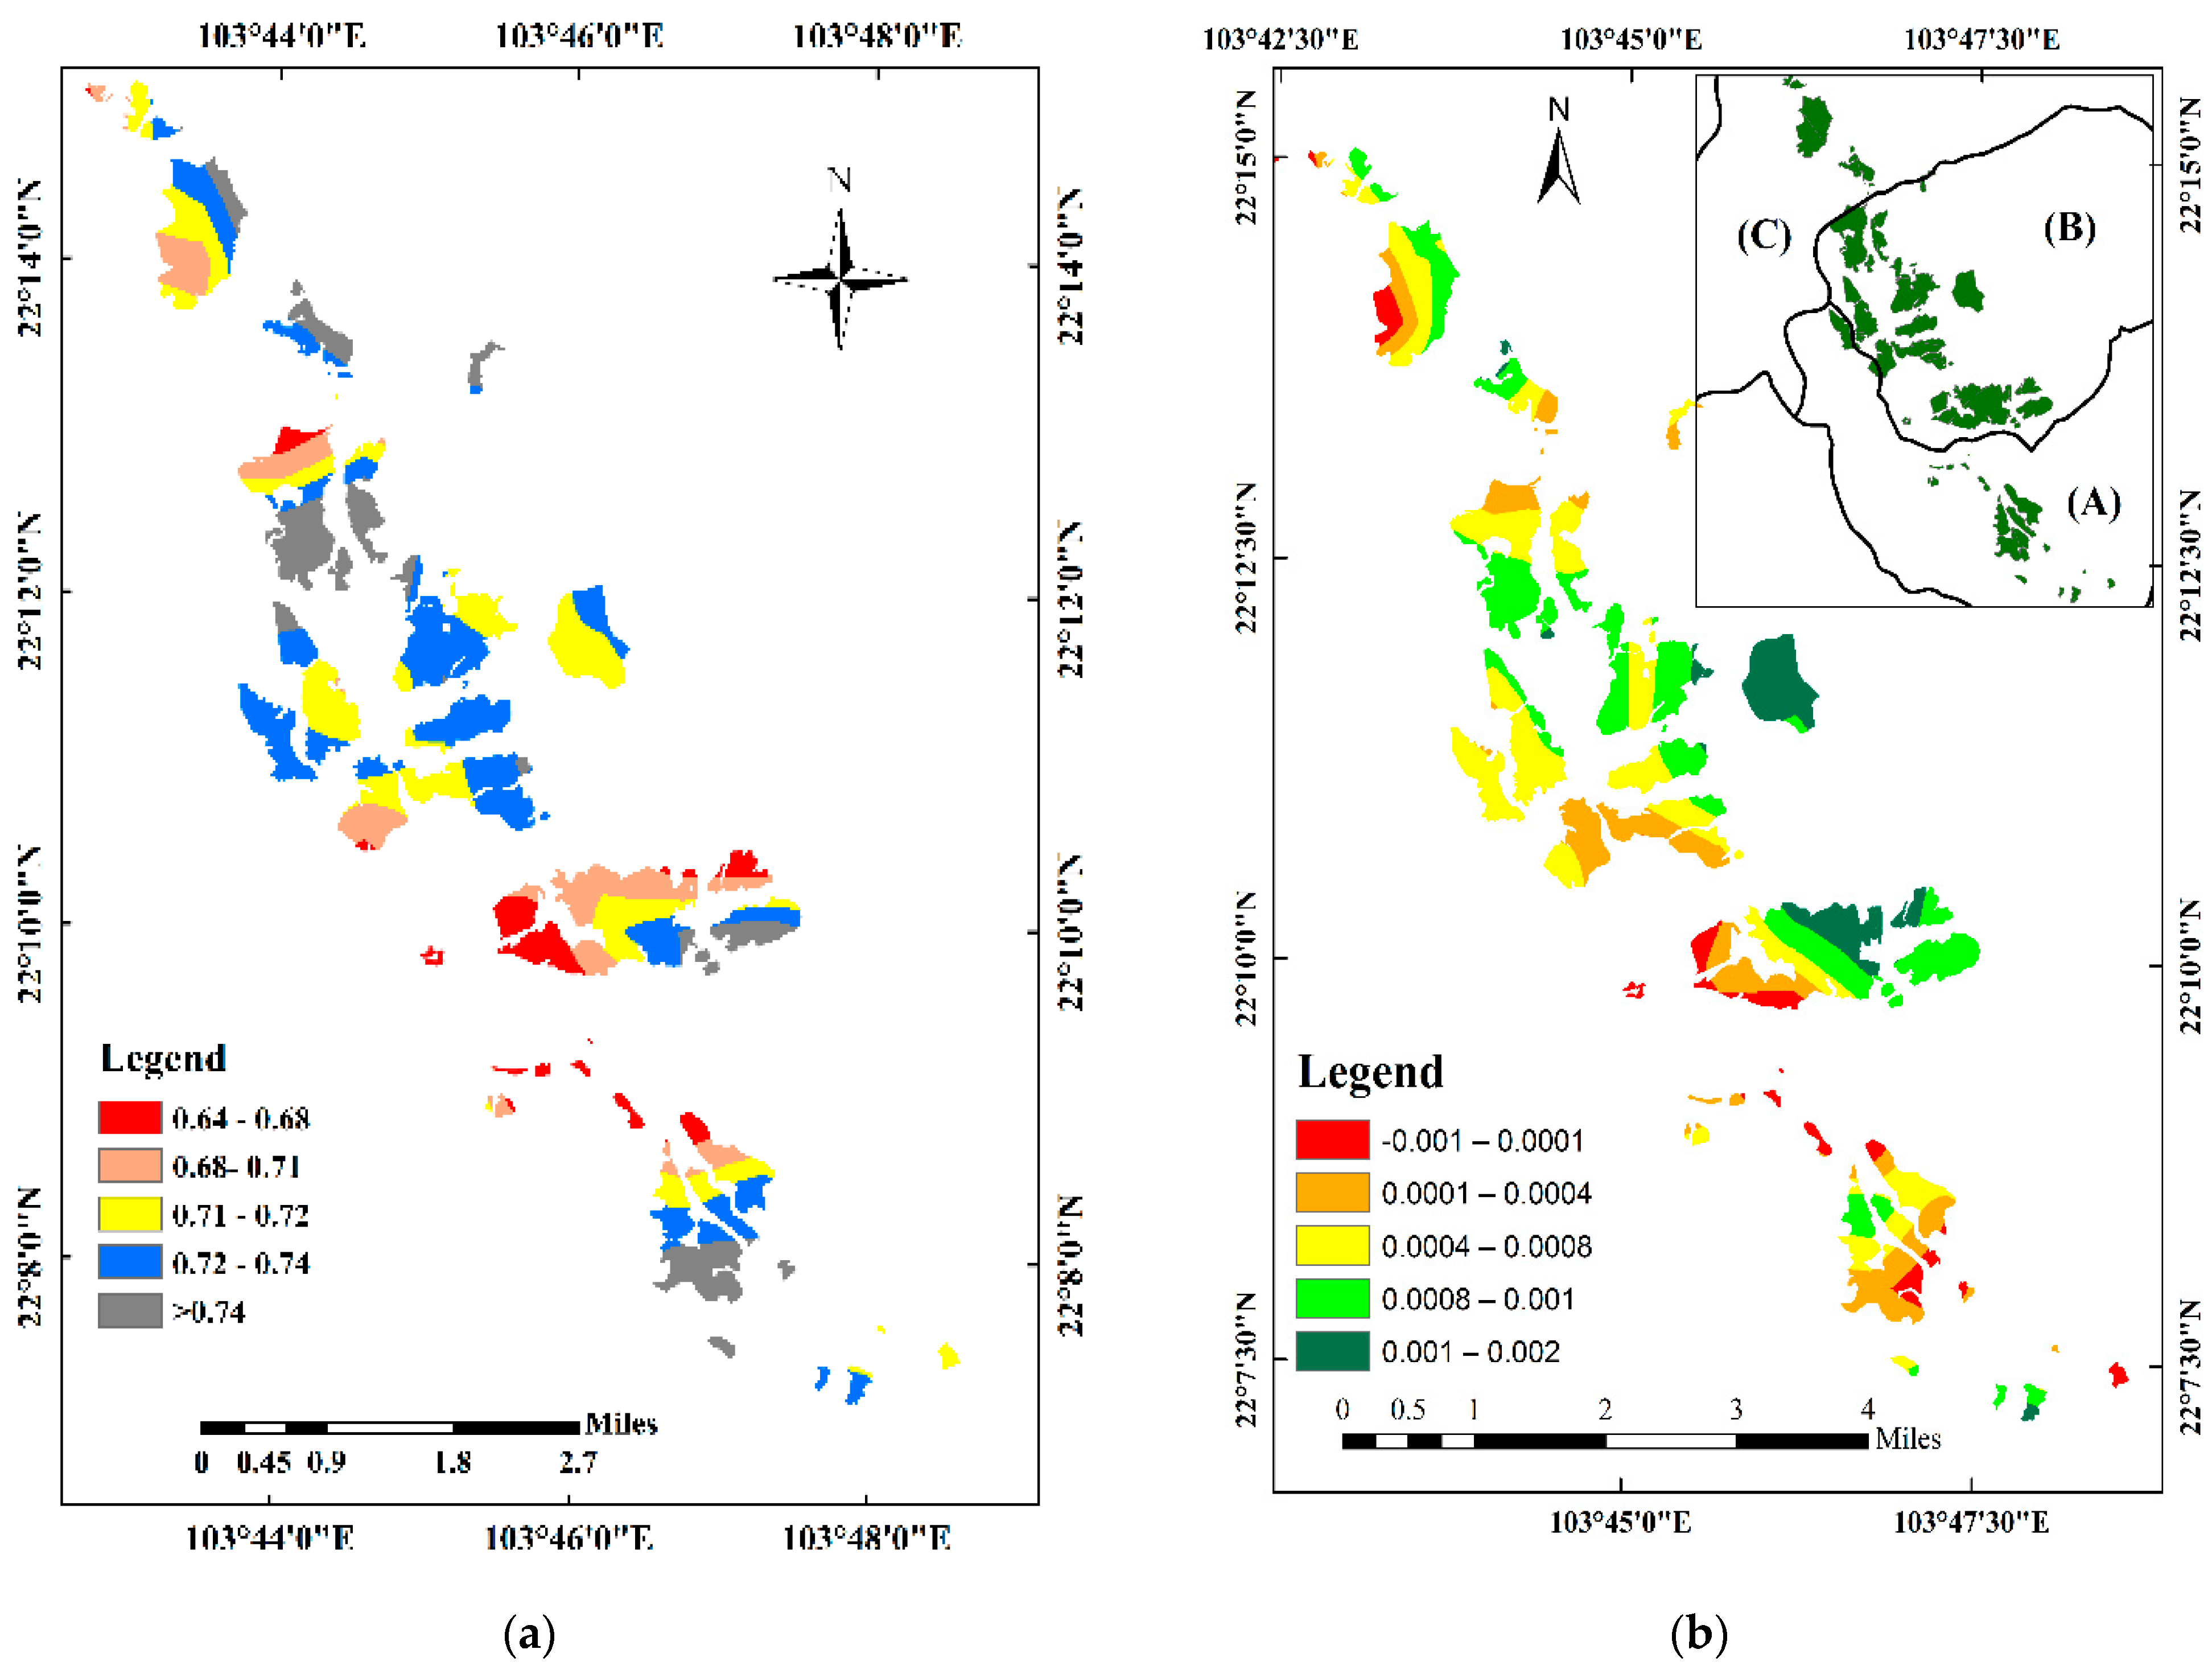
Figure 1. Location of Tanuyen District in Laichau, Vietnam.
Atmosphere 12 00962 g001
Figure 2. Spatial distribution of NDVI mean value (a); and NDVI trend (b) with (A) represent Trung Dong and Than Thuoc sub-area (TDTTSA), (B) represent the central sub-area (CSA), (C) represent Phuc Khoa sub-area (PKSA).
Atmosphere 12 00962 g002
Figure 3. (a) Annual variations in growing-season NDVI (Normalized Difference Vegetation Index), (b) shows the Mann-Kendall results for trend analysis (α = 0.05, Z1 = −1.96, Z2 = 1.96).
Atmosphere 12 00962 g003
Figure 4. The mean of tea NDVI in growing season (a) and in the inter growing season (b).
Atmosphere 12 00962 g004
Figure 5. The change in R between NDVI and climatic variable in within-growing season (a) and in the inter-growing season (b) period 2009–2018.
Atmosphere 12 00962 g005
Figure 6. The lag month between tea NDVI and climatic factors within growing season from 2009 to 2018.
Atmosphere 12 00962 g006
Figure 7. Predict yield of tea by SVM model with 6 variable input or 6 variables and squared one of the variable in order to: Tmean, Tmin, Tmax, Precipitation, Solar radiation, NDVI and all variables.
Atmosphere 12 00962 g007
Figure 8. Predict yield of tea by RF model with 6 variable input or 6 variable input and squared one of the variable in order to: Tmean, Tmin, Tmax, Precipitation, Solar radiation, NDVI and all variables.
Atmosphere 12 00962 g008
Figure 9. The mean square error, root mean square error and percentage error of the perform for tea yield prediction in growing season by including one variable input.
Atmosphere 12 00962 g009
Table 1. The trend of NDVI from 2009 to 2018.
Dynamic Trend θ s l o p e Area (%)
Fast decrease−0.001–0.00016.27
Slow decrease0.0001–0.000420.6
Basically unchanged0.0004–0.000832.6
Slow increase0.0008–0.00129.5
Fast increase0.001–0.00211.3
Table 2. The relationship between NDVI and climactic factor in current month and previous month.
Climatic FactorThe Value of R between NDVI and Climatic Factor
Current MonthPrevious Month
Tmean0.680.73
Tmin0.720.65
Tmax0.010.4
Precipitation0.620.67
Solar radiation0.40.12
Table 3. The value R between tea NDVI and climatic factor in inter growing season from 2009 to 2018.
MonthAprilMayJuneJulyAugustSeptemberOctober
Tmean0.050.270.380.030.350.430.31
Tmin0.050.380.0020.250.340.470.43
Tmax0.090.120.30.380.150.230.28
Precipitation0.10.0120.50.020.130.110.43
Solar0.120.170.080.570.070.080.5
Publisher’s Note: MDPI stays neutral with regard to jurisdictional claims in published maps and institutional affiliations.

