Article

Co-Occurrence of Marine Extremes Induced by Tropical Storms and an Ocean Eddy in Summer 2016: Anomalous Hydrographic Conditions in the Pacific Shelf Waters off Southeast Hokkaido, Japan

1
Fisheries Resources Institute (Kushiro), Japan Fisheries Research and Education Agency, Kushiro 0850802, Japan
2
Fisheries Resources Institute (Yokohama), Japan Fisheries Research and Education Agency, Yokohama 0368648, Japan
*
Author to whom correspondence should be addressed.
Atmosphere 2021, 12(7), 888; https://doi.org/10.3390/atmos12070888
Submission received: 21 June 2021 / Revised: 5 July 2021 / Accepted: 5 July 2021 / Published: 8 July 2021
(This article belongs to the Special Issue Water Environment of Coastal Areas under Current and Future Climate)

Abstract

:
This study proposes an analysis methodology to address how very rare marine extremes can be understood using limited data. In summer 2016, extreme weather and marine events occurred simultaneously around the Pacific shelf off southeastern Hokkaido, Japan. Six successive tropical storms brought extreme precipitation and an anticyclonic mesoscale eddy of subtropical Kuroshio water closely approached the coast, locally causing marine heat waves. We examined how these compound extremes affected oceanographic conditions on the coastal shelf by analyzing data from ship surveys in October 2016 on the Pacific shelf and outputs from a realistic ocean model. Climatologically, warm, high-salinity (33.0–33.7) subtropical water from the Okhotsk Sea (modified Soya Warm Current water) is distributed near the sea surface on the Pacific shelf in October and transported by the along-shelf boundary current. In 2016, however, a vertically well-mixed low-salinity (<33.0) layer associated with the heavy rainfall was observed at 0–50 m depth on the shelf, salinity maxima (≥33.7) associated with Kuroshio water from the mesoscale eddy occurred at 50–150 m depth on the slope, and baroclinic jets formed along the salinity front near the shelfbreak. These observed salinity structures were reproduced by a 1/50° ocean model. Particle-tracking experiments revealed that the low-salinity water originated mainly off eastern Hokkaido, where heavy rainfall events occurred in August, and was modified by mixing with Soya Warm Current water before transport to the Pacific shelf.

1. Introduction

An extreme event is generally defined by the occurrence of a weather or climate variable with a value above (below) a threshold value near the upper (lower) end of the range of observed values of the variable [1]. Many extreme weather and climate events result from natural climate variability, but some extreme events have changed as a result of anthropogenic climate change and ongoing global warming (e.g., [2,3,4]). Examples include but are not limited to heat waves, cold waves, floods, extreme precipitation, drought, tornadoes, and tropical storms (e.g., [5]). The present study focuses on compound extreme weather and marine events that occurred in summer 2016 around the Pacific shelf off Hokkaido, Japan. An abnormally high number of six successive tropical storms brought once-a-century extreme precipitation to the region at the same time that an anticyclonic mesoscale ocean eddy closely approached the Hokkaido coast, causing strong marine heat waves with a spatial scale of O (102 km), which are generally considered extreme ocean events. Notably, these eddy-induced extremes occurred when both the tropical storms and the mesoscale ocean eddy were moving along unusual trajectories, but the intensities of the storms and eddy were not extreme. The goals of this study were to (1) examine how coastal shelf waters responded to the compound extreme events and (2) propose an analysis methodology to address how such very rare compound extremes can be understood despite limited information.
Our study area was the shelf waters off the southeastern Pacific coast of Hokkaido, inshore of the Oyashio, which is the western boundary current of the western subarctic gyre in the North Pacific Ocean (Figure 1a) [6]. The Oyashio transports cold, low-salinity subarctic Oyashio water along the continental slope throughout the year [7]. In some years, an anticyclonic mesoscale eddy, often referred to as “warm core ring”, of warm high-salinity subtropical Kuroshio water moves northward from the Kuroshio Extension and stagnates around the Kuril-Kamchatka Trench off the southeastern coast of Hokkaido, occasionally blocking the flow of the Oyashio along the slope [8,9,10]. The other pathway of subtropical waters from the Kuroshio to the Pacific shelf off southeastern Hokkaido is via the Tsushima Warm Current system in the Japan Sea (Figure 1a). The northernmost branch of the Tsushima Warm Current passes through the Soya Strait from the Japan Sea to the Okhotsk Sea and flows on the shelf along the northeastern coast of Hokkaido as the Soya Warm Current, part of which exits the Okhotsk Sea through straits among the Four Islands to the Pacific shelf, typically in summer-autumn (Figure 1b) [11,12].
In general, the water masses occupying the Pacific shelf off southeastern Hokkaido are independent of water masses distributed offshore of the shelf break (e.g., Oyashio water) and exhibit remarkable seasonal variability. During summer-autumn, the warm, high-salinity subtropical water on the Pacific shelf is referred to as modified Soya Warm Current water [13,14] because it consists of water from the Okhotsk Sea near the northeastern coast of Hokkaido which was first transported to the North Pacific by the Soya Warm Current and subsequently transported by the coastal boundary current along the Pacific shelf, the so-called Coastal Oyashio [15,16]. During summer-autumn, when flow from the Okhotsk Sea strengthens, the Coastal Oyashio can be regarded as a downstream extension of the Soya Warm Current (Figure 1b). Notably, the Soya Warm Current water is transported via straits around the Four Islands where strong tidal current-induced mixing occurs [17,18,19]. The mixing processes around the straits likely contribute importantly to the formation of the modified Soya Warm Current water that is transported onto the Pacific shelf, but they are not yet well understood.
Since 1987, the Japan Fisheries Research and Education Agency (FRA) has conducted regular ship measurements along the A-line, off southeastern Hokkaido in the North Pacific, to monitor oceanographic conditions in the Oyashio and its surrounding waters (Figure 1a) [7]. In the about 30 years of monitoring data, hydrographic conditions in October 2016 were identified as anomalous, and additional intensive surveys were performed on the Pacific shelf. These anomalous conditions were attributed to compound weather–marine extremes.
To gain an understanding of the response of the coastal shelf water to compound weather–marine extremes, we proposed to apply the following methodology. First, we analyzed shipboard-observed data together with outputs from a realistic 1/50° numerical ocean model to clarify the influences of the weather–marine extreme on hydrographic conditions in October 2016 in the shelf waters off southeast Hokkaido. Our analyses revealed that thick (~10–50 m), well-mixed, low-salinity (<33.0) water layers near the sea surface were trapped against the coast, conditions which are rarely observed in the study area. Second, we conducted a particle-tracking experiment based on outputs of the 1/50° realistic ocean model to elucidate the source water of this low-salinity water and the processes by which it was modified and transported to the observation area.
This article is organized as follows. Section 2 explains the data collection and analysis methods. Section 3 describes the results of the in situ measurements, the numerical simulation, and the particle-tracking experiment. Section 4 is a brief discussion, and Section 5 summarizes the new findings of this study.

2. Materials and Methods

2.1. Intensive Measurements on the Pacific Shelf in October 2016

We performed intensive ship surveys from 11 to 13 October 2016 in the shelf waters off the southeastern Pacific coast of Hokkaido (Figure 2a). The survey, conducted by the research vessel R/V Hokko-maru, started on the slope off the southeastern point and proceeded northward. The ship then zigzagged westward along the coast, moving first southwestward and then northwestward, across the temperature and salinity (TS) fronts on the shelf. All measurements were completed within 48 h. Along the ship track, geolocations, temperatures, and salinities near the sea surface were continuously recorded at 1 min intervals by a global positioning system receiver, thermometer, and salinometer, respectively. Horizontal current velocities were simultaneously measured by a ship-mounted 150-kHz acoustic Doppler current profiler (ADCP, RD Instruments). The eight major tidal constituent currents, estimated by a realistic 1/50° ocean model (see Section 2.4.2), were removed from ADCP data before analysis. Conductivity–temperature–depth (CTD) measurements were conducted mainly along the L1, L3, L5, and L7 across-shelf transects at intervals of about 2 km. At all CTD stations, a bucket was also used to sample water from a few dozen centimeters below the sea surface for TS measurements. The thermometer temperatures (salinometer salinities) were corrected using a regression line (R2 = 0.997 (0.998)) that related temperatures (salinities) of the bucket-sampled water. The corrected data were used in subsequent analyses. In addition, erroneous TS values at depths of 0–5 m recorded by CTD were replaced by TS values obtained by linear interpolation between the 0-m bucket and 6-m CTD data. Interpolation errors were mostly negligible because a mixed layer had formed near the sea surface in October 2016. In addition to the in situ measurements, a nighttime image of sea surface temperatures (SST) acquired by the Himawari 8 satellite on 12 October 2016 was used in this study. Some of these intensive measurement data have been reported previously by Kuroda and Toya [20], who analyzed SST fronts on the shelf.

2.2. Long-Term CTD Data along the A-Line

Since 1987, the FRA has monitored physical and biochemical conditions around the Oyashio and the Mixed Water Region along the A-line, which extends southeastward from the southeastern coast of Hokkaido (Figure 1a). In this study, we analyzed TS data measured with CTD sensors during 1988–2019. During each monitoring cruise, TS profiles were obtained basically at 25 stations along the A-line from the sea surface to the 3100 dbar depth, or to the vicinity of the sea bottom, at intervals of 1 dbar [7]. Most of the measurements were obtained in January, March, May, July, and October of each year. This study analyzed the CTD data from September-October collected at 12 stations (i.e., stations B01–A05; Figure 2a,b). TS data from depths of 0–9 m, where erroneous data were frequently recorded, were excluded from our analysis.

2.3. Historical Current Velocities at the Sea Surface

To estimate the climatological current velocity distribution around the study area, ADCP and geomagnetic electrokinetograph data were extracted from the Japan Oceanographic Data Center (JODC) database. Velocities in this database were measured at depths of 0–15 m from 1953 to 2008. We mapped estimated current velocities averaged over September-October with a resolution of 5′ (latitude) × 5′ (longitude). However, many data on the continental slope were missing. We used absolute geostrophic velocities on the slope estimated from maps of absolute dynamic topography for September-October of 1993–2015 with a resolution of 0.25° (latitude) × 0.25° (longitude), which were distributed as a delayed-mode product by the Archiving, Validation and Interpretation of Satellite Oceanographic data (AVISO) repository [21].

2.4. Ocean Simulation

2.4.1. Reanalysis Data from a 1/10° Ocean Forecast System

We used daily mean reanalysis data from an operational ocean forecast system developed by the FRA based on the Regional Ocean Modeling System (FRA-ROMS) [22]. In this system, 1/2° and 1/10° ocean models based on the ROMS (e.g., [23,24,25]) were connected by one-way nesting and coupled with three-dimensional variational objective analysis schemes in which sea level anomalies, SSTs, and profiles of in situ TS data were assimilated at weekly time intervals. This system successfully reproduces realistic basin-scale and mesoscale variations in the northwestern Pacific Ocean [22].
In this study, the reanalysis data from the 1/10° ocean model were used in two ways. First, we estimated marine heat wave indices from the reanalyzed temperatures at a depth of 50 m, using the definition proposed by Hobday et al. [26], to show that, in fact, an anticyclonic mesoscale eddy approached extremely close to the Hokkaido coast in summer 2016. In this study, however, different from Hobday et al. [26], climatological means were estimated using 25 years (1993–2017) of data, because data for a longer period were not available, and a fifth category, category 5, was added to the four categories defined by Hobday et al. [26]). Second, reanalysis data were used to force the 1/50° high-resolution ocean model.

2.4.2. High-resolution 1/50° Ocean Model

Configurations of the 1/50° model were identical to those used by Kuroda et al. [27]. The model domain (137.39–149.81° E and 35.79–47.01° N) included the northern part of Japan (i.e., yellow box in Figure 1a). Inputs of heat and momentum fluxes at the sea surface were based on 6-hourly mean net shortwave and downward longwave radiation data from the Japan Meteorological Agency’s 55-year reanalysis dataset (JRA-55) [28], and inputs of hourly meteorological data (wind speed and direction, relative humidity, air temperature, precipitation, and atmospheric pressure) were from the Grid Point Value–Mesoscale Model (GPV/MSM) [29]. Daily mean discharges of water from all water systems were estimated and introduced to the 1/50° model as described by Kuroda et al. [30]. Lateral boundary conditions were derived from the daily mean reanalysis data of the 1/10° FRA-ROMS. Barotropic tidal currents and elevations for the eight major tidal constituents (K1, O1, P1, Q1, M2, S2, K2, and N2) were derived from the NAO.99Jb regional tidal model [31] and added to the lateral boundary values derived from the 1/10° FRA-ROMS. The equilibrium tide and the effects of self-attraction and loading are not included in the governing equations of the 1/50° model; this model reproduces tides and tidal currents well [27]. Moreover, to modify mesoscale variations in the 1/50° model, we introduced spectral nudging into the model [32,33], which has been adapted to many regional climate models (e.g., [34,35,36]). TS data from the 1/50° model and the 1/10° FRA-ROMS were low-pass-filtered by the same spatial filter to extract TS variations associated with mesoscale variability at a spatial scale greater than about 100 km. The TS differences between the two models were fed into the 1/50° model in 5 day increments by incremental analysis updating [37]. As a result, TS within about 50 km from the coast (i.e., on the shelf) and submesoscale variations at spatial scales of less than about 100 km were not modified. In addition, increments were added only below a depth of 200 m, so TS conditions within the surface mixed layer were not modified. In fact, TS were little modified by spectral nudging for coastal shelf waters, which this study focuses primarily on, whereas subsurface TS that were related to mesoscale eddies and the Oyashio Stream on the slope were effectively modified by this method.
We used outputs of daily means (i.e., temperature, salinity, velocity, sea level, and vertical eddy diffusion) from the 1/50° model to characterize oceanographic conditions and conduct particle-tracking experiments, and outputs of harmonic constants of tidal currents, after careful validation [27], to eliminate tidal currents from the ship-mounted ADCP measurements obtained during the intensive ship surveys conducted on the Pacific shelf slope during 11–13 October in 2016.

2.5. Particle-Tracking Experiment

To infer the origin of the specific water mass observed on the Pacific shelf in October 2016, off-line particle-tracking experiments were carried using daily mean outputs of the 1/50° ocean model. For these experiments, we used the Larval TRANSport (LTRANS) model [38], which is configured for ROMS output, but the source codes were modified to suit our model’s configuration and purpose [39,40]. A large number of particles (about 500,000) were initially set in the specific water mass on the Pacific shelf and then passively transported backward in time for 70 days from the observed day (i.e., 12 October 2016) by reversing the sign of the three-dimensional model velocity. A small horizontal diffusion constant (0.5 m2 s−1) was assumed, and vertical turbulent diffusion was introduced by using the corrected random walk method proposed by Visser [41]. Generally, off-line particle-tracking experiments backward in time include errors due to many uncertainties, such as those arising from sub-grid turbulence schemes, model output interpolation errors, intrinsically irreversible random walk processes, and the adopted assumptions about lateral and sea-surface boundaries (e.g., Isobe et al. [42]). These types of errors can be severe, particularly when the source area or trajectory of a material must be specified with pinpoint precision. To avoid such methodological shortcomings, our study analyzed the spatio-temporal behavior of groups composed of a large number of particles rather than that of single particles.

3. Results

3.1. Overview of the Weather and Marine Extremes in Summer 2016

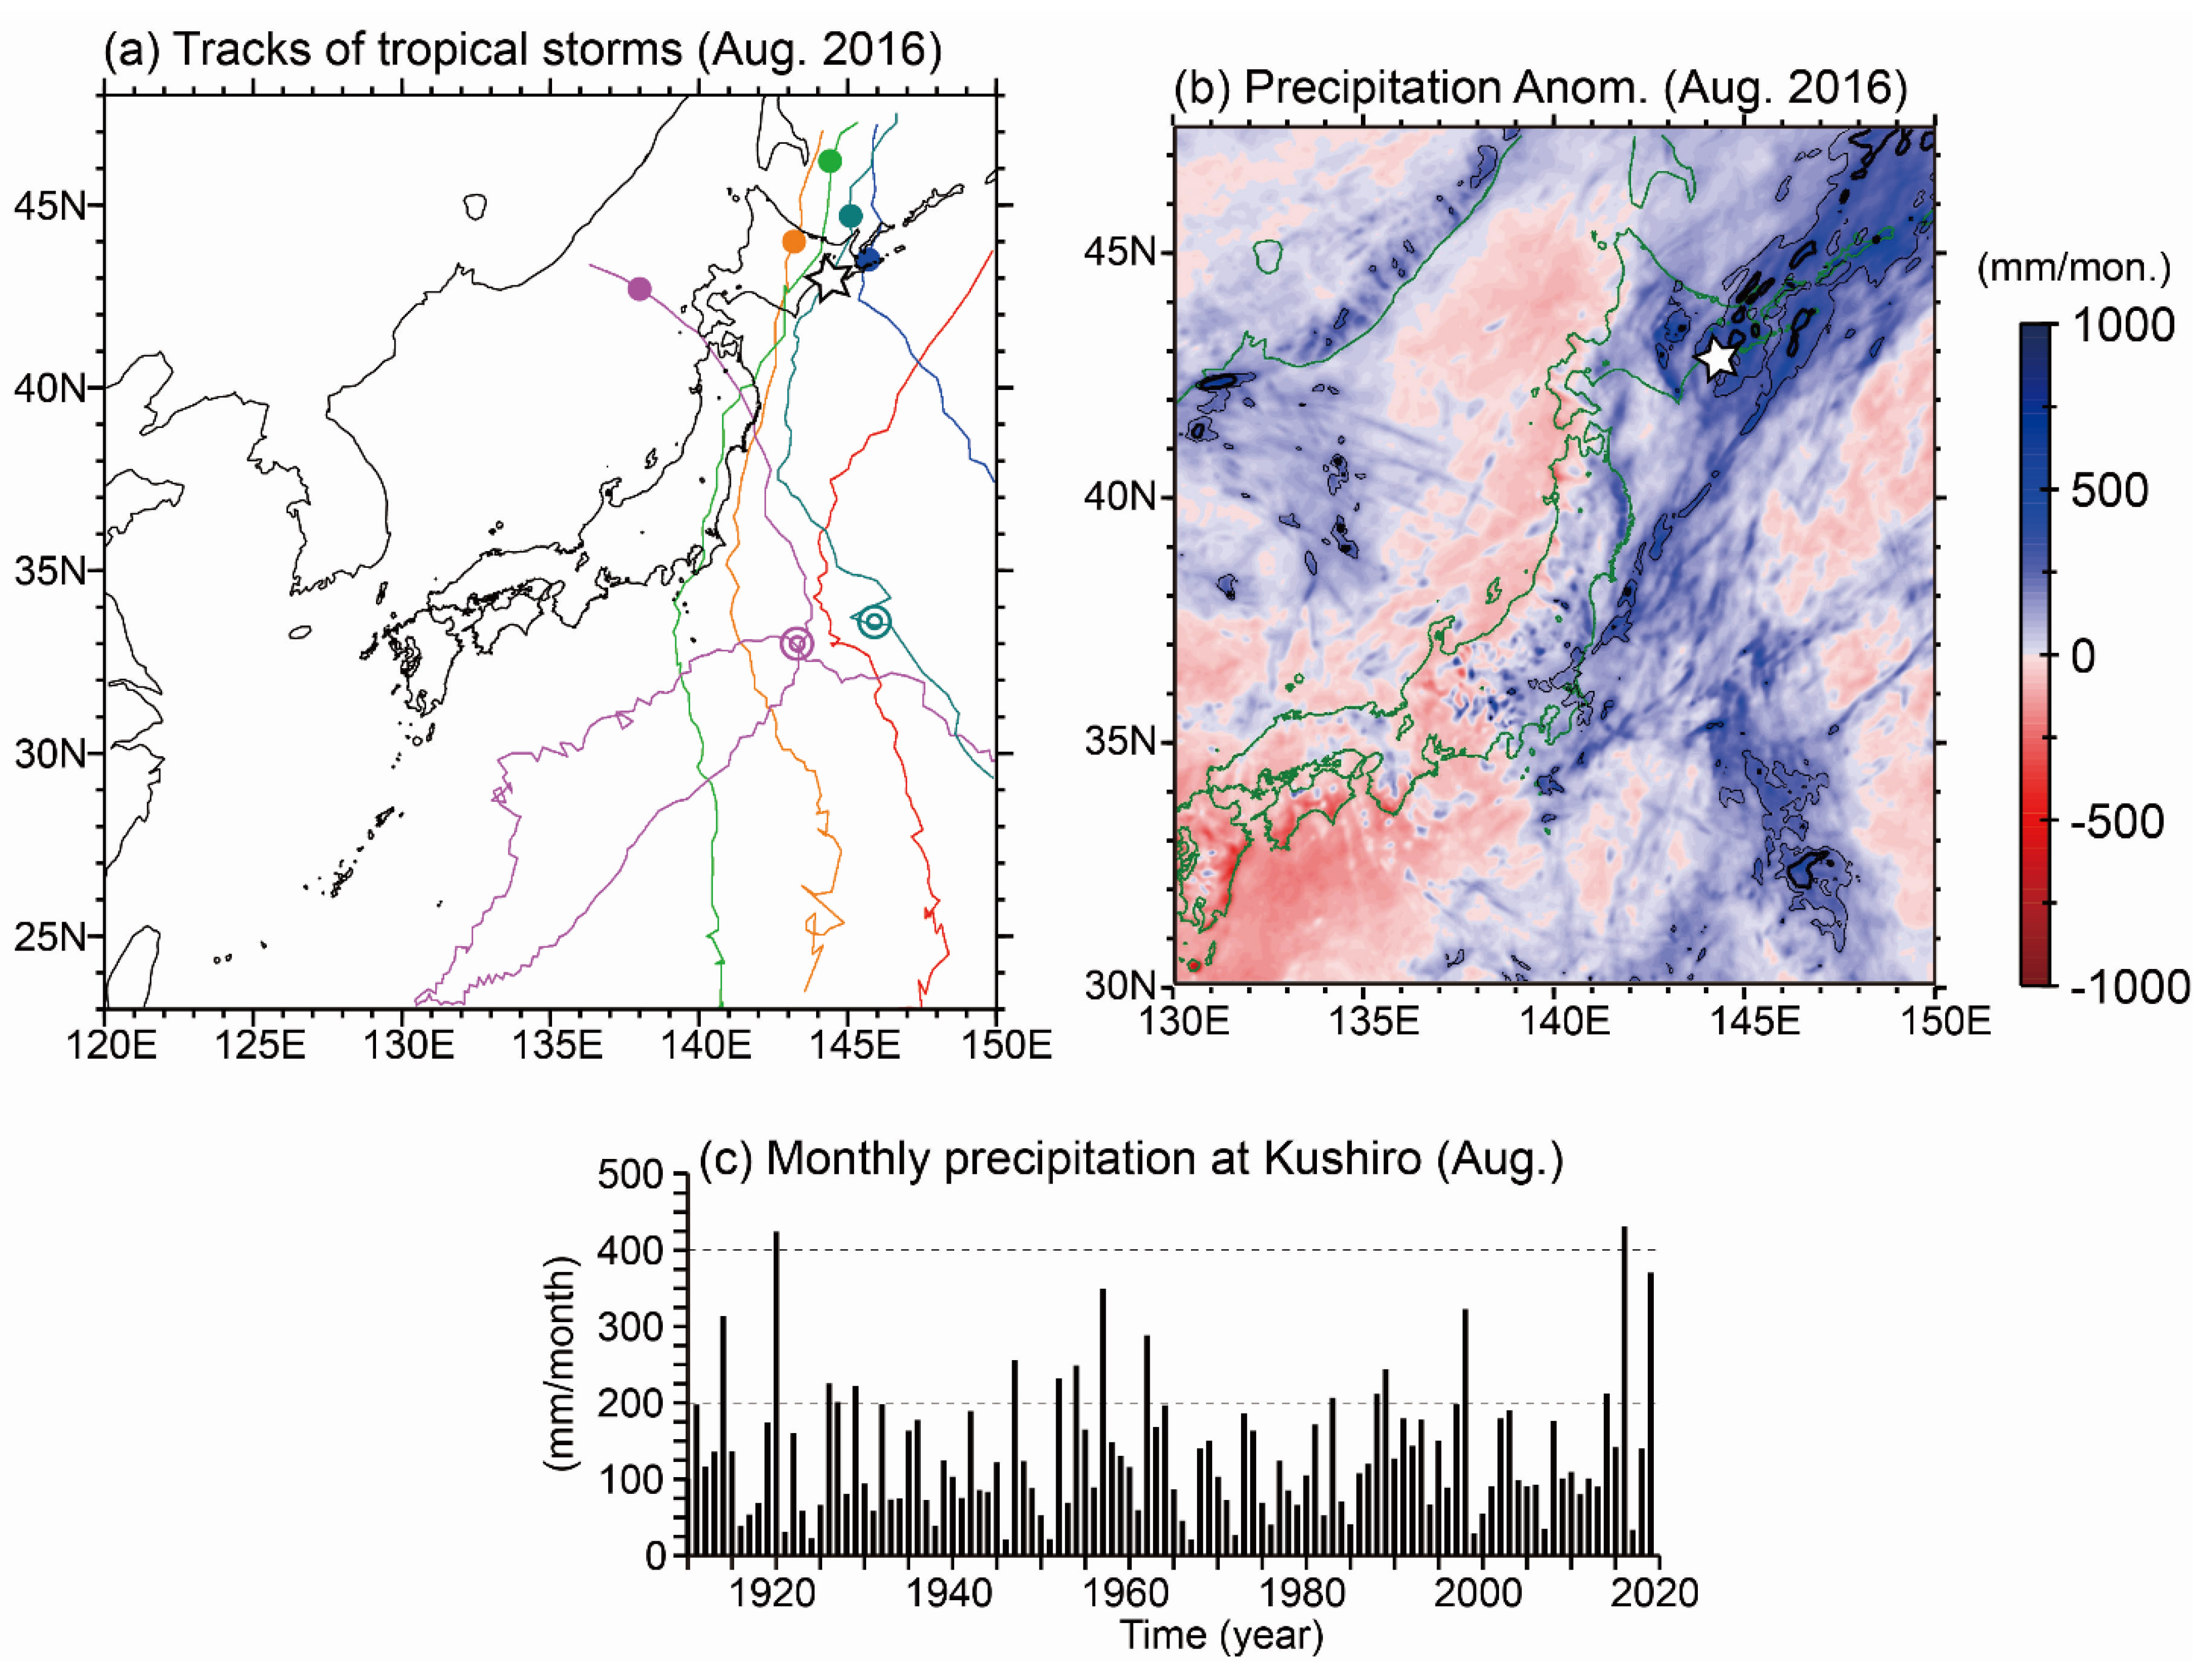
According to statistics recorded during 1951–2018 by the Japan Meteorological Agency [43], on average, 1.6 tropical storms approach Hokkaido each year in June-October. In August 2016, however, six tropical storms successively approached Hokkaido, and three of the six made landfall in Hokkaido [44] (Figure 3a). This situation was very exceptional. In addition, according to statistics for 1961–2016 reported by Kitano et al. (2017), only about 20% of tropical storms that approach Hokkaido have moved northward over the North Pacific east of Honshu Island, and the rest of them have moved northward over Honshu Island or the Japan Sea. Notably, in August 2016 an abnormally high proportion (five of the six) of the tropical storms had moved northward over the North Pacific (Figure 3a). Along this pathway, storms are less attenuated by land-surface friction than those moving along the other pathways [41].
The successive tropical storms in August 2016 brought extremely heavy rainfall to the eastern part of Hokkaido [45]. Monthly precipitation in August 2016 at Kushiro, in southeastern Hokkaido, was the heaviest since 1910 and exceeded 400 mm, followed by that in August 1920 (Figure 3c). Precipitation anomalies in August 2016, compared to monthly means for August during 2007–2019 (Figure 3b), revealed that the heavy precipitation occurred mostly around the tracks of the tropical storms over the North Pacific and that precipitation occurring around eastern Hokkaido and the Four Islands was 3–5 times the 13-year mean (Figure 3b).
In addition to these extreme atmospheric events, oceanographic conditions off the southeastern coast of Hokkaido in summer 2016 were unusually strongly affected by an anticyclonic mesoscale eddy of subtropical Kuroshio waters that very closely approached the Hokkaido coast in June-October 2016 [10]. To obtain an overview of this phenomenon, we calculated marine heat wave indices using temperatures at 50 m depth (Figure 4). The results showed localized marine heat waves southwest of the southeastern coast of Hokkaido in June 2016 (Figure 4a), and large localized anomalies slowly propagated northeastward along the Hokkaido coast from June to October (Figure 4a–e). Thus, marine and weather extremes occurred simultaneously around the coastal shelf waters off southeastern Hokkaido in August 2016.

3.2. Observed Results

3.2.1. Climatological Conditions in September–October

We first describe the climatological features of coastal shelf waters around the study area in September–October to characterize conditions of a normal year for later comparison with the results of the intensive ship measurements conducted in October 2016. In the climatology, alongshore currents flow southwestward on the Pacific shelf and slope in September–October (Figure 5a). Near the sea surface, high-salinity water (≥33.0) is distributed on the shelf, but a tongue of low-salinity water (<33.0) extends along the slope from the northeast to the southwest. The high-salinity waters on the shelf and the low-salinity waters on the slope are likely transported in the along-shelf direction mainly by the Coastal Oyashio and the Oyashio, respectively.
Across-shelf sections of long-term mean TS in September–October along the A-line indicate that the high-salinity water (≥33.0) on the shelf corresponds to warm water that is trapped against the coast (Figure 5b,c). The subtropical water with temperatures of ≥7 °C and salinities of 33.0–33.7 on the Pacific shelf is generally referred to as modified Soya Warm Current water [14]. This subtropical water occurs mainly within the seasonal thermocline above 100 m depth on the shelf, which deepens from the offshore area toward the coast. The across-shelf density structure depends strongly on the temperature structure (Figure 5b,d). Thus, the across-shelf thermal and density gradients on the shelf help to maintain the Coastal Oyashio (Figure 5a). In contrast to the across-shelf thermal gradients, the across-shelf salinity gradients tend to weaken the Coastal Oyashio on the shelf, because low-salinity water (<33.0) is distributed at depths of 0–30 m on the slope (south of 42°30′ N in Figure 5c).

3.2.2. Hydrographic Conditions in October 2016

Figure 6a shows the distribution of Himawari 8-derived SSTs on 12 October 2016. The easternmost track of the research vessel crosses the western to the northwestern edge of an anticyclonic eddy where northeastward current flows of about 50 cm s−1 were recorded (Figure 6b,c). These flows can be interpreted as a warm band-like streamer along the northern edge of the eddy (Figure 6a). The southernmost stations of the L1, L3, and L5 across-shelf transects were located along the northern rim of the streamer. In contrast to the warm water of the streamer, the sea surface in the vicinity of the Pacific shelf was characterized by relatively cold water of <15 °C.
Shelf waters were characterized by low salinity (<33.0), whereas salinity became higher (≥33.0) on the slope (Figure 6b). The low-salinity water was distributed not only at the sea surface but in the subsurface; the vertical thickness of the low-salinity water layer on the shelf ranged from 10 to 50 m (Figure 6c). Moreover, the 33.0 isohaline separating the low- and high-salinity waters was located along the shelfbreak, where the Coastal Oyashio exhibited a jet structure with along-shelf velocity maxima of 60–80 cm s−1. The across-shelf distribution of salinity on the shelf and slope in October 2016 was thus opposite to the climatological distribution. Nonetheless, interestingly, as in the climatology, the Coastal Oyashio was also present on the Pacific shelf in October 2016.
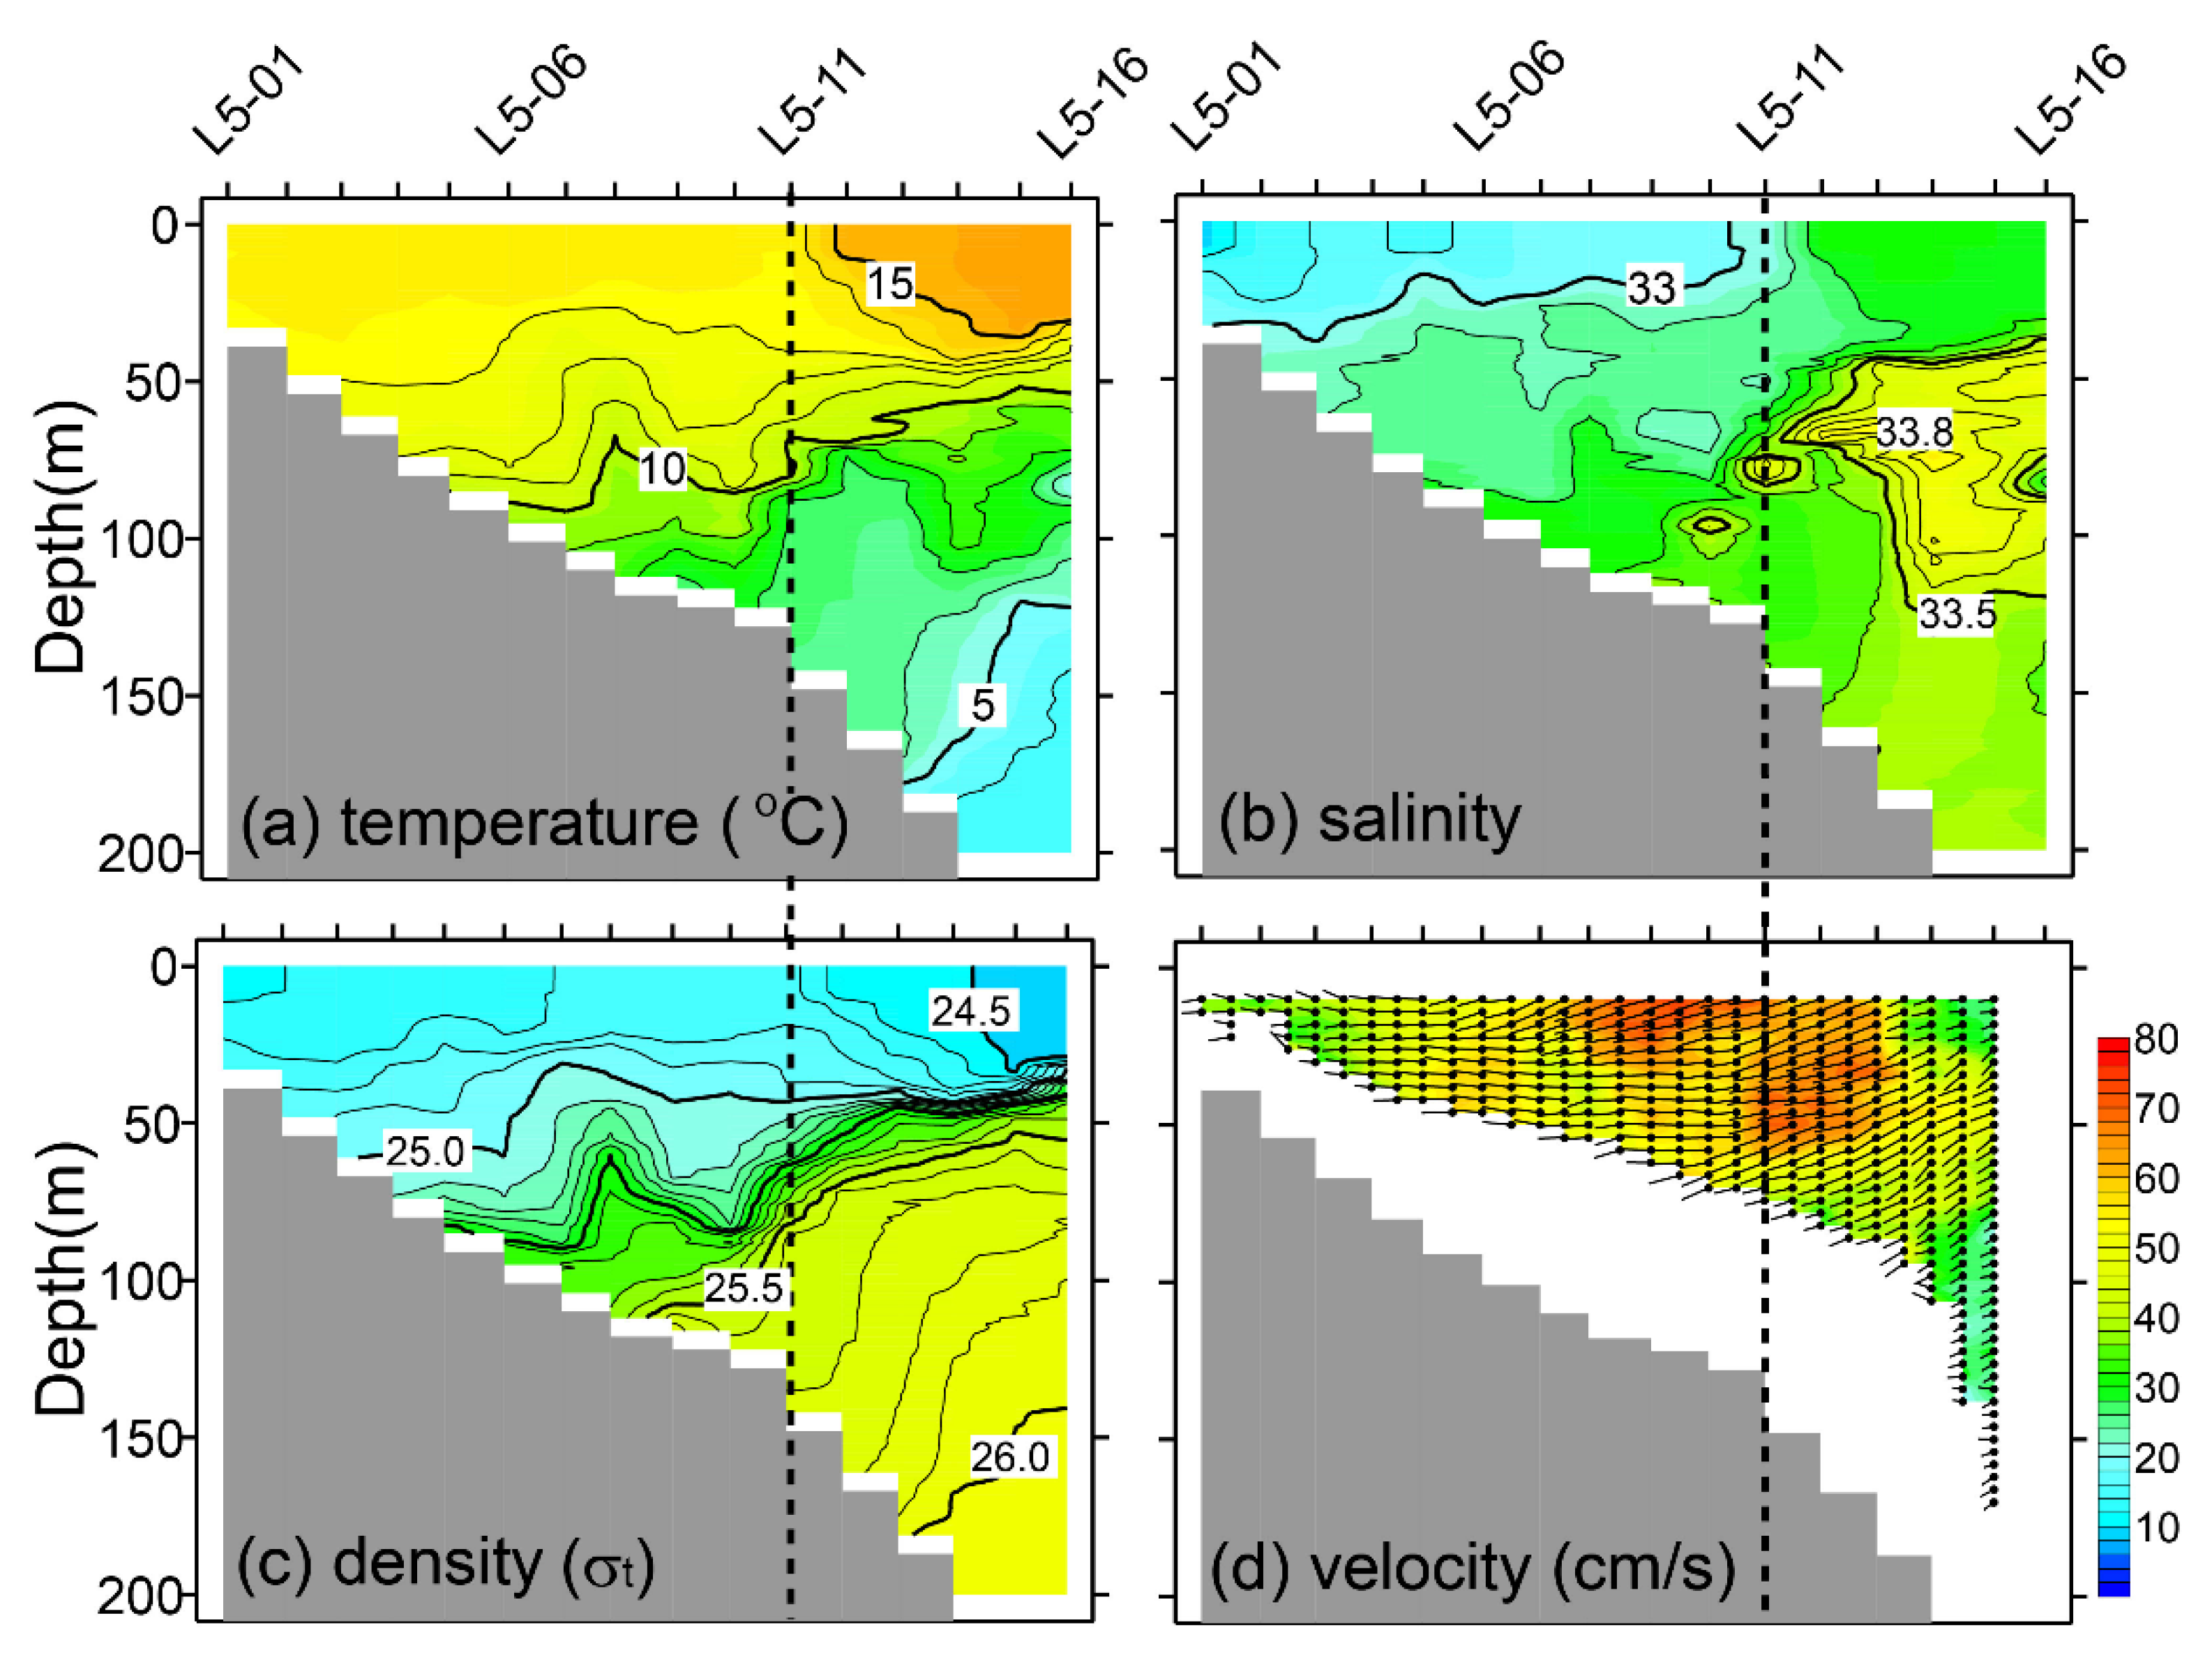
Across-shelf sections along L5 of temperature, salinity, density, and velocity are shown in Figure 7. A low-salinity (<33.0) layer with a thickness of 20–35 m was distributed near the sea surface on the shelf and appeared to be trapped against the coast (Figure 7b). This low-salinity layer was vertically homogeneous, primarily as a result of vertical convection due to sea surface cooling beginning in autumn. Water with particularly high salinity (salinity maximum ≥ 33.8) was observed at depths of 50–150 m along the shelfbreak and slope. This high-salinity water roughly corresponded to temperatures of 5–10 °C (Figure 7a). On the Pacific shelf, water with a high salinity of ≥33.7 is generally classified as subtropical Kuroshio water (salinity 33.7–34.2, temperature ≥ 5 °C) [14]. Therefore, the salinity maximum in the subsurface is attributable to Kuroshio water derived from the anticyclonic eddy. The contrast between the low-salinity water near the sea surface on the shelf and the high-salinity Kuroshio water in the subsurface on the slope (offshore of the vertical dashed line in Figure 7) strengthened the across-shelf salinity gradient near the shelfbreak. In fact, strong along-shelf velocities with a maximum of ≥70 cm s−1 were observed near the salinity front between the two water masses (Figure 7d). A similar relationship was not identified between the across-shelf salinity gradient and current jets near the shelfbreak during the climatologically normal September–October period (Figure 5).

3.2.3. Peculiarity of the Salinity Structure in October 2016

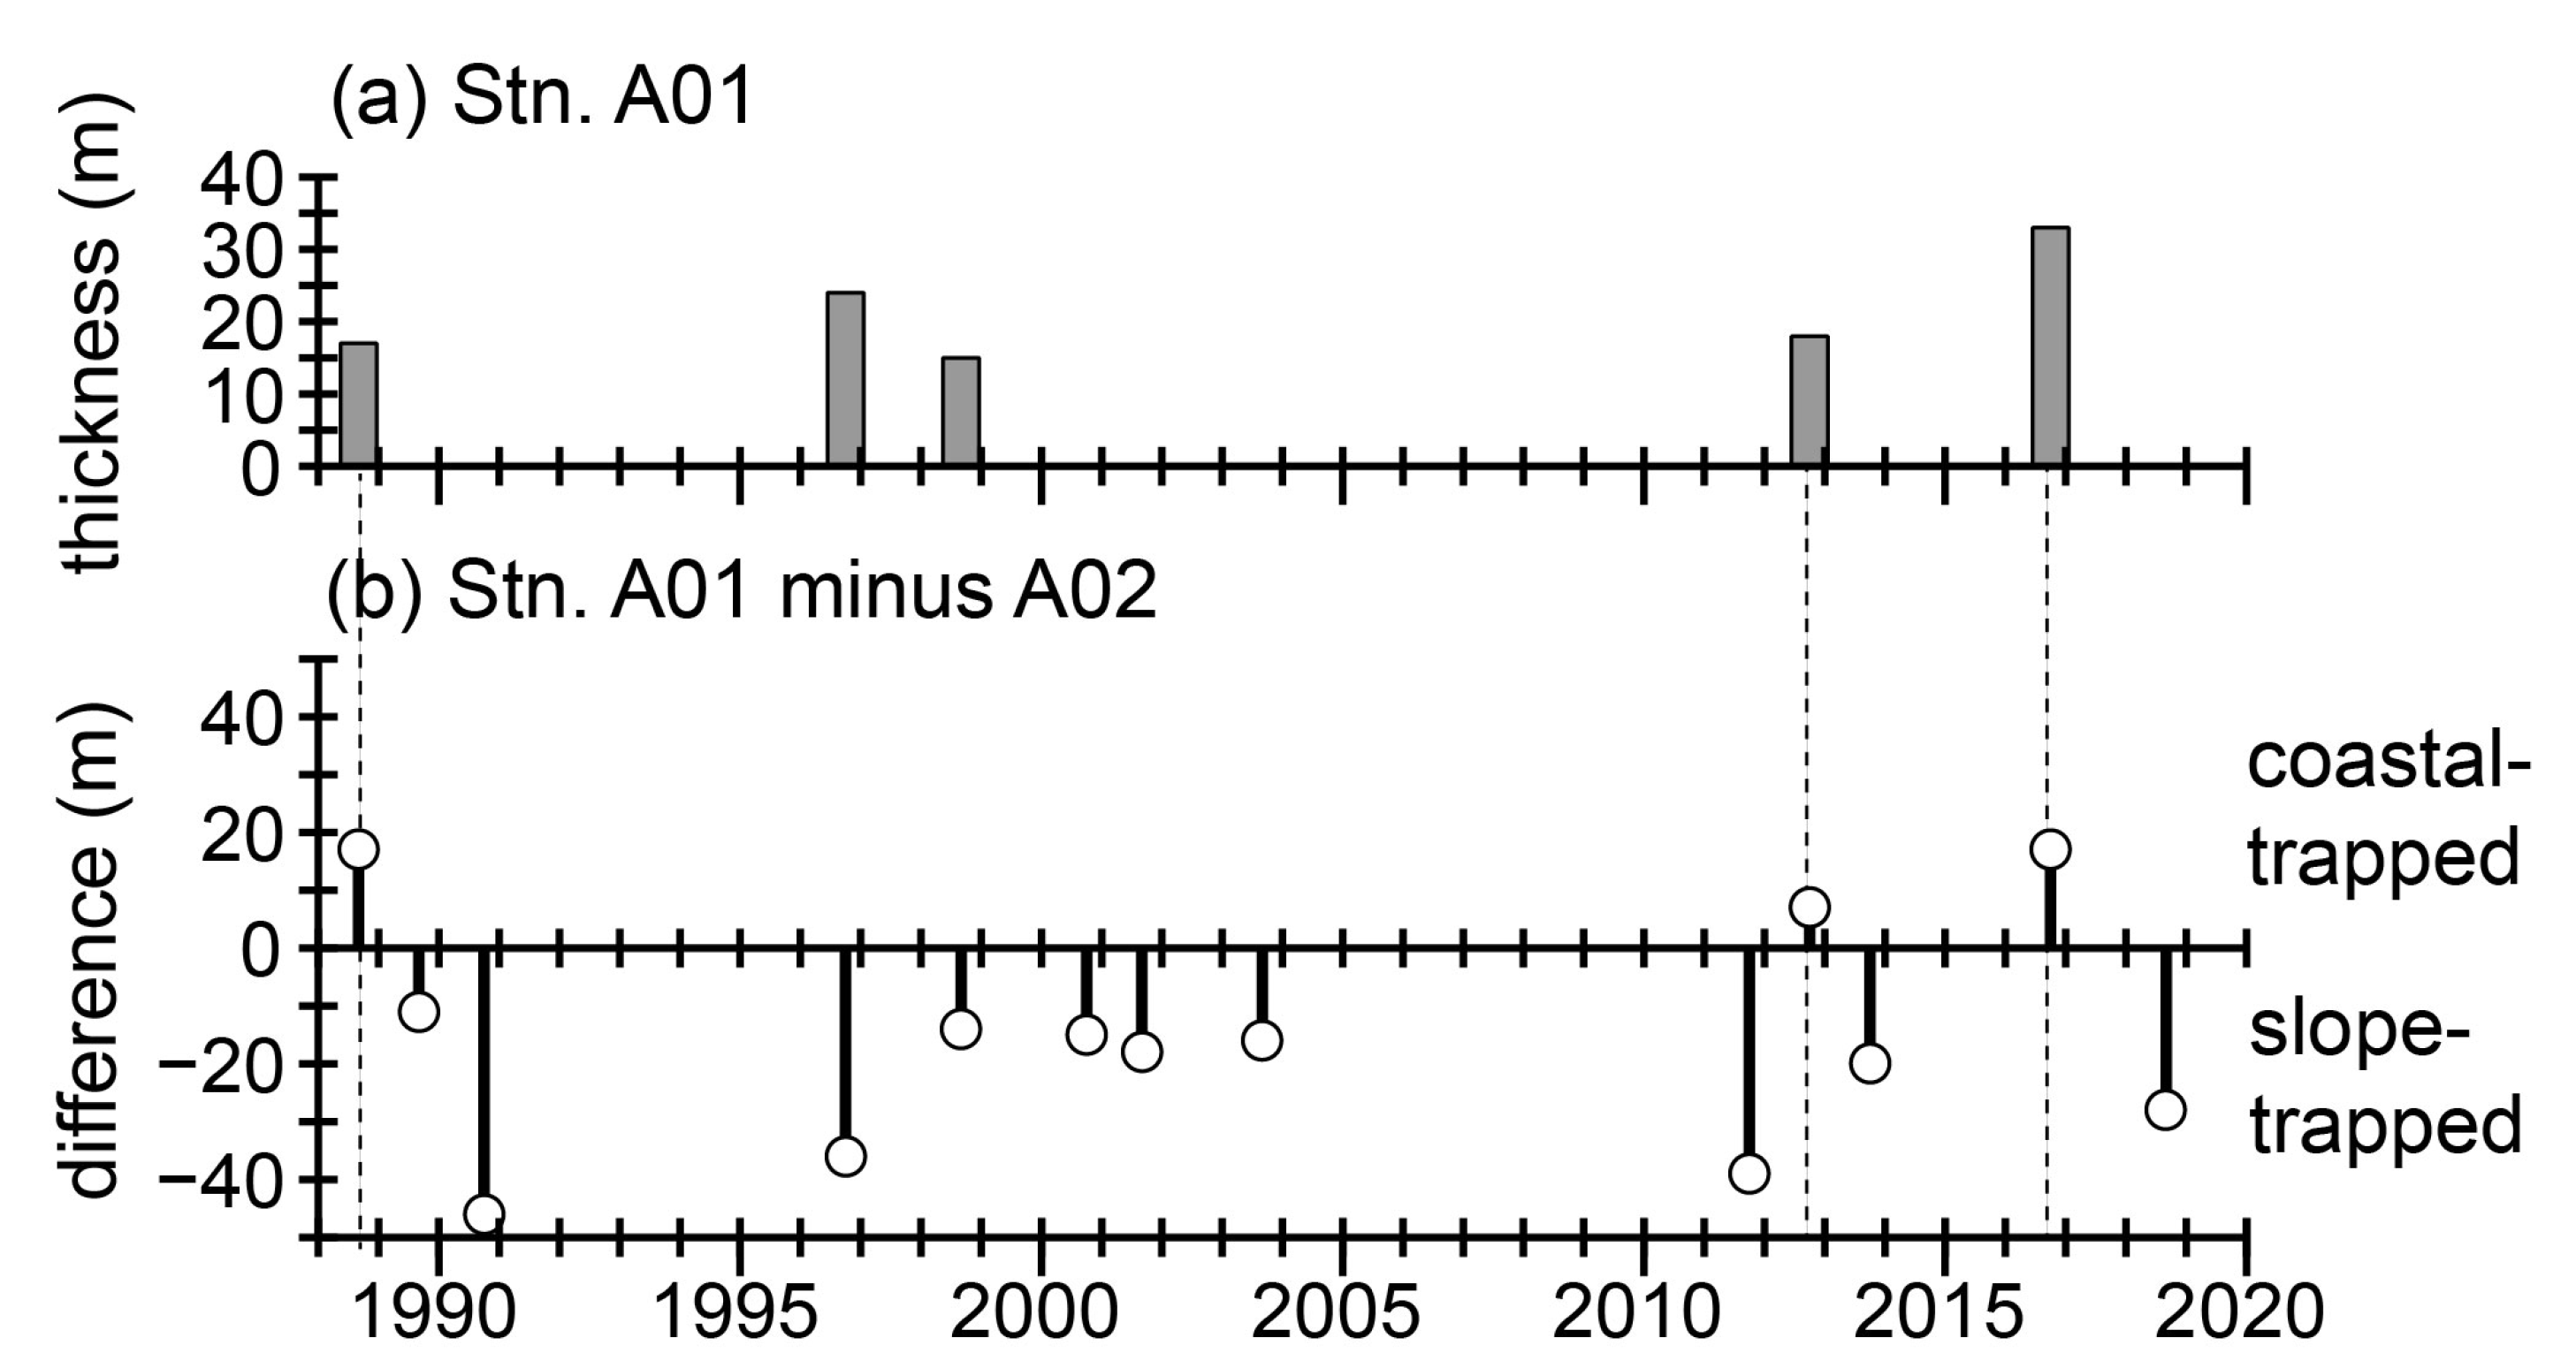
Examination of the long-term CTD data along the A-line shows the peculiarity of the coastal-trapped structure of thick low-salinity (<33.0) water on the Pacific shelf (Section 3.2.2). To identify the presence of similar structures historically, we examined the time series during 1988–2019 of the layer thickness of low-salinity water at station A01 (Figure 8a) and that of the difference in layer thickness between stations A01 on the shelf and A02 on the slope just off the shelfbreak (Figure 8b). In the climatology, relatively thick, low-salinity (<33.0) waters tended to be trapped against the slope rather than against the coast (Figure 5c); this structure is clearly different from the coastal-trapped structure observed in October 2016 (Figure 7b). Out of a total of 38 measurements at station A01 obtained during 1988–2019, five (1988, 1996, 1998, 2012, and 2016) captured low-salinity waters outcropping at the sea surface (Figure 8a). Among these five cases, coastal-trapped features were identified only in 1988, 2012, and 2016 (8% of total measurements) (Figure 8b). The layer thickness was largest, 33 m, in 2016, followed by 18 m in 2012 and 17 m in 1988. To sum up, the long-term CTD data suggest that a coastal-trapped structure of low-salinity water with a thickness ≥10 m on the shelf occurs approximately once a decade, but the occurrence of a coastal-trapped structure with a low-salinity layer thickness on the shelf exceeding 30 m, such as was observed in October 2016, is even rarer.

3.3. Simulation Results

3.3.1. Simulation by the 1/50° Ocean Model

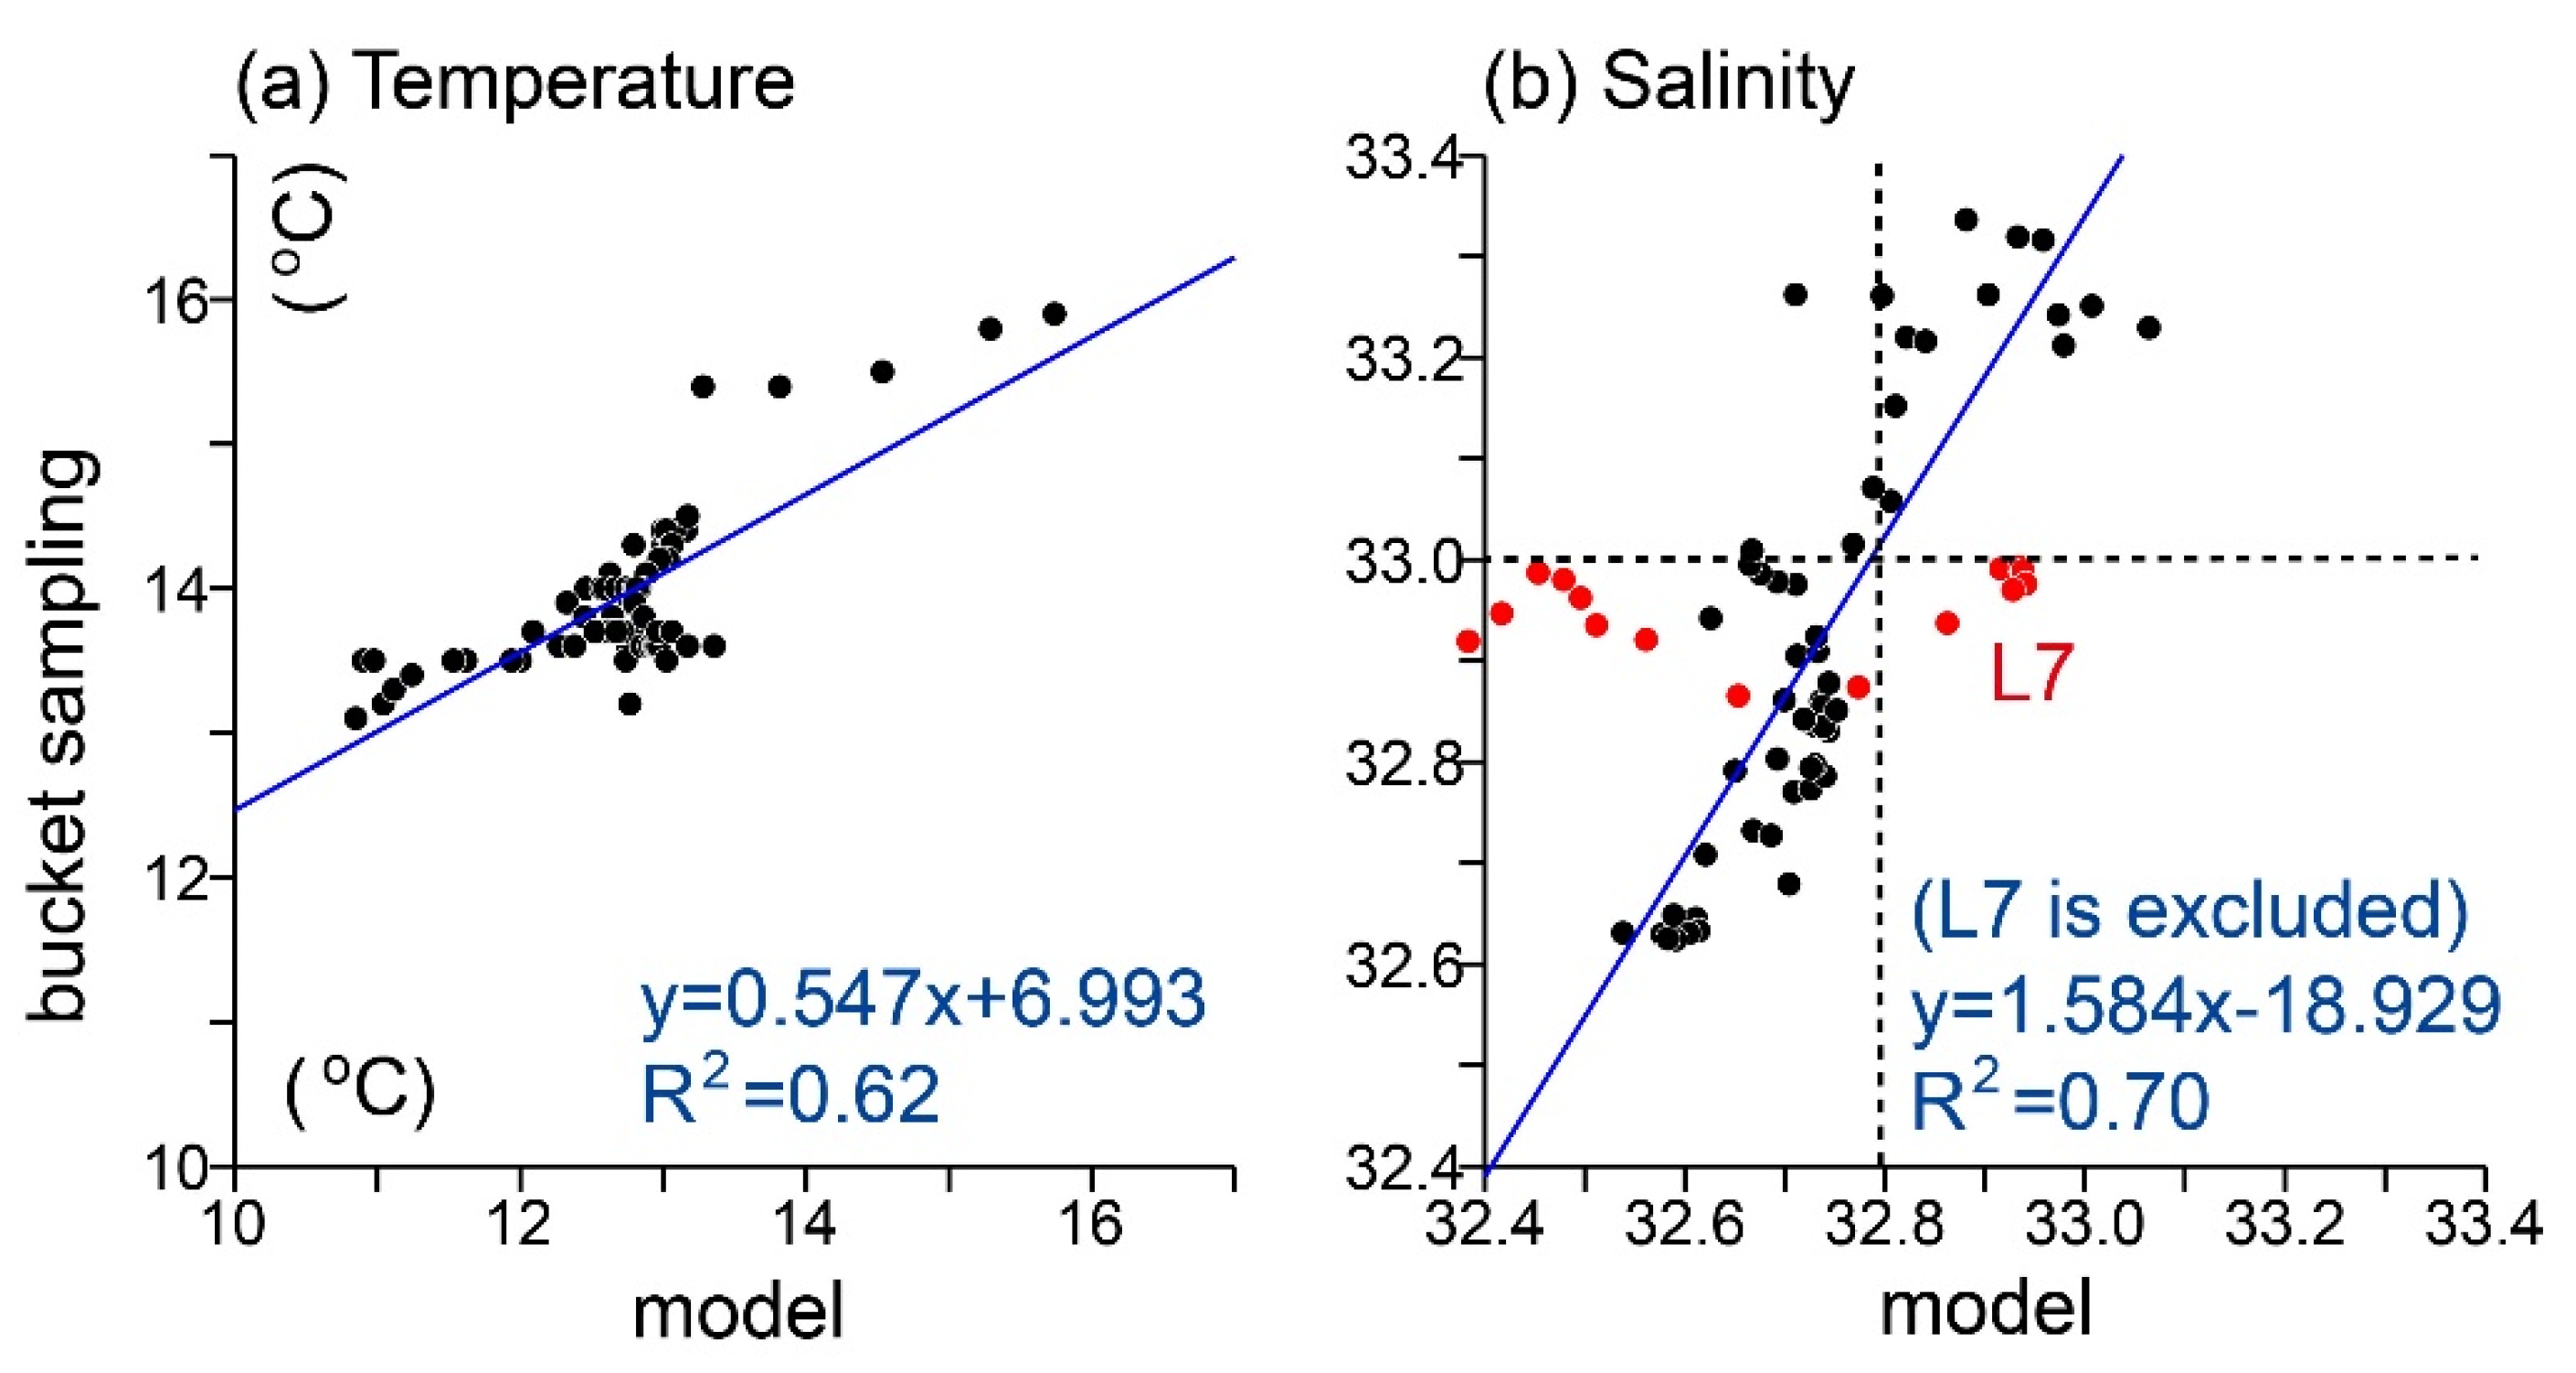
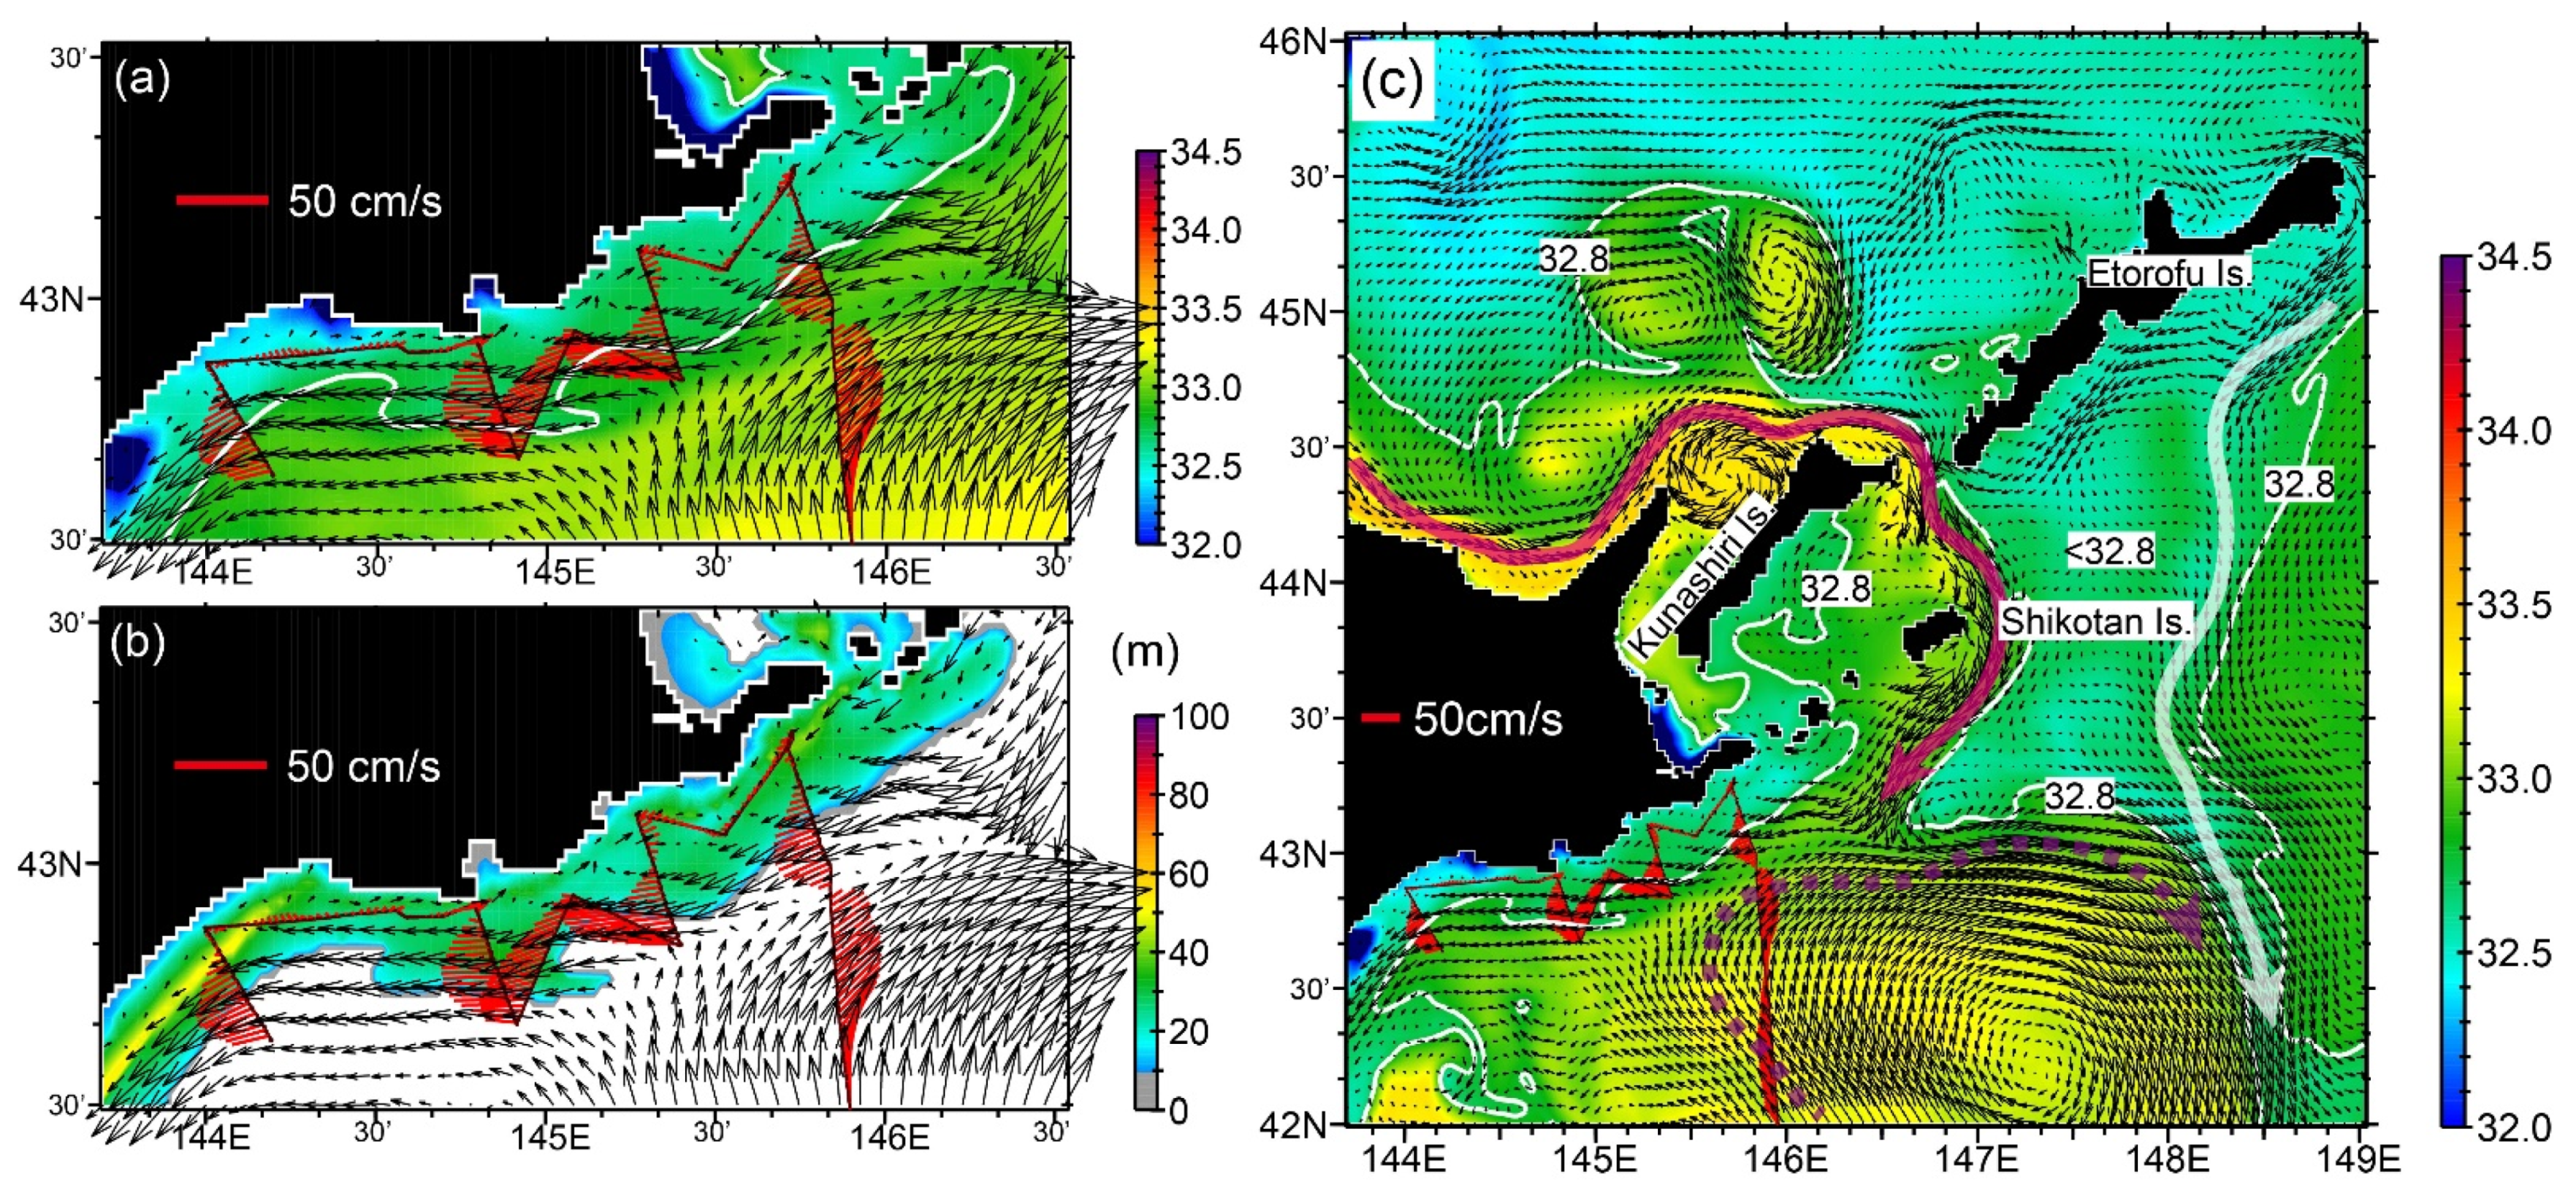
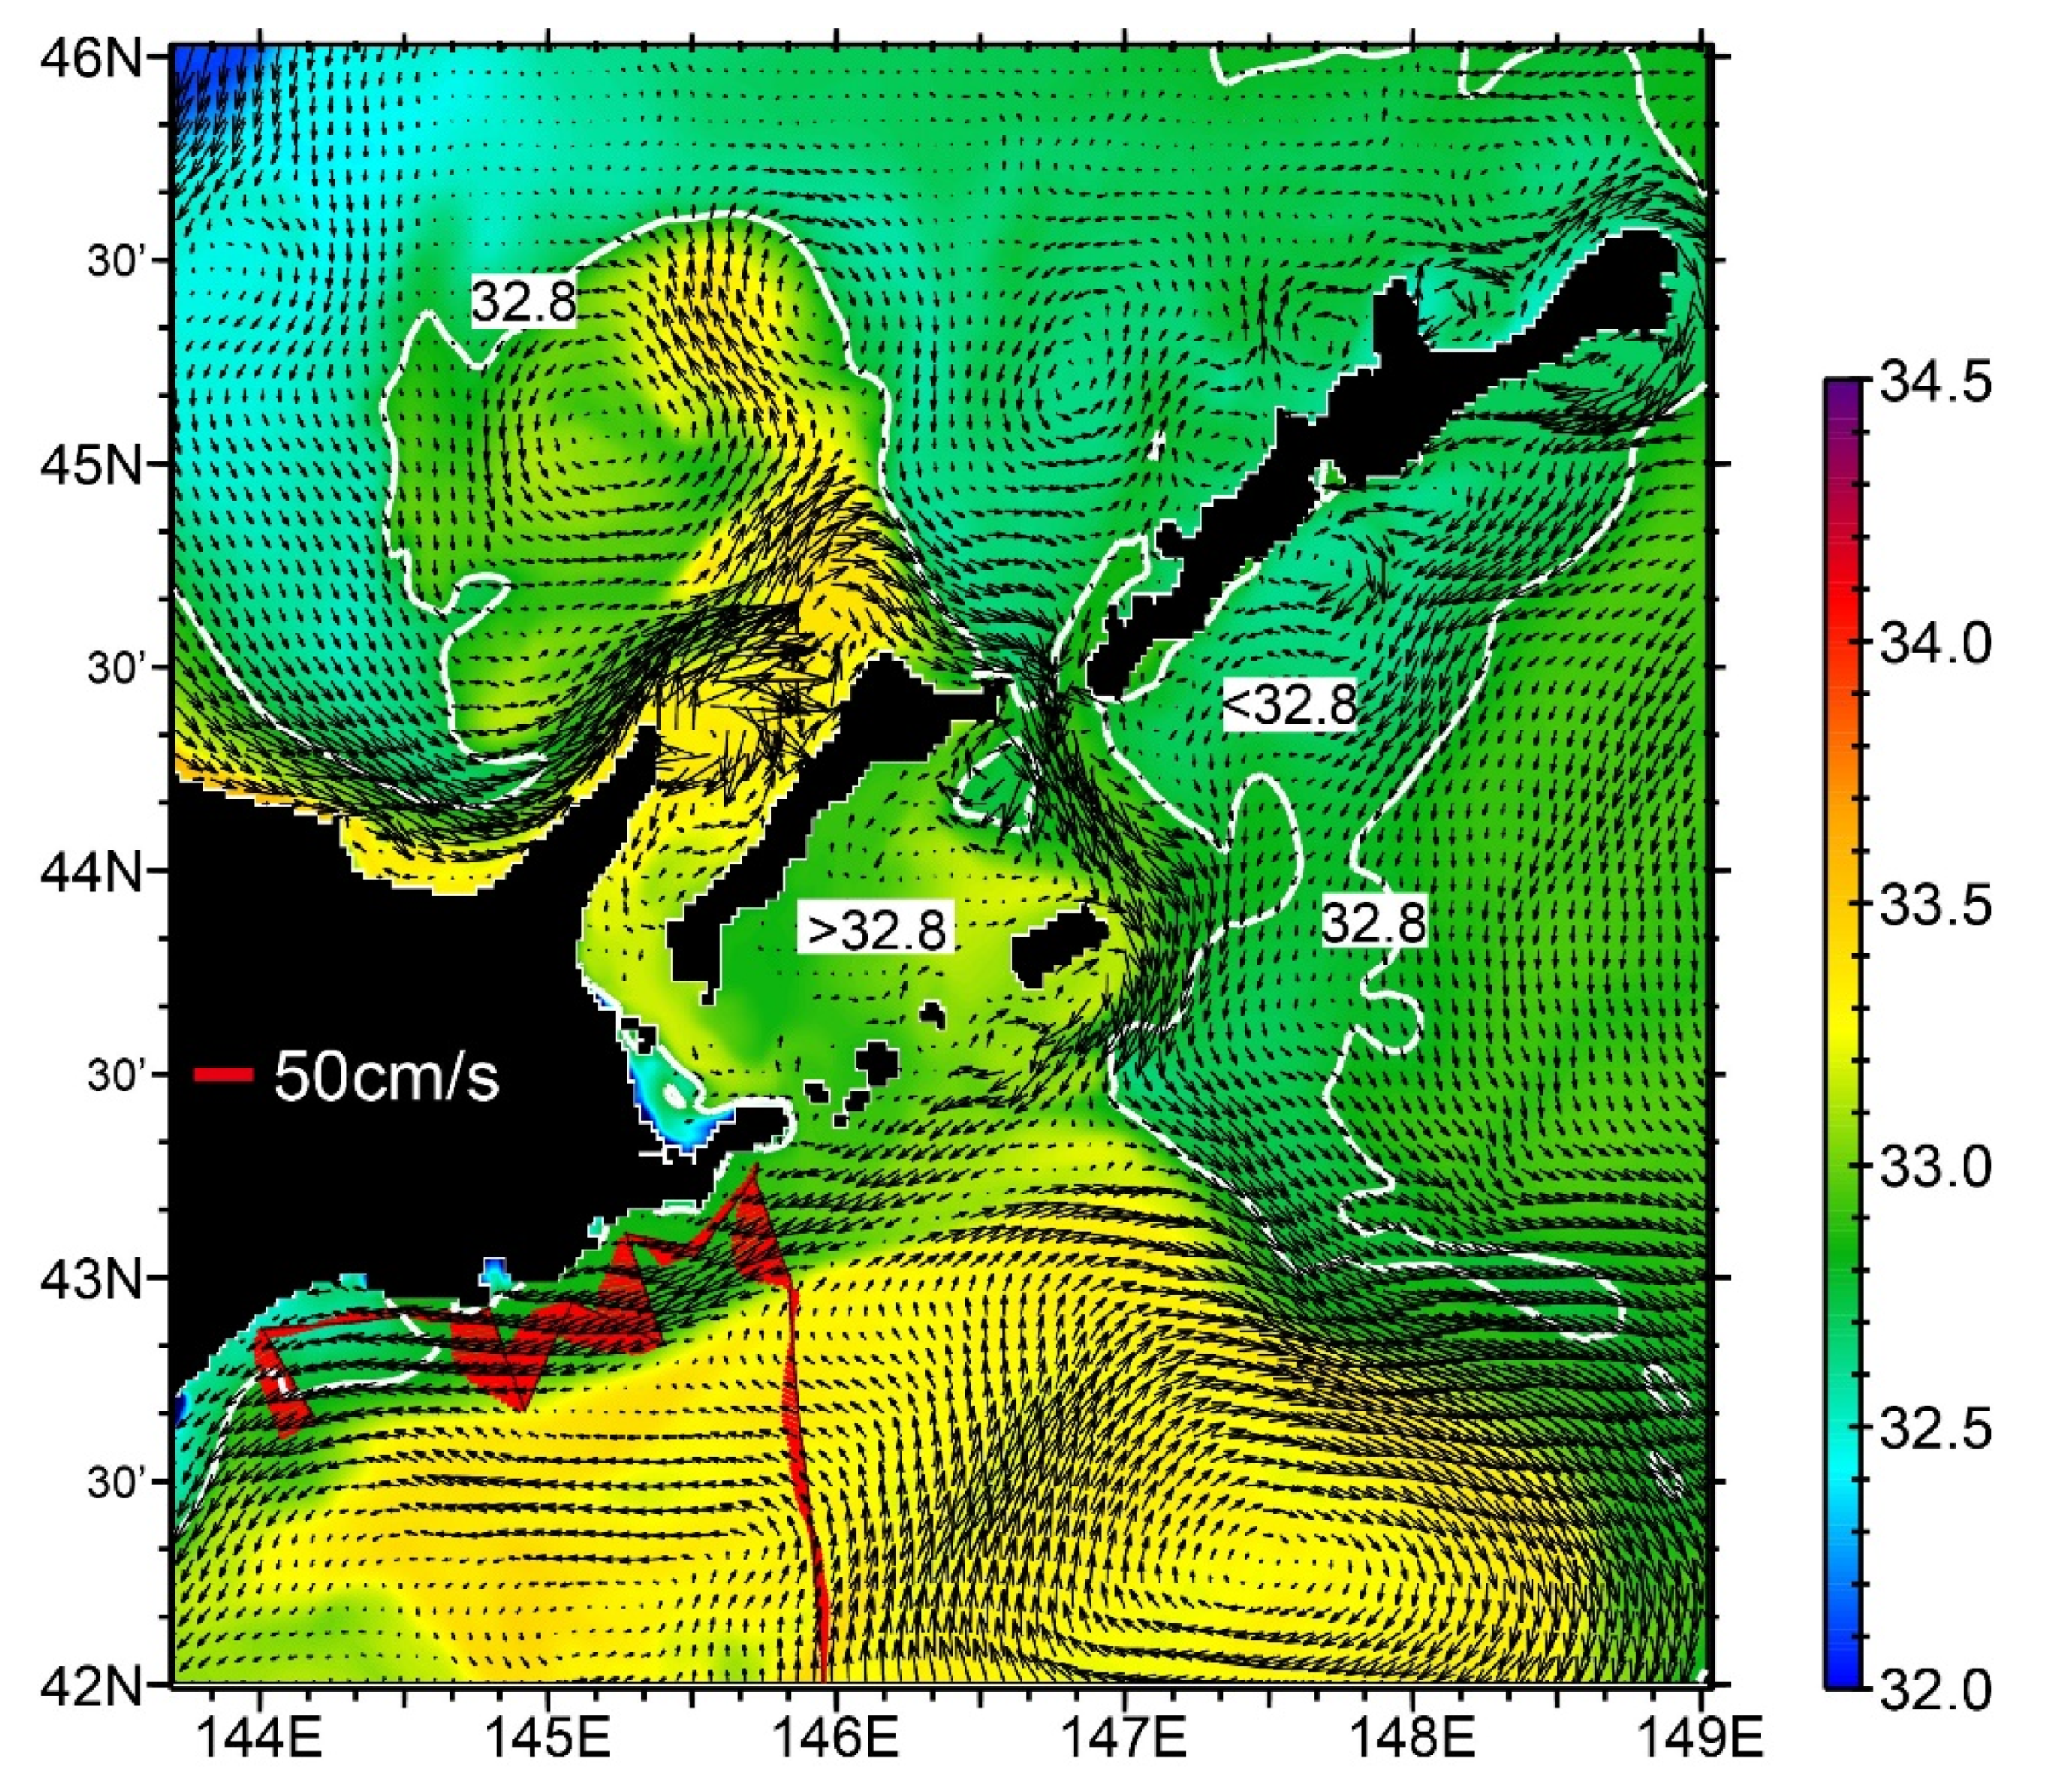
This subsection describes the simulation results of the 1/50° ocean model for 12 October 2016, when the intensive ship measurements were conducted. Details of the model reproductivity, including the model biases, are summarized in Appendix A (Figure A1 and Figure A2). Overall, the 1/50° model reproduced the observed hydrographic features around the Pacific shelf, including the anticyclonic eddy stagnating on the slope (Figure 9a), the thick (≥30 m) layers of low-salinity water trapped against the coast on the shelf (Figure 9b), and the across-shelf salinity gradients on the shelf and slope (Figure 9a). In addition, the simulation of the Coastal Oyashio showed an alongshore velocity maximum along the salinity front near the shelfbreak (Figure 9a,b). In this regard, the model showed a low-salinity bias near the sea surface around the Pacific shelf. Therefore, as a result of the correction of the salinity bias based on the regression between the simulated and observed values (R2 = 0.70, Figure A2), the 32.8 isohaline was used to represent the simulated salinity front along the shelfbreak (e.g., Figure 9a,c).
A notable discrepancy between the model and observation was that the spatial maximum velocity of the simulated Coastal Oyashio (Figure 9a) was about half as large as the observed velocity (Figure 8b). This weak bias of the jet was related to the fact that subsurface thermal structures along the northern edge of the warm streamer around the anticyclonic eddy were not consistent between the model and observation. That is, the simulated across-shelf thermal gradients at depths below 50 m on the slope baroclinically intensified the eastward velocity anomaly (Figure 10a) than the observed ones (Figure 7a). Meanwhile, the observed across-shelf salinity structures (Figure 7b) (i.e., the thick layer of low-salinity water (<32.8) trapped against the coast on the shelf and the vertical salinity maximum (≥33.7) associated with Kuroshio water at 50–150 m depth on the slope) were well reproduced by the model (Figure 10b).
The map of simulated salinity and velocity near the sea surface on 12 October 2016 (Figure 9c) shows that the Soya Warm Current along the northeastern coast of Hokkaido in the Okhotsk Sea flowed out to the North Pacific mainly through the Kunashiri Strait between Kunashiri and Etorofu islands, then southward around the east side of Shikotan Island, and finally toward the southwest (solid pink arrow in Figure 9c). Southwest of Shikotan Island, the flow bifurcated: one branch joined the eastward flows along the northern edge of the anticyclonic eddy, and the other flowed westward along the 32.8 isohaline to the observation area on the Pacific shelf. The bifurcation point seems to be the origination point of the Coastal Oyashio along the salinity front near the Pacific shelfbreak.
High-salinity water (≥32.8) derived from the Soya Warm Current in the Okhotsk Sea was distributed continuously via its downstream extension to the anticyclonic eddy in the North Pacific. Meanwhile, low-salinity waters (<32.8) were split into eastern and western areas by the Soya Warm Current and its extension. The eastern area of low-salinity water, which was distributed in the Okhotsk Sea and in the North Pacific south of Etorofu Island, was likely transported by the Oyashio, which flowed along the northeastern and eastern edge of the anticyclonic eddy (white arrow in Figure 9c). The western area of low-salinity water was distributed from south of Kunashiri Island to the Pacific shelf and our observation area along the Hokkaido coast.

3.3.2. Particle-Tracking Experiment

To infer the origin of the vertically well-mixed low-salinity water distributed on the Pacific shelf in October 2016, we performed particle-tracking experiments backward in time using daily outputs of the 1/50° model. Large numbers of particles were initially set in the low-salinity water (<32.8) on the Pacific shelf (i.e., pink polygon in Figure 11) at intervals of 1/50° horizontally and 1 m vertically. At each point, 30 particles were released, so that trajectories of a total of 489,630 particles were tracked backward in time. Every 1 h we traced the position (i.e., longitude, latitude, and depth) of each particle and the salinity and temperature that it was experiencing. At each moment during the tracking, particles were categorized as “L-particles” or “H-particles” according to whether they were experiencing low (<32.8) or high salinity (≥32.8), respectively, based on the supposition that low- and high-salinity waters (i.e., L-particles and H-particles, respectively) were passively transported by ocean currents, becoming mixed along the way, before finally forming the vertically homogeneous low-salinity water on the Pacific shelf.
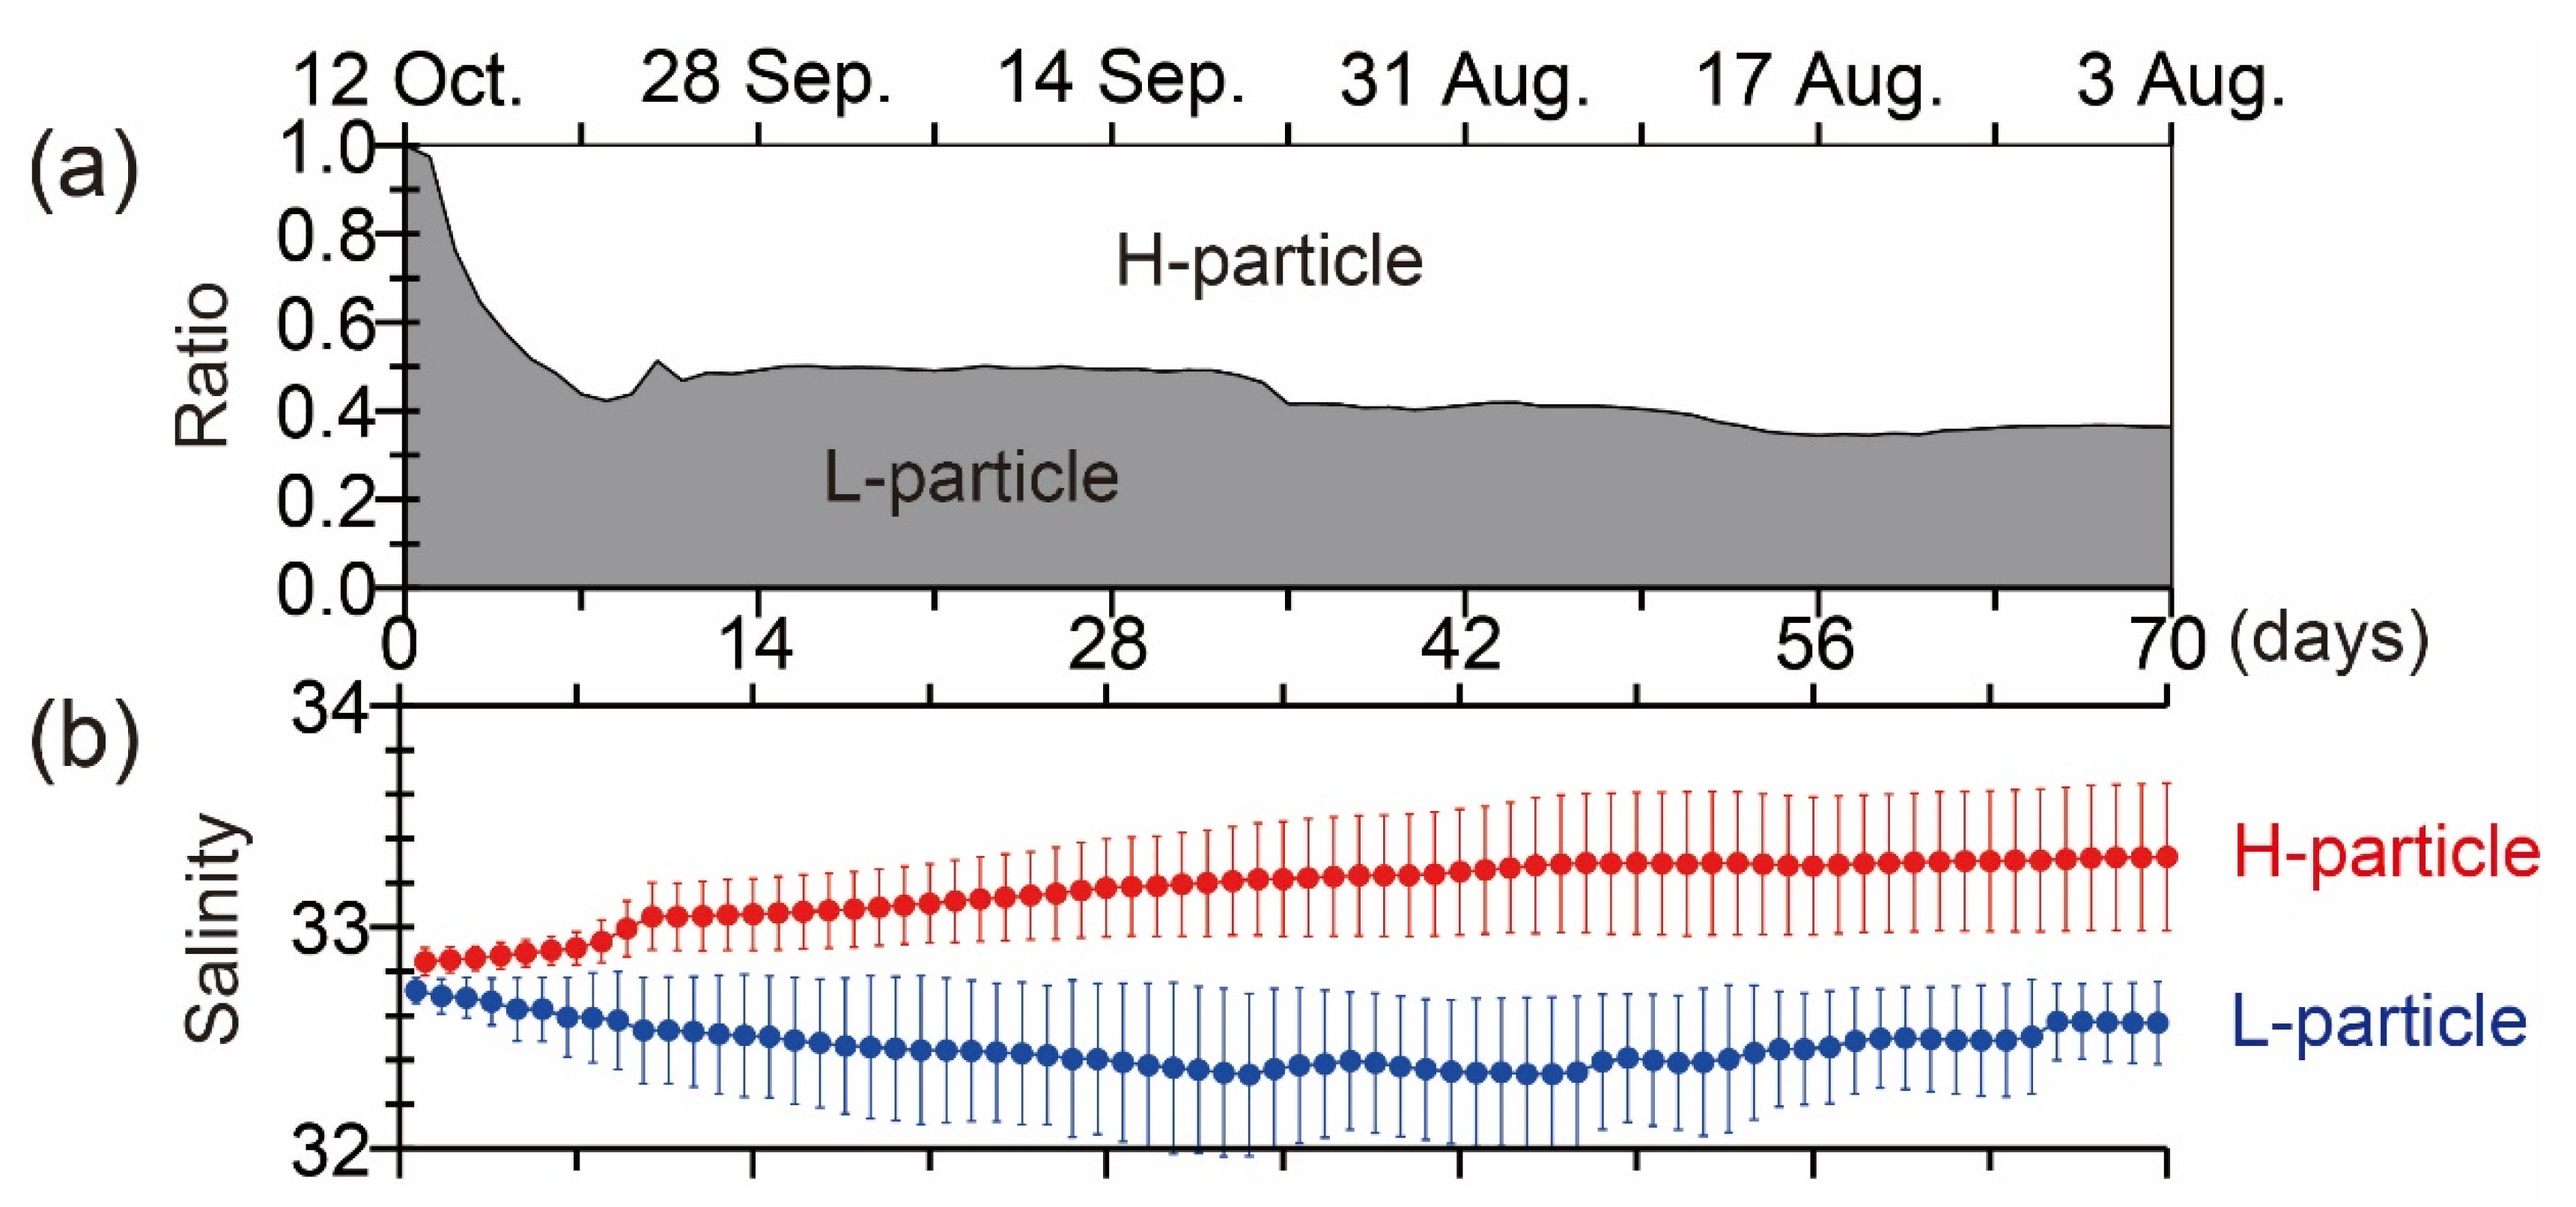
All of the particles were categorized as L-particles at the initial time, but the number of L-particles decreased rapidly during the backward tracking (Figure 12a). By day 7 of the backward simulation, the proportion of L-particles was about 50%. The proportion continued to decrease moderately, reaching about 40% at 70 days. The experienced salinity of L-particles reached a weak minimum at around 42 days (31 August) (Figure 12b), whereas more than 7 days before the initial time, the experienced salinities of H-particles continued to exceed 33.0; these high salinities were associated with subtropical waters around the study area.
H-particles were transported backward in time over a long distance along the main transport pathway of the Soya Warm Current water or its modified waters (Figure 11a–c). More concretely speaking, H-particles were tracked from the southeast corner of Shikotan Island back through the Kunashiri Strait to the shelf along the northeastern coast of Hokkaido in the Okhotsk Sea. In contrast, L-particles were transported back to the vicinity of the Four Islands (mainly south of Kunashiri and Etorofu islands) and were less widely distributed than H-particles (Figure 11d–f). Recall that in a climatologically normal September–October, the Soya Warm Current water is supplied from the Okhotsk Sea to the Pacific shelf as modified Soya Warm Current water. The particle-tracking results thus suggest that Soya Warm Current water was more strongly modified by mixing with ambient water during transport to the observation area on the Pacific shelf in 2016 than in normal years, such that in 2016 the TS properties of Soya Warm Current water had been completely lost by the time it reached the Pacific shelf.
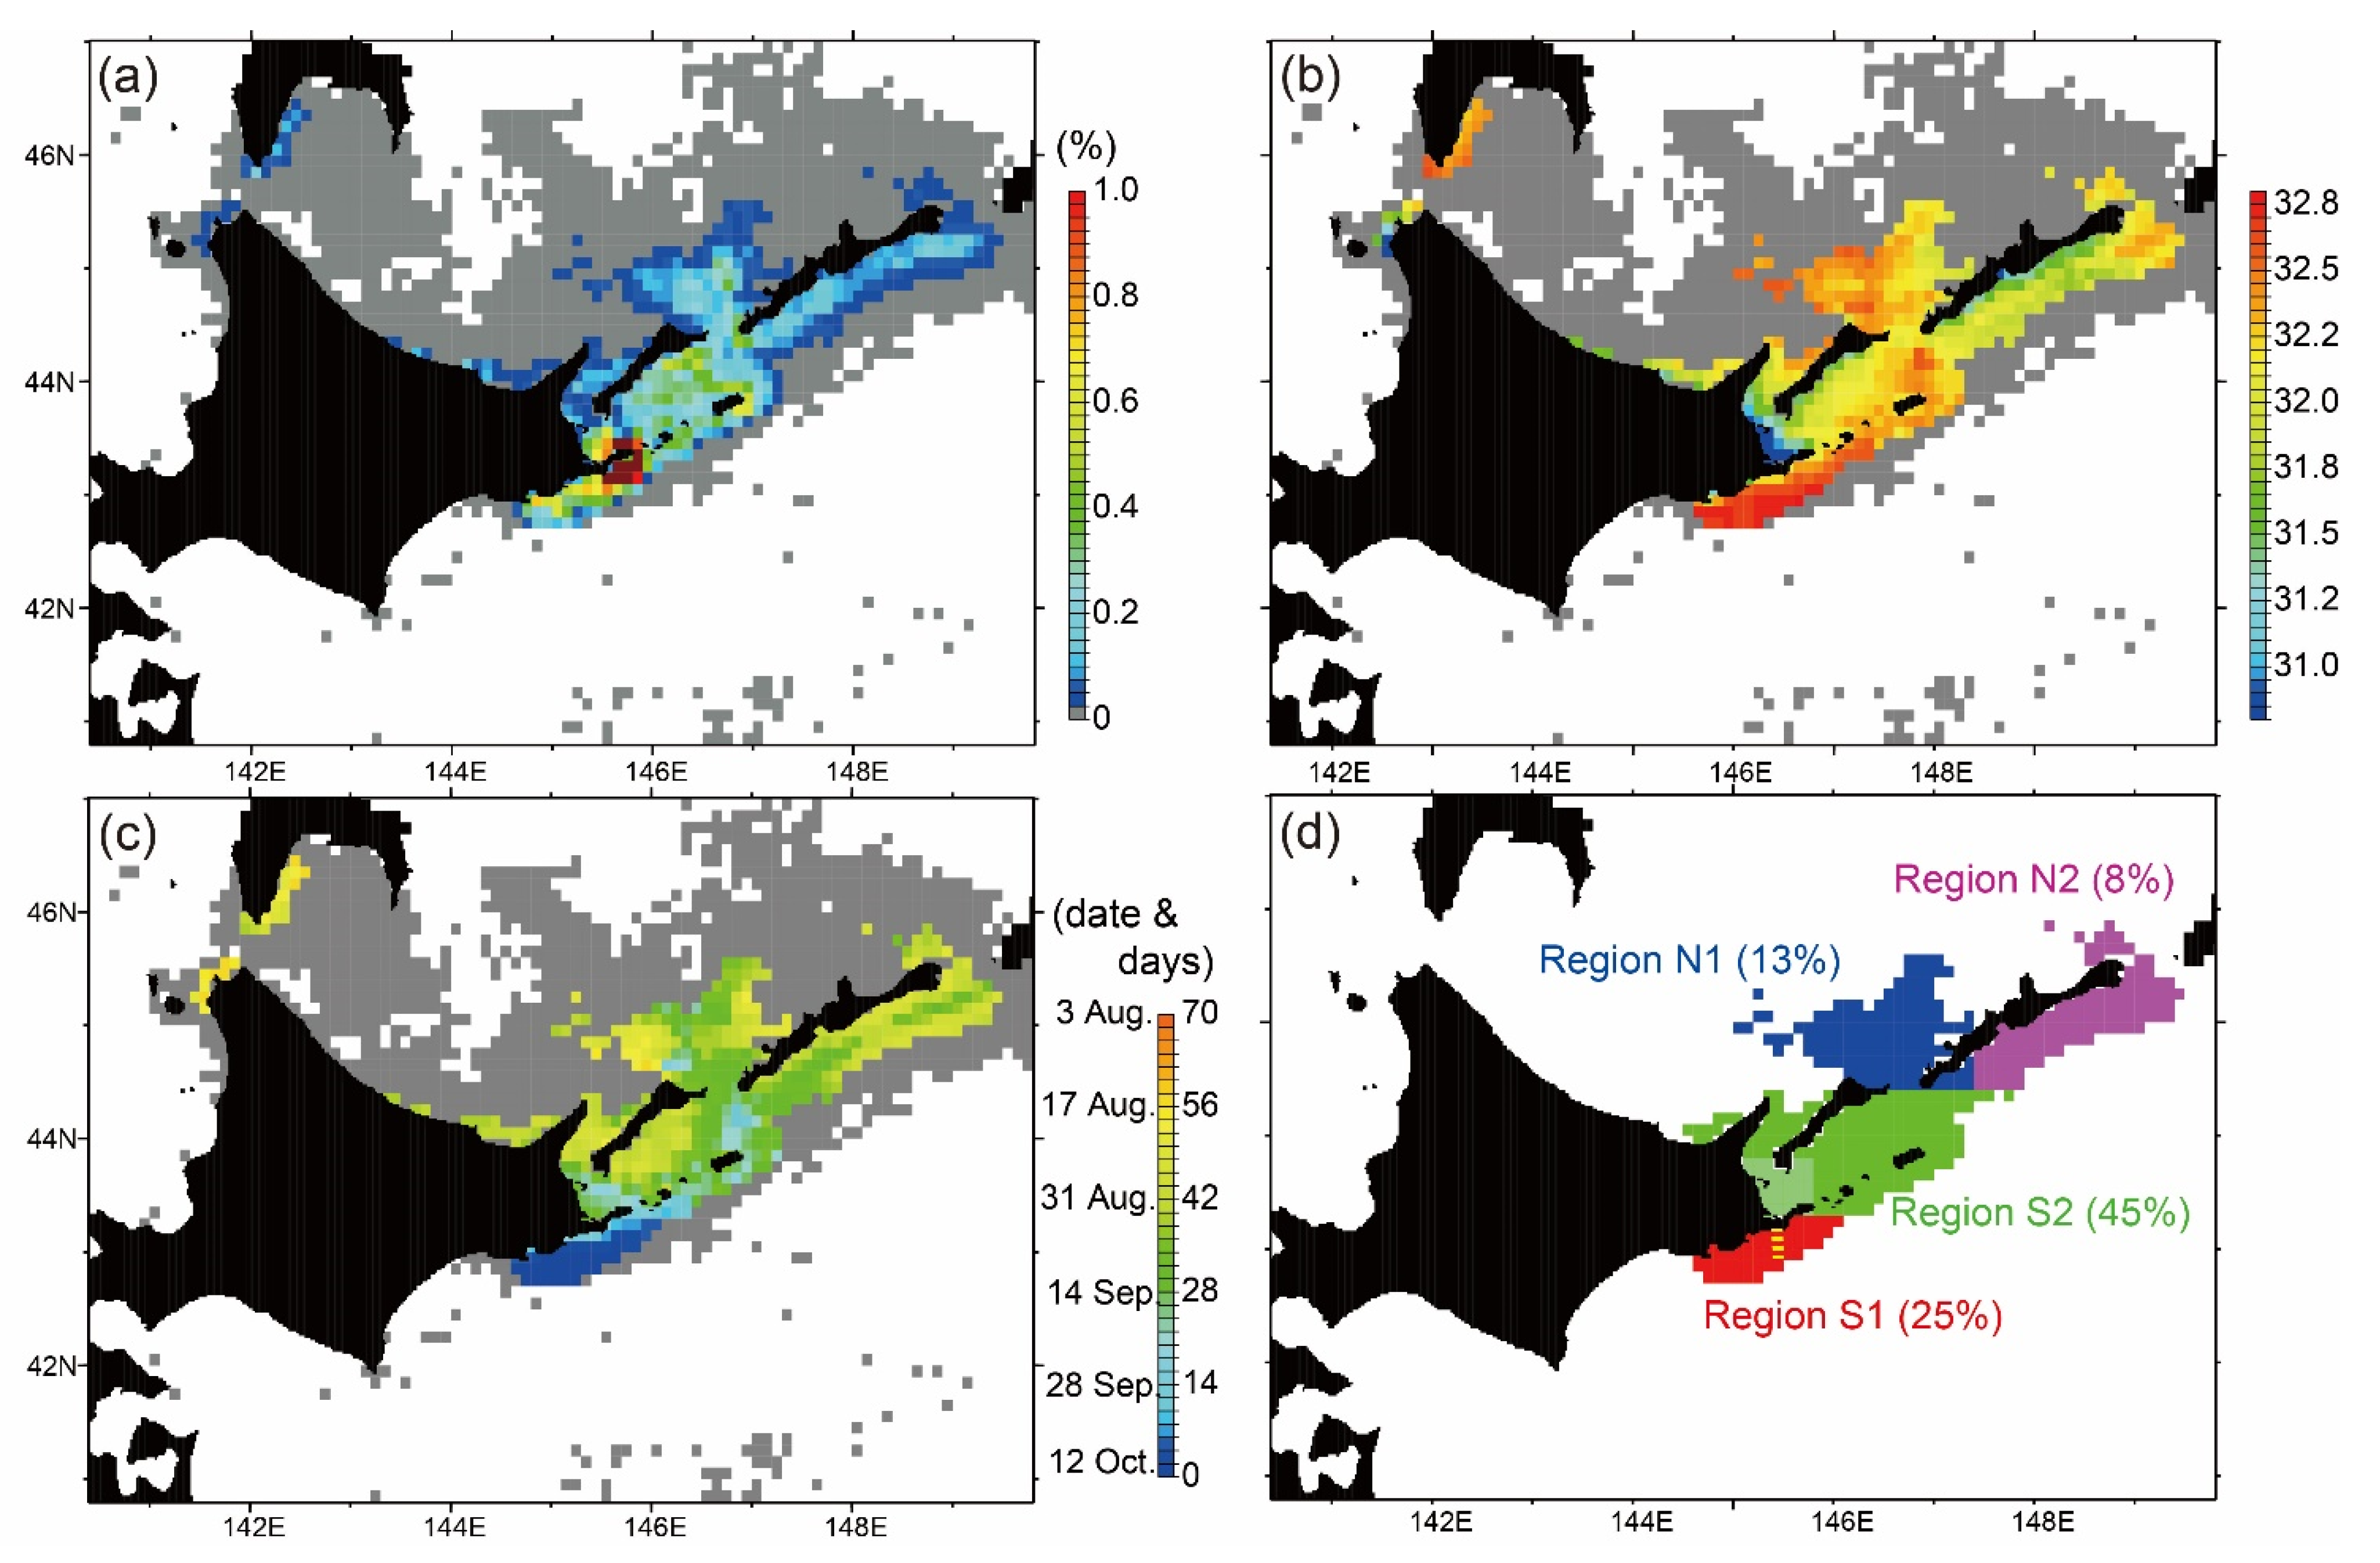
We further examined the source of the low-salinity water distributed on the Pacific shelf on 12 October 2016 by identifying areas of very fresh water. First, we assumed that the minimum salinity that each particle experienced during the 70-day tracking period corresponded to its source water. Particles experienced minimum salinities mainly in four regions: the Pacific shelf around the observation area, south of Kunashiri Island, around the Kunashiri Strait and in the Okhotsk Sea, and south of Etorofu Island (Figure 13a). These four shelf regions were designated S1, S2, N1, and N2, respectively (Figure 13d). A potential pathway of Soya Warm Current water is expected to go through regions N1, S2, and S1 (e.g., Figure 9c). Twenty-five percent of particles experienced minimum salinity in region S1, around the initial position of particles on the Pacific shelf. This result implies that water modification (e.g., vertical convection caused by sea surface cooling) occurred around the Pacific shelf even just before the observations on 12 October. The largest fraction (45%) of particles experienced minimum salinity in region S2, which roughly corresponds to the southern half of the area included in the Four Islands. This result suggests that the main source area of the low-salinity water observed on the Pacific shelf was the southern Four Islands region. In addition, 13% and 8% of particles experienced minimum salinity in region N1 and N2, respectively. The remaining particles (9%) experienced minimum salinity in scattered areas. The lowest salinity experienced by particles in region S1 was close to 32.8 (Figure 13b), and the lowest salinity experienced by particles decreased with distance from the initial position but was not spatially homogeneous; the lowest salinity experienced tended to be much smaller near the coasts of Hokkaido and Kunashiri and Etorofu islands. The elapsed time when the particles experienced the lowest salinity ranged from 7 to 55 days, except in region S1 (<7 days) (Figure 13c).
The frequency distribution of particles as a function of depth (Figure 14a) indicated that most particles experienced minimum salinity at depths of less than 20 m, and the depth at which particles experienced minimum salinity was closest to the sea surface in region S2 (i.e., the main source area). This result suggests that salinity fluxes across the sea surface such as those associated with the heaviest precipitation (Figure 3) were tightly linked to the observed supply of low-salinity source water to the Pacific shelf. The number of particles experiencing the minimum salinity in each region changed with tracked time (Figure 14b). In region S1, the decline was monotonic and drastic in the first 7 days. In region S2, more than 63% of the particles experienced minimum salinity in the 7–70 day interval. Hence, the age structure of source water supplied from region S2 to the Pacific shelf was very broad.
Figure 13. Properties of low-salinity source waters on the Pacific shelf on 12 October 2016. The source water of each particle was defined as the minimum salinity experienced by that particle during the tracking period. (a) Relative frequency, (b) salinity, and (c) occurrence time of source water. (d) The four source water regions, S1, S2, N1, and N2, defined on the basis of the relative frequencies shown in panel (a). The percentages indicate the regional contributions of source water to the Pacific shelf. The yellow dashed line indicates the across-shelf transect used in Figure 15.
Atmosphere 12 00888 g013

4. Discussion

First of all, recall that this study aimed to clarify how coastal shelf waters responded to the compound extreme storm–ocean eddy events (see Section 1). How, then, did the anticyclonic eddy that very closely approached the coast and stagnated around the slope affect oceanographic conditions on the coastal shelf in October 2016? On the one hand, the particle-tracking experiment results suggested that Kuroshio water derived from the anticyclonic eddy was less entrained into the low-salinity waters observed on the Pacific shelf in October 2016 than the modified Soya Warm Current water and therefore the eddy contributed little to their TS properties. On the other hand, the eddy influenced the distribution of water masses on the Pacific shelfbreak and slope. In fact, the distribution of Kuroshio water on the slope greatly changed the across-shelf features of TS from the climatology, and these changed features were dynamically linked to baroclinic jets along the shelfbreak (Figure 7). Moreover, the simulation results of the 1/50° model suggested that the along-slope intrusion of low-salinity water that appears climatologically near the sea surface on the slope (Figure 5) was blocked in October 2016 upstream of the observation area by the anticyclonic eddy and deflected southward along the eastern edge of the eddy (Figure 9c). In consequence, low-salinity Oyashio water was not supplied to the vicinity of the Pacific shelf in 2016.
It is unclear how long the observed hydrographic features would be maintained after our intensive measurements on 12 October 2016. The simulated along-shelf volume transport of low-salinity water (<32.8) on the Pacific shelf (Figure 15) indicated that dominant westward transports persisted from 10 August to 10 October 2016, although intermittent eastward transports were simulated, for instance, on 17 and 23 August. However, after 20 October, this volume transport vanished, mainly because the thick layer of simulated low-salinity water (<32.8) disappeared completely from the Pacific shelf at that time. The vanishing of the volume transport corresponded to an increase of sea surface salinity averaged over region S2 after late September (not shown), which was associated with a drawdown of the very fresh source waters from region S2 that were supplied primarily by heavy precipitation in August 2016.
The simulated salinity and velocity near the sea surface on 22 October 2016, just 10 days after the intensive survey, showed that less low-salinity water (<32.8) was distributed along L1–L5 except in small areas very close to the coast (Figure 16). Instead, high-salinity waters (≥32.8) derived from the Soya Warm Current were distributed continuously from the Okhotsk Sea to the Pacific shelf. As a result, as in the climatology, high-salinity water associated with the modified Soya Warm Current water occupied the Pacific shelf on 22 October. This simulated feature implies that our measurements on 12 October 2016 captured the final stage of the low-salinity water distribution on the Pacific shelf. Note, however, that hydrographic conditions on 22 October 2016 still differed from the climatological conditions, because the low-salinity water transported by the Oyashio was still blocked upstream of the observation site by the anticyclonic eddy, preventing it from being supplied to the observation area (Figure 16).

5. Conclusions and Remarks

Research on extreme weather and climate events and their relationships with anthropogenic climate change (i.e., ongoing global warming), especially as they affect coastal shelf waters, has frequently been spotlighted, particularly since the 2000s. Most often, a single extreme phenomenon and its effects on oceanographic conditions is examined. However, around the coastal Pacific area off southeastern Hokkaido, marine and weather extreme events occurred simultaneously in summer 2016. This study relied on limited data to clarify the impacts of these compound extreme events on hydrographic conditions in the coastal shelf waters and proposed a methodology for analyzing such very rare (i.e., extreme) events.
In a climatologically normal September–October, warm high-salinity (33.0–33.7) subtropical water from the Okhotsk Sea (i.e., modified Soya Warm Current water) is transported by the Coastal Oyashio and distributed near the sea surface on the Pacific shelf. In contrast, low-salinity water (<33.0) is frequently distributed near the sea surface on the slope along the Oyashio. These across-shelf salinity gradients weaken the baroclinic structure of the Coastal Oyashio. However, the across-shelf salinity gradients on the shelf and slope measured in October 2016 were opposite to those during a normal September–October. A thick layer of low-salinity water (<33.0), associated with heavy precipitation, occupied depths of 0–50 m on the shelf, whereas distinct salinity maxima (≥33.7), associated with subtropical Kuroshio water derived from an anticyclonic mesoscale eddy occurred at depths of 50–150 m on the slope. These across-shelf horizontal salinity gradients intensified baroclinic jets of the Coastal Oyashio along the shelfbreak. A 1/50° model generally reproduced these observed features, in particular the across-shelf salinity gradients, but it failed to reproduce the low-salinity bias near the sea surface, and it underestimated the maximum velocity of the Coastal Oyashio, which is related to temperatures below 50 m depth on the slope. The salinity bias, which arose from no modification of TS within the surface mixed layer (<200 m) by our spectral nudging, and the structure of subsurface temperatures might be modified by improving the data assimilation method.
To infer the source of the low-salinity water observed on the Pacific shelf, we virtually released massive numbers of particles in the low-salinity water on 12 October and tracked their trajectories and ambient environments backward in time for 70 days using outputs of the 1/50° ocean model. The particles that experienced low salinity (<32.8) were classified as L-particles, and those that experienced high salinity (≥32.8), were classified as H-particles. H-particles were transported backward in time over a long distance along the main transport pathway of Soya Warm Current and its modified waters. This result suggests that these subtropical waters were strongly modified by mixing with very fresh source water. In contrast, L-particles were transported mainly back to the region around the Four Islands, and were less widely distributed than H-particles.
The source of the low-salinity water distributed on the Pacific shelf on 12 October was defined as the minimum salinity experienced by each particle during the 70-day tracking period. The source waters were mainly derived from the southern region of the Four Islands (i.e., region S2), which accounted for 45% (63%) of source waters during 0–70 (7–70) days. The source waters were also all distributed near the sea surface, where salinity was greatly affected by heavy precipitation. We inferred that the source waters were transported from the vicinity of the Four Islands to the Pacific shelf while being modified by mixing with the ambient high-salinity water associated with the modified Soya Warm Current waters. Hence, one of the oceanographic extremes in 2016 was this peculiar process and degree of modification of Soya Warm Current water by the rare succession of heavy rainfall events.
Note that the above results represent nothing more than an estimate based on a snapshot obtained on 12 October 2016; the percentage of source waters will be changed if initial conditions of particle-tracking experiments are moved to another day. Moreover, the regional definition (i.e., regions S1, S2, N1, and N2) was somewhat subjective. Further clarification is therefore needed to determine when and where the water modification was activated, particularly around region S2. In addition to Lagrangian analysis, Eulerian analysis (e.g., heat and salinity budget) within region S2 will probably give a new perspective in future work.
Finally, it is worth noting that although in situ snapshot hydrographic observations are essential for oceanographic studies, they are necessarily limited spatio-temporally. Oceanographers in the past had to exercise their imaginations to infer missing observations by extrapolating into the past or future or in a new spatial direction. In many cases, there were questions such as “Where did the observed water masses come from?” or “When and how will observed features change in the near future?” To answer these questions, simulations with a realistic high-resolution ocean model and Lagrangian analyses based on particle tracking can be powerful tools for interpreting observed results and extrapolating missing observations, as demonstrated in this study, regardless of whether the study targets an extreme event. The numerical techniques used in this study may seem to be executable only by developers of ocean models, but in fact, these techniques are no longer special but can be readily applied to coastal shelf waters around the whole of Japan by any scientists. This is possible mainly because in November 2020 the Japan Meteorological Agency started operational nowcasting and forecasting of hydrographic conditions around Japan using the 1/50° ocean model coupled with a four-dimensional variational assimilation scheme and distributing the output [46,47]. Similar operational coastal ocean forecast systems have been developed around the world [48]. We expect the approach used in our study, in which analyses of in situ observations are combined with a realistic ocean simulation, will necessarily become more generalized and established as a standard method in the near future.

Author Contributions

The study was completed with cooperation among all the authors: Conceptualization, H.K. (Hiroshi Kuroda); methodology, H.K. (Hiroshi Kuroda) and T.S.; validation, T.N.; investigation, H.K. (Hiroshi Kuroda), Y.T. and H.K. (Hiromi Kasai); data curation, Y.T. and H.K. (Hiromi Kasai); writing—original draft preparation, H.K. (Hiroshi Kuroda); writing—review and editing, H.K. (Hiroshi Kuroda) and T.N.; visualization, H.K. (Hiroshi Kuroda) All authors have read and agreed to the published version of the manuscript.

Funding

This work was partly supported by Management Expenses Grants (no grant number) from the FRA and by the Ministry of Education, Culture, Sports, Science and Technology in Japan (KAKEN grant 19K06216).

Institutional Review Board Statement

Not applicable.

Informed Consent Statement

Not applicable.

Data Availability Statement

Current velocity data from AVISO and JODC were downloaded from web databases. SSTs by Himawari 8 were downloaded from P-tree System, which is operated by the Japan Aerospace Exploration Agency, Earth Observation Research Center. CTD data along the A-line are available at http://tnfri.fra.affrc.go.jp/seika/a-line/a-line_index.html (accessed on 17 July 2020). For hydrographic data obtained by intensive ship measurements in October 2016, please contact the corresponding author (H. Kuroda). Daily reanalysis data from FRA-ROMS are available at http://fm.dc.affrc.go.jp/fra-roms after user registration (accessed on 16 October 2018). The source code of the 1/50° model based on Rutgers University’s ROMS is available at https://www.myroms.org. All external forcings for the 1/50° model (NAO.99Jb, GPV/MSM, JRA55, and river discharge data) are also publicly available. The original LTRANS code was downloaded from https://northweb.hpl.umces.edu/LTRANS.htm (accessed on 4 September 2012).

Acknowledgments

We express our gratitude to the captain, officers, and crew of R/V Hokko-maru, as well as to collaborators who supported the in situ measurements. This work was supported by a pioneering collaboration study in Institute of Low Temperature Science, Hokkaido University. We also extend a special thanks to two anonymous reviewers for supportive and constructive comments.

Conflicts of Interest

The authors declare no conflict of interest.

Appendix A

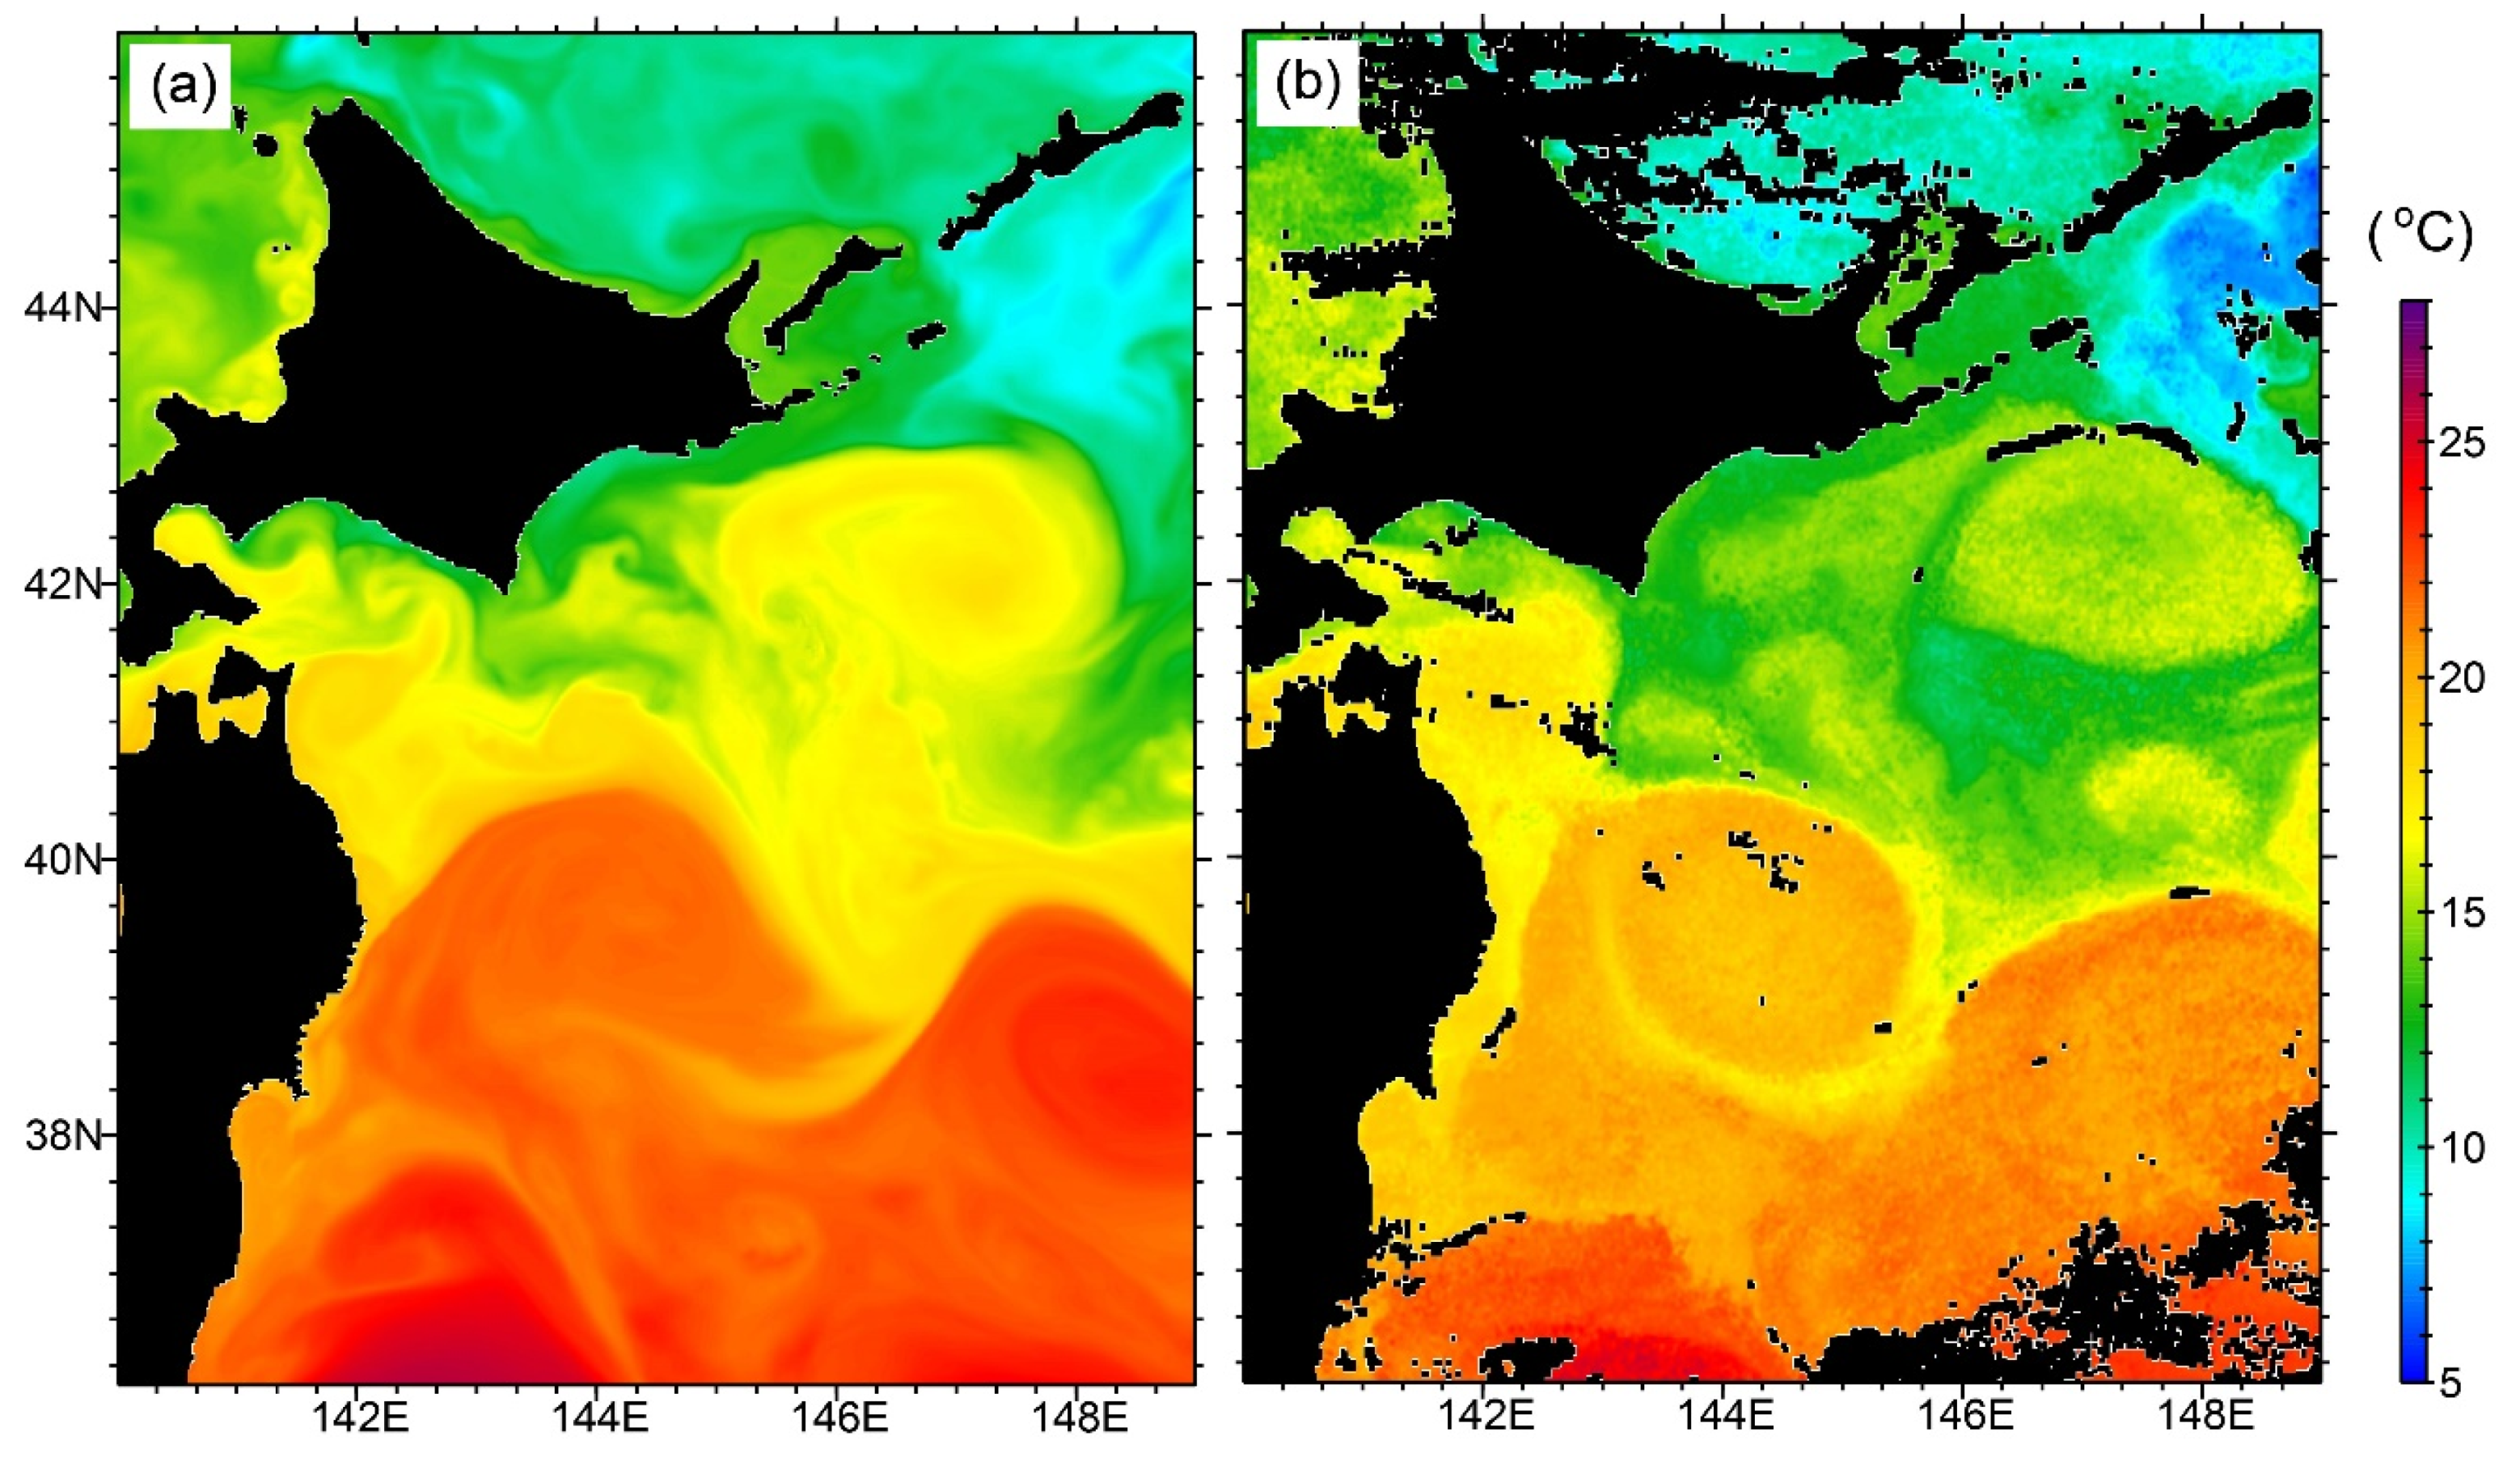
This appendix provides additional comparisons between observations and simulated results of the 1/50° ocean model. Although we have made many comparisons using historical oceanographic data, our focus here is limited to the model reproducibility around 12 October 2016. Himawari 8–derived SSTs were compared with simulated SSTs with a particular focus on the North Pacific (Figure A1). Overall features were well consistent, including the spatial positions of warm-water mesoscale eddies, cold-water intrusion by the Oyashio along the Four Islands, and thermal contrasts between cold nearshore and warm offshore waters around the study area. The Himawari 8–derived SSTs were a little noisy, but the simulated thermal frontal structures were smoother. Within the rectangular domain of 140.0–149.0° E and 36.2–46.0° N, correlation coefficient, mean difference (simulation minus observation), and root-mean-square difference between observation and simulation were estimated as 0.94, 1.17 °C, and 1.88 °C, respectively. Thus, the model showed an overall warm SST bias.
Temperature and salinity near the sea surface were compared between simulation and observation along the across-shelf transects L1–L7 off the southeastern coast of Hokkaido (Figure A2). Scatter plots of SST revealed that simulated SSTs were 0.5–2.5 °C colder than SSTs obtained by bucket sampling, although the spatial patterns were qualitatively consistent between them (Figure A2a; R2 = 0.62). Because simulated SSTs had warm bias over the wider model domain, the mean cold bias of −1.27 °C was a local bias peculiar to the study area. Scatter plots of salinity also indicated that spatial patterns of salinity were similar between observation and simulation, except along transect L7 (Figure A2b; R2 = 0.70), although simulated salinities showed a low-salinity bias. The low-salinity bias was larger when observed salinity was high (~33.5) than when it was low (~32.6). According to the regression results, an observed salinity of 33.0 corresponded to a simulated salinity of 32.8, which we used to represent the salinity front along the Pacific shelfbreak.
Remember that sea surface salinity within the surface mixed layer was not modified by spectral nudging applied in this study (Section 2.4.2). The salinity bias near the sea surface might be thus improved if more advanced data assimilation methods are introduced.
Figure A1. SSTs on 12 October 2016 (a) simulated by the 1/50° model and (b) derived from Himawari 8 (horizontal resolution 2 km).
Atmosphere 12 00888 g0a1
Figure A2. Scatter plots between (a) temperature and (b) salinity at the sea surface simulated by the 1/50° model and obtained by bucket sampling during 11–13 October. The blue line in each panel denotes the regression line. In (b), data points of salinity along L7 (red closed circles) deviated considerably from the observed values and were excluded from the regression line calculation.
Atmosphere 12 00888 g0a2
The large salinity errors along L7 in the simulation (Figure A2b) were attributed primarily to the fact that the 1/50° model frequently failed to simulate the spatial extent of river discharge water from the land, which was actually limited to a small area very close to the Hokkaido coast around L7 (Figure 6b). The simulated river discharge–related waters, however, spread more widely offshore over the nearshore shelf around L7, causing there to be a low-salinity bias near the coast along L7 (Figure 9a). In fact, the width of river mouths in Hokkaido is generally much less than 2 km (the model grid size), and river and sea waters rapidly become intricately mixed through ocean processes near the river mouth. For accurate simulation of nearshore salinities near river mouths, such processes need to be appropriately parameterized as sub-grid mixing processes in the model [49,50]. In the future, our model should be improved by including such parameterization.

References

  1. Seneviratne, S.I.; Nicholls, N.; Easterling, D.; Goodess, C.M.; Kanae, S.; Kossin, J.; Luo, Y.; Marengo, J.; McInnes, K.; Rahimi, M.; et al. Changes in Climate Extremes and their Impacts on the Natural Physical Environment. In Managing the Risks of Extreme Events and Disasters to Advance Climate Change Adaptation, 1st ed.; Field, C.B., Barros, V., Stocker, T.F., Qin, D., Dokken, D.J., Ebi, K.L., Mastrandrea, M.D., Mach, K.J., Plattner, G.-K., Allen, S.K., et al., Eds.; Cambridge University Press: Cambridge, UK, 2012; A Special Report of Working Groups I and II of the Intergovernmental Panel on Climate Change (IPCC); pp. 109–230. Available online: https://www.ipcc.ch/site/assets/uploads/2018/03/SREX-Chap3_FINAL-1.pdf (accessed on 6 July 2020).
  2. Fischer, E.M.; Knutti, R. Anthropogenic contribution to global occurrence of heavy-precipitation and high-temperature extremes. Nat. Clim. Chang. 2015, 5, 560–564. [Google Scholar] [CrossRef]
  3. Easterling, D.R.; Kunkel, K.E.; Wehner, M.F.; Sun, L. Detection and attribution of climate extremes in the observed record. Weather Clim. Extrem. 2016, 11, 17–27. [Google Scholar] [CrossRef] [Green Version]
  4. Mitchell, J.F.B.; Lowe, J.; Wood, R.A.; Vellinga, M. Extreme events due to human-induced climate change. Phil. Trans. R. Soc. A 2006, 364, 2117–2133. [Google Scholar] [CrossRef] [PubMed]
  5. World Meteorological Organization. The Global Climate 2001–2010: A Decade of Climate Extremes; Series No.1103; WMO: Geneva, Switzerland, 2013; pp. 1–110. [Google Scholar]
  6. Kuroda, H.; Suyama, S.; Miyamoto, H.; Nakanowatari, T.; Setou, T. Interdecadal variability of the Western Subarctic Gyre in the North Pacific Ocean. Deep-Sea Res. Part I 2021, 169, 103461. [Google Scholar] [CrossRef]
  7. Kuroda, H.; Wagawa, T.; Kakehi, S.; Shimizu, Y.; Kusaka, A.; Okunishi, T.; Hasegawa, D.; Ito, S. Long-term mean and seasonal variation of altimetry-derived Oyashio transport across the A-line off the southeastern coast of Hokkaido, Japan. Deep-Sea Res. Part I 2017, 121, 95–109. [Google Scholar] [CrossRef]
  8. Kuroda, H.; Wagawa, T.; Shimizu, Y.; Ito, S.; Kakehi, S.; Okunishi, T.; Ohno, S.; Kusaka, A. Interdecadal decrease of the Oyashio transport on the continental slope off the southeastern coast of Hokkaido, Japan. J. Geophys. Res. 2015, 120, 2504–2522. [Google Scholar] [CrossRef]
  9. Kuroda, H.; Yokouchi, K. Interdecadal decrease in potential fishing areas for Pacific saury off the southeastern coast of Hokkaido, Japan. Fish. Oceanogr. 2017, 26, 439–454. [Google Scholar] [CrossRef]
  10. Miyama, T.; Minobe, S.; Goto, H. Marine heatwave of sea surface temperature of the Oyashio region in summer in 2010–2016. Front. Mar. Sci. 2021, 7, 576240. [Google Scholar] [CrossRef]
  11. Takizawa, T. Characteristics of the Soya Warm Current in the Okhotsk Sea. J. Oceanogr. Soc. Jpn. 1982, 38, 281–292. [Google Scholar] [CrossRef]
  12. Uchimoto, K.; Mitsudera, H.; Ebuchi, N.; Miyazawa, Y. Anticyclonic eddy caused by the Soya Warm Current in an Okhotsk OGCM. J. Oceanogr. 2007, 63, 379–391. [Google Scholar] [CrossRef]
  13. Oguma, S.; Ono, T.; Kusaka, A.; Kasai, H.; Kawasaki, Y.; Azumaya, T. Isotopic tracers for water masses in the coastal region of eastern Hokkaido. J. Oceanogr. 2008, 64, 525–539. [Google Scholar] [CrossRef]
  14. Kusaka, A.; Azumaya, T.; Kawasaki, Y. Monthly variations of hydrographic structures and water mass distribution off the Doto area, Japan. J. Oceanogr. 2013, 69, 295–312. [Google Scholar] [CrossRef]
  15. Rosa, A.L.; Isoda, Y.; Uehara, K.; Aiki, T. Seasonal variations of water system distribution and flow patterns in the southern sea area of Hokkaido, Japan. J. Oceanogr. 2007, 63, 573–588. [Google Scholar] [CrossRef]
  16. Kusaka, A.; Shimizu, Y.; Sato, T.; Yoshida, J. Temporal variations in the current structure and volume transport of the Coastal Oyashio revealed by direct current measurement. J. Oceanogr. 2016, 72, 601–615. [Google Scholar] [CrossRef]
  17. Nakamura, T.; Awaji, T.; Hatayama, T.; Akitomo, K. Tidal exchange through the Kuril Straits. J. Phys. Oceanogr. 2000, 30, 1622–1644. [Google Scholar] [CrossRef]
  18. Nakamura, T.; Awaji, T. Tidally induced diapycnal mixing in the Kuril Straits and its role in water transformation and transport: A three-dimensional nonhydrostatic model experiment. J. Geophys. Res. 2004, 109, C09S07. [Google Scholar] [CrossRef]
  19. Shevchenko, G.; Kantakov, G.; Chastikov, V. Current mooring observations in the area of the South Kuril Islands. PICES Sci. Rep. 2009, 36, 128–133. [Google Scholar]
  20. Kuroda, H.; Toya, Y. High-resolution sea surface temperatures derived from Landsat 8: A study of submesoscale frontal structures on the Pacific shelf off the Hokkaido coast, Japan. Rem. Sens. 2020, 12, 3326. [Google Scholar] [CrossRef]
  21. SSALTO/DUACS. User Handbook: (M)SLA and (M)ADT Near-Real Time and Delayed Time Products; CLS-DOS-NT-06-034 Nomenclature: SALP-MU-P-EA-21065-CLS Issue: 5rev 0; AVISO: Ramonville-Saint-Agne, France, 2016; pp. 1–29. [Google Scholar]
  22. Kuroda, H.; Setou, T.; Kakehi, S.; Ito, S.; Taneda, T.; Azumaya, T.; Inagake, D.; Hiroe, Y.; Morinaga, K.; Okazaki, M.; et al. Recent advances in Japanese fisheries science in the Kuroshio-Oyashio region through development of the FRA-ROMS ocean forecast system: Overview of the reproducibility of reanalysis products. Open J. Mar. Sci. 2017, 7, 62–90. [Google Scholar] [CrossRef] [Green Version]
  23. Shchepetkin, A.F.; McWilliams, J.C. A method for computing horizontal pressure-gradient force in an oceanic model with a nonaligned vertical coordinate. J. Geophys. Res. 2003, 108, 3090. [Google Scholar] [CrossRef]
  24. Shchepetkin, A.F.; McWilliams, J.C. The regional oceanic modeling system (ROMS): A split-explicit, free-surface, topography-following-coordinate oceanic model. Ocean Modell. 2005, 9, 347–404. [Google Scholar] [CrossRef]
  25. Haidvogel, D.B.; Arango, H.; Budgell, W.P.; Cornuelle, B.D.; Curchitser, E.; Di Lorenzo, E.; Fennel, K.; Geyer, W.R.; Hermann, A.J.; Lanerolle, L.; et al. Ocean forecasting in terrain-following coordinates: Formulation and skill assessment of the Regional Ocean Modeling System. J. Comput. Phys. 2008, 227, 3595–3624. [Google Scholar] [CrossRef]
  26. Hobday, A.J.; Oliver, E.C.J.; Sen Gupta, A.; Benthuysen, J.A.; Burrows, M.T.; Donat, M.G.; Holbrook, N.J.; Moore, P.J.; Thomsen, M.S. Categorizing and naming marine heatwaves. Oceanography 2018, 31, 162–173. [Google Scholar] [CrossRef] [Green Version]
  27. Kuroda, H.; Tanaka, T.; Ito, S.; Setou, T. Numerical study of diurnal tidal currents on the Pacific shelf off the southern coast of Hokkaido, Japan. Cont. Shelf Res. 2018, 158, 45–56. [Google Scholar] [CrossRef]
  28. Kobayashi, S.; Ota, Y.; Harada, Y.; Ebita, A.; Moriya, M.; Onoda, H.; Onogi, K.; Kamahori, H.; Kobayashi, C.; Endo, H.; et al. The JRA-55 reanalysis: General specifications and basic characteristics. J. Meteor. Soc. Jpn. 2015, 93, 5–48. [Google Scholar] [CrossRef] [Green Version]
  29. Saito, K.; Fujita, T.; Yamada, Y.; Ishida, J.; Kumagai, Y.; Aranami, K.; Ohmori, S.; Nagasawa, R.; Kumagai, S.; Muroi, C.; et al. The operational JMA nonhydrostatic mesoscale model. Mon. Wea. Rev. 2006, 134, 1266–1298. [Google Scholar] [CrossRef]
  30. Kuroda, H.; Takasuka, A.; Hirota, Y.; Kodama, T.; Ichikawa, T.; Takahashi, D.; Aoki, K.; Setou, T. Numerical experiments based on a coupled physical-biochemical ocean model to study the Kuroshio-induced nutrient supply on the shelf-slope region off the southwestern coast of Japan. J. Mar. Sys. 2018, 179, 38–54. [Google Scholar] [CrossRef]
  31. Matsumoto, K.; Takanezawa, T.; Ooe, M. Ocean tide models developed by assimilating TOPEX/POSEIDON altimeter data into hydrodynamical model: A global model and a regional model around Japan. J. Oceanogr. 2000, 56, 567–581. [Google Scholar] [CrossRef]
  32. Waldron, K.M.; Paegle, J.; Horel, J.D. Sensitivity of a spectrally filtered and nudged limited-area model to outer model options. Mon. Weather Rev. 1996, 124, 529–547. [Google Scholar] [CrossRef] [Green Version]
  33. von Storch, H.; Langenberg, H.; Feser, F. A spectral nudging technique for dynamical downscaling purposes. Mon. Weather Rev. 2000, 128, 3664–3673. [Google Scholar] [CrossRef]
  34. Radu, R.; Déqué, M.; Somot, S. Spectral nudging in a spectral regional climate model. Tellus 2008, 60, 898–910. [Google Scholar] [CrossRef]
  35. Omrani, H.; Drobinski, P.; Dubos, T. Spectral nudging in regional climate modelling: How strongly should we nudge? Q. J. R. Meteor. Soc. 2012, 138, 1808–1813. [Google Scholar] [CrossRef] [Green Version]
  36. Xu, Z.; Yang, Z.-L. A new dynamical downscaling approach with GCM bias corrections and spectral nudging. J. Geophys. Res. Atmos. 2015, 120, 3063–3084. [Google Scholar] [CrossRef]
  37. Bloom, S.C.; Takacs, L.L.; da Silva, A.M.; Ledvina, D. Data assimilation using incremental analysis updates. Mon. Weather Rev. 1996, 124, 1256–1271. [Google Scholar] [CrossRef] [Green Version]
  38. North, E.W.; Schlag, Z.; Hood, R.R.; Li, M.; Zhong, L.; Gross, T.; Kennedy, V.S. Vertical swimming behavior influences the dispersal of simulated oyster larvae in a coupled particle-tracking and hydrodynamic model of Chesapeake Bay. Mar. Ecol. Prog. Ser. 2008, 359, 99–115. [Google Scholar] [CrossRef]
  39. Kuroda, H.; Takahashi, D.; Mitsudera, H.; Azumaya, T.; Setou, T. A preliminary study to understand the transport process of the eggs and larvae of Japanese Pacific walleye pollock Theragra chalcogramma using particle-tracking experiments based on a high-resolution ocean model. Fish. Sci. 2014, 80, 127–138. [Google Scholar] [CrossRef]
  40. Sildever, S.; Jerney, J.; Kremp, A.; Oikawa, H.; Sakamoto, S.; Yamaguchi, M.; Baba, K.; Mori, A.; Fukui, T.; Nonomura, T.; et al. Genetic relatedness of a new Japanese isolates of Alexandrium ostenfeldii bloom population with global isolates. Harm. Algae 2019, 84, 64–74. [Google Scholar] [CrossRef]
  41. Visser, W.A. Using random walk models to simulate the vertical distribution of particles in a turbulent water column. Mar. Ecol. Prog. Ser. 1997, 158, 275–281. [Google Scholar] [CrossRef] [Green Version]
  42. Isobe, A.; Kako, S.; Chang, P.; Matsuno, T. Two-way particle-tracking model for specifying sources of drifting objects: Application to the East China Sea shelf. J. Atmos. Ocean. Tech. 2009, 26, 1672–1682. [Google Scholar] [CrossRef]
  43. Statistics of the Number of Tropical Storms that Approached Hokkaido during 1951–2019 by the Japan Meteorological Agency. Available online: https://www.data.jma.go.jp/fcd/yoho/typhoon/statistics/accession/hokkaido.html (accessed on 6 February 2021). (In Japanese).
  44. Kitano, Y.; Yamamoto, T.; Kobayashi, A.; Yamada, T. Statistical analysis of typhoon related events in Hokkaido and surroundings in the last 56 years including the 2016 heavy rainfall. J. Jpn. Soc. Civ. Eng. Ser. B1 (Hyd. Eng.) 2017, 73, I_1231–I_1236, (In Japanese with English Abstract). [Google Scholar] [CrossRef]
  45. Nayak, S.; Takemi, T. Typhoon induced precipitation characterization over northern Japan: A case study for typhoons in 2016. Prog. Earth Planet. Sci. 2020, 7, 39. [Google Scholar] [CrossRef]
  46. Hirose, N.; Usui, N.; Sakamoto, K.; Tsujino, H.; Yamanaka, G.; Nakano, H.; Urakawa, S.; Toyoda, T.; Fujii, Y.; Kohno, N. Development of a new operational system for monitoring and forecasting coastal and open-ocean states around Japan. Ocean Dyn. 2019, 69, 1333–1357. [Google Scholar] [CrossRef]
  47. Sakamoto, K.; Tsujino, H.; Nakano, H.; Urakawa, S.; Toyoda, T.; Hirose, N.; Usui, N.; Yamanaka, G. Development of a 2-km resolution ocean model covering the coastal seas around Japan for operational application. Ocean Dyn. 2019, 69, 1181–1202. [Google Scholar] [CrossRef]
  48. Kourafalou, V.H.; De Mey, P.; Le Hénaff, M.; Charria, G.; Edwards, C.A.; He, R.; Herzfeld, M.; Pascual, A.; Stanev, E.V.; Tintoré, J.; et al. Coastal Ocean Forecasting: System integration and evaluation. J. Oper. Oceanogr. 2015, 8, s127–s146. [Google Scholar] [CrossRef] [Green Version]
  49. Hetland, R.D. Relating river plume structure to vertical mixing. J. Phys. Oceanogr. 2005, 35, 1667–1688. [Google Scholar] [CrossRef]
  50. Hetland, R.D. The effects of mixing and spreading on density in near-field river plumes. Dyn. Atmos. Oceans 2010, 49, 37–53. [Google Scholar] [CrossRef]
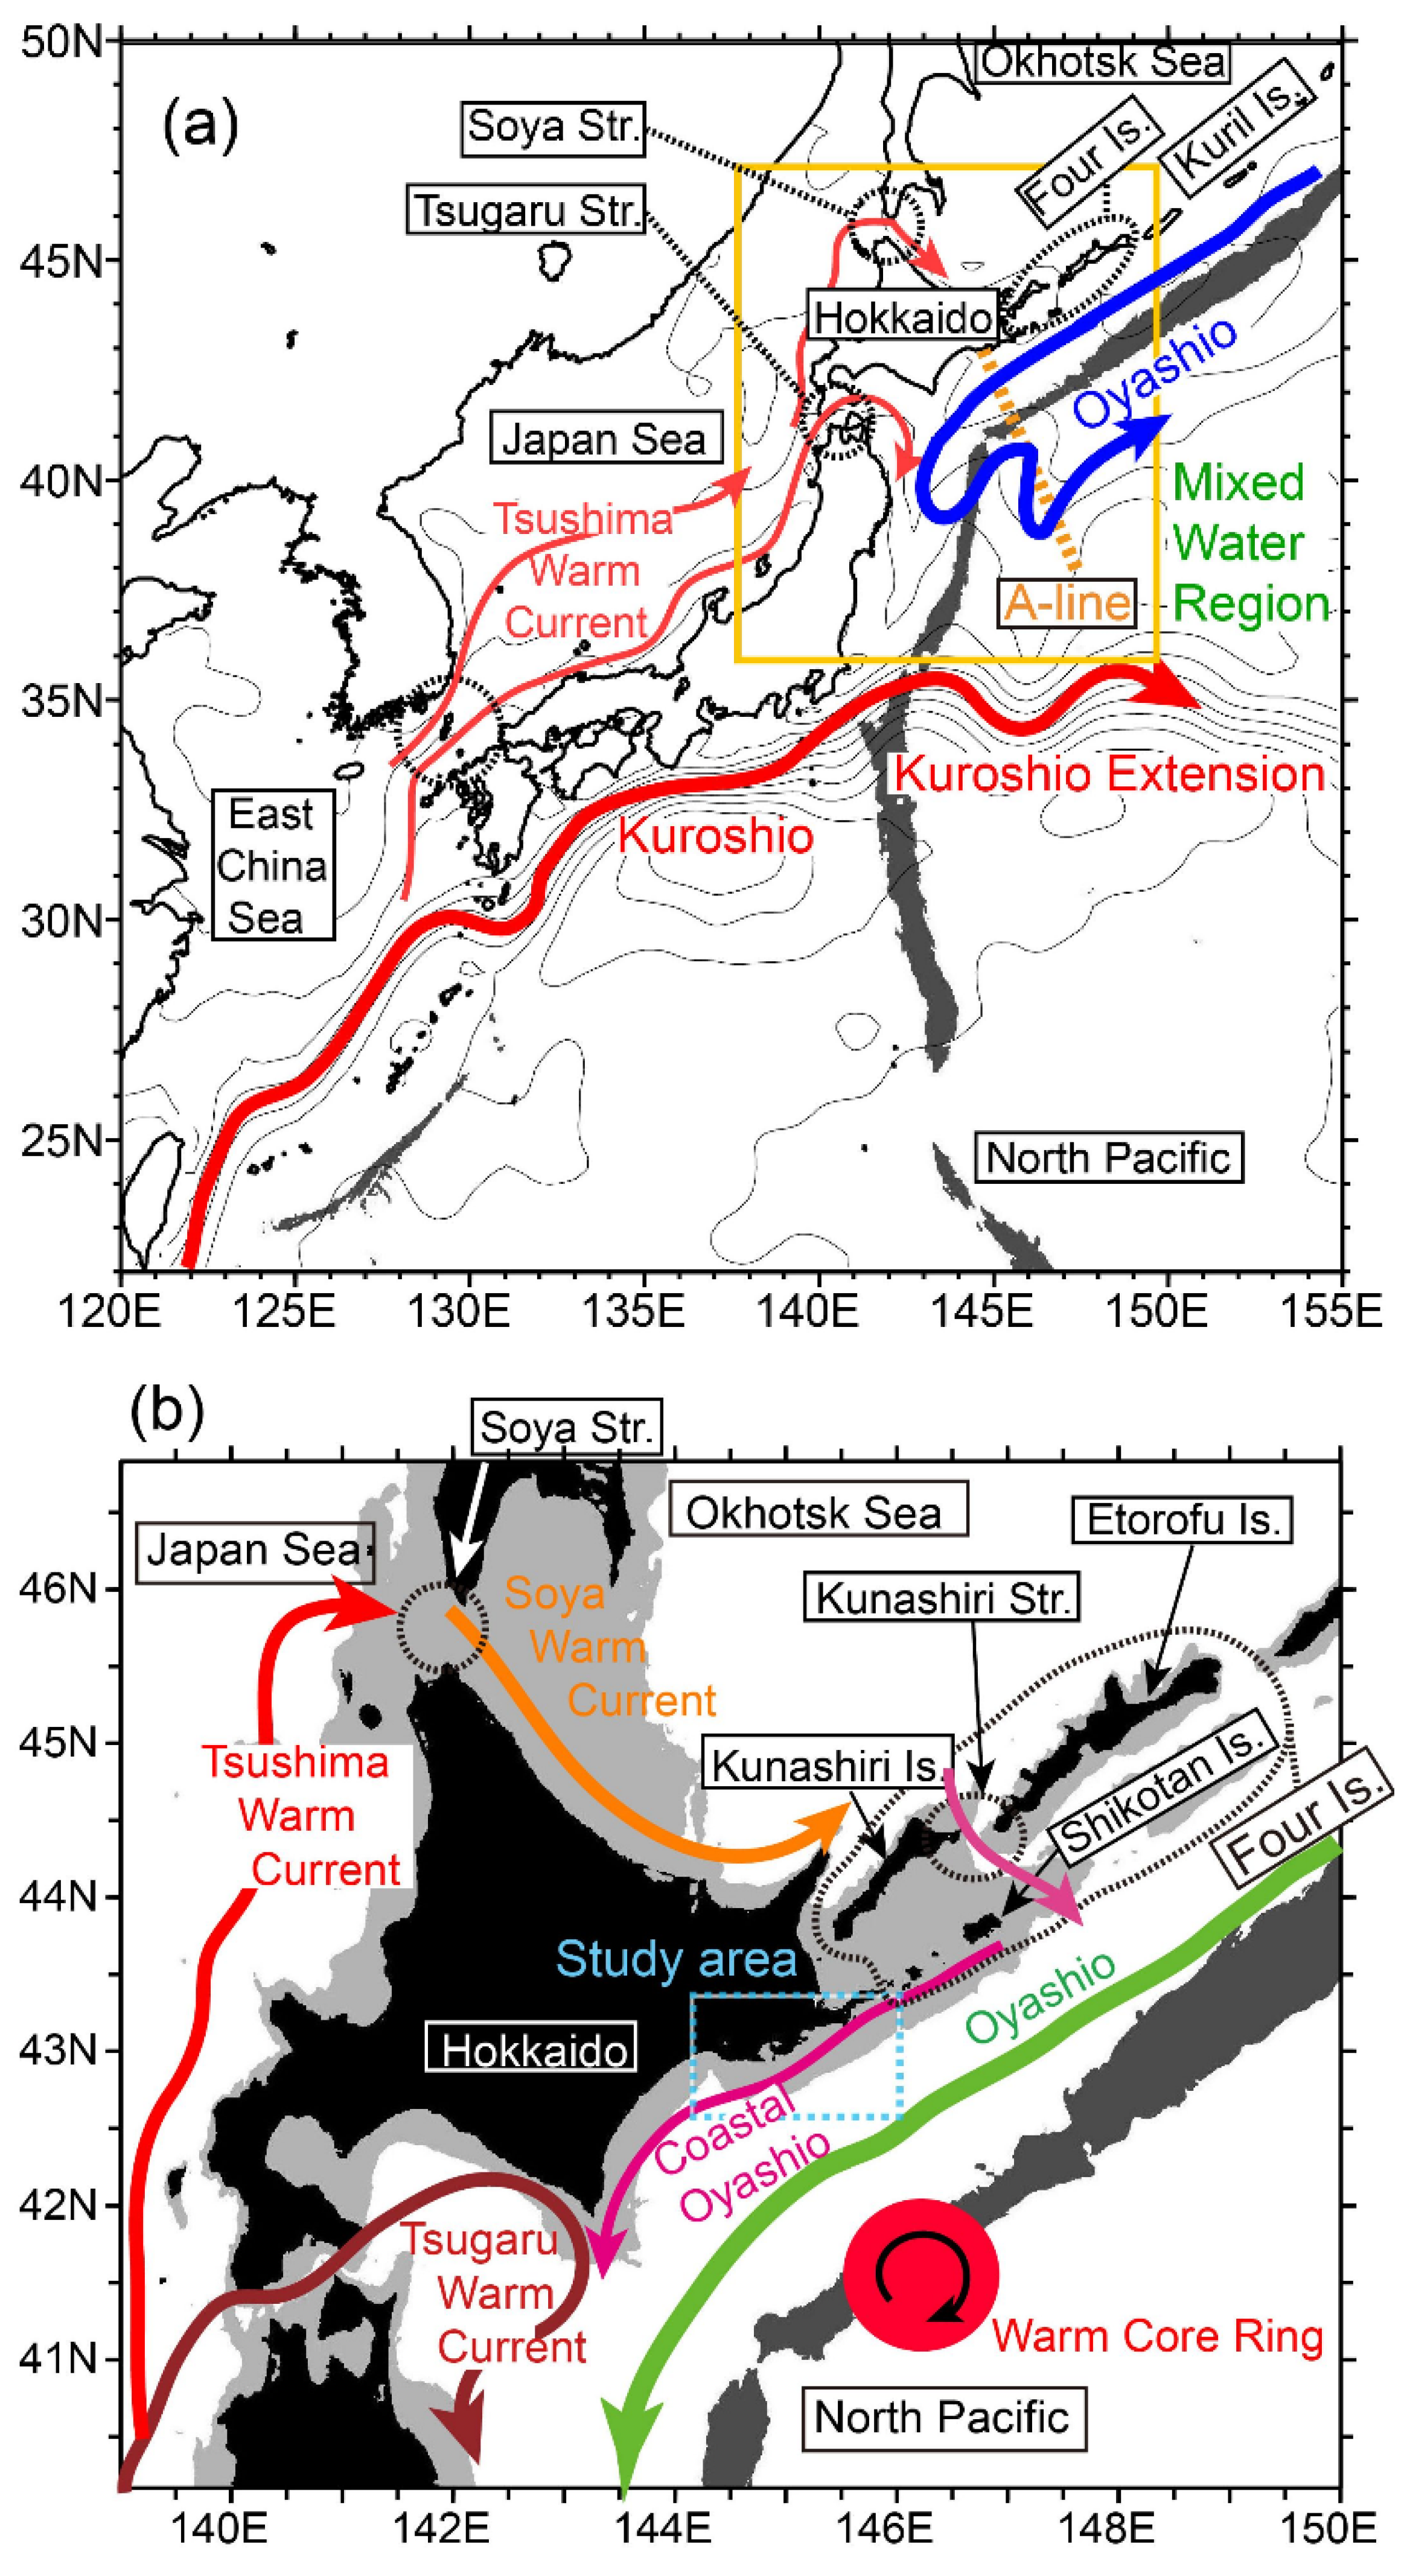
Figure 1. (a) Schematic view of surface ocean currents (arrows) around Japan. Geographic names are enclosed in rectangles. Contour lines (interval, 10 cm) indicate the 20-year mean absolute dynamic topography during 1993–2012. Water depths ≥ 6500 m (i.e., trenches) are shown by dark gray shading. The bold dashed orange line shows the location of the A-line, and the yellow box encloses the domain of the 1/50° ocean model. (b) Same as panel (a), but for the area around Hokkaido during summer-autumn. Continental shelves where the water depth is <200 m are shown by light gray shading. The blue dashed line rectangle indicates the main target area of this study.
Atmosphere 12 00888 g001
Figure 2. (a) Observation stations around the study area in October 2016. The blue squares indicate conductivity temperature-depth (CTD) stations along the A-line north of station A05. R/V Hokko-maru started to move northward from the southeastern corner of the panel on 11 October at 13:00 (UTC). The ship track is denoted by the dark red line. CTD measurements and water sampling by bucket were carried out at stations (black circles) on the shelf slope, mainly along L1, L3, L5, and L7. (b) CTD data collected along the A-line and analyzed in this study. Small closed (large open) circles denote data collected in October (September).
Atmosphere 12 00888 g002
Figure 3. (a) Storm tracks in August 2016, digitized from Kitano et al. (2017). Closed circles (double open circles) indicate where a storm transitioned to an extratropical cyclone (an extratropical cyclone transitioned to a storm). (b) Precipitation anomalies in August 2016 relative to the decadal monthly mean (2007–2019). Thin (thick) black contours denote an anomaly 3 times (5 times) the decadal mean. (c) Monthly precipitation at Kushiro (star in panels (a,b)) in August.
Atmosphere 12 00888 g003
Figure 4. Temperature anomalies at 50 m depth in 2016, based on daily reanalysis data from FRA-ROMS and categorized according to the marine heat wave index: (a) 15 June, (b) 15 July, (c) 15 August, (d) 15 September, and (e) 15 October (expanded view). A marine heat wave was categorized based on its intensity, after Hobday et al. [26]. Intensity categories were defined based on the difference Tdiff between the 25-year average (Tavg) and 90th percentile values for each grid. If the 50-m temperature for a day was ≥(Tavg + N × Tdiff) and <(Tavg + (N + 1) × Tdiff), it was categorized as being Category N.
Atmosphere 12 00888 g004
Figure 5. (a) Climatological mean current velocity near the sea surface. The velocity vectors, denoted by a stick with an open (closed) circle, were derived from acoustic Doppler current profiler and geomagnetic electrokinetograph data (maps of absolute dynamic topography) for September–October. Isolines indicate climatological salinities at the sea surface in October, from [14]. Vertical sections of long-term mean (b) temperature, (c) salinity, and (d) density in September–October along the A-line north of station A05. Gray shading in (a) and (c) emphasizes low-salinity water (<33.0).
Atmosphere 12 00888 g005
Figure 6. (a) Sea surface temperatures (SSTs) derived from Himawari 8. The magenta line indicates the ship track. (b) Salinometer-based sea surface salinity and ADCP velocity at 18 m depth. Red and black sticks indicate the bottom-tracked velocity on the shelf and the GPS-tracked velocity on the slope, respectively. (c) Same as (b), but for the CTD-based layer thickness of low-salinity waters (<33.0) outcropping at the sea surface.
Atmosphere 12 00888 g006
Figure 7. Vertical section along L5 of (a) temperature, (b) salinity, (c) density, and (d) ADCP velocity on 12 October 2016. Color shade in (d) means the absolute value of velocity. Vertical dashed line represents the approximate position of an across-shelf salinity front.
Atmosphere 12 00888 g007
Figure 8. (a) Thickness of low-salinity water (<33.0) in September–October at station A01 on the shelf. (b) Difference in thickness between stations A01 and A02. A positive (negative) difference indicates a coastal-trapped (slope-trapped) structure.
Atmosphere 12 00888 g008
Figure 9. Maps of (a) salinity at the sea surface and (b) thickness of low-salinity (<32.8) water outcropping at the sea surface with current vectors at 18 m depth on 12 October 2016, simulated by the 1/50° model. Daily mean current velocity along the research vessel track is depicted by red sticks. In (a), the 32.8 isohaline is emphasized by the white contour. Panel (c) is the same as panel (a), but for a wider area. Approximate flow patterns of the Soya Warm Current and its downstream extension, the anticyclonic mesoscale eddy, and the Oyashio are denoted by solid pink, dashed purple, and solid white arrows, respectively.
Atmosphere 12 00888 g009
Figure 10. Vertical section along L5 of (a) simulated temperature and (b) salinity on 12 October 2016.
Atmosphere 12 00888 g010
Figure 11. Relative frequencies of particles at 1/10° intervals: (ac) H-particles and (df) L-particles. Panels (a,d), (b,e), and (c,f) show the distributions of particles 14, 28, and 42 days, respectively, before the initial time on 12 October. A large number of particles were initially set within the pink polygon. The number of particles illustrated in each panel is indicated at the upper right corner of each panel.
Atmosphere 12 00888 g011
Figure 12. (a) Ratios of the number of L-particles (gray shading) and H-particles to the total number of tracked particles. (b) Mean (± one S.D.) salinity experienced by L- and H-particles during the particle-tracking period.
Atmosphere 12 00888 g012
Figure 14. (a) Vertical distribution of particles at the occurrence time of the source water in each region, expressed as the relative frequency of particles experiencing minimum salinity in each region. (b) The occurrence time of source water, when each particle experienced minimum salinity during the particle-tracking period.
Atmosphere 12 00888 g014
Figure 15. Simulated daily volume transport of low-salinity water (<32.8) across the across-shelf transect on the Pacific shelf (yellow dashed line in region S1 in Figure 13d). Positive (negative) values, denoted by red (blue) bars, indicate eastward (westward) transport across the transect.
Atmosphere 12 00888 g015
Figure 16. Salinity at the sea surface and current vectors at 18 m depth on 22 October 2016, simulated by the 1/50° model. Current velocities along the ship track on 11–13 October are denoted by red sticks. The white contour represents the 32.8 isohaline line.
Atmosphere 12 00888 g016
Publisher’s Note: MDPI stays neutral with regard to jurisdictional claims in published maps and institutional affiliations.