1. Introduction
Rip currents are fast seaward water currents that flow in a narrow channel from the surf zone [
1]. As the waves approach the shore, the depth of water becomes shallower and produces breaking waves; these are a form of energy-carrying wave current. As the wave size increases, the amount of seawater that enters increases, and the waves break at the surface as the waves with longer wavelengths push toward the shore. When no waves are approaching the shore at an angle and meet at a spot where the breaker is low, a strong and quick seaward flow, called the rip current, develops because the accumulated seawater cannot flow as a longshore current anymore [
2].
Rip currents are a significant cause of deaths in coastal regions. The damages caused by rip currents are increasing every year, and they affect the United States and Australia more compared to other countries as they have a greater number of large beaches as well as tourists [
3]. An increasing number of accidents caused by rip currents are reported every year, indicating the pressing need for a more accurate analysis of rip current characteristics. A numerical rip current prediction can be conducted regularly and optimized using data about rip current features obtained from field observations. In addition, the availability of a large amount of field observation data is expected to improve the accuracy of existing prediction technologies.
Since predicting the rip current generation with exact location is very difficult and unexpected rip currents can cause sudden casualties, it is still argued that establishing adequate countermeasures against the damage is difficult [
4]. Although researchers are delving into ways of obtaining the location of rip currents in real-time, it is a challenging problem due to limited technology. Moreover, the generation of rip currents is influenced by numerous factors such as the size and regularity of waves, tide, wave direction, and shoreline structure [
5]. The size and regularity of waves determine the amount of shoreward flow; in addition, the tide can affect the power of the shoreward flow, and the wave direction and shoreline structure decide the waves’ shoreline approaching angle [
6]. These factors make it difficult to predict and track rip currents and identify their characteristics.
Quite fittingly, in light of these realities, many researchers have developed a risk score calculation method categorizing the rip currents occurrences into score brackets considering the state of sea weather, bathymetric topography, and their regional characteristics to be able to predict such currents in the future [
1,
4,
6]. In Korea, these efforts are reflected in the indigenous development of a rip current alarm system, which provides rip current predictions in 3-h intervals, by the Korea Hydrographic Oceanographic Agency (KHOA) [
7].
This study presents a method for rip current measurement, which is based on measuring the average flow velocity by dropping a GPS drifter following the Coastal Improvement Project Design Guidebook of 2010 [
8]. Because GPS drifter observation has drawbacks of low accuracy, an alternative dye tracking method is then utilized to measure and locate rip currents and identify their movement paths. Numerical simulations are carried out, and the results are directly compared with the field observations.
2. Identifying the Area of Expected Rip Current Occurrences
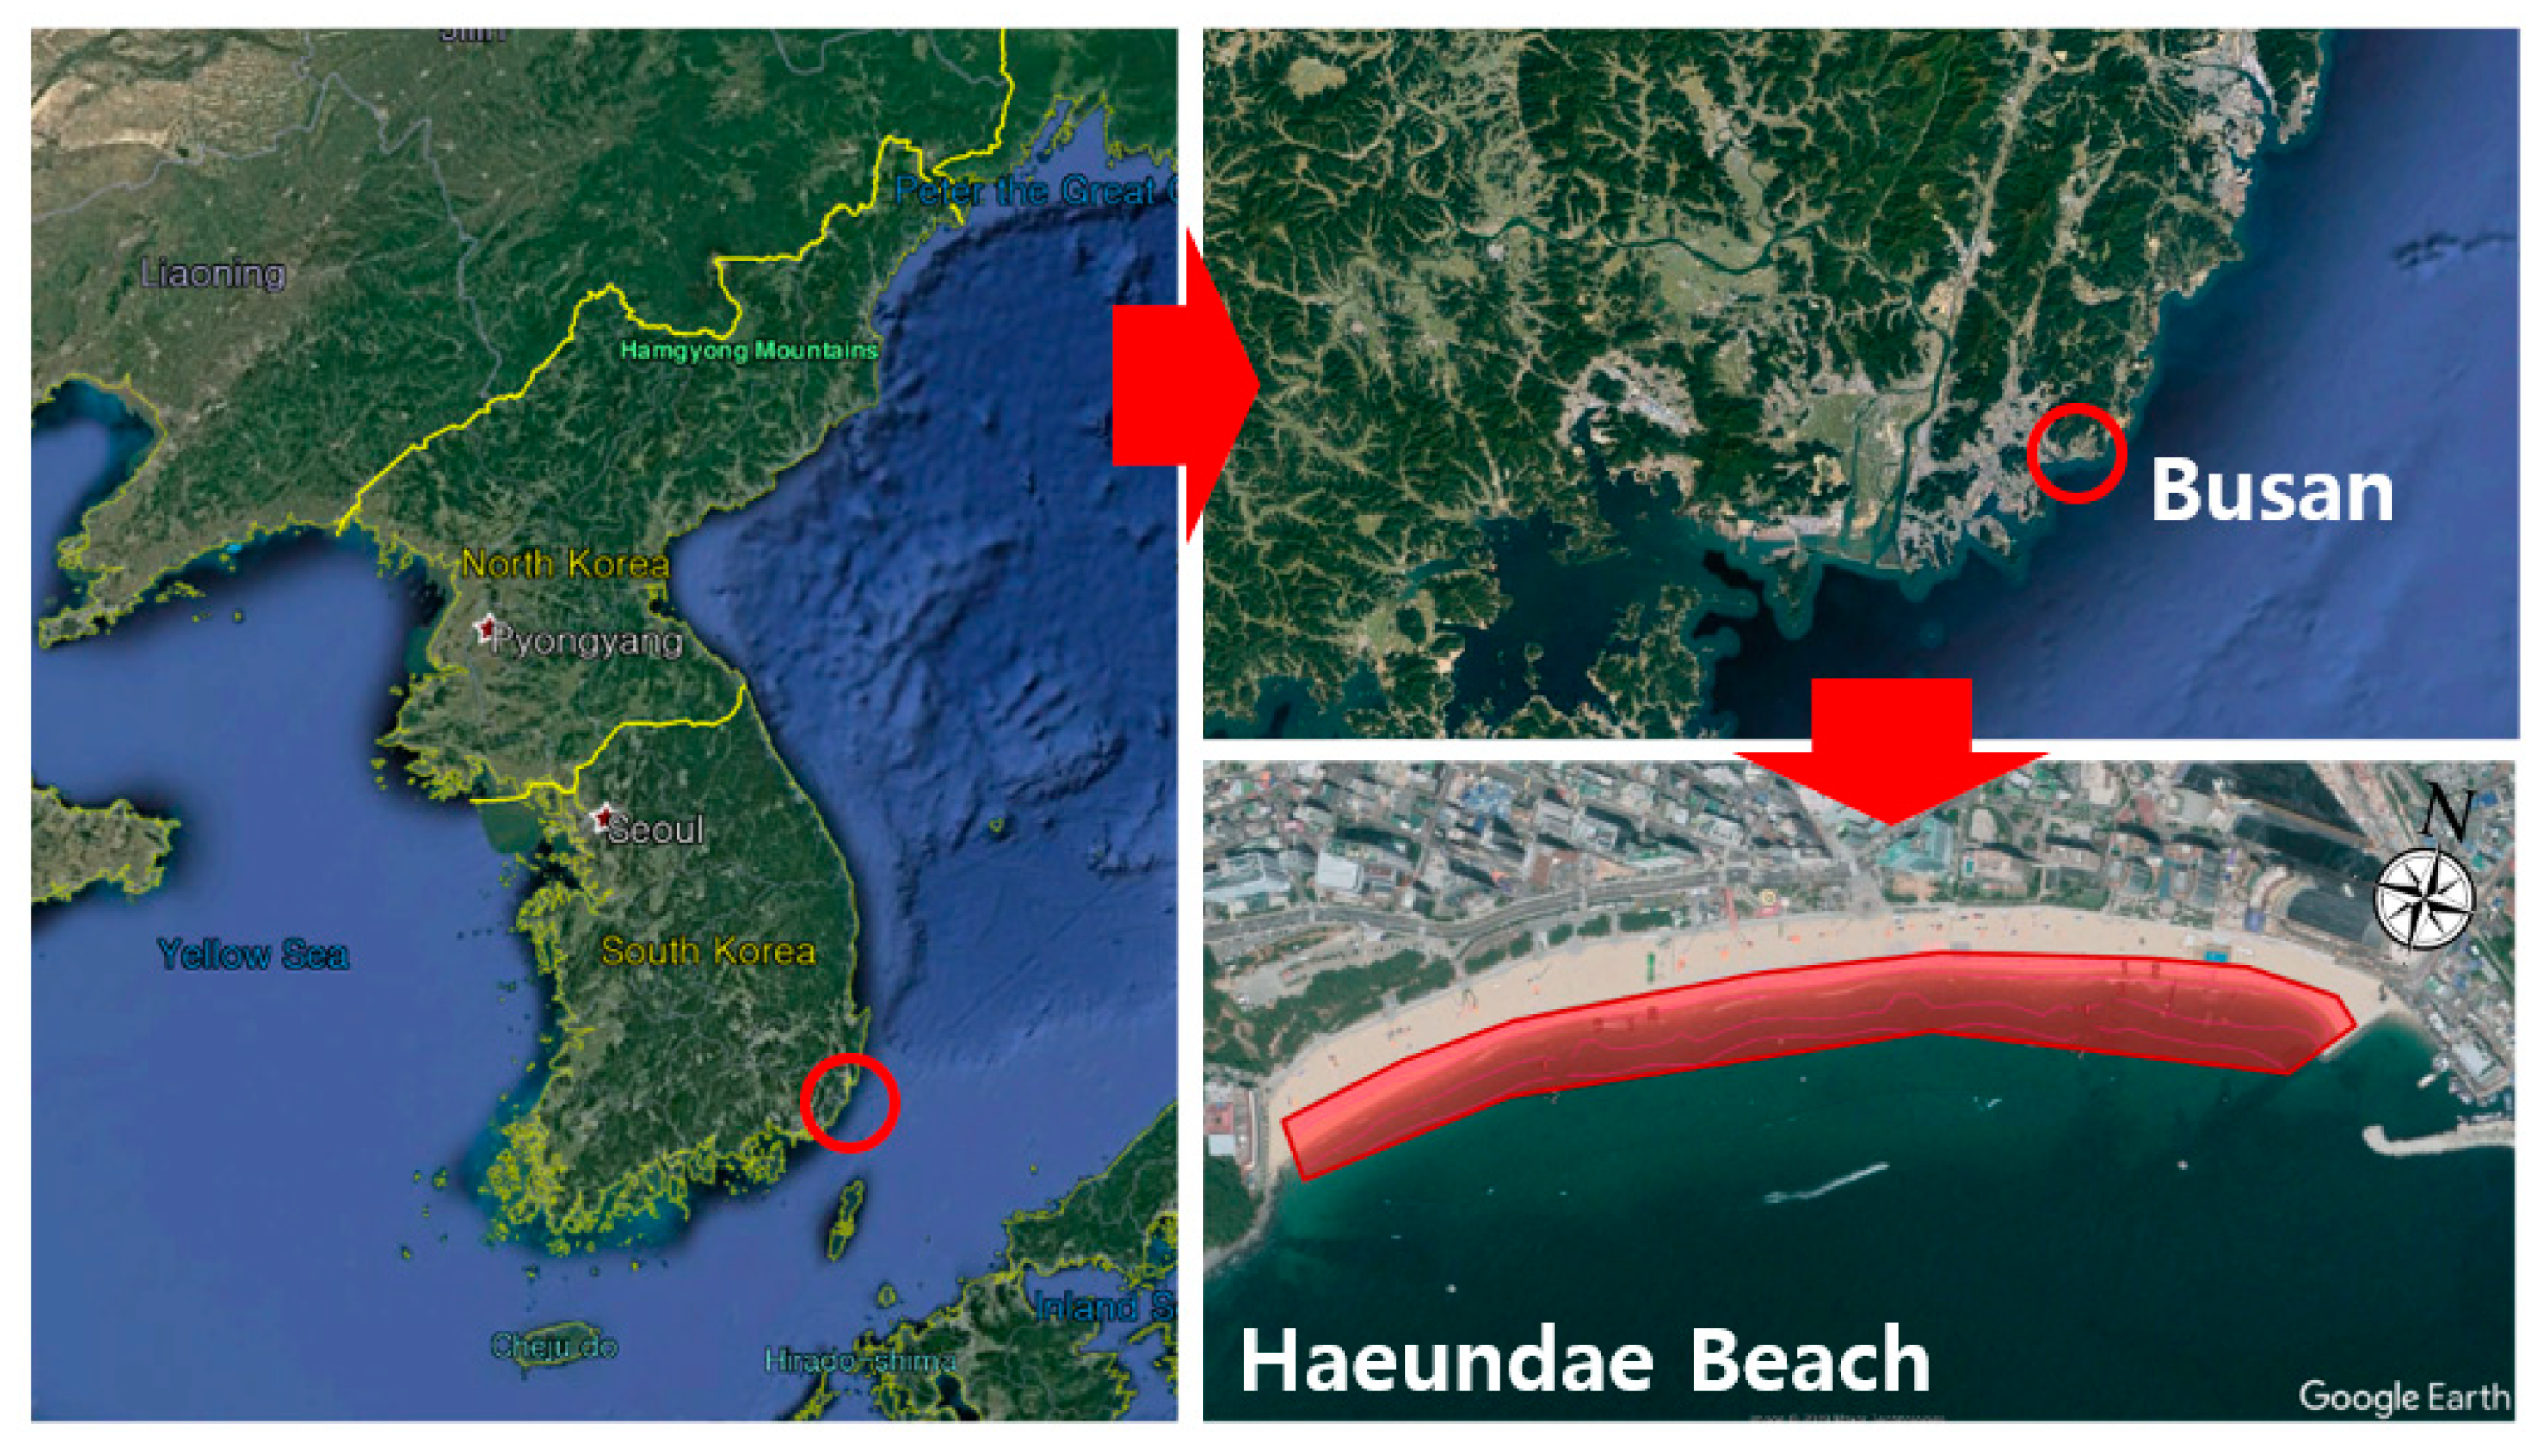
As mentioned above, nearshore bathymetry is one of the factors affecting the generation of rip currents. Therefore, our aim was to collect the latest bathymetric information of the target sea before conducting an on-site investigation and data analysis of rip current characteristics. Haeundae Beach shown in
Figure 1 was chosen as the target sea, and the required investigation and coastal bathymetric change analysis were performed. The bathymetric information was then used in the numerical simulation for obtaining basic data to identify and predict the frequent rip current occurrence locations, which are called rip current hot spots in this study. The reason for selecting Haeundae Beach as the target beach is that KHOA mainly focused on preventing damages due to the frequent rip current occurrences at Haeundae Beach, and it is one of the main beaches where a large number of people are exposed to rip current danger as it has the highest number of visitors during the season.
2.1. Survey and Measurements for the Numerical Simulation Data
To understand the general topographical changes of the targeted ocean over time, the coastal topography and bathymetry along Haeundae Beach’s surf zone (width ~100–120 m) were investigated to analyze the evolution of Haeundae Beach over the years from 2011, 2014, and 2019. For the topography of sandy beach, the Virtual Reference Station method, which is a real-time kinematic surveying technique, was conducted over an area of 1.4 km in length and 2 m in depth [
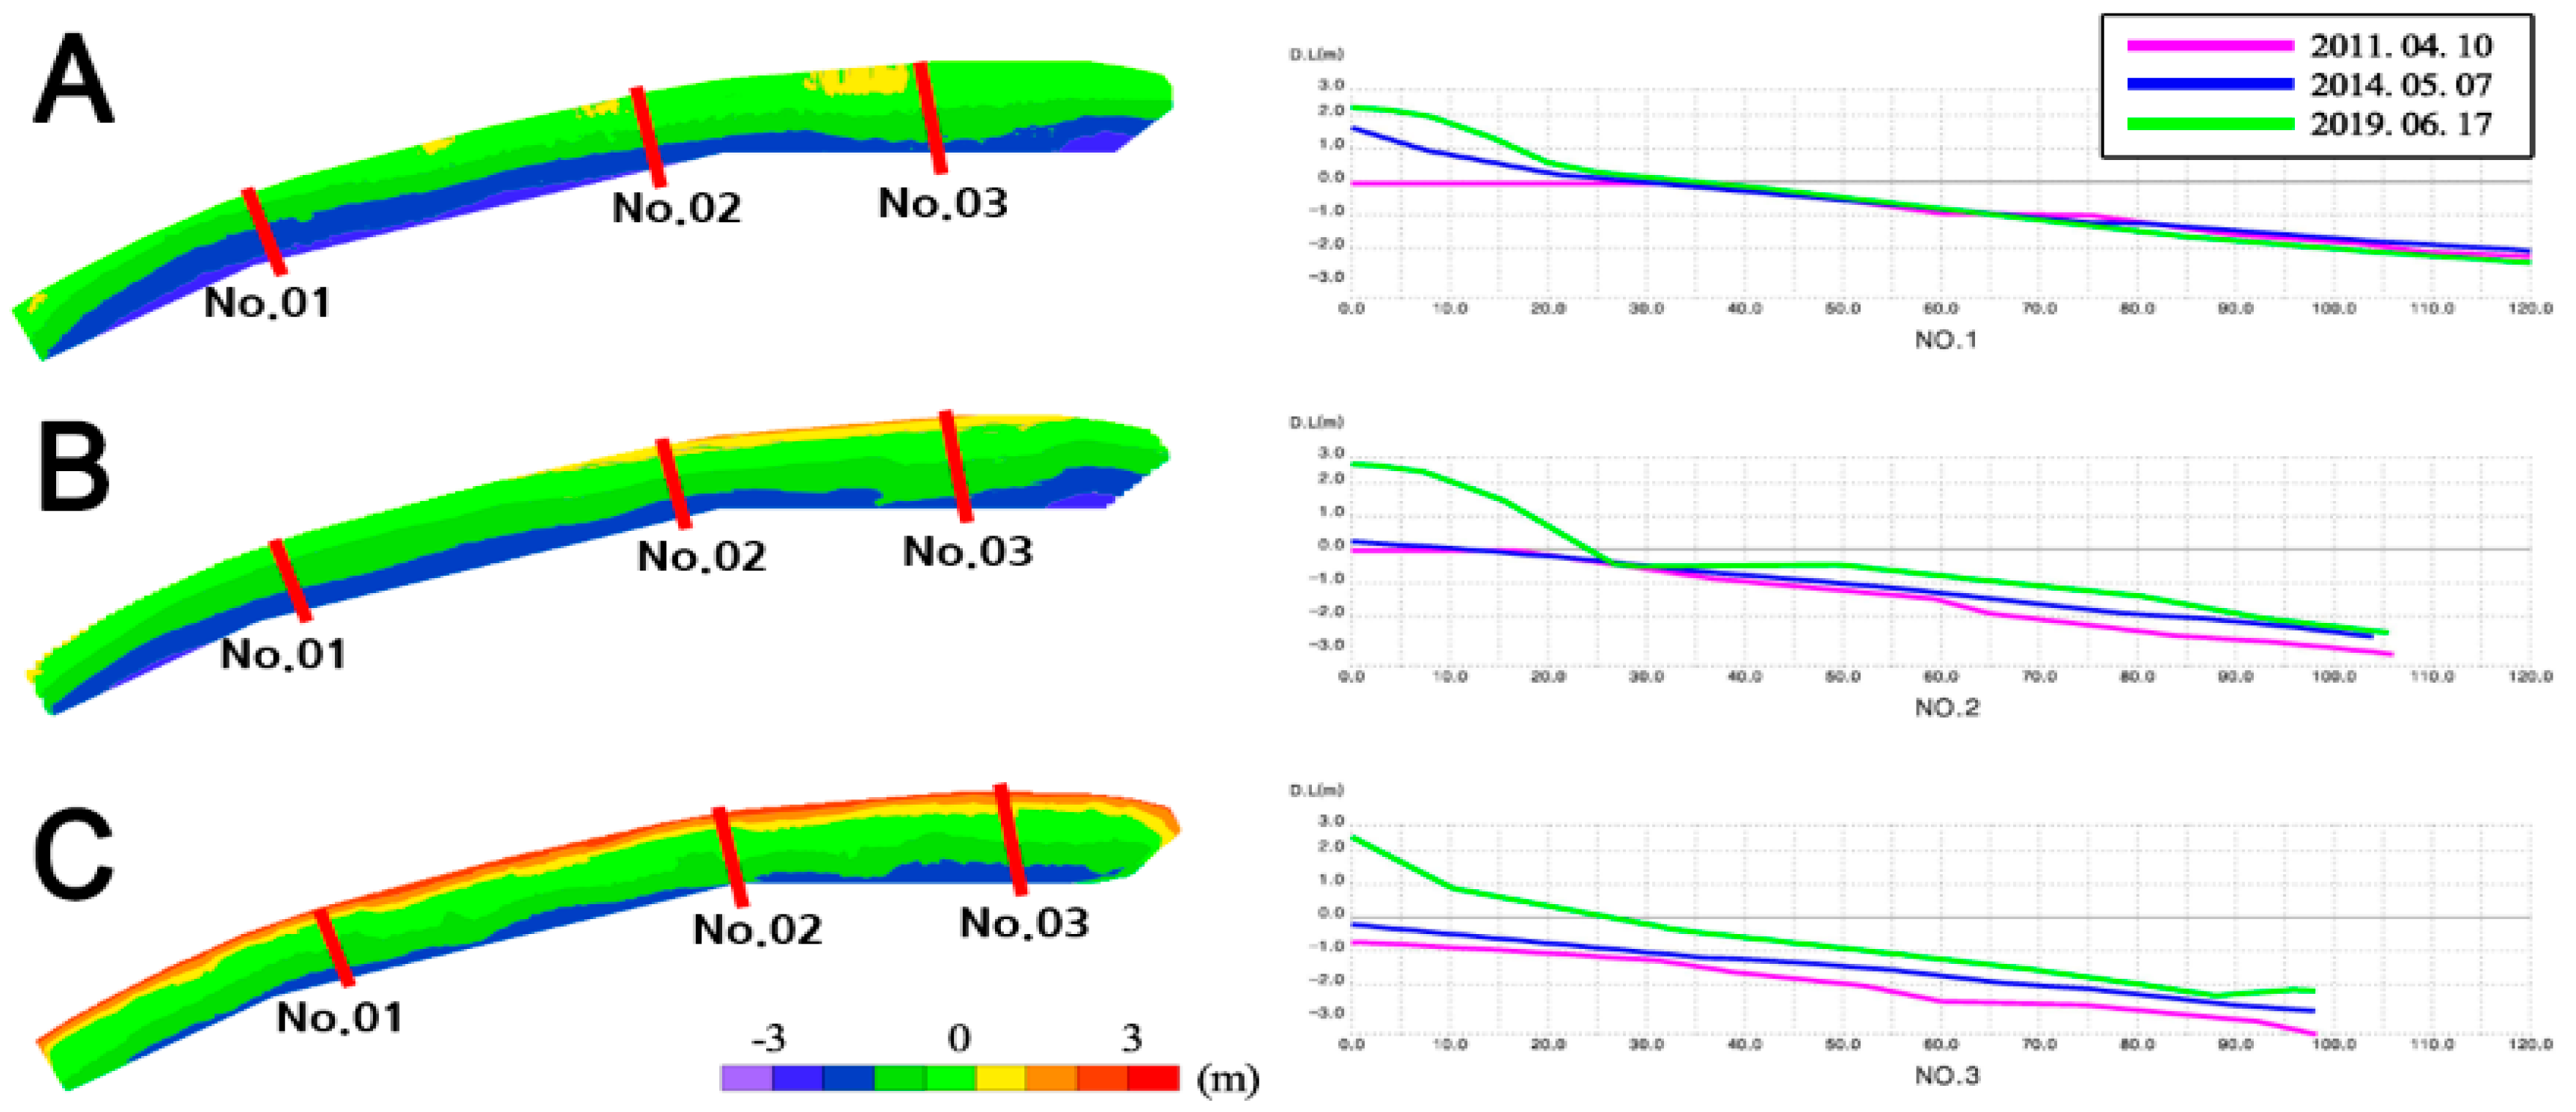
9], and for the ocean bathymetry, a detailed sea floor topographical survey was conducted using a multibeam echo sounder. This equipment uses the swath coverage method. Each measurement covers tens of multiple times of the water depth and uses the Seabat 7125 Multibeam Sonar, which has a frequency of 200 kHz with 256 beams. The beach profiles were observed and recorded at 50 m intervals, and among them, three specific beach profiles showing the most critical differences were compared, as shown in
Figure 2. By comparing these bathymetry surveys near the surf zone from 10 April (2011), 7 May (2014), and 17 June (2019), it was found that the overall depth and bathymetry had changed continuously due to the continuous nourishment and sediment transport, because the continuous beach erosion left the government of Korea with only the quickest option, i.e., nourishment, to protect the beach from erosions and disappearing. As a result, the beach bathymetry changes irregularly due to the stacked artificial sediment supply at the beach in certain locations; however, the overall bathymetry of Haeundae Beach does not change critically over time as shown in
Figure 2. The latest bathymetric information (17 June 2019, which is the exact date of the field survey), was used for the numerical simulations.
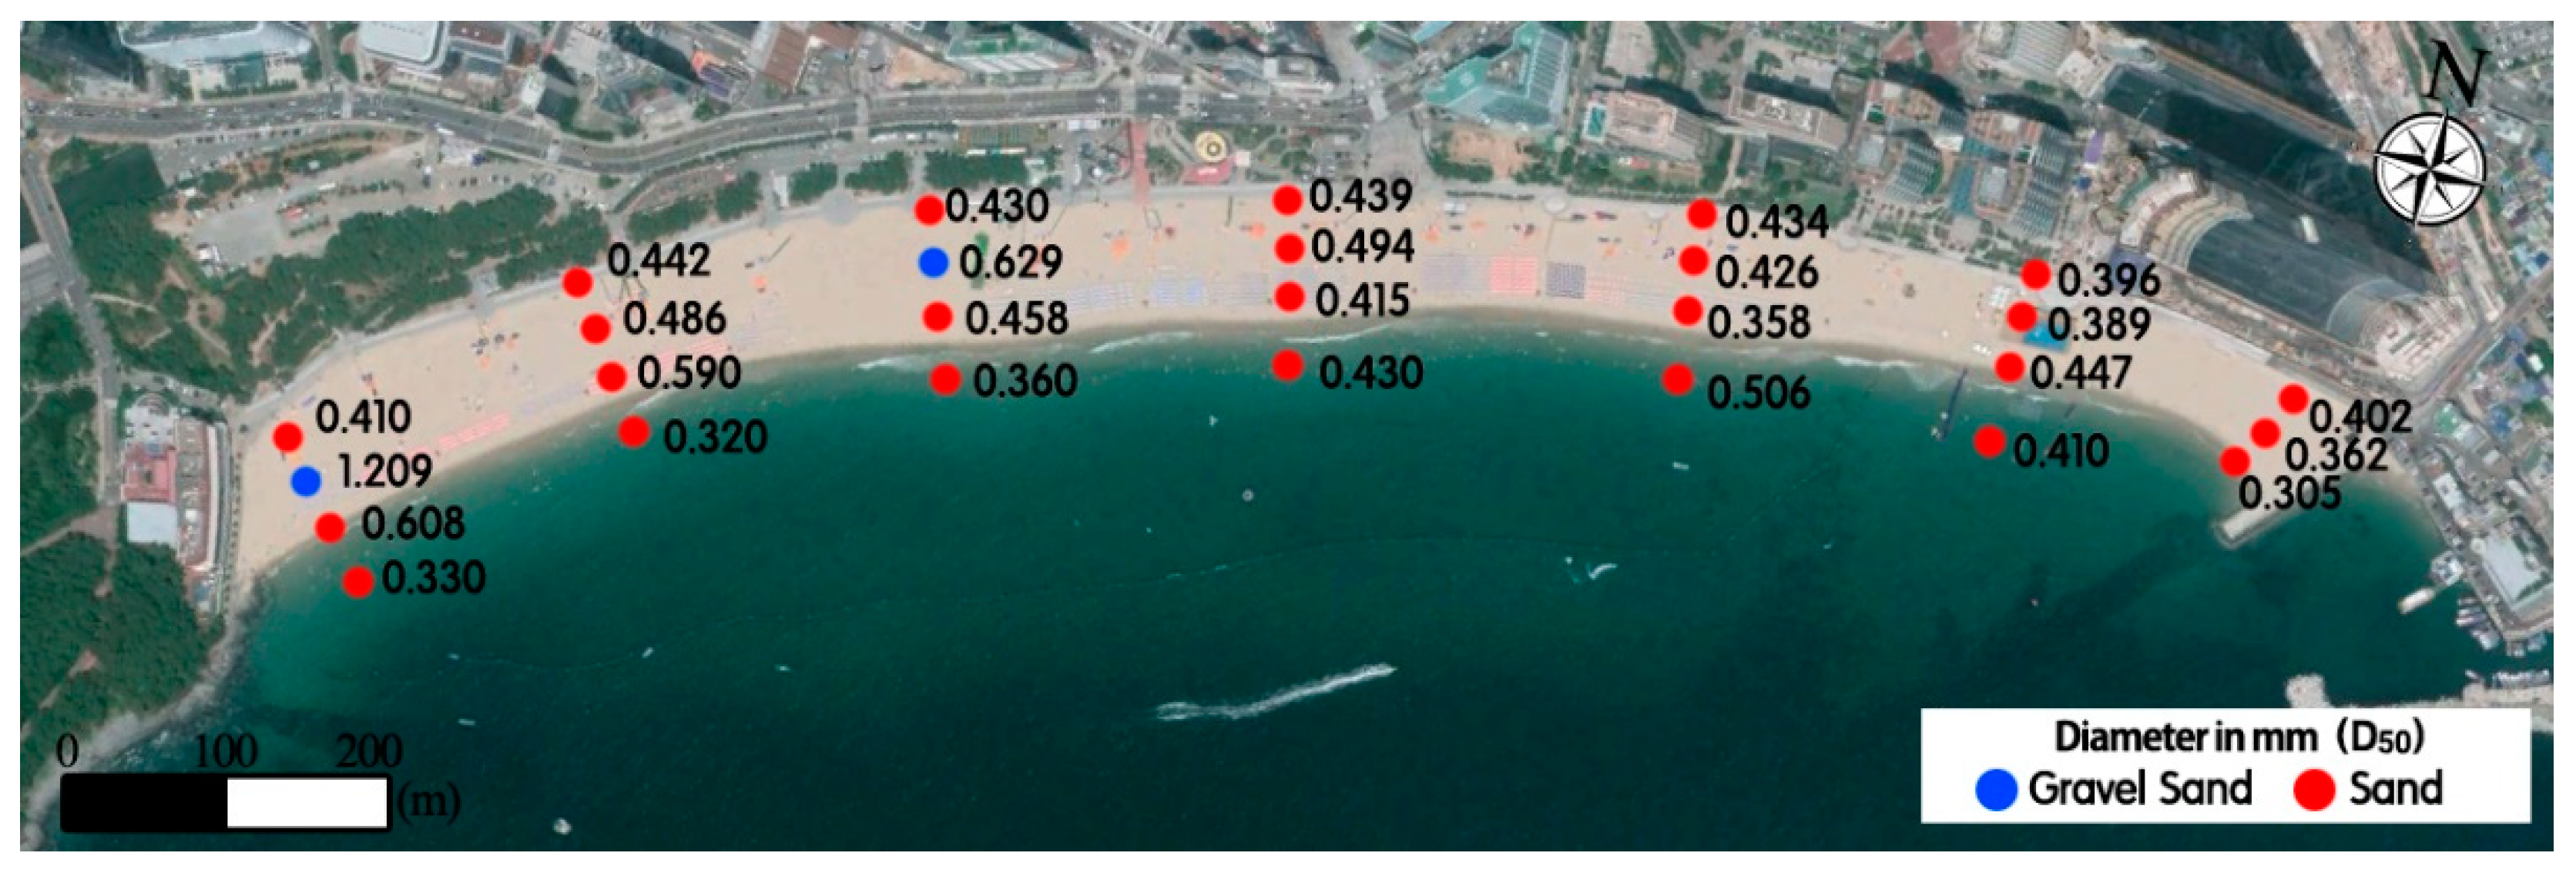
The grain size analysis of marine sediment is considered a basic tool in marine environmental research. The sand grain size distribution of the beach acts as a run-up for the waves and affects its morphology and slope, ultimately impacting the formation of rip currents. Therefore, twenty-one sand samples were collected using Van Veen grab, constituted by two jaws, to collect superficial sediments. The sampling criteria and instruments selected for marine sediments are generally functional for obtaining an undisturbed sample. Because the textural characteristics of sediments and their distribution are key factors in marine environmental research, great attention should be given to the accuracy of grain size distribution. The grain size analysis of marine sediments started with pretreatment. The saline content was removed by immersing the sample in distilled water, and the coarse and fine fractions were separated by wet sieving [
10,
11]. The sampling points are indicated by red and blue dots in
Figure 3. For determining the size of sand particles in millimeters (mm), a phi scale was used, and the analyzed sand characteristics were then used as sediment input parameters in the numerical simulations. The sand grain size distribution showed an average particle diameter ranging from 0.305 to 1.209 mm, and fine (~0.25 mm) to medium (~0.5 mm) sand was dominant in the overall composition.
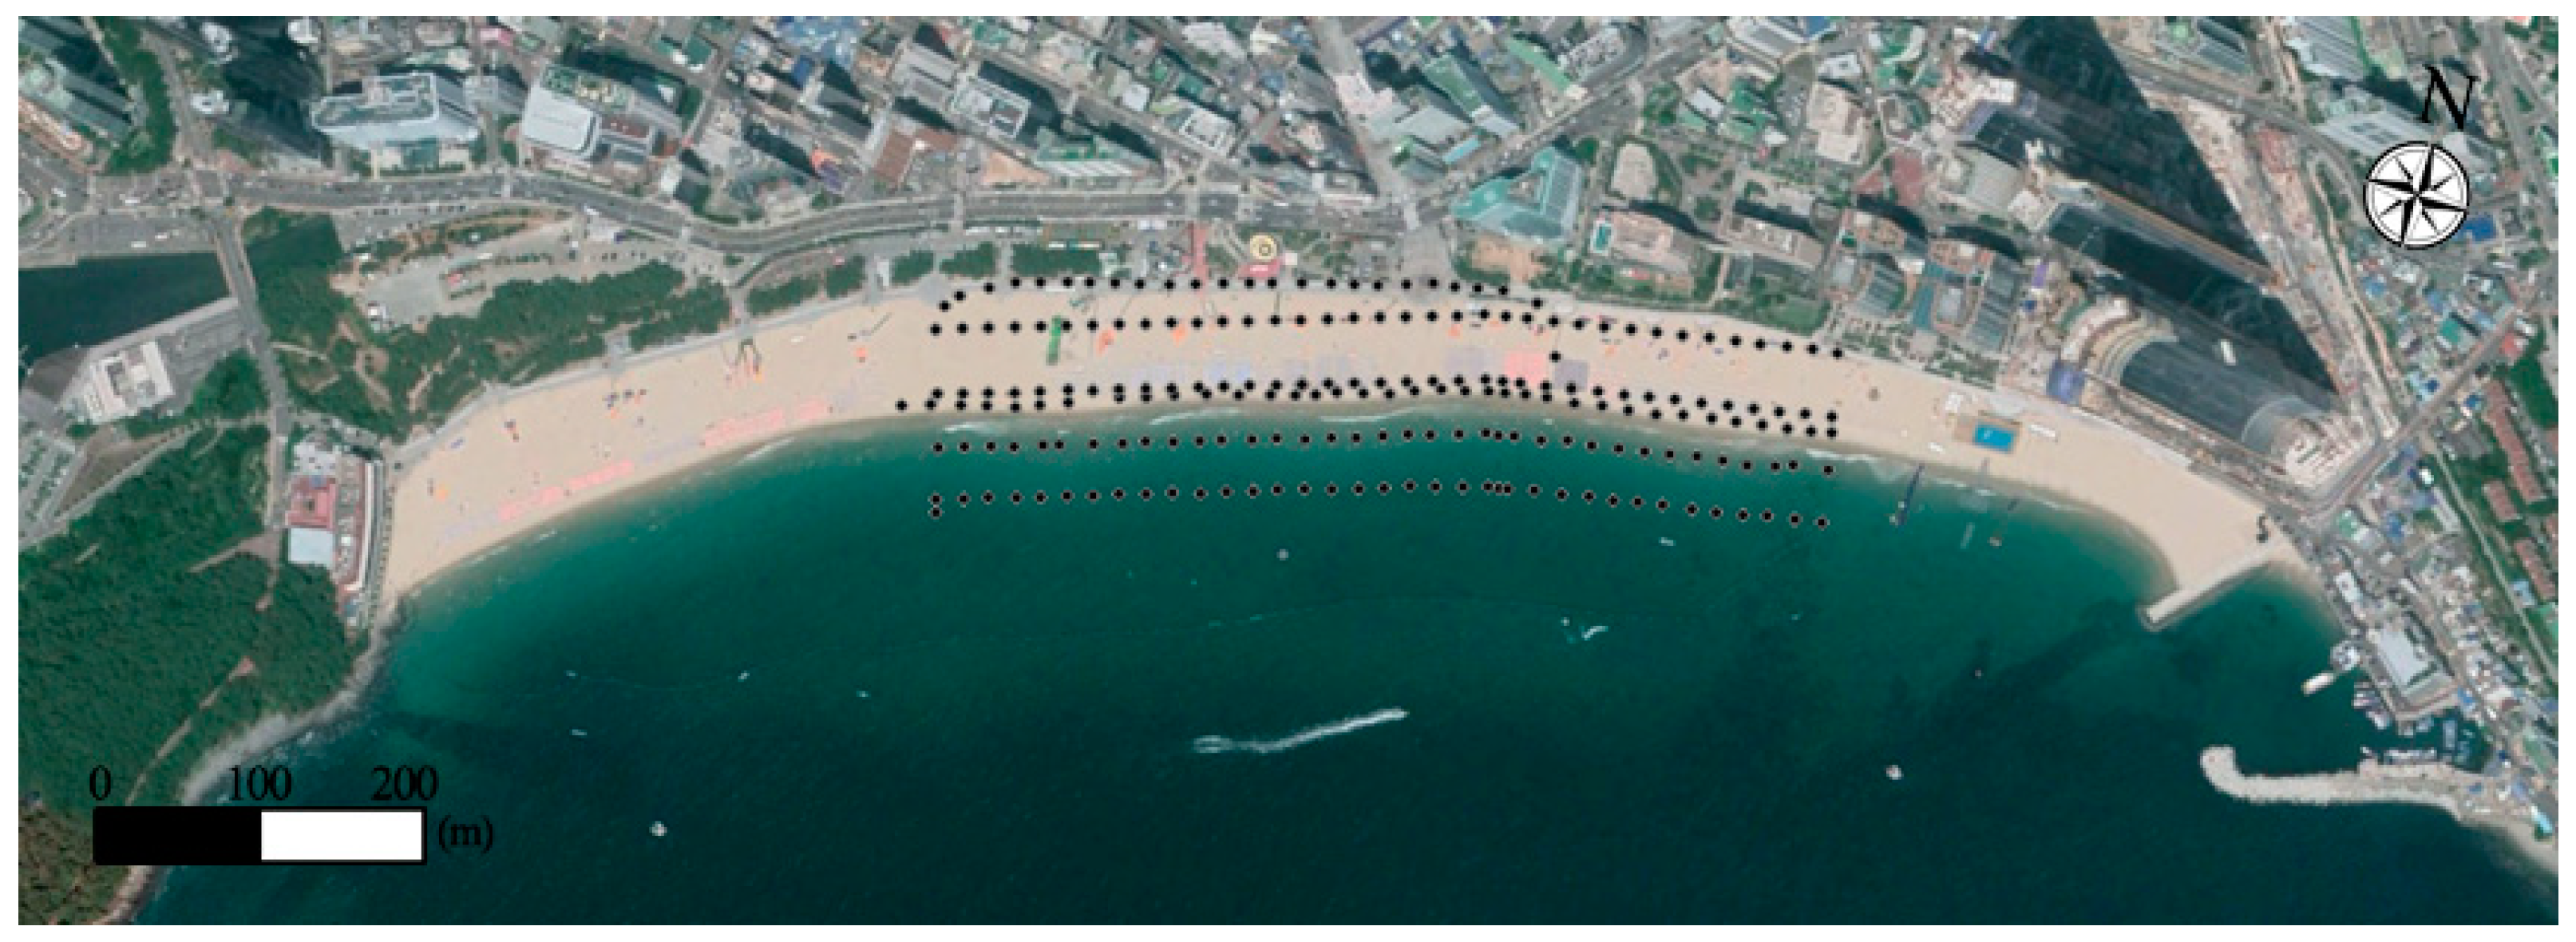
All the collected images of Haeundae Beach were processed with orthometric corrections using the following steps: (1) Take images of Haeundae Beach with Ground Control Points (GCPs). (2) Continue taking measurements between the GCPs from each image for distortion correction. (3) Proceed with the correction of distorted images by matching the measured GCPs [
12]. At least four GCPs must be included in each image to perform distortion correction; however, to increase the accuracy of the distorted images, a total of 174 GCPs were surveyed from onshore and offshore areas for image distortion correction as shown in
Figure 4: 87 GCPs from onshore and offshore, separately. The inherent average horizontal error in this process was approximately 8.5 to 13.7 cm.
2.2. Numerical Simulations
A numerical simulation was performed to identify the rip current flows by reproducing the current flows from waves near Haeundae Beach. Although various numerical models are available for reproducing current flows from waves, a 3-D Wave-Induced Current Numerical Model for predicting beach deformation was used to recreate and analyze the rip current patterns using wave-induced current flows. This model was developed by Watanabe and Maruyama [
13], and it calculates wave-induced current using the calculated wave deformation by the equation of equilibrium [
13]. A flow chart of the described model process is shown in
Figure 5.
The model used in this research is a part of the 3-D Wave-Induced Current Model for predicting beach deformation using the 2-dimensional plane monolayer equation. Wave-induced currents can be described using two equations to represent the x and y directions: continuity equation (Equation (1)) and motion equation (Equations (2) and (3)). These equations include the external force of the 2-D monolayer shallow-water equation, which comprises a wave-induced radiation stress component.
where
Rx,
Ry,
Mx,
My,
Fx, and
Fy can be obtained from Equations (4)–(9).
Rx and
Ry are the radiation stress terms,
Mx and
My are the viscous terms, and
Fx and
Fy are the bottom resistance terms. The study field of Haeundae was divided into micro-grids for finite differentiation, and each grid point was defined using the water depth (
), average water level (
), and radiation stress (
values as shown in Equations (4)–(9). The average water flows
and
are defined between two adjacent grids using the staggered grid model.
Using the above-mentioned model, the following parameters were used to calculate the wave-induced currents and identify the rip current hot spot: experimental range: 1500 m × 1300 m; the number of grids: 150 × 130 = 19,500; grid size: dx = dy = 10 m. The normal significant wave height and period in Haeundae are 1.4 m and 10 s, respectively, as shown in
Figure 6B [
14]. The same method and grid configurations were used to calculate the real-time wave in the same time zone as that of the rip current observation of the input conditions to compare the numerical simulations from this research with those of Deguchi et al., (2008) [
14]. Furthermore, the results of the numerical model used in this study were compared with those from the numerical model of Kim et al., (2013) [
15]; it used the same model to predict longshore and rip currents with respect to the seasonal change in the directions of waves and examine the direction of wave-induced currents.
Because different time periods with a different wave and bathymetric data were used for different test scenarios (A, B, and C), the results can be only compared for the rip current generation location. While comparing the rip current generation tendencies at Haeundae Beach, it was observed that longshore currents were developed from the west to the east, generating strong rip currents in front of the beach at the hot spot location of the present study. Buoy and dye tracking observations were then performed at the predicted hot spot.
Figure 6 shows the hot spot prediction points obtained using rip current model verification with the current observed bathymetric topography. The location of the hot spot obtained using this numerical model was similar to that obtained in a previous study by Deguchi et al. [
14]; hence, the observations herein were made at the same location.
3. Field Investigation
The rip current characteristics were analyzed by examining the movement range, direction, and flow velocity of the rip currents using a GPS drifter designed to measure the surf zone circulation [
16]. The rip current hot spot at Haeundae Beach was identified through a numerical simulation in comparison with previous studies [
17,
18]. Ten GPS drifters were dropped at the rip current hot spots and tracked to analyze the rip current generation pattern, including the average flow velocity, maximum instantaneous flow velocity, and direction. Simultaneously, the previously mentioned dye tracking method was also executed using drones and dyes for flow velocity and direction observations considering the limitations of the GPS drifter surveys and for improving the investigation accuracy. The performances of the GPS drifter and dye tracking method were compared by matching the flow velocity and direction results.
3.1. Investigation of the Rip Current Using GPS Drifters
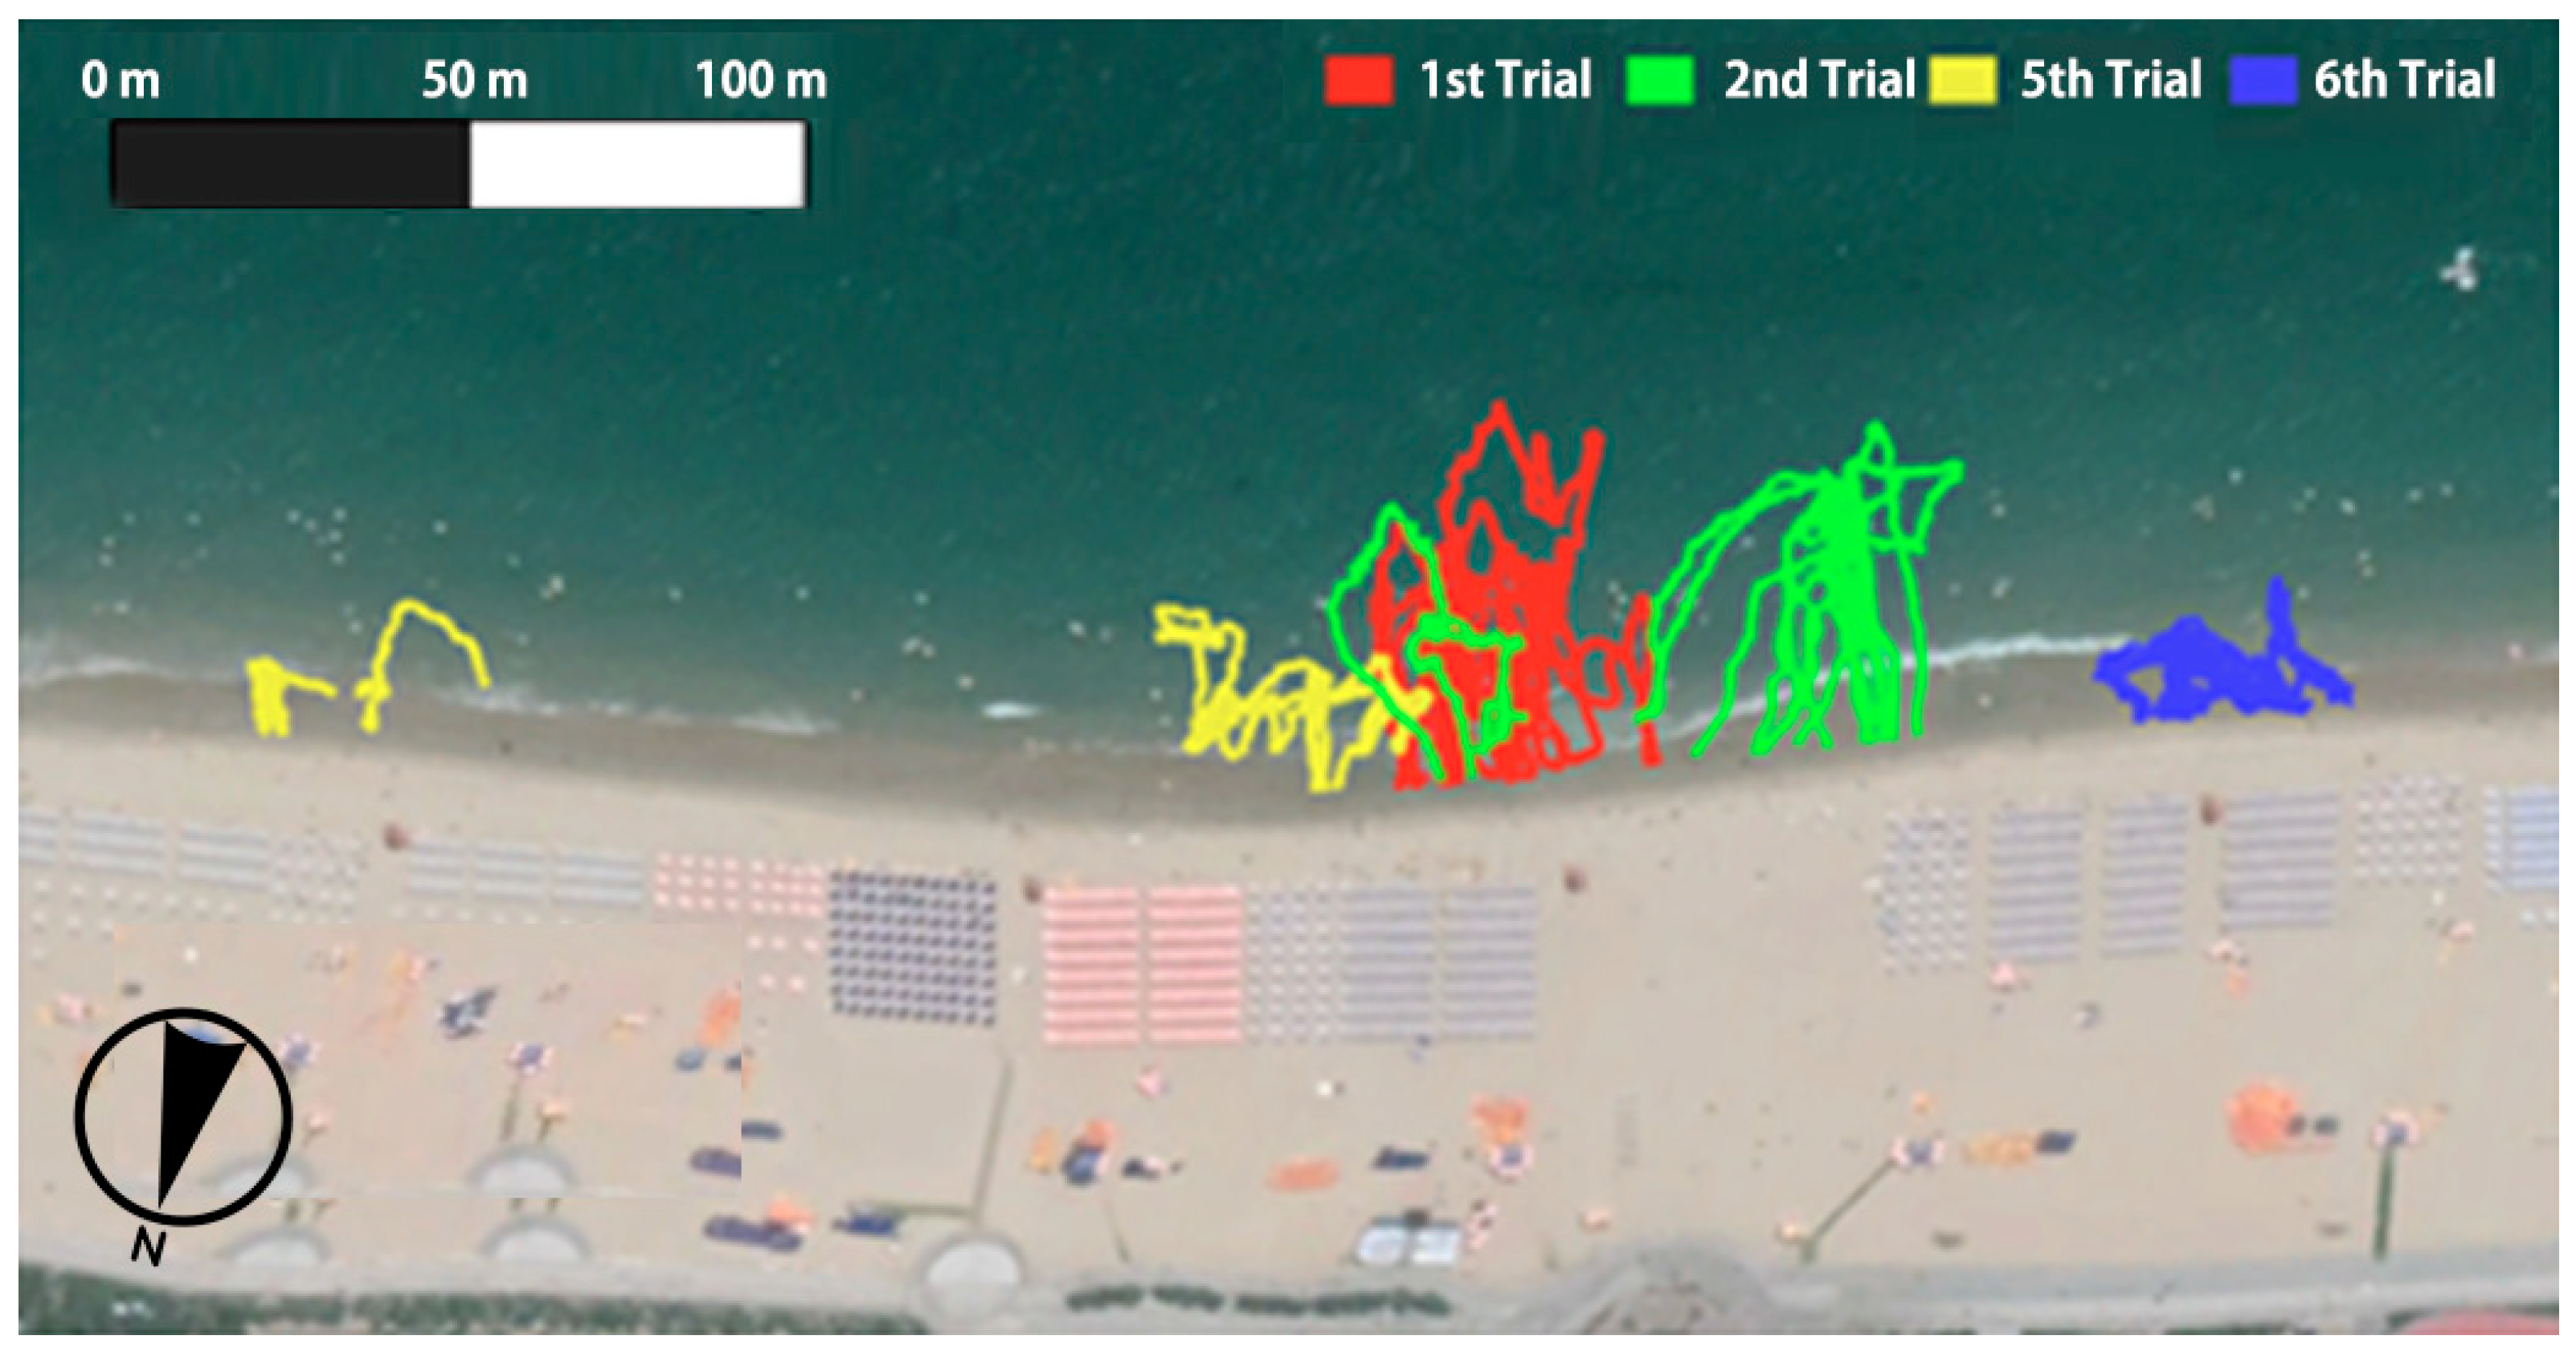
The buoy surveys at Haeundae Beach were conducted from June 1st to September 5th of 2019, which is the period when the beach is open for tourists during summer. The vicinity of the rip current hot spot was derived from the numerical simulations shown in
Figure 6, and six trials of rip current surveys were conducted using five GPS drifters per trial. Each trial was conducted on a different date. A widely used Lagrangian method, recommended by the Korean Ministry of Ocean and Fisheries, was used to measure rip currents, and the results are plotted in
Figure 7 [
8].
A total of six field surveys were conducted from June 17 to September 5 of 2019; however, the wave heights were substantial (over 1 m) during the third (24 July 2019) and fourth (25 July 2019) trials making it impossible for the divers or observers to continue with the survey using GPS drifter. Throughout this study, it was found that the survey was only possible when the wave height is lower than 1 m, for reasons of safety. As a result,
Figure 7 shows the GPS tracking of the first (17 June 2019), second (18 June 2019), fifth (26 July 2019), and sixth (5 September 2019) trials that could be observed; however, the drifter could not go beyond the surf zone and returned to the shore. The GPS drifter indicated that the average flow velocity of all trials was 0.4 ms
−1, and each value is listed in
Table 1. Nonetheless, the survey result was not completely reliable because the drifter returned without going beyond the surf zone, and the result was not suitable for this research’s analysis.
Table 1 shows the daily average wave data (wave heights (Hs), wave periods (Ts), and direction) provided by Haeundae’s buoy wave data from KHOA [
19]. The wave data from the third and fourth trials were not recorded as they were too high and unsafe.
3.2. Rip Current Investigation Using Drone and Dye
As described above, the survey method using a GPS drifter requires the drifter to move in the wave direction by the mass transport of the wave; however, it cannot go beyond the surf zone due to the breaking of the waves, which is a critical limitation to the method. Along with this limitation, factors including the inflow of long-period high waves and the marine environment (e.g., typhoon) were thought to have an enormous impact, thereby resulting in survey difficulties and limitations in deriving reliable results. In addition, conducting a survey using GPS drifters was risky at times of rip current occurrence with high waves because the divers or the observers had to go into the water by swimming and install the buoy. Several years ago, rip current surveys were conducted in the United States [
20] and Japan [
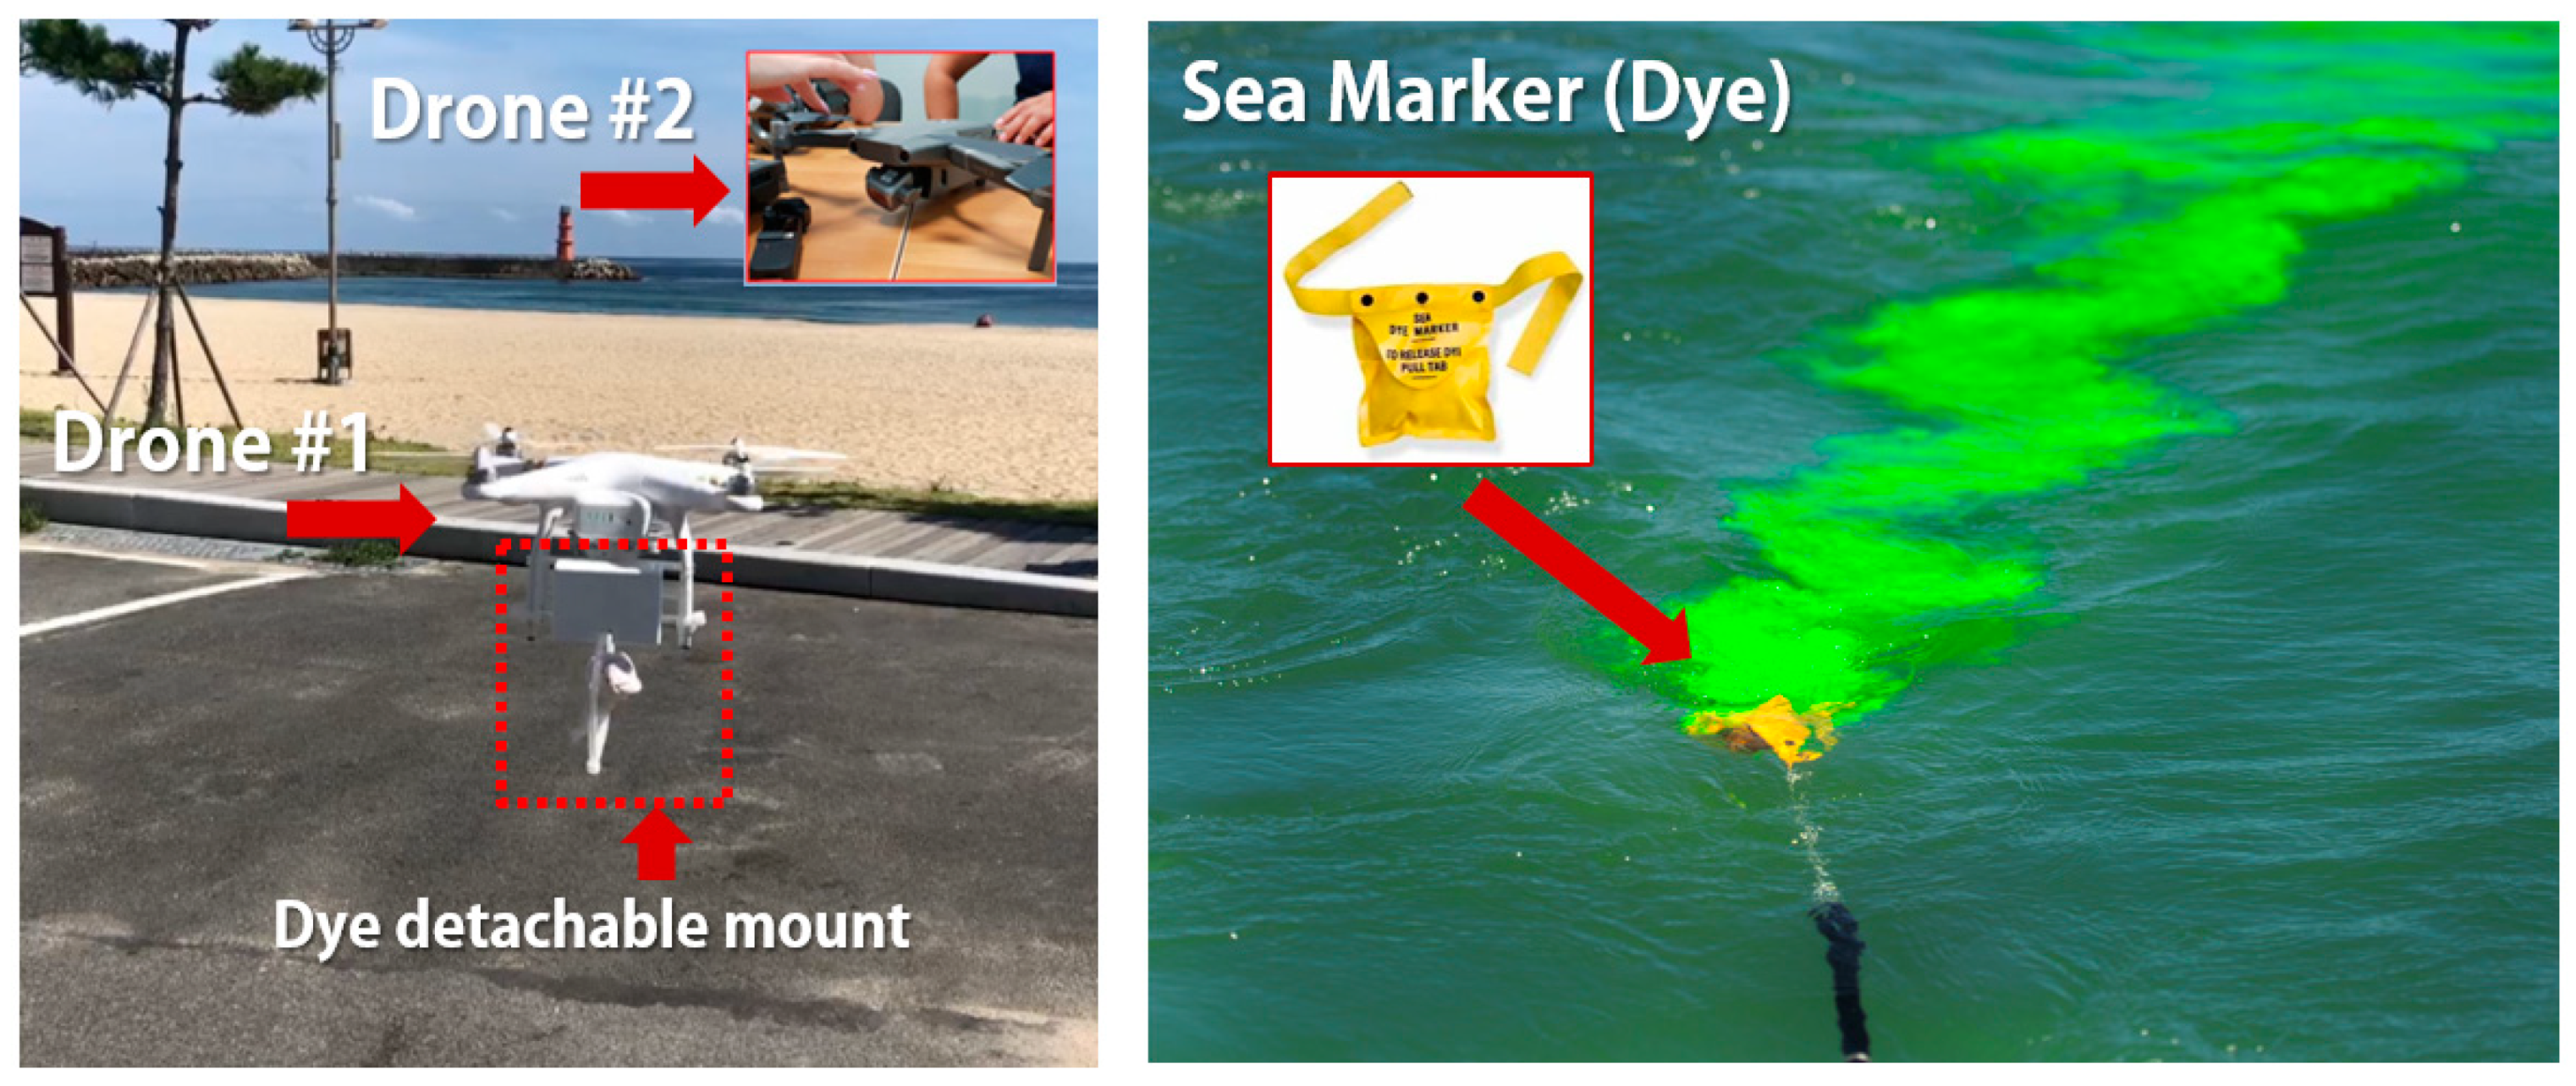
14] using GPS; however, the output reliability was not considered to be sufficiently high because the results from the movement of the buoys or drifters were not accurate. Therefore, this research aimed to obtain the results by conducting investigations using both drones and dyes (
Figure 8) to improve the accuracy of the rip current survey and the quality of the derived results.
Fluorescent dyes are usually used in offshore rescue missions and are harmless to the human body; hence, they were used for the dye tracking investigation in this research. Based on the numerical simulation results, suspected areas of rip current occurrences were selected as the drone-shooting section, which is the rip current hot spot. After installing a mount that can be attached or detached to a drone, some dye was released at the desired spot. At this time, two drones (i.e., dye releasing and image shooting drones) were operated simultaneously for the investigation. Phantom 4 Pro drone manufactured by DJI, capable of up to 25 min of flight time and a receiver distance of 5 km, was used for the survey.
The aerial image of the fluorescein tracer dye in a rip current was taken via a drone, as shown in
Figure 9, and the current velocity was calculated. After the video footage was corrected for distortions, images of this drone footage were captured at 1-min intervals and were color-corrected according to the dye concentration to identify the rip current flows. During correction, red, green, and blue (RGB) color channels were used for adjustment [
21]. The white balance levels were preset by changing the white and grey areas using only blue channels to be able to clearly detect the fluorescein dyes, which changes the lighting conditions of the image [
21]. During this process, the fluorescein dye was recolored for analysis. The dye survey was performed on 14 October 2019, at 13:45 for 5 min (
Table 2,
Figure 10).
The wave observation information from KHOA [
19] was referred for the wave characteristics at the time of the dye tracking observation. The maximum wave height was 1.62 m, the maximum wave period was 10 s, and the wave direction was 135°. The flow velocity analyzed through the images, as shown in
Figure 10, showed a maximum instantaneous velocity of 0.25 ms
−1 and an average velocity of 0.17 ms
−1.
4. Results and Discussions
Figure 11 shows the results of the numerical simulations using the real-time wave configurations from 13:45 of 14 October 2019. Based on the data from the wave buoy at Haeundae Beach, the significant wave height and its period at the time of the survey were 1.22 m and 8 s, respectively [
21]. Through the numerical simulations, the average velocity of the rip currents in the zone designated as its hot spot was found to be 0.21 ms
−1; this was measured to be 0.17 ms
−1 when observed using fluorescent dye.
Meanwhile, the incident wave height of the numerical simulation was used as input data with the average value of the significant wave height measured at 2-h intervals. Therefore, it is somewhat difficult to quantitatively compare the result of the numerical simulation with the velocity at the moment of observation. Nevertheless, it was confirmed that the observed values and the numerical simulation results are qualitatively consistent not only in order but also in a flow pattern.
The rip current trends at other regions in Korea where rip currents frequently occur would be similar if various numerical methods can be complemented using the observation data. The result of the orthometric correction of the dye observation images obtained using the drone demonstrated a higher accuracy than the GPS drifter results because they were measured without any limitations that prevent going beyond the surf zone, unlike that in the case of buoys or drifters. However, this method cannot perform observations at multiple places simultaneously; hence, combining the results of a numerical simulation as well as a dye observation can enable fast and accurate prediction of rip currents.
5. Conclusions
Wave-induced currents are recognized as significant mechanisms for sediment transportation, which is tied to erosion and deposition on beaches. Rip currents that occur in wave-induced currents can be a significant cause of deaths in coastal regions. Therefore, it is crucial to detect the formulation of rip currents by accurately measuring the location, size, and direction of rip currents to prevent casualties.
In general, a tracking observation using GPS drifters is used to identify the characteristics of rip currents. Likewise, the Coastal Improvement Project Design Guidebook [
8] also proposes the observation of rip currents using a GPS observation methodology. However, many researchers have faced difficulties with this method due to the limited safety and effectiveness. This study specifically investigated rip currents at Haeundae Beach, where rip current occurrences are frequent.
Haeundae Beach is open wide to the south, where in summer, south wind is dominant, and the waves hit the beach directly. If the coastline is curved, the waves pushed to the coast cannot gather power and scatter in one place, making it difficult to generate a rip current. Still, in the case of Haeundae, the coastline has a gentle shape close to a straight line, which increases the risk of the rip current generation. Besides, because the slope of the coast is gentle, the wave breaks; that is, the wave breaking zone is wide, so that much of the breaking wave energy accumulates, resulting in perfect conditions for rip current generation.
In general, when detecting the generation of rip currents, GPS drifters or buoys are used; however, various problems were discovered during the observation that resulted in low accuracy. As an alternative, a dye tracking methodology employing a drone was used in this study to measure and determine the location and movement paths of rip currents at a hot spot in Haeundae Beach. Wave-induced current numerical simulations with shallow water equations that incorporate radiation stress were performed to determine the characteristics of the rip currents. The results obtained from the numerical simulations were then compared with the result of the dye tracking method, and it was found that the observed result showed relatively sufficient reliability for rip current generation at the hot spot with a maximum instantaneous velocity difference of only 0.04 ms−1. In the future, if a method that allows the simultaneous observation of rip currents at multiple hot spots in front of the beach can be devised, it is expected that a more useful and practical rip current investigation system can be constructed.
In this study, the origin and size of rip currents in front of the beach were investigated, confirming the effectiveness of the dye tracking method using drones. In future studies, it is necessary to install a fixed current meter at the points where rip current occurrences have been identified through this investigation and observe the changes in the velocity of rip currents over time using the Euler method. In such a future study, it is also necessary to grasp more quantitative characteristics of the rip currents in front of Haeundae Beach by performing continuous and simultaneous observations on both the wave height and the current velocity of rip currents.
Author Contributions
Conceptualization, K.-H.K.; Formal analysis, K.-H.K.; Investigation, H.D.K.; Methodology, H.D.K.; Supervision, K.-H.K.; Validation, H.D.K. and K.-H.K.; Writing—original draft, H.D.K.; Writing—review & editing, K.-H.K. All authors have read and agreed to the published version of the manuscript.
Funding
This research received no external funding.
Institutional Review Board Statement
Not applicable.
Informed Consent Statement
Not applicable.
Conflicts of Interest
The authors declare no conflict of interest.
References
- Bowen, J. Anthony, Rip Currents: 1. Theoretical Investigations. J. Geophys. Res. 1969, 74, 5467–5478. [Google Scholar] [CrossRef]
- Kim, K.H.; Shim, K.T. A Field Investigation of Waves and Wave-induced Currents at the Youngrang Coast of the Republic of Korea. J. Coast. Res. 2014, 72, 6–10. [Google Scholar] [CrossRef]
- Gensini, V.A.; Ashley, W.S. Reply to Rip Current Misunderstandings. Nat. Hazards 2010, 55, 163–165. [Google Scholar] [CrossRef]
- Dalrymple, R. A mechanism for rip current generation on an open coast. J. Geophys. Res. Space Phys. 1975, 80, 3485–3487. [Google Scholar] [CrossRef]
- McKenzie, P. Rip-Current Systems. J. Geol. 1958, 66, 103–113. [Google Scholar] [CrossRef]
- Moulton, M.; Dusek, G.; Elgar, S.; Raubenheimer, B. Comparison of Rip Current Hazrad Likehood Forecasts with Observed Rip Current Speeds. Am. Meteorol. Soc. 2017, 32, 1659–1666. [Google Scholar]
- Korea Hydrographic and Oceanographic Agency. Report on the Real-time Rip Current Monitoring System Expansion and Service Operation (4th); Ministry of Oceans and Fisheries, Korea Hydrographic and Oceanographic Agency: Busan, Korea, 2018. [Google Scholar]
- Ministry of Ocean and Fisheries of Korea. Coastal Improvement Project Design Guidebook of 2010, MOF Report; Ministry of Ocean and Fisheries of Korea: Sejong City, Korea, 2010. [Google Scholar]
- Kim, H.D.; Aoki, S.-I.; Kim, K.H.; Kim, J.; Shin, B.-S.; Lee, K. Bathymetric Survey for Seabed Topography using Multibeam Echo Sounder in Wando, Korea. J. Coast. Res. 2020, 95, 527–531. [Google Scholar] [CrossRef]
- Krumbein, W.C. Size Frequency Distributions of Sediments. J. Sediment. Res. 1934, 4, 65–77. [Google Scholar] [CrossRef]
- Romana, E.; Mangno, M.C.; Bergamin, L. Grain Size Data Analysis of Marine Sediments, From Sampling to Measuring and Classifying. A Critical Review. In Proceedings of the IMEKO International Conference on Metrology for the Sea, Naples, Italy, 11–13 October 2017; pp. 173–178. [Google Scholar]
- Arguilar, M.A.; Saldana, M.; Aguilar, F.J.; Lorca, G. Comparing Geometric and Radiometric information from GeoEye-1 and WorldView-2 Multispectral Imagery. Eur. J. Remote Sens. 2017, 47, 717–738. [Google Scholar] [CrossRef]
- Watanabe, A.; Maruyama, K. Numerical Analysis of Combined Refraction, Diffraction and Breaking. In Proceedings of the Conference on Coastal Engineering, Hamburg, Germany, 31 August–5 September 1984; pp. 103–107. [Google Scholar]
- Deguchi, I.; Arita, M.; Yoshii, T.; Yabusaki, H. Generation of rip currents from single disturbance in bottom topography. In Proceedings of the The Eighteenth International Offshore and Polar Engineering Conference, ISOPE-I-08-093, Vancouver, BC, Canada, 6–11 July 2008. [Google Scholar]
- Kim, K.H.; Shin, S.; Widayati, A.Y.W. Mitigation Measures for Beach Erosion and Rip Current. J. Coast. Res. 2013, 65, 290–295. [Google Scholar] [CrossRef]
- Schmidt, W.E.; Woodward, B.T.; Millikan, K.S.; Guza, R.T.; Raubenheimer, B.; Elgar, S. A GPS-tracked Surf Zone Drifter. J. Atmos. Ocean. Technol. 2003, 20, 1069–1075. [Google Scholar] [CrossRef]
- Booij, N.; Holthuijsen, L.H.; Ris, R.C. The SWAN Wave Model for Shallow Water. In Proceedings of the 25th International Conference on Coastal Engineering, Orlando, FL, USA, 2–6 September 1996; pp. 668–676. [Google Scholar]
- Mei, C.C. The Applied Dynamics of Ocean Surface Waves. J. Fluid Mech. 1983, 151, 498–501. [Google Scholar] [CrossRef]
- Korea Hydrographic and Oceanographic Agency. Realtime Wave Observation Data. Available online: www.khoa.go.kr (accessed on 30 May 2021).
- Leatherman, S.B.; Leatherman, S.P. Techniques for detecting and measuring rip currents. Int. J. Earth Sci. Geophys. 2017, 3, 014. [Google Scholar] [CrossRef]
- Persson, M. Accurate Dye Tracer Concentration Estimations Using Image Analysis. Soil Sci. Soc. Am. J. 2005, 69, 967–975. [Google Scholar] [CrossRef]
| Publisher’s Note: MDPI stays neutral with regard to jurisdictional claims in published maps and institutional affiliations. |
© 2021 by the authors. Licensee MDPI, Basel, Switzerland. This article is an open access article distributed under the terms and conditions of the Creative Commons Attribution (CC BY) license (https://creativecommons.org/licenses/by/4.0/).
