
Analysis of Sub-Daily Precipitation for the PannEx Region


 , ,
, ,  ,
,
Abstract
:1. Introduction
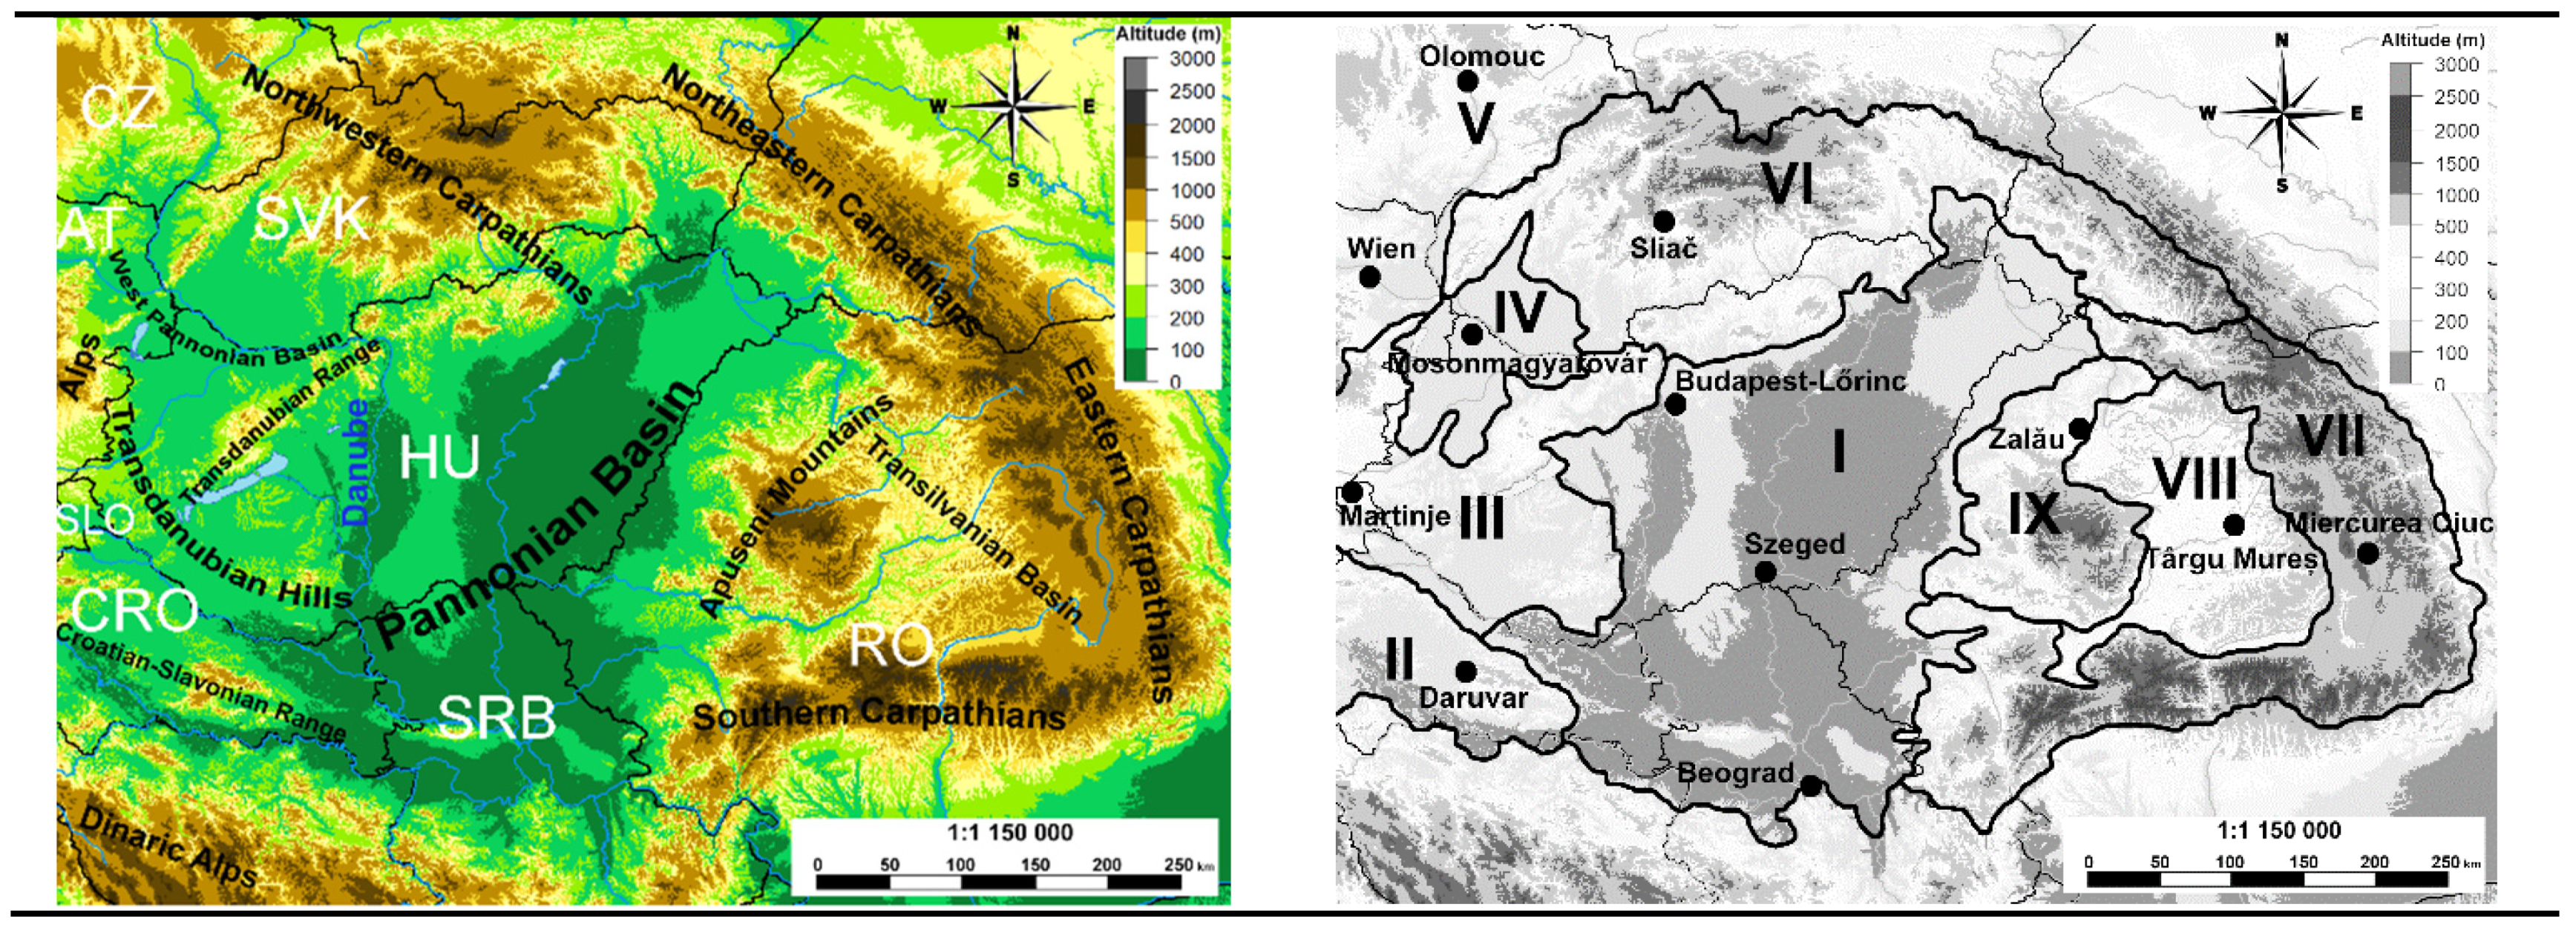
2. Area in Focus
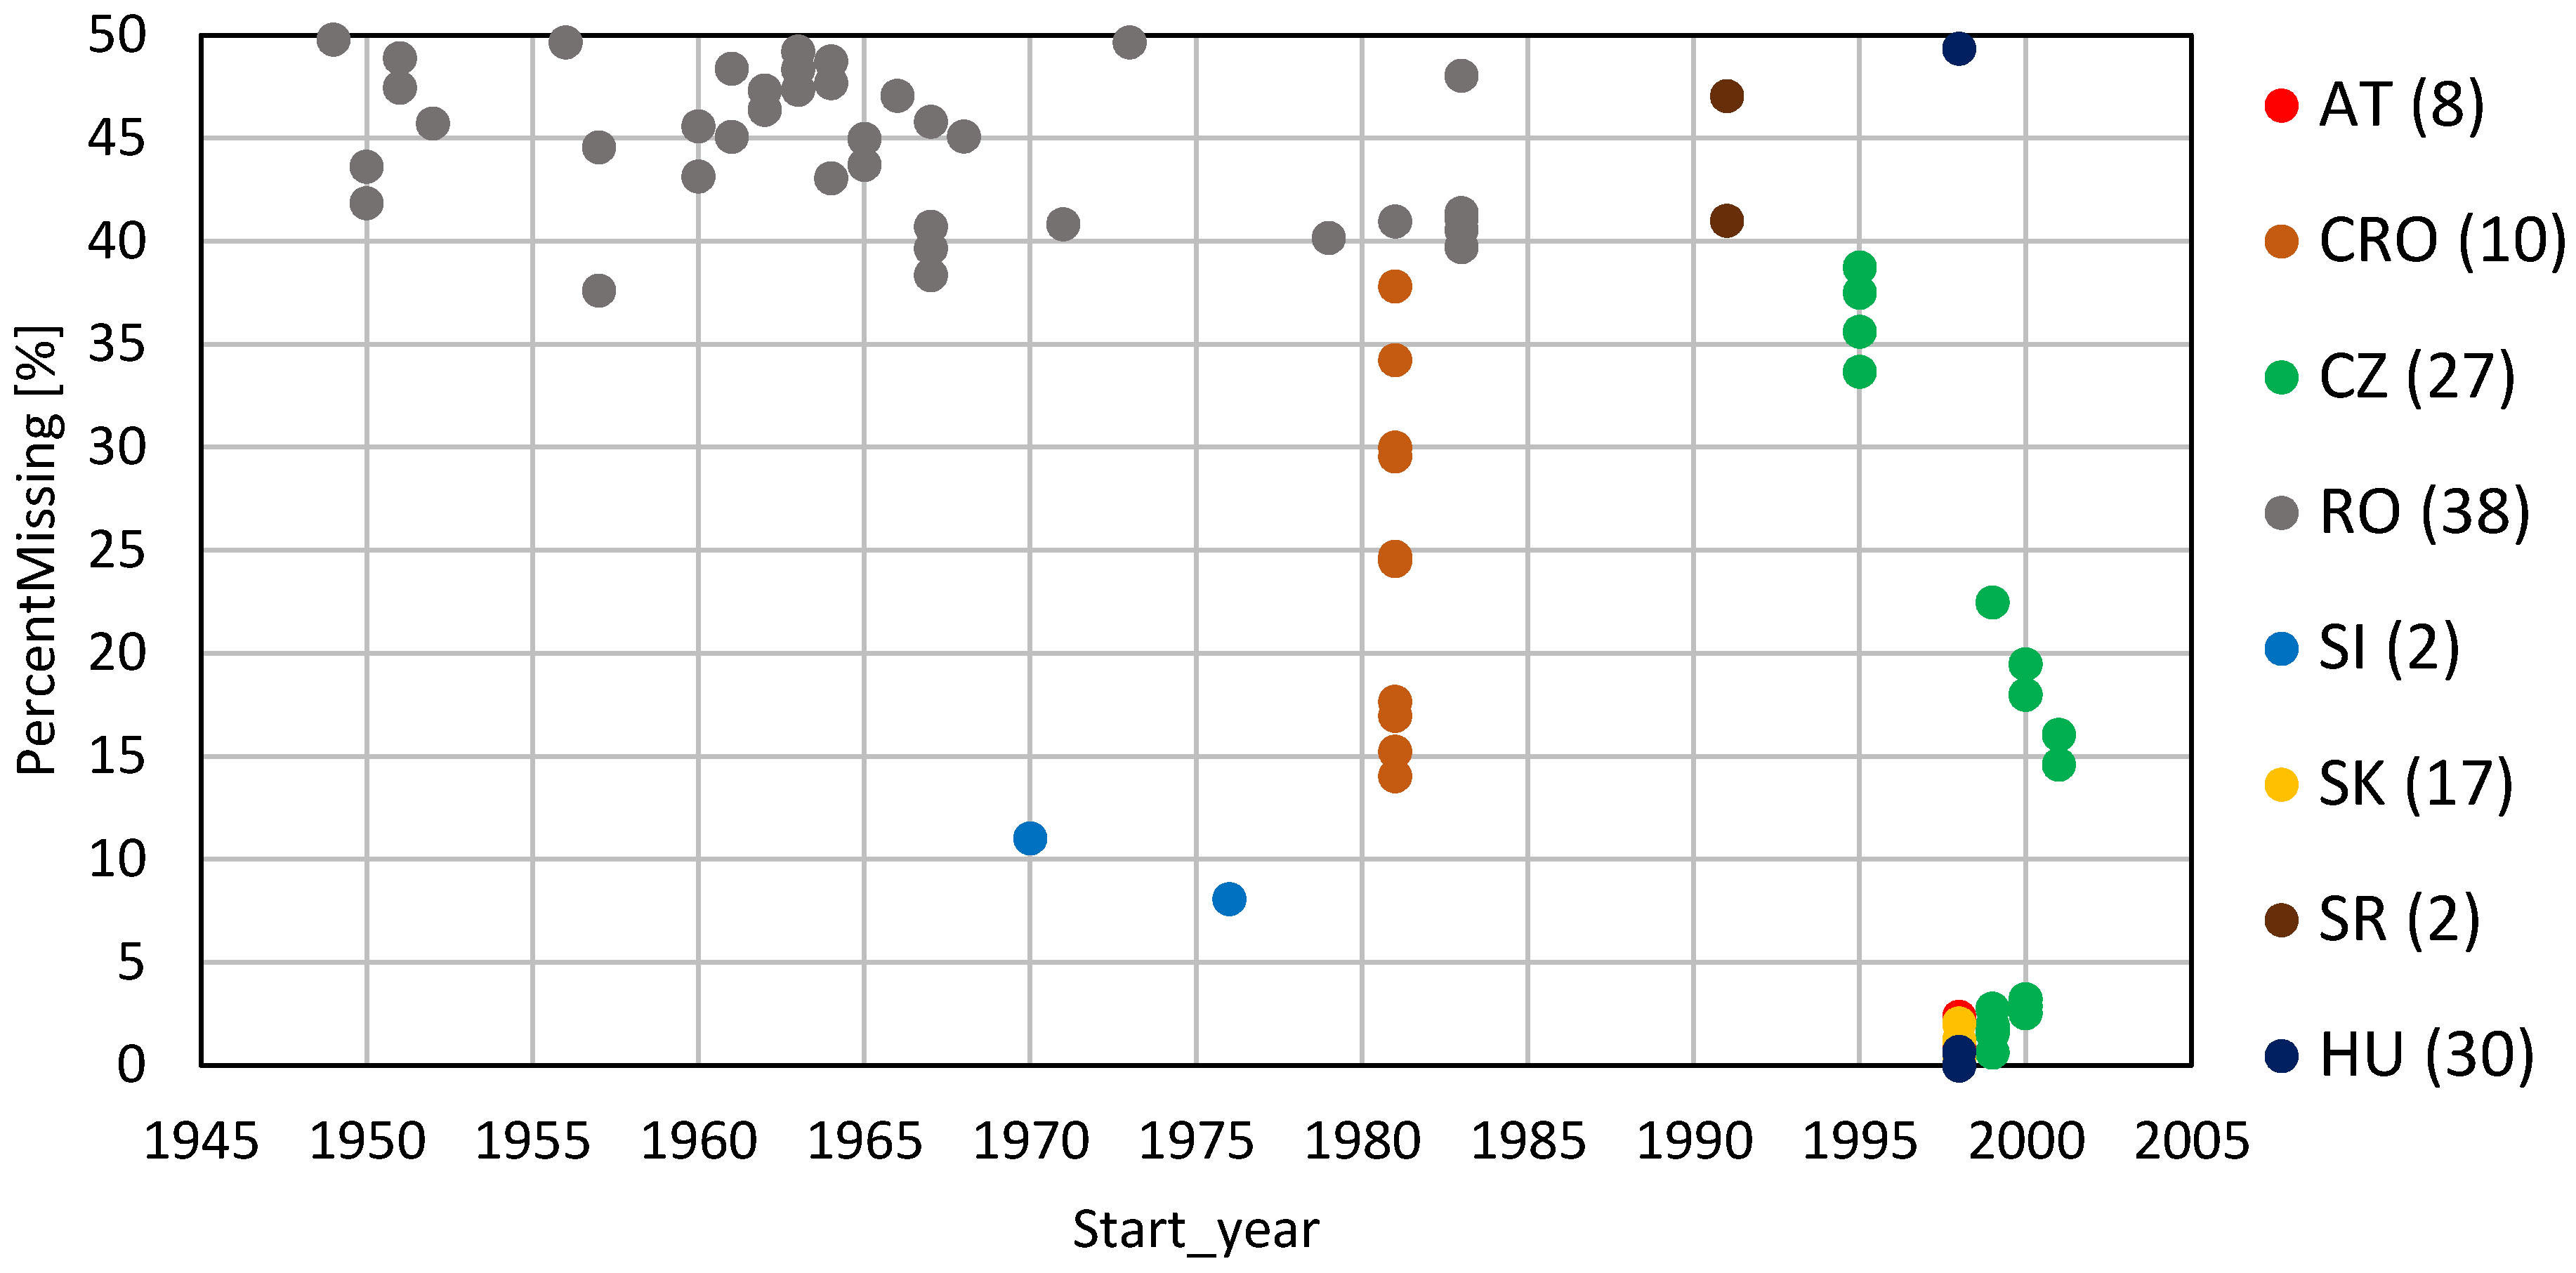
3. Data
4. Methods
4.1. The Commonly Used Software: INDICES
4.2. The Selected Indices and Applied Statistics
5. Results and Discussion
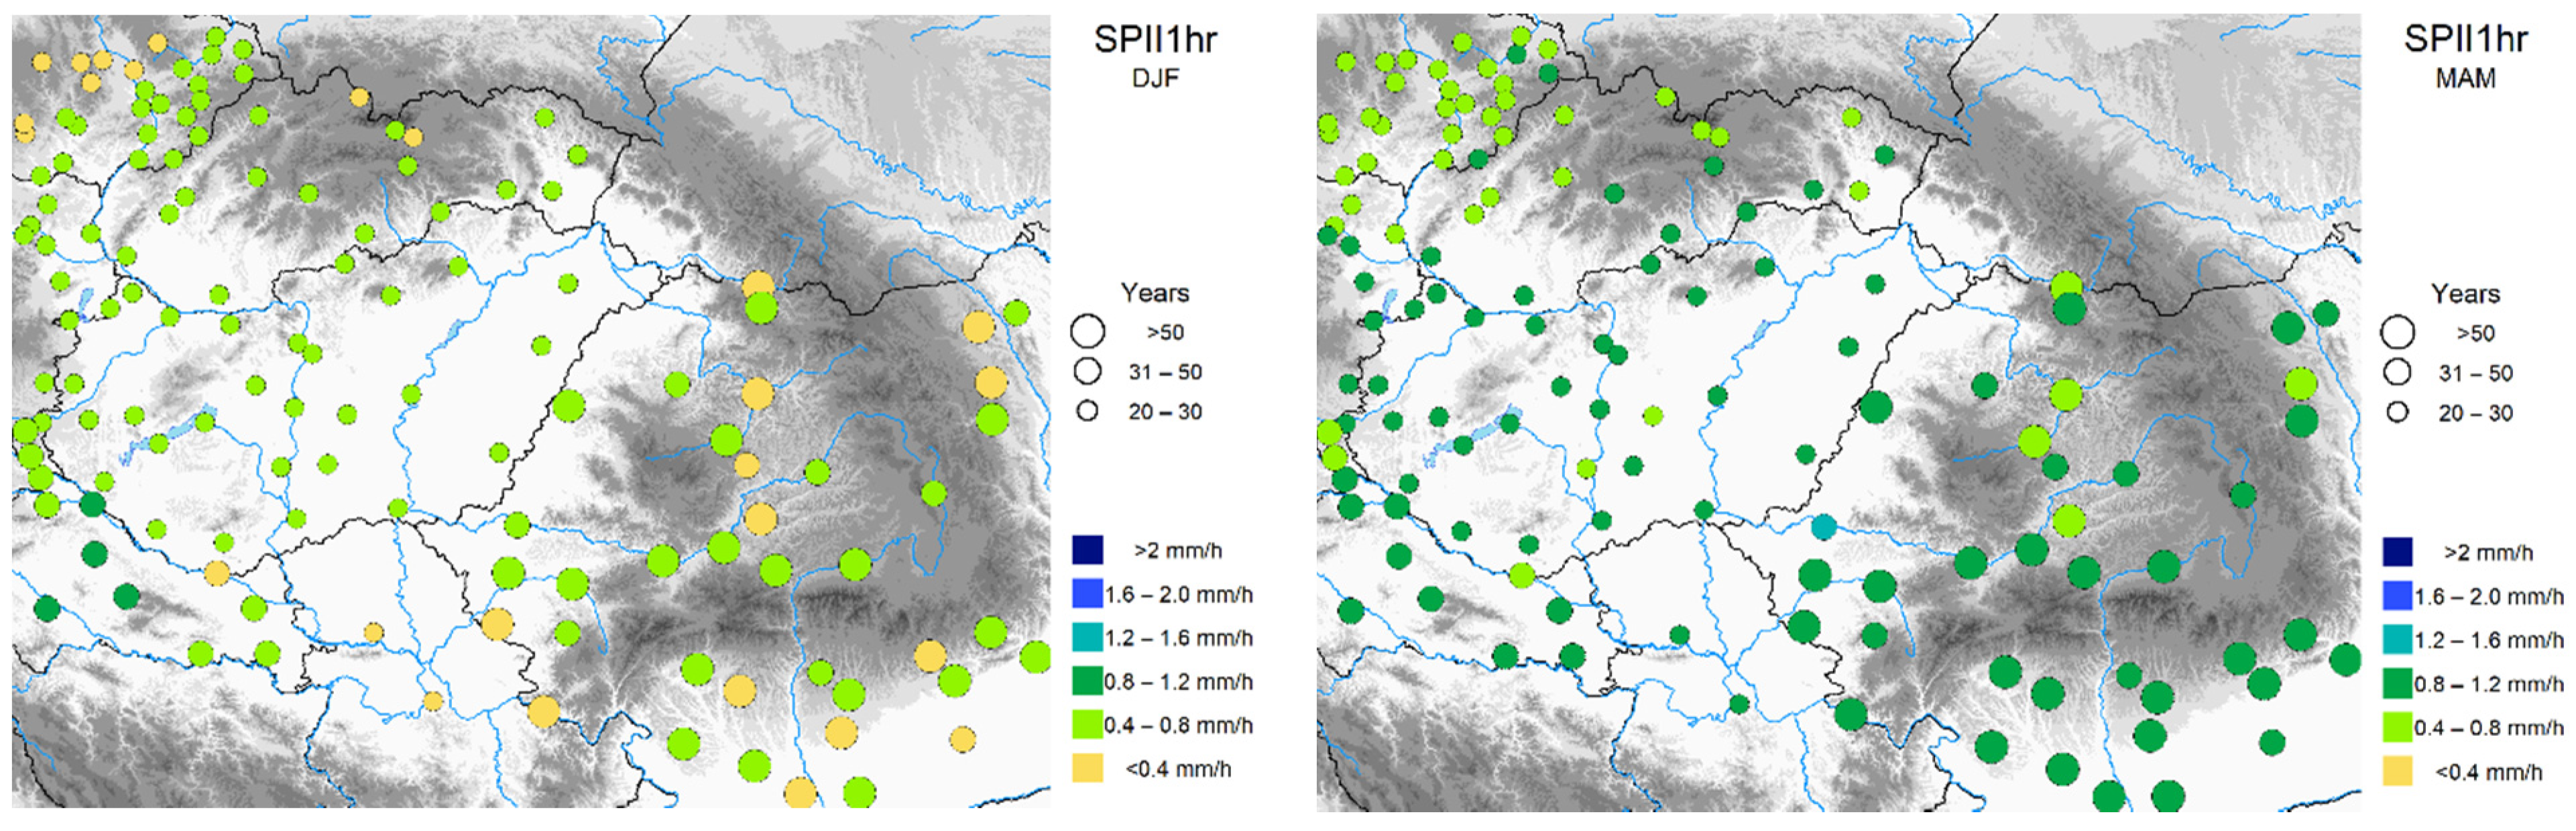
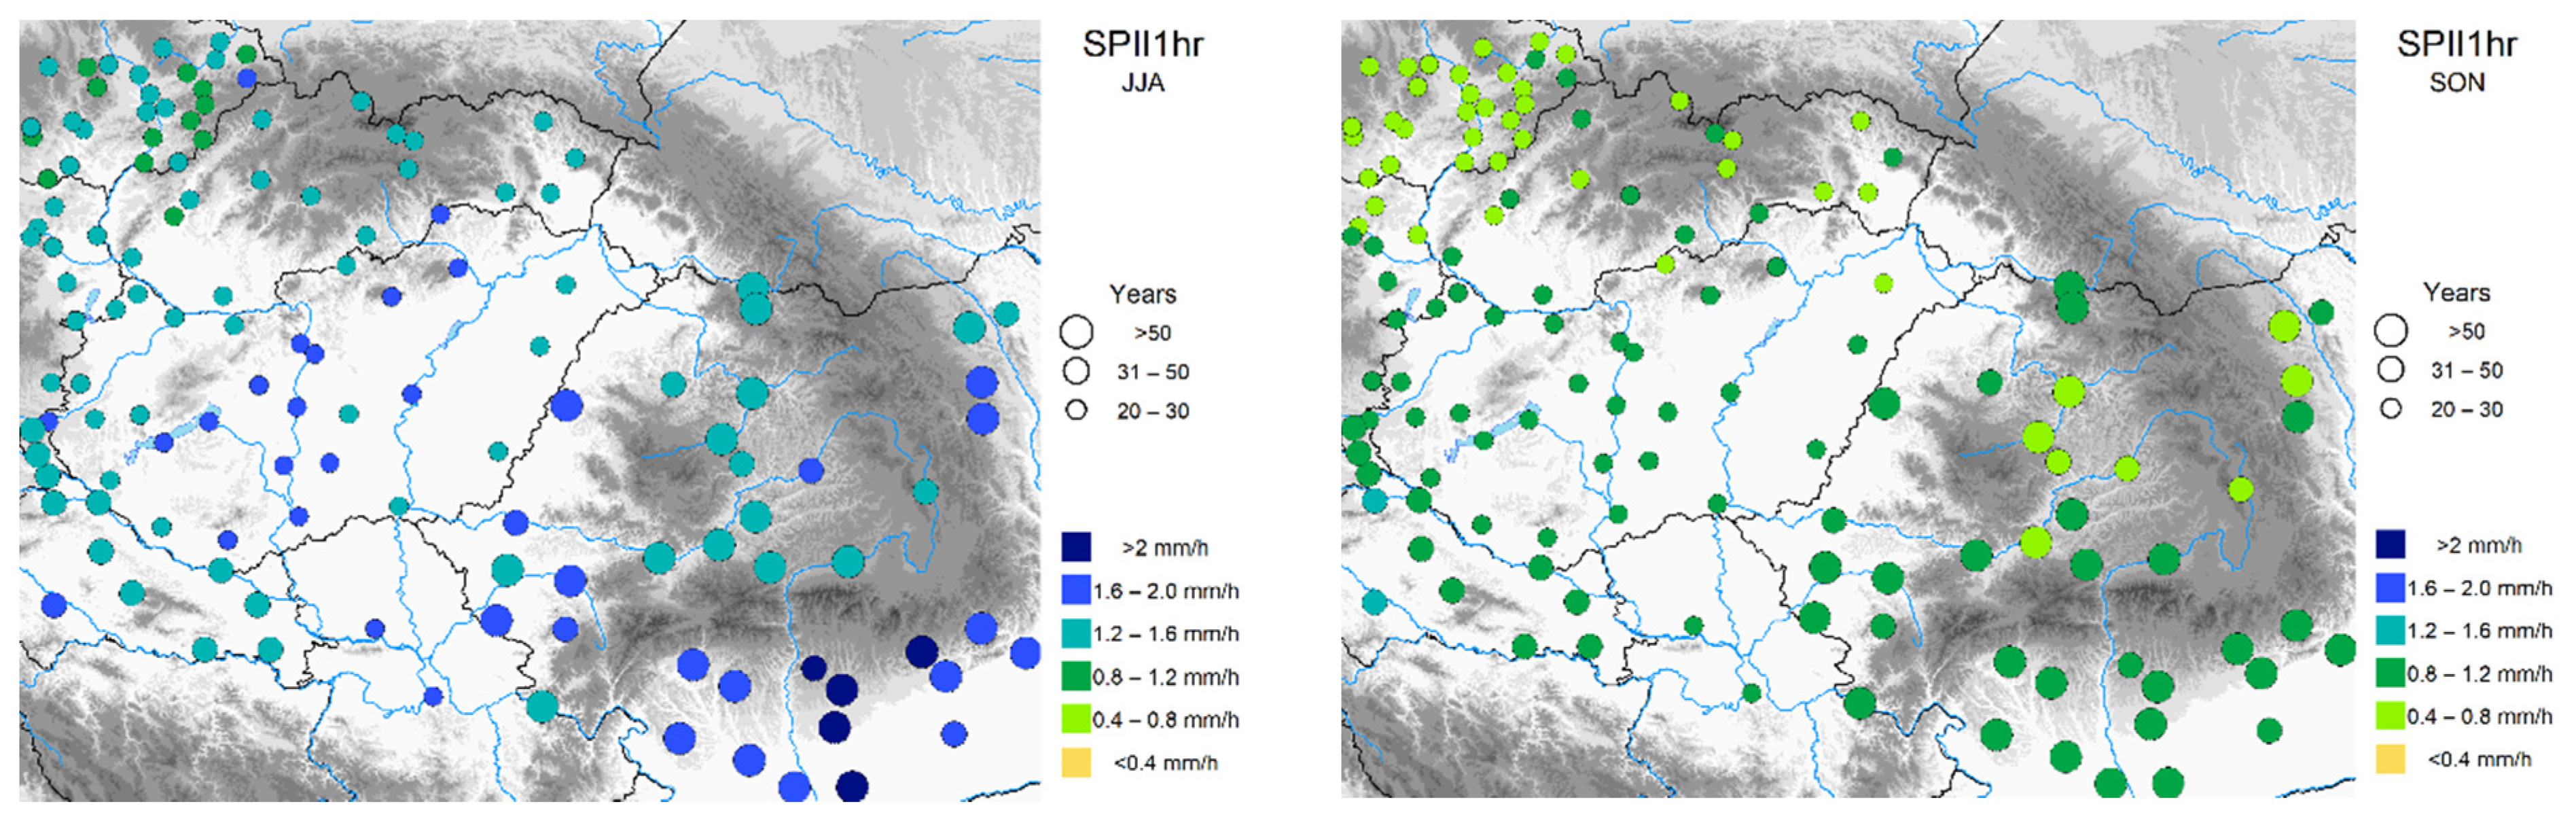
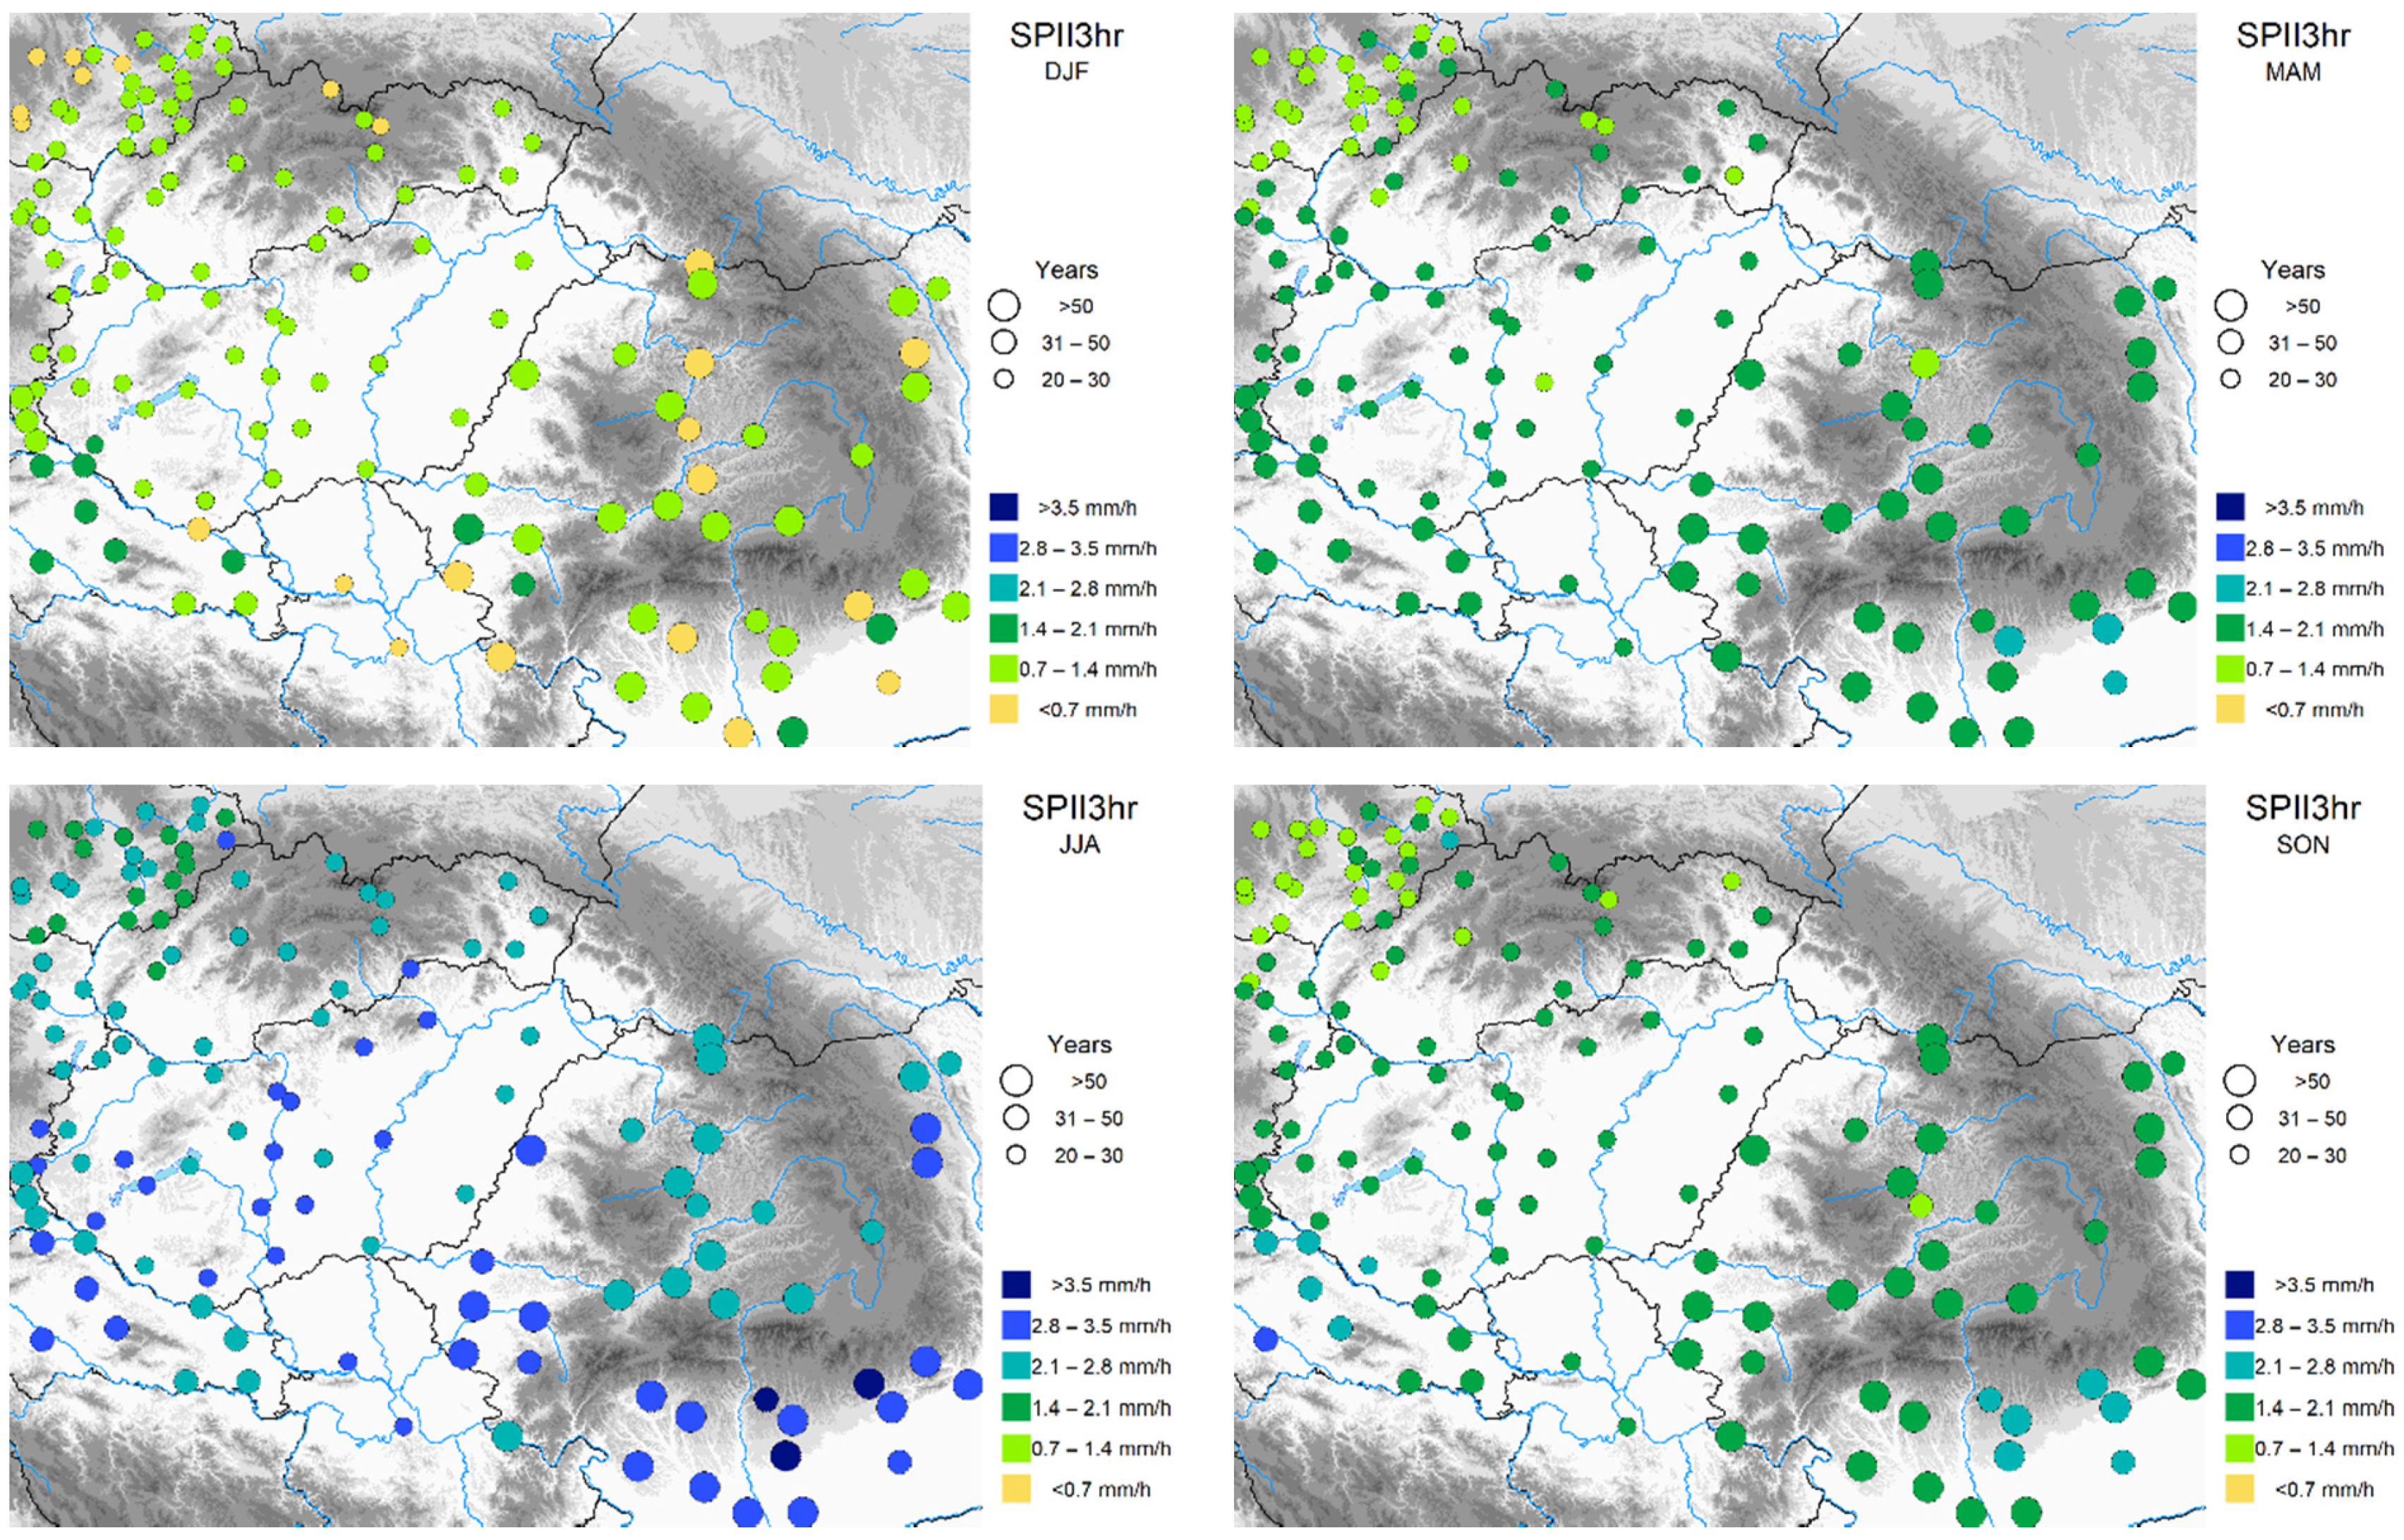
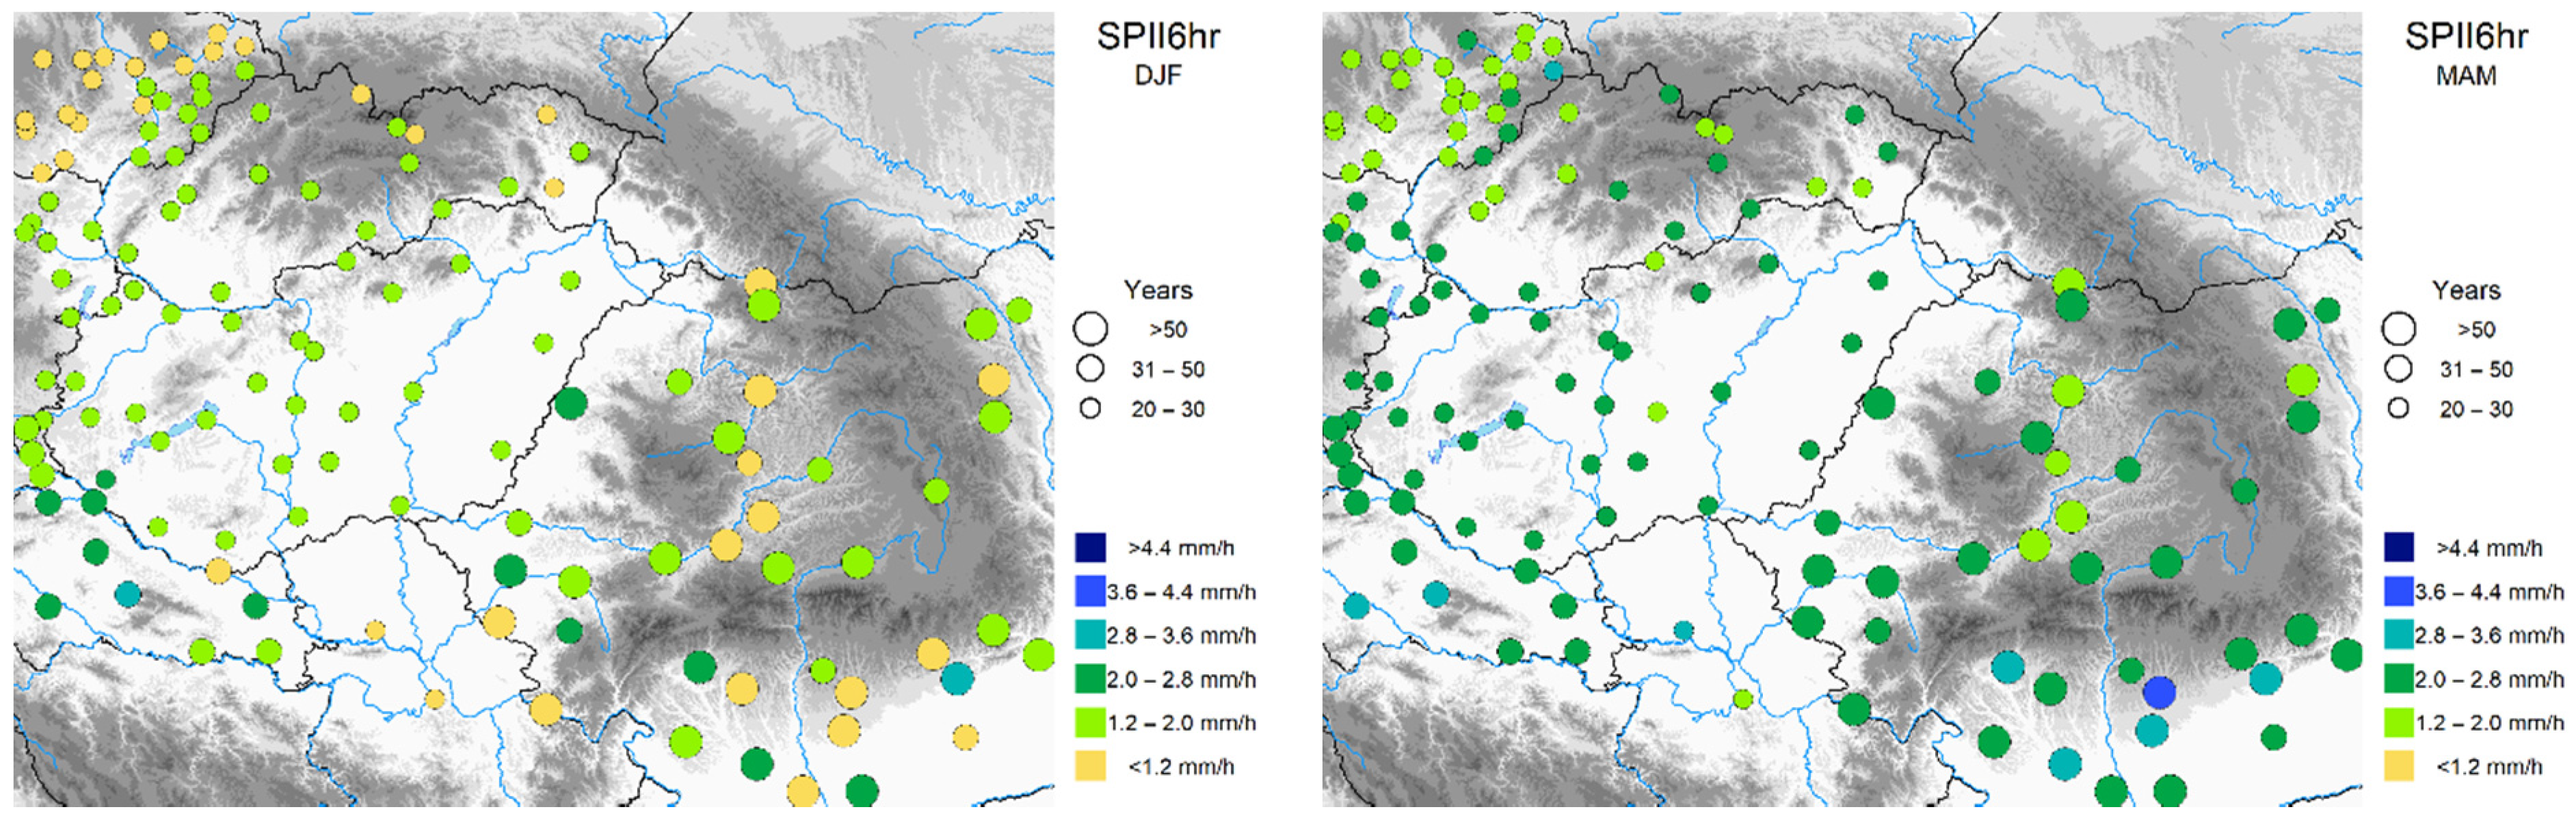
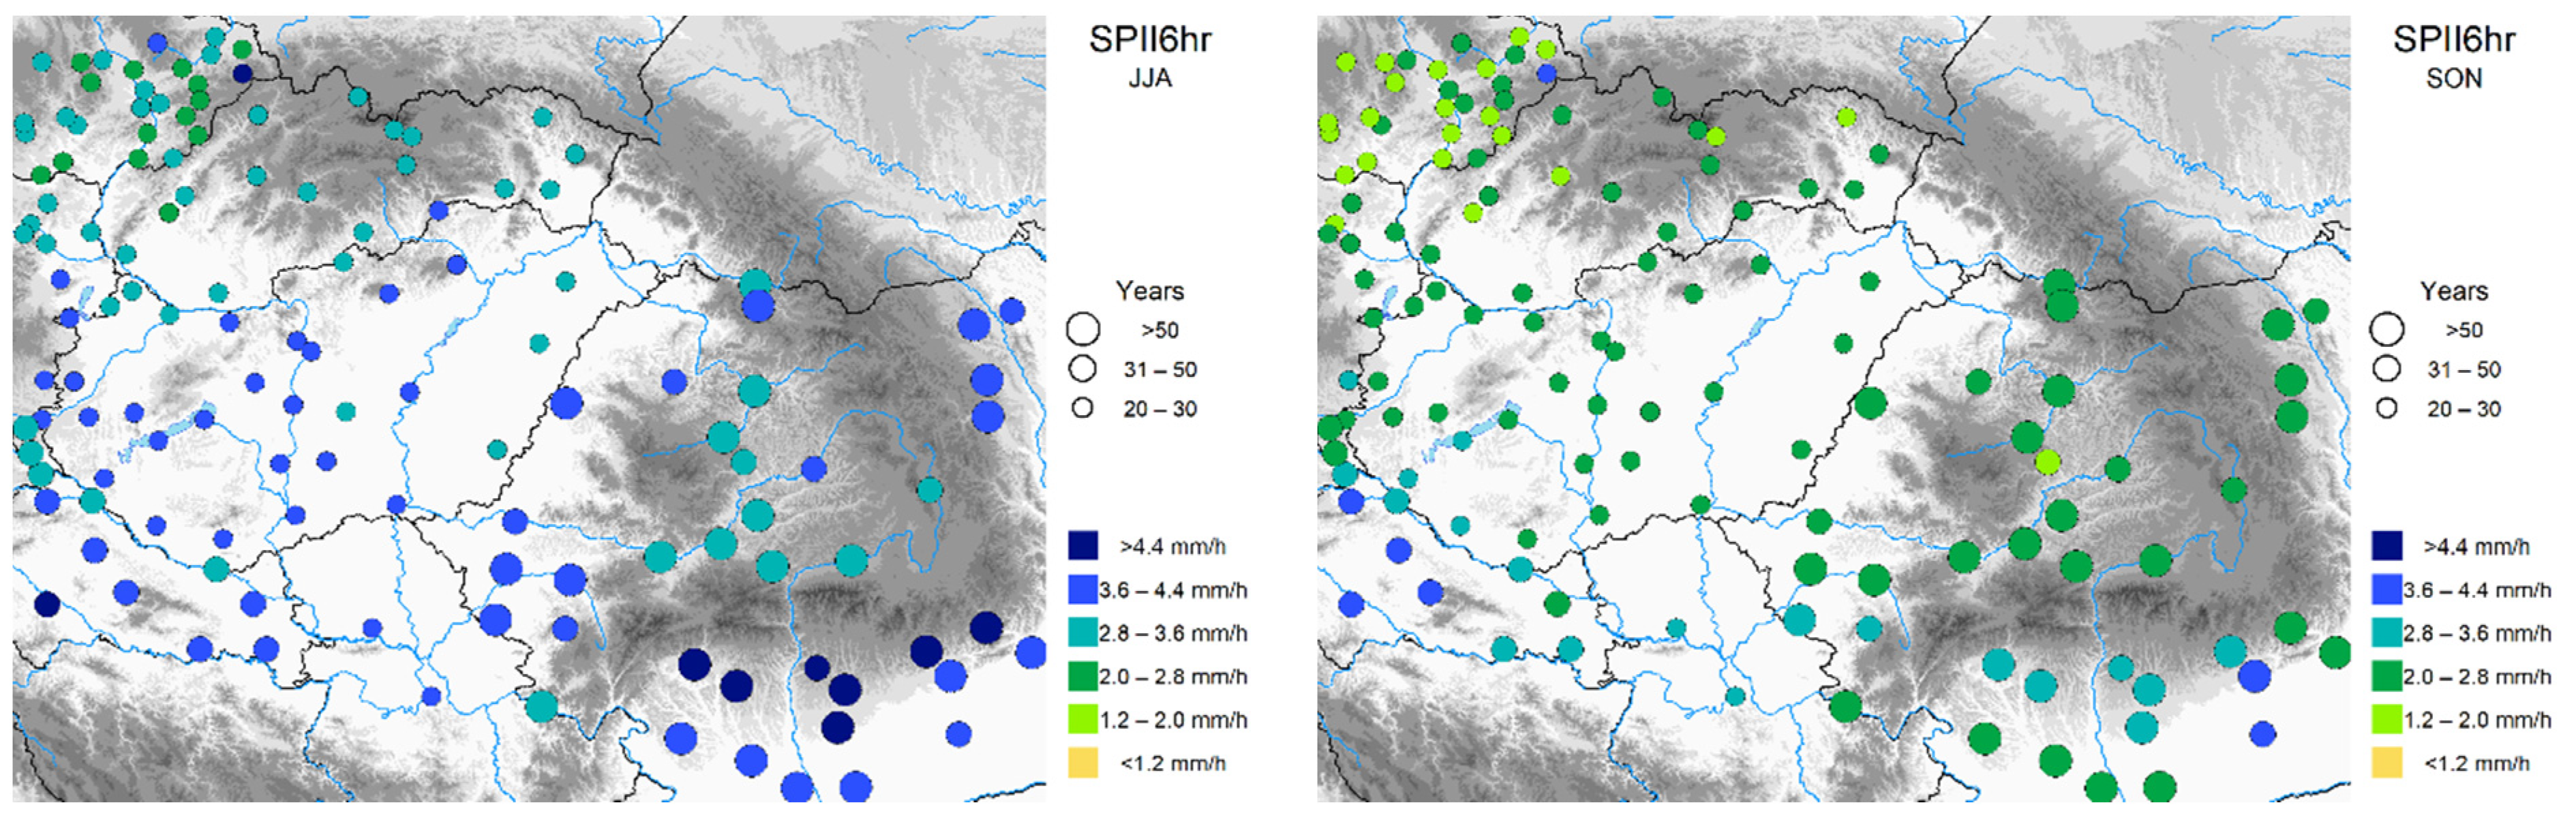
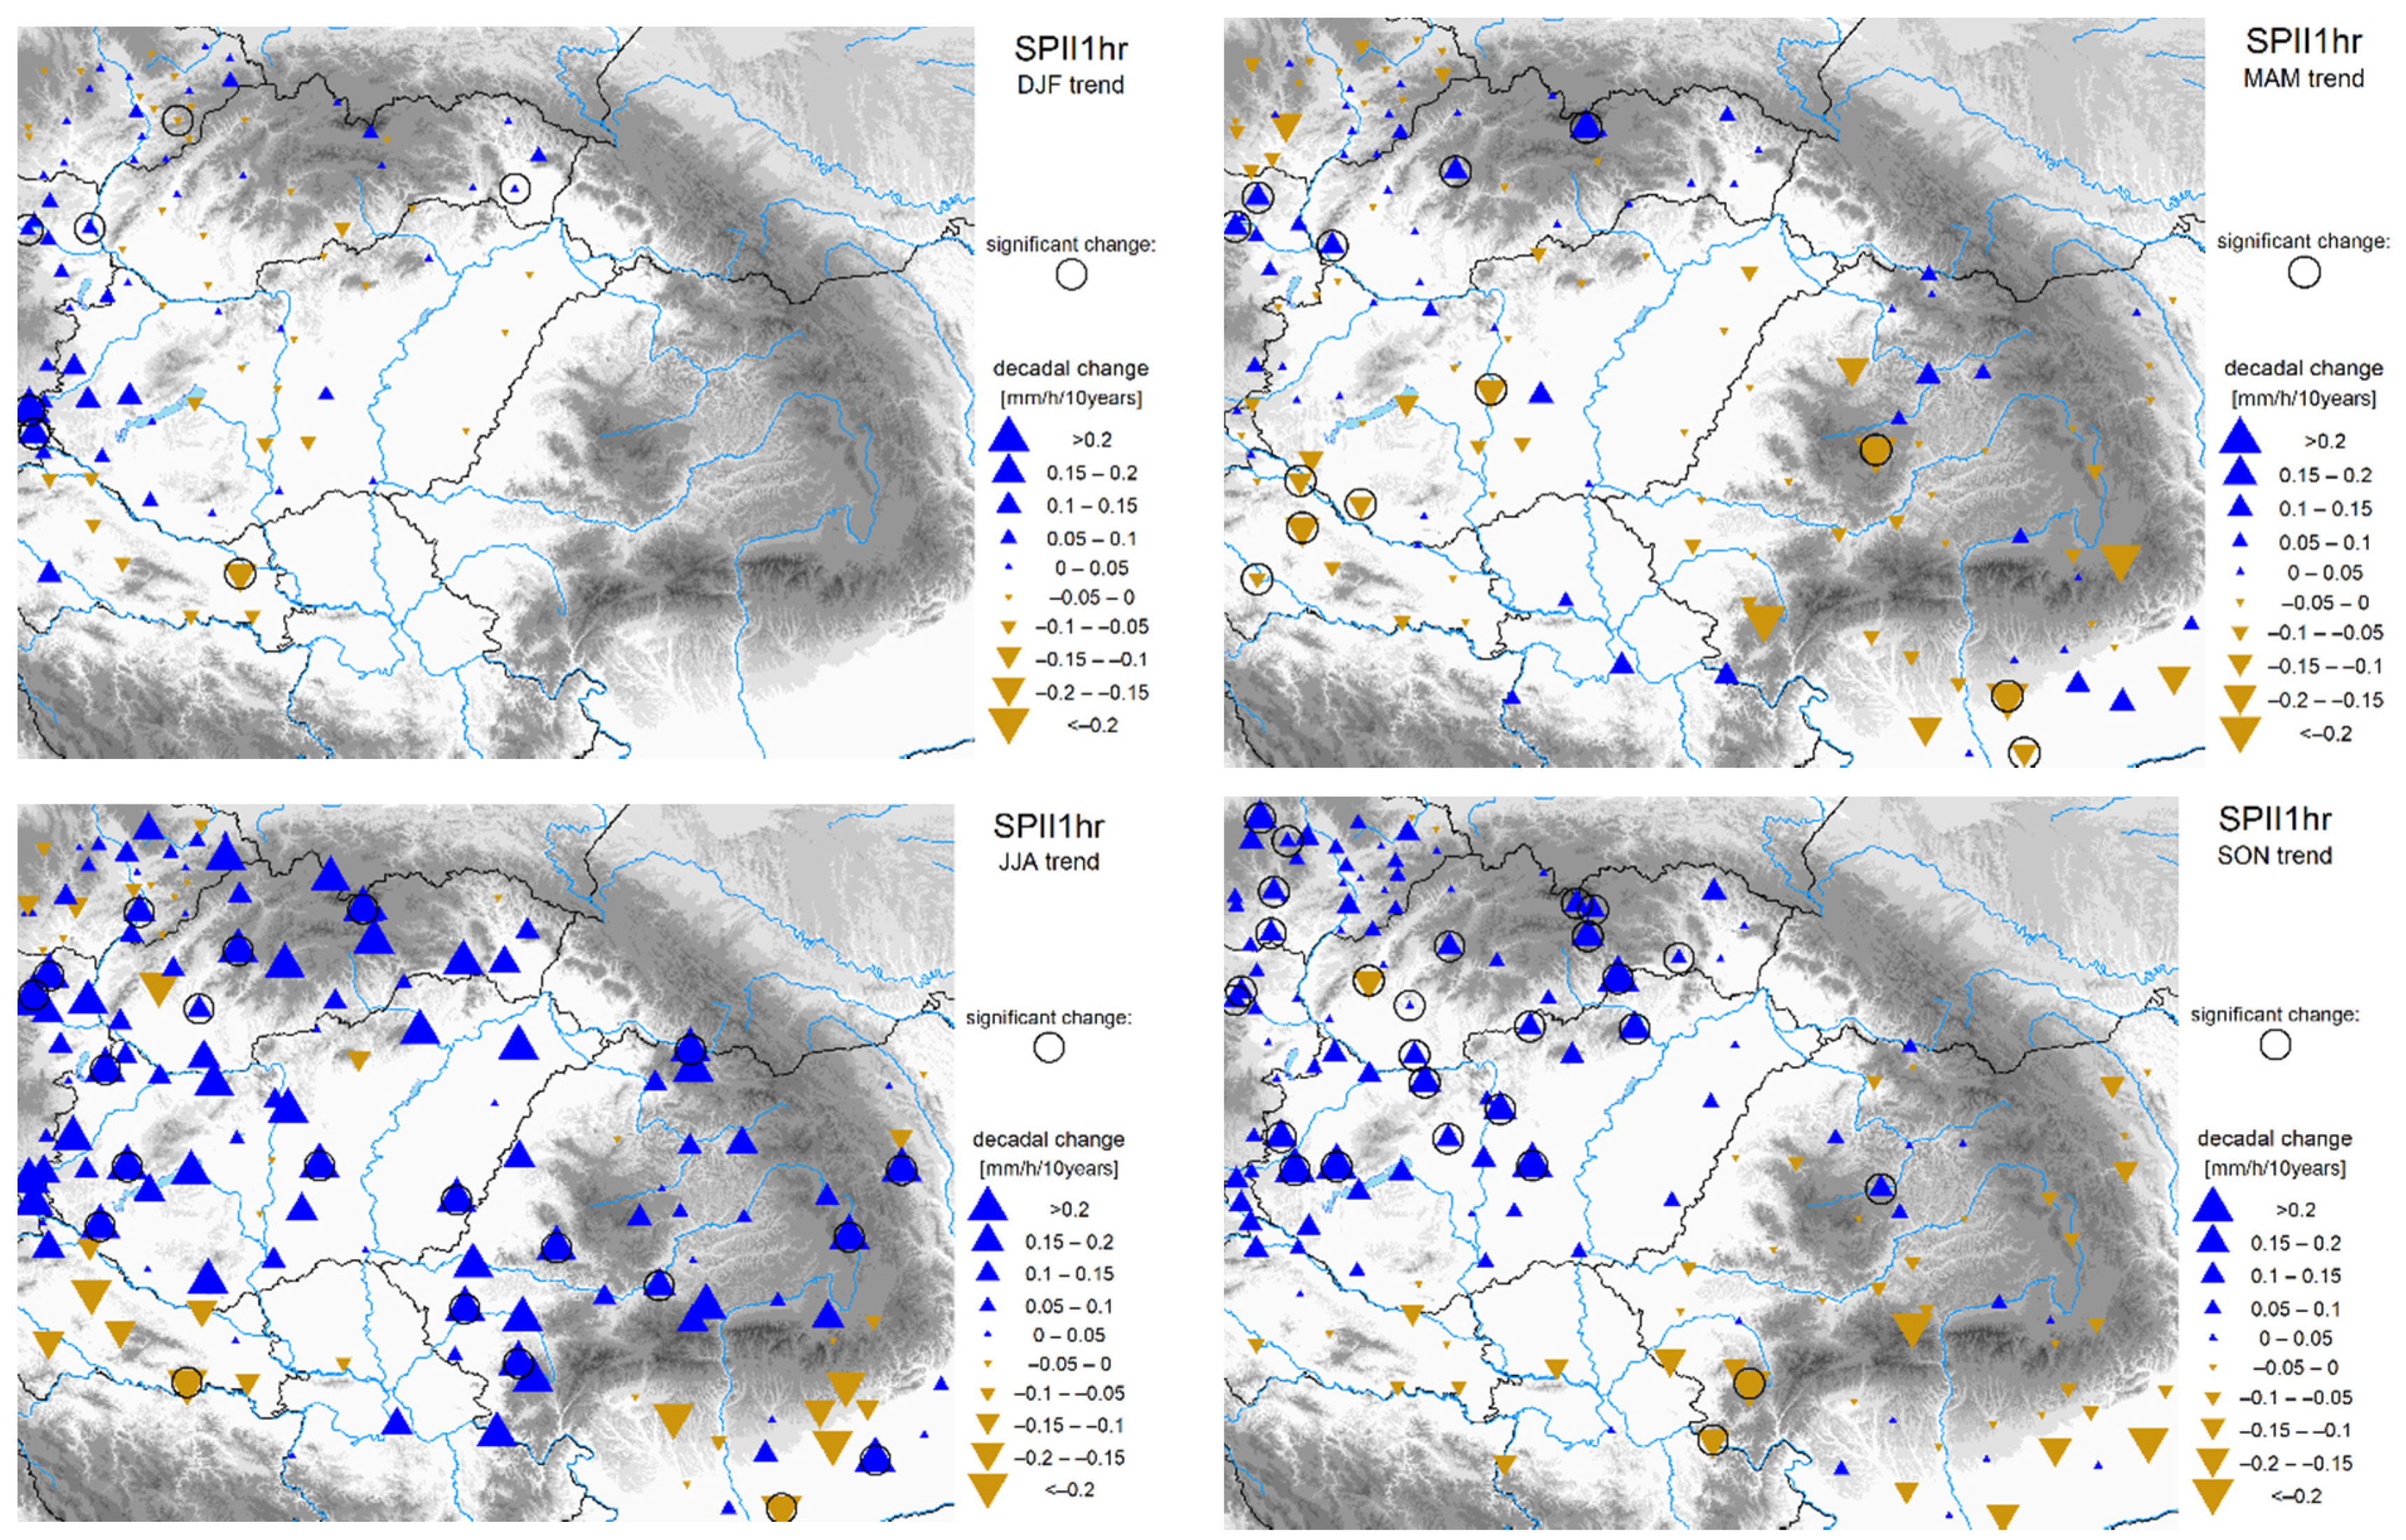
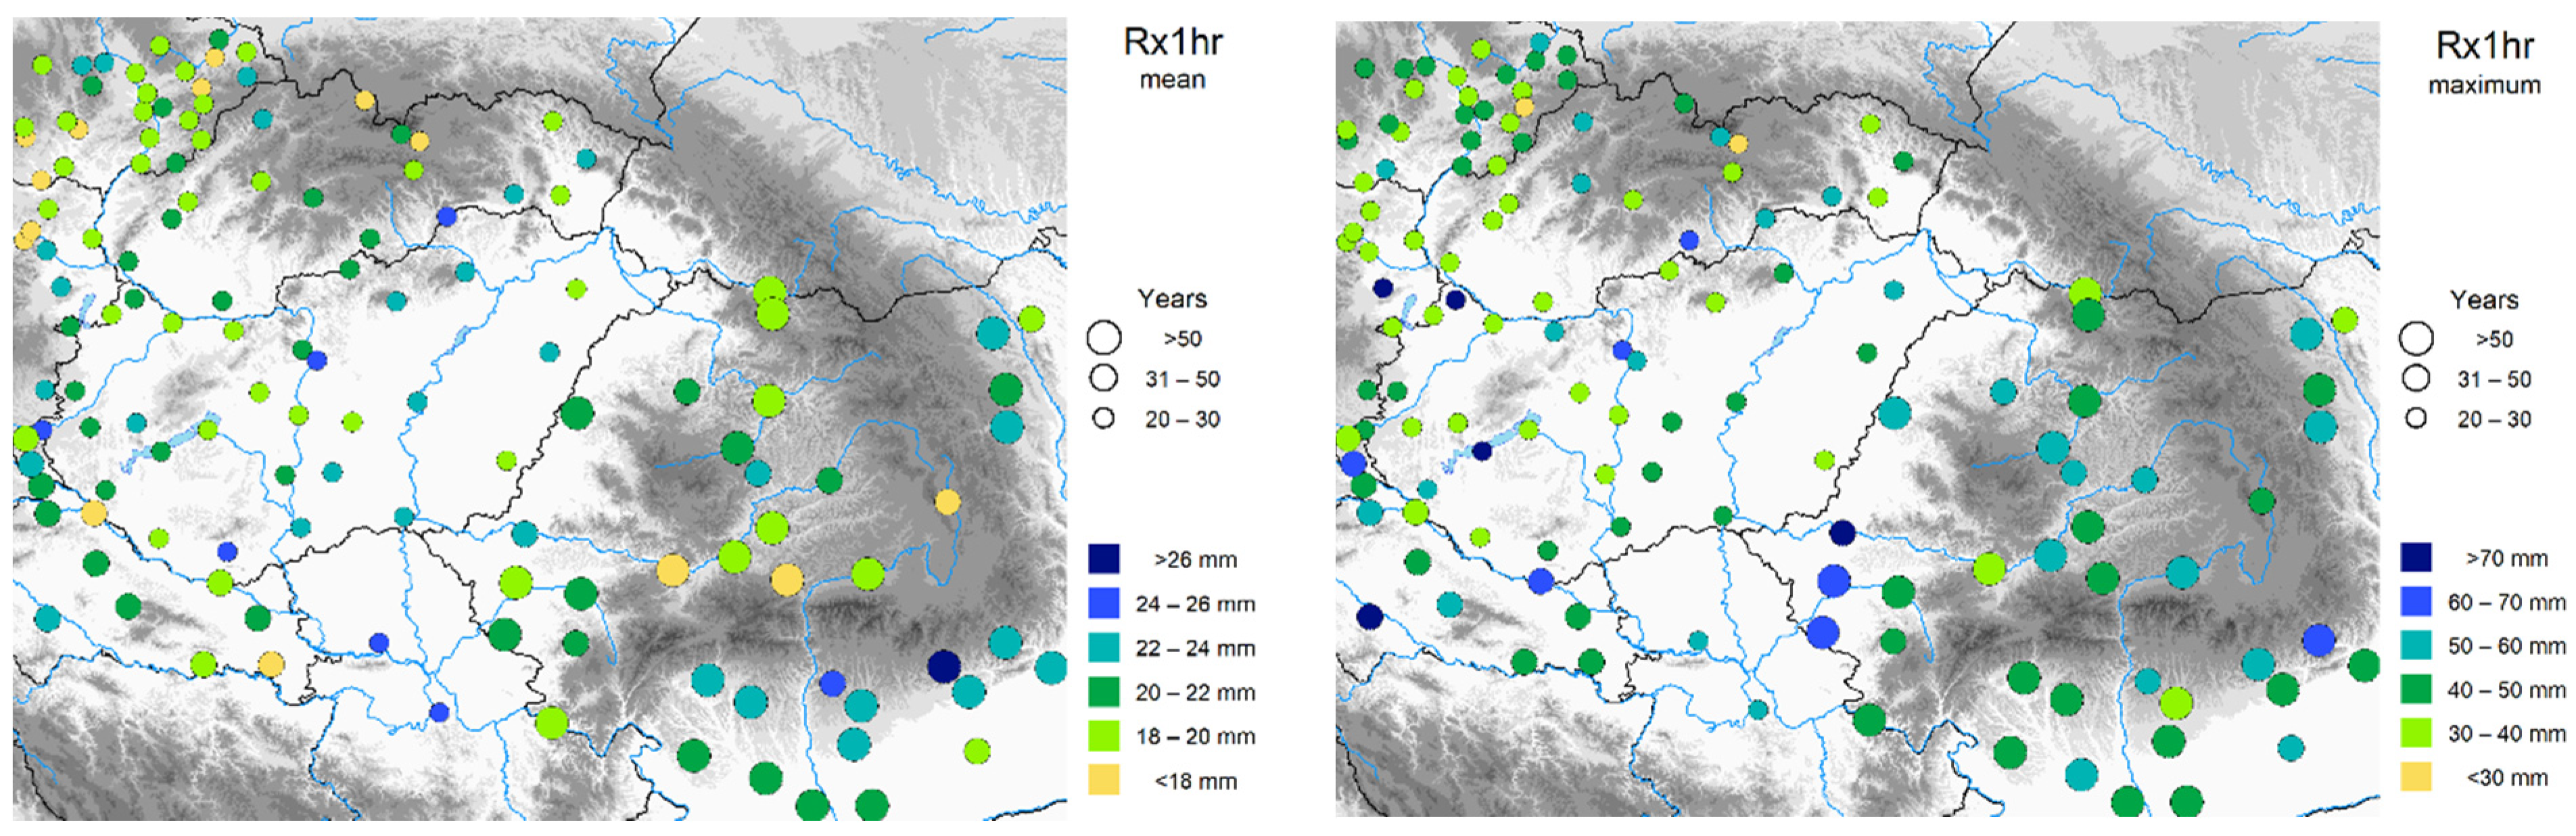
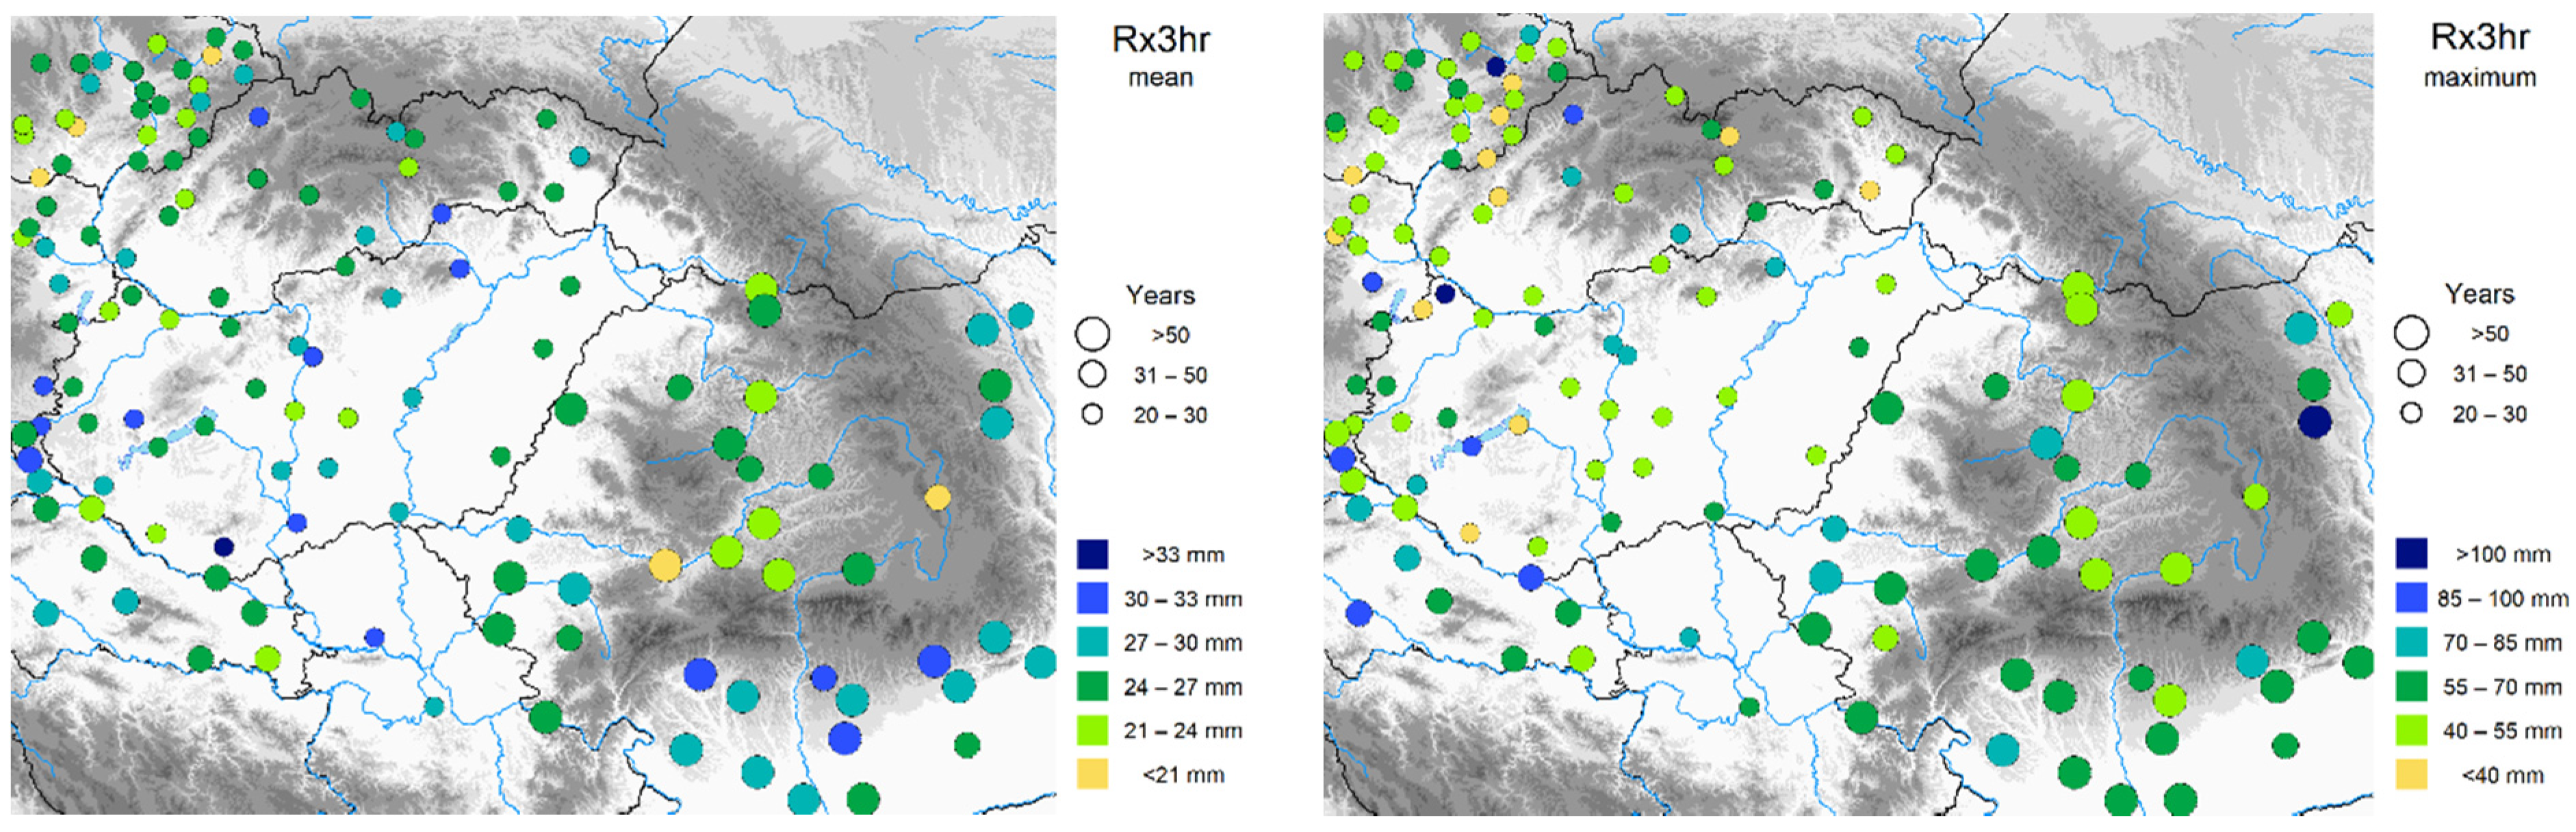
5.1. Spatial and Temporal Pattern of Sub-Daily Precipitation Indices
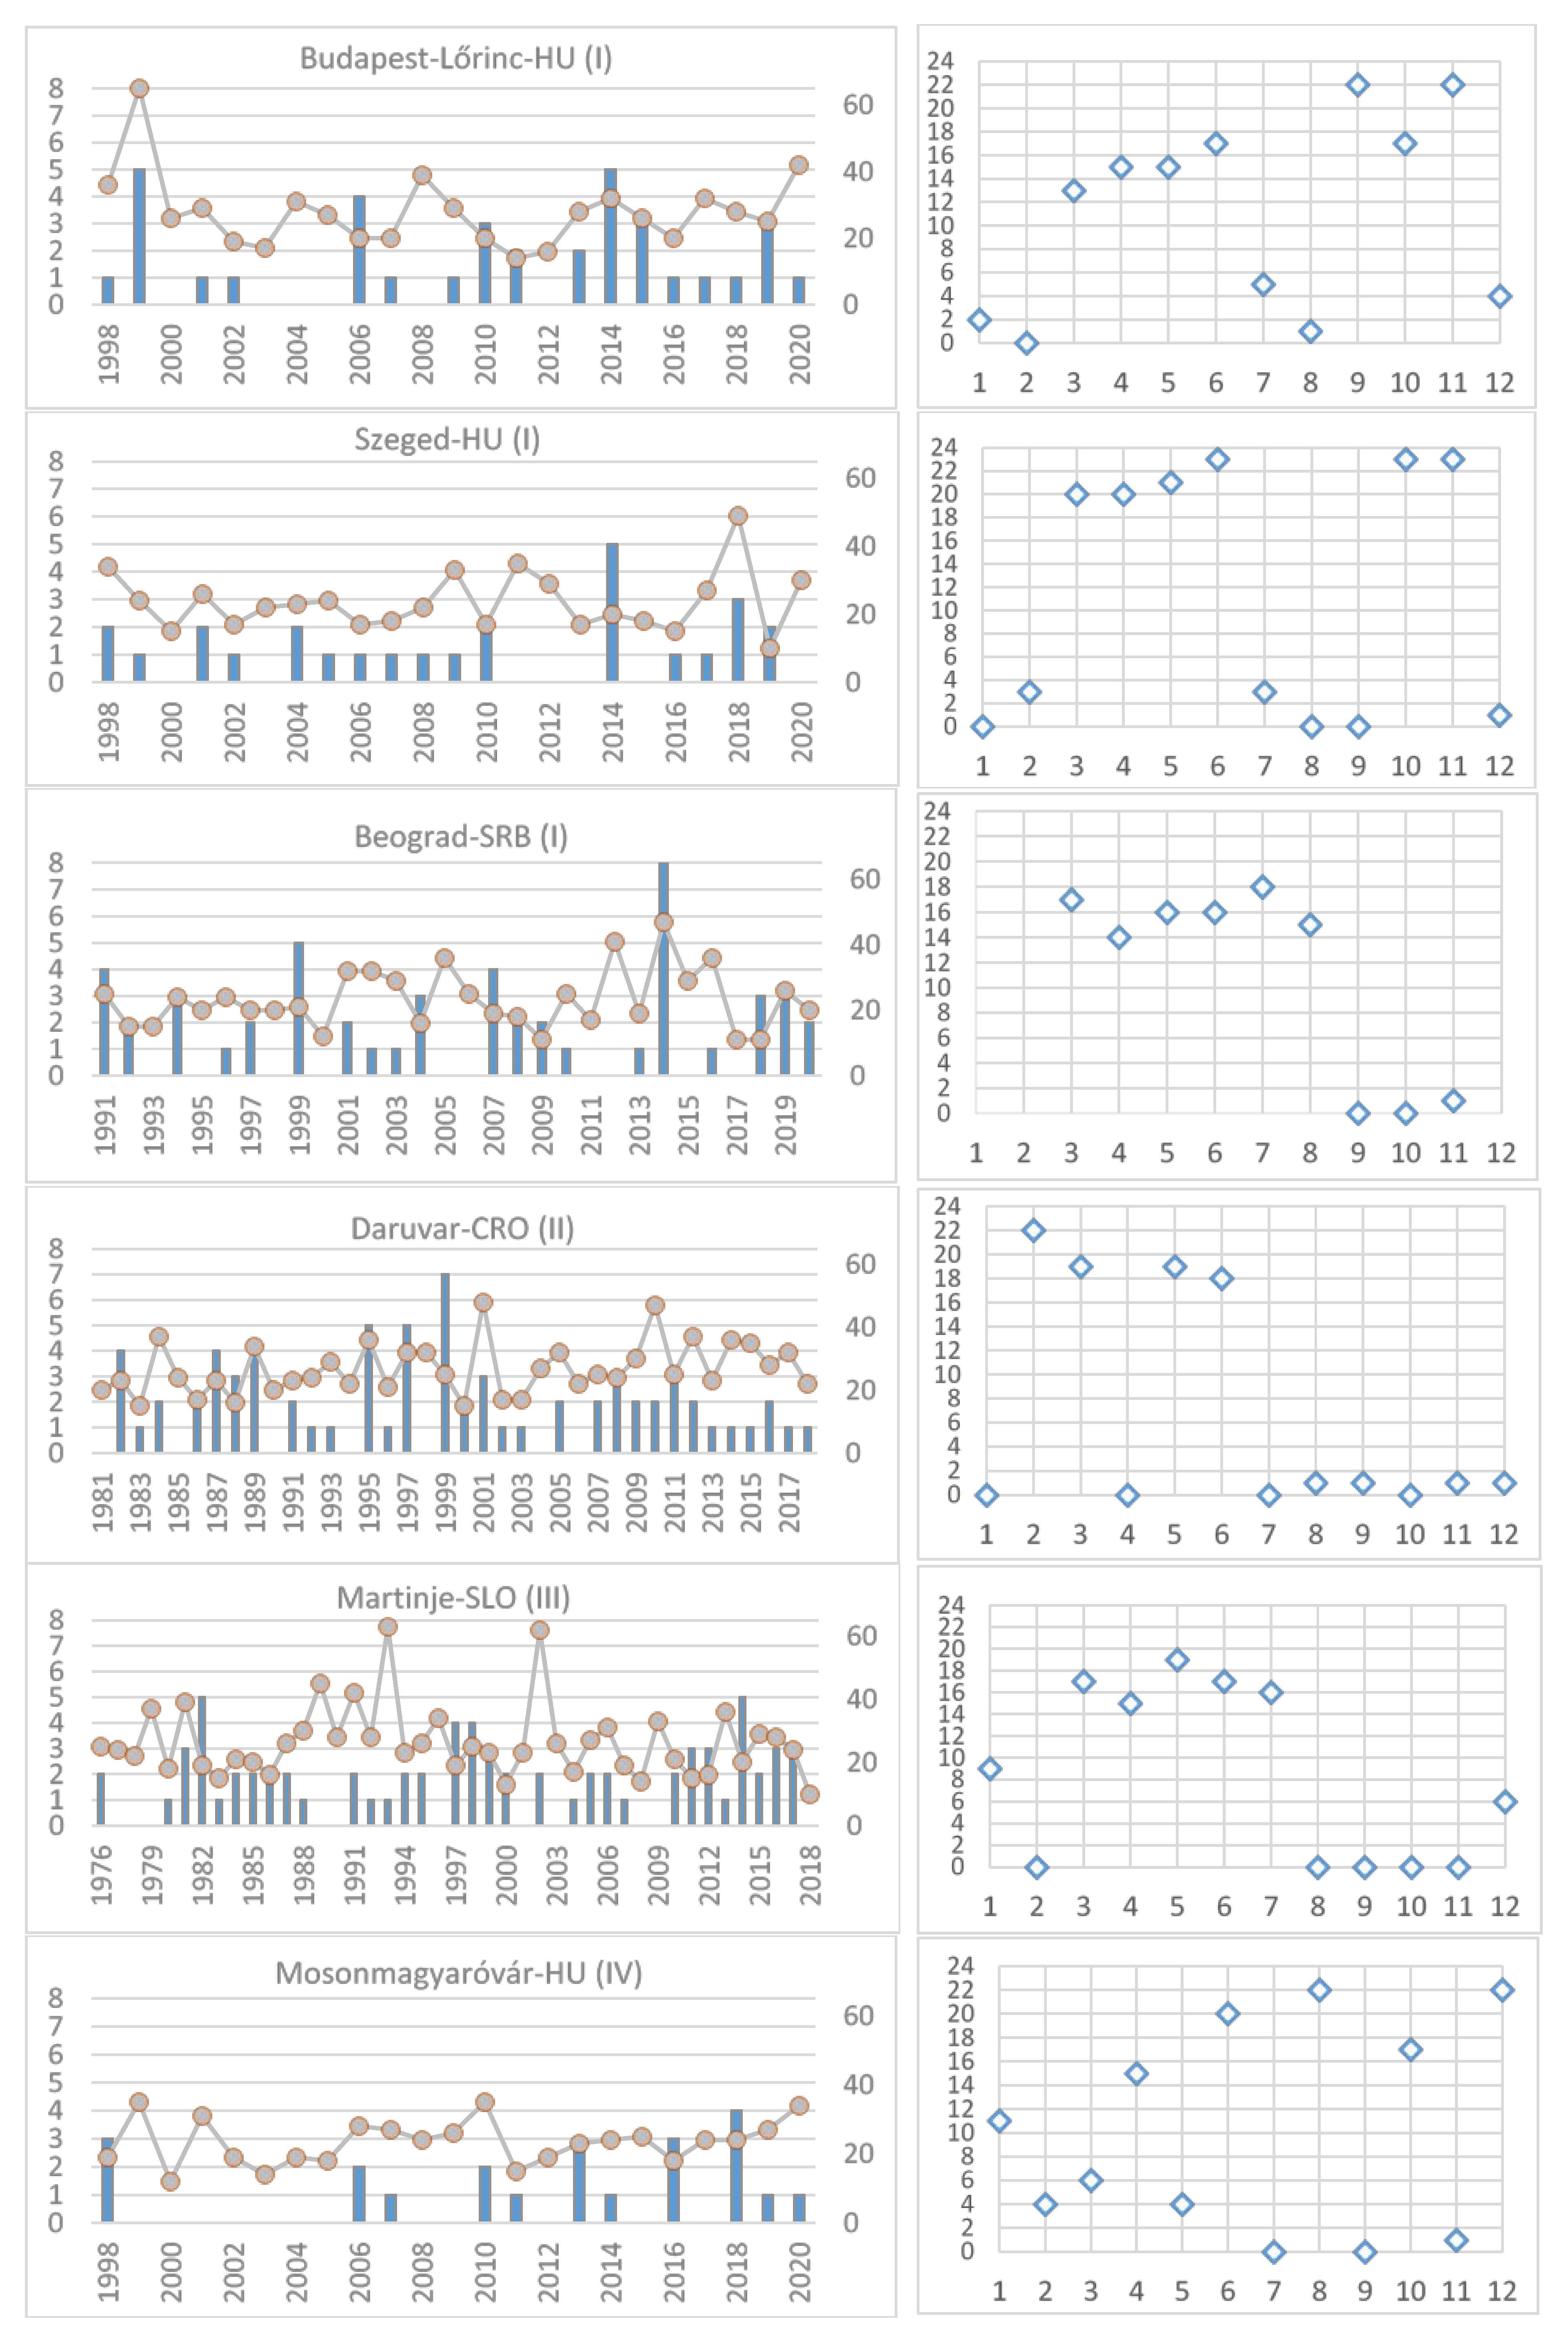
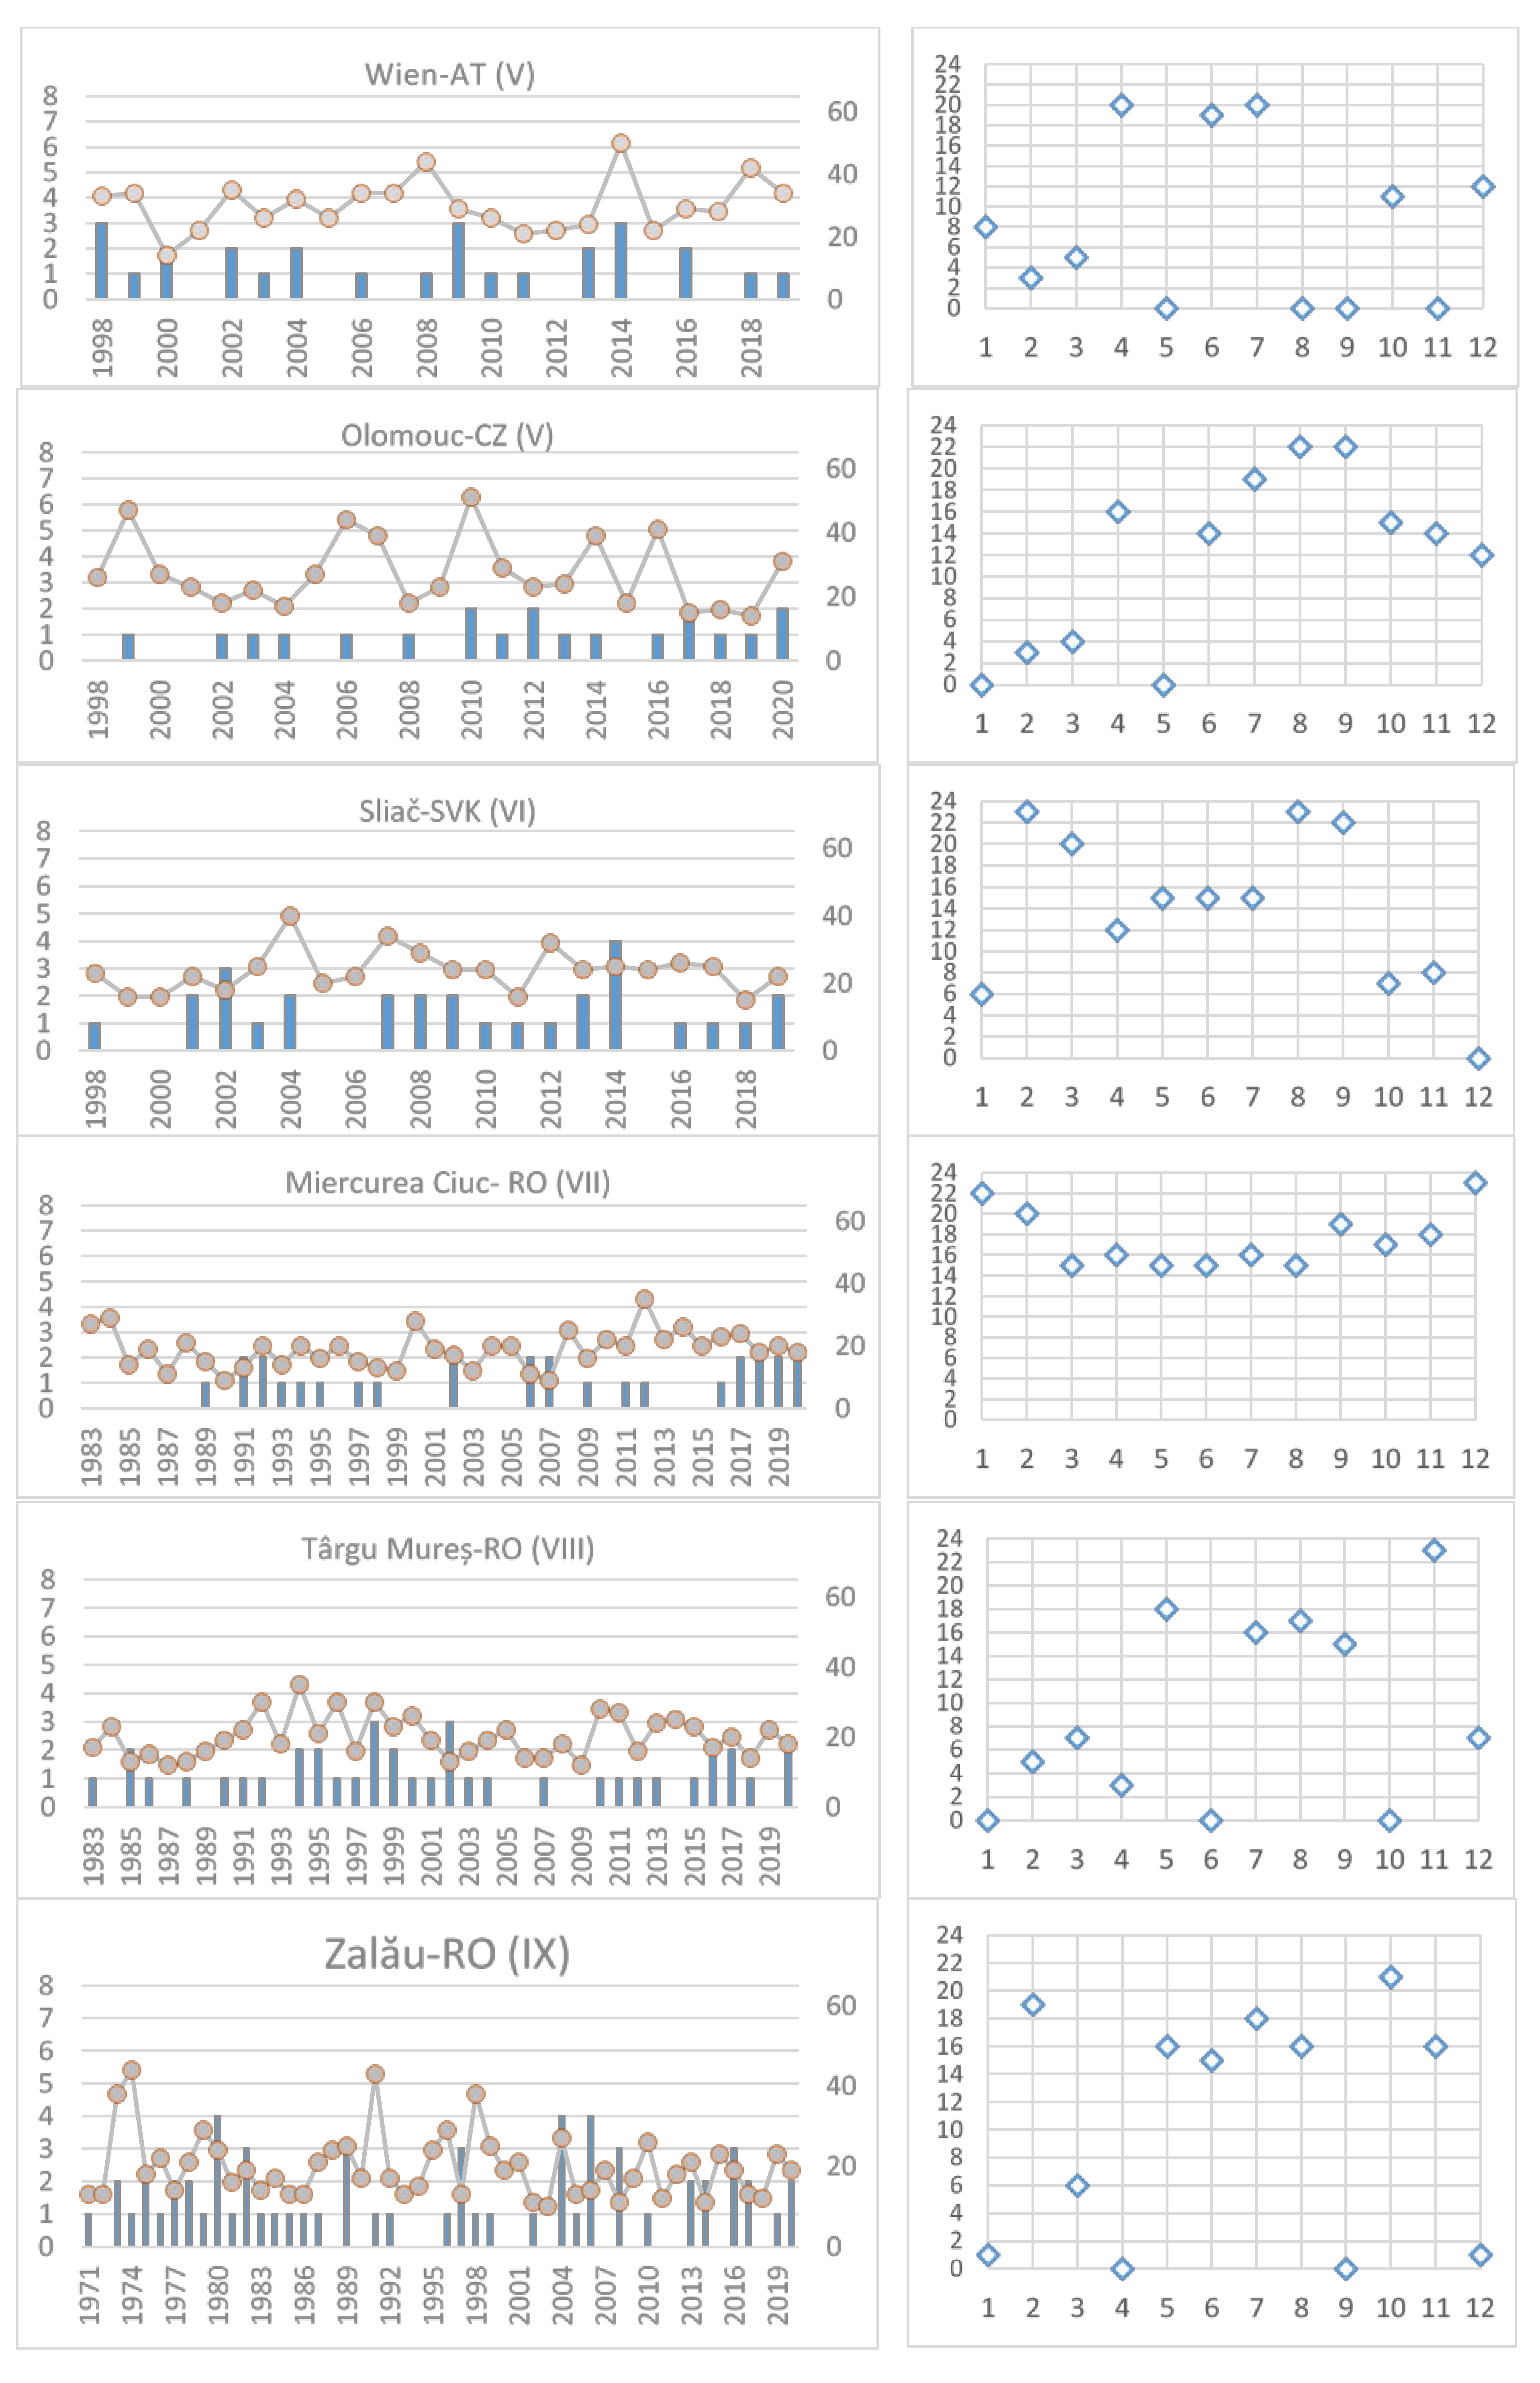
5.2. Some Indices for Selected Stations
6. Conclusions
Author Contributions
Funding
Institutional Review Board Statement
Informed Consent Statement
Data Availability Statement
Acknowledgments
Conflicts of Interest
References
- Handmer, J.; Honda, Y.; Kundzewicz, Z.W.; Arnell, N.; Benito, G.; Hatfield, J.; Mohamed, I.F.; Peduzzi, P.; Wu, S.; Sherstyukov, B.; et al. Changes in Impacts of Climate Extremes: Human Systems and Ecosystems. In Managing the Risks of Extreme Events and Disasters to Advance Climate Change Adaptation; A Special Report of Working Groups I and II of the Intergovernmental Panel on Climate Change (IPCC); Field, C.B., Barros, V., Stocker, T.F., Qin, D., Dokken, D.J., Ebi, K.L., Mastrandrea, M.D., Mach, K.J., Plattner, G.-K., Allen, S.K., et al., Eds.; Cambridge University Press: Cambridge, UK; New York, NY, USA, 2012; pp. 231–290. [Google Scholar]
- IPCC. Summary for PolicymakersClimate Change 2013: The Physical Science Basis Contribution of Working Group I to the Fifth Assessment Report of the Intergovernmental Panel on Climate Change; Cambridge University Press: Cambridge, UK; New York, NY, USA, 2013. [Google Scholar]
- Westra, S.; Alexander, L.V.; Zwiers, F.W. Global increasing trends in annual maximum daily precipitation. J. Clim. 2013, 26, 3904–3918. [Google Scholar] [CrossRef] [Green Version]
- Allen, M.; Ingram, W. Constraints on future changes in climate and the hydrologic cycle. Nature 2002, 419, 224–232. [Google Scholar] [CrossRef] [PubMed]
- Alexander, L.V.; Zhang, X.; Peterson, T.; Caesar, J.; Gleason, B.; Klein Tank, A.; Haylock, M.; Collins, D.; Trewin, B.; Rahimzadeh, F.; et al. Global observed changes in daily climate extremes of temperature and precipitation. J. Geophys. Res. 2006, 111, 109. [Google Scholar] [CrossRef] [Green Version]
- Willett, K.; Jones, P.; Gillett, N.; Thorne, P. Recent changes in surface humidity: Development of the HadCRUH dataset. J. Clim. 2008, 21, 5364–5383. [Google Scholar] [CrossRef]
- Klein Tank, A.M.G.; Konnen, G. Trends in indices of daily temperature and precipitation extremes in Europe, 1946–1999. J. Clim. 2003, 16, 3665–3680. [Google Scholar] [CrossRef]
- Moberg, A.; Jones, P.; Lister, D.; Walther, A.; Brunet, M.; Jacobeit, J.; Alexander, L.; Della-Marta, P.; Luterbacher, J.; Yiou, P.; et al. Indices for daily temperature and precipitation extremes in Europe analyzed for the period 1901–2000. J. Geophys. Res. 2006, 111, D22. [Google Scholar] [CrossRef] [Green Version]
- Zolina, O.; Simmer, C.; Belyaev, K.; Kapala, A.; Gulev, S. Improving estimates of heavy and extreme precipitation using daily records from European rain gauges. J. Hydrometeorol. 2009, 10, 701–716. [Google Scholar] [CrossRef]
- Groisman, P.; Knight, R.; Easterling, D.; Karl, T.; Hegerl, G.; Razuvaev, V. Trends in intense precipitation in the climate record. J. Clim. 2005, 18, 1326–1350. [Google Scholar] [CrossRef]
- Fowler, H.; Kilsby, C. A regional frequency analysis of United Kingdom extreme rainfall from 1961 to 2000. Int. J. Climatol. 2003, 23, 1313–1334. [Google Scholar] [CrossRef]
- Pujol, N.; Neppel, L.; Sabatier, R. Regional tests for trend detection in maximum precipitation series in the French Mediterranean region. Hydrol. Sci. J. 2007, 52, 956–973. [Google Scholar] [CrossRef]
- Kysely, J. Trends in heavy precipitation in the Czech Republic over 1961–2005. Int. J. Climatol. 2009, 29, 1745–1758. [Google Scholar] [CrossRef]
- Łupikasza, E.; Hansel, S.; Matschullat, J. Regi nal and seasonal variability of extreme precipitation trends in southern Poland and central-eastern Germany 1951–2006. Int. J. Climatol. 2010, 31, 2249–2271. [Google Scholar] [CrossRef]
- Van den Besselaar, E.J.M.; Klein Tank, A.M.G.; Buishand, T.A. Trends in European precipitation extremes over 1951–2010. Int. J. Climatol. 2013, 33, 2682–2689. [Google Scholar] [CrossRef]
- Klein Tank, A.M.G.; Wijngaard, J.; Konnen, G.; Bohm, R.; Demarree, G.; Gocheva, A.; Mileta, M.; Pashiardis, S.; Hejkrlik, L.; Kern-Hansen, C.; et al. Daily dataset of 20th-century surface air temperature and precipitation series for the European Climate Assessment. Int. J. Climatol. 2002, 22, 1441–1453. [Google Scholar] [CrossRef]
- Klok, E.; Klein Tank, A.M.G. Updated and extended European dataset of daily climate observations. Int. J. Climatol. 2008, 29, 1182–1191. [Google Scholar] [CrossRef]
- Spinoni, J.; Szalai, S.; Szentimrey, T.; Lakatos, M.; Bihari, Z.; Nagy, A.; Németh, Á.; Kovács, T.; Mihic, D.; Dacic, M.; et al. Climate of the Carpathian Region in the period 1961–2010: Climatologies and trends of 10 variables. Int. J. Climatol. 2015, 35, 1322–1341. [Google Scholar] [CrossRef] [Green Version]
- Cheval, S.; Busuioc, A.; Dumitrescu, A.; Birsan, M.V. Spatiotemporal variability of meteorological drought in Romania using the standardized precipitation index (SPI). Clim. Res. 2014, 60, 235–248. [Google Scholar] [CrossRef]
- Szentimrey, T. Multiple Analysis of Series for Homogenization (MASH). In Proceedings of the Second Seminar for Homogenization of Surface Climatological Data, Budapest, Hungary, 9–13 November 1999; pp. 27–46. [Google Scholar]
- Szentimrey, T. Development of MASH homogenization procedure for daily data. In Proceedings of the Fifth Seminar for Homogenization and Quality Control in Climatological Databases, Budapest, Hungary, 29 May–2 June 2006; pp. 123–130. [Google Scholar]
- Szentimrey, T.; Bihari, Z. Mathematical background of the spatial interpolation methods and the software MISH (Meteorological Interpolation based on Surface Homogenized Data Basis). In Proceedings of the Conference on Spatial Interpolation in Climatology and Meteorology, Budapest, Hungary, 25–29 October 2004; pp. 17–27. [Google Scholar]
- Lakatos, M.; Szentimrey, T.; Bihari, Z.; Szalai, S. Investigation of climate extremes in the Carpathian region on harmonized data. In Proceedings of the International Scientific Conference on Environmental Changes and Adaptation Strategies, Skalica, Slovakia, 9–11 September 2013; Available online: http://www.cbks.cz/SbornikSkalice2013/pdf/Lakatos.pdf (accessed on 5 May 2021).
- Kocsis, K. National Atlas of Hungary: Natural Environment; Hungarian Academy of Sciences, Research Centre for Astronomy and Earth Sciences: Budapest, Hungary, 2018. [Google Scholar]
- Gajić-Čapka, M.; Cindrić, K. Secular trends in indices of precipitation extremes in Croatia, 1901–2008. Geofizika 2011, 28, 293–312. [Google Scholar]
- Gajić-Čapka, M.; Cindrić, K.; Pasarić, Z. Trends in precipitation indices in Croatia, 1961–2010. Theor. Appl. Climatol. 2015, 121, 167–177. [Google Scholar] [CrossRef]
- Gajić-Čapka, M. Maximum Precipitation for Different Short-Term Intervals. Theor. Appl. Climatol. 1990, 41, 33–39. [Google Scholar] [CrossRef]
- Fowler, H.J.; Lenderink, G.; Prein, A.F.; Westra, S.; Allan, R.P.; Ban, N.; Barbero, R.; Berg, P.; Blenkinsop, S.; Do, H.X.; et al. Anthropogenic intensification of short-duration rainfall extremes. Nat. Rev. Earth Environ. 2021, 2, 107–122. [Google Scholar] [CrossRef]
- Hanel, M.; Pavlásková, A.; Kyselý, J. Trends in characteristics of sub-daily heavy precipitation and rainfall erosivity in the Czech Republic. Int. J. Climatol. 2016, 36, 1833–1845. [Google Scholar] [CrossRef]
- Ban, N.; Scmidli, J.; Schär, C. Evaluation of the convection-resolving regional climate modeling approach in decade long simulations. J. Geophys. Res. Atmos. 2014, 119, 7889–7907. [Google Scholar] [CrossRef]
- Lakatos, M.; Izsák, B.; Szentes, O.; Hoffmann, L.; Kircsi, A.; Bihari, Z. Return values of 60-minute extreme rainfall for Hungary. Időjárás 2020, 124, 143–156. [Google Scholar] [CrossRef]
- Lakatos, M.; Hoffmann, L. Increasing trend in short term precipitation and higher return levels due to climate change. In Proceedings of the National Conference on Managing the Municipal Rainwater; Bíró, T., Ed.; Dialóg Campus: Budapest, Hungary, 2019; pp. 8–16. ISBN 978-615-5845-22-2. (In Hungarian) [Google Scholar]
- Cindrić, K.; Nimac, I.; Gajić-Čapka, M.; Rubinić, J. Temporal changes of short-term heavy precipitation in the period 1955-2010 in Split and Varaždin. Hrvatske Vode 2014, 89, 239–250. (In Croatian) [Google Scholar]
- Gajić-Čapka, M.; Nevenka Ožanić, N.; Nino Krvavica, N. Estimation of maximum short-term precipitation over the Rijeka region. Theor. Appl. Climatol. Electr. J. Facul. Civil Engine. Osijek-e-GFOS 2014, 5, 49–59. [Google Scholar] [CrossRef]
- Gajić-Čapka, M.; Horvat, M. Regional differences in heavy short-term precipitation in Istria. Hrvatske Vode 2009, 68, 87–101. (In Croatian) [Google Scholar]
- Beranová, R.; Kyselý, J.; Hanel, M. Characteristics of sub-daily precipitation extremes in observed data and regional climate model simulations. Theor. Appl. Climatol. 2018, 132, 515–527. [Google Scholar] [CrossRef]
- Hardwick Jones, R.; Westra, S.; Sharma, A. Observed relationships between extreme sub-daily precipitation, surface temperature, and relative humidity. Geophys. Res. Lett. 2010, 37, L22805. [Google Scholar] [CrossRef] [Green Version]
- Lenderink, G.; van Meijgaard, E. Increase in hourly precipitation extremes beyond expectations from temperature changes. Nat. Geosci. 2008, 1, 511–514. [Google Scholar] [CrossRef]
- Eden, J.M.; Kew, S.F.; Bellprat, O.; Lenderink, G.; Manola, I.; Omrani, H.; Oldenborgh, G.J. Extreme precipitation in the Netherlands: An event attribution case study. Weather Clim. Extrem. 2018, 21, 90–101. [Google Scholar] [CrossRef]
- Lewis, E.; Fowler, H.J.; Alexander, L.; Dunn, R.; McClean, F.; Barbero, R.; Guerreiro, S.; Li, X.-F.; Blenkinsop, S. GSDR: A global sub-daily rainfall dataset. J. Clim. 2019, 32, 4715–4729. [Google Scholar] [CrossRef] [Green Version]
- Blenkinsop, S.; Fowler, H.J.; Barbero, R.; Chan, S.C.; Guerreiro, S.B.; Kendon, E.; Lenderink, G.; Lewis, E.; Li, X.-F.; Westra, S.; et al. The INTENSE project: Using observations and models to understand the past, present and future of subdaily rainfall extremes. Adv. Sci. Res. 2018, 15, 117–126. [Google Scholar] [CrossRef] [Green Version]
- Ceglar, A.; Croitoru, A.-E.; Cuxart, J.; Djurdjevic, V.; Güttler, I.; Ivančan-Picek, B.; Jug, D.; Lakatos, M.; Weidinger, T. PannEx: The Pannonian Basin Experiment. Clim. Serv. 2018, 11, 78–85. [Google Scholar] [CrossRef]
- PannEx Working Group. PannEx White Book: A GEWEX Regional Hydroclimate Project (RHP) over the Pannonian Basin; WCRP Report 3/2019; World Climate Research Programme (WCRP): Geneva, Switzerland, 2019; 108p. [Google Scholar]
- Haas, J.; Nagymarosy, A.; Hámor, G. Genesis and Evolution of the Pannonian Basin. In Geology of Hungary. Regional Geology Reviews; Haas, J., Ed.; Springer: Berlin/Heidelberg, Germany, 2013; ISBN 978-3-642-21910-8. [Google Scholar]
- Matenco, L.; Radivojević, D. On the formation and evolution of the Pannonian Basin: Constraints derived from the structure of the junction area between the Carpathians and Dinarides. Tectonics 2012, 31, TC6007. [Google Scholar] [CrossRef]
- Folland, C.K.; Knight, J.; Linderholm, H.W.; Fereday, D.; Ineson, S.; Hurrell, J.W. The Summer North Atlantic Oscillation: Past, Present, and Future. J. Clim. 2009, 22, 1082–1103. [Google Scholar] [CrossRef]
- Kocsis, K. The Geography of the Carpathian Basin; Lucius Kiadó: Budapest, Hungary, 1999. (In Hungarian) [Google Scholar]
- Lewis, E.A.; Pritchard, D.; Villalobos Herrera, R.; Maclean, F.; Blenkinsop, S.; Guerreiro, S.; Schneider, U.; Becker, A.; Finger, P.; Meyer-Christoffer, A.; et al. Quality control of a global hourly rainfall dataset. Environ. Model. Softw. 2021. in revision. [Google Scholar]
- Lewis, E.; Guerreiro, S.; Blenkinsop, S.; Fowler, H.J. Quality Control of a Global Sub-daily Precipitation Dataset and Derived Extreme Precipitation Indices. Geophys. Res. Abst. 2019, 21, EGU2019-16634. [Google Scholar]
- Zhang, X.; Alexander, L.; Hegerl, G.C.; Jones, P.; Klein Tank, A.; Peterson, T.C.; Trewin, B.; Zwiers, F.W. Indices for monitoring changes in extremes based on daily temperature and precipitation data. WIREs Clim. Chang. 2011, 2, 851–870. [Google Scholar] [CrossRef]
- Donat, M.G.; Alexander, V.; Yang, H.; Durre, I.; Vose, R.; Caesar, J. Global land-based datasets for monitoring climatic extremes. Bull. Am. Meteorol. Soc. 2013, 96, 997–1006. [Google Scholar] [CrossRef] [Green Version]
- Hipel, K.W.; McLeod, A.I. Time Series Modelling of Water Resources and Environmental Systems. Electronic Reprint of Our Book Originally Published in 1994. 2005. Available online: http://www.stats.uwo.ca/faculty/aim/1994Book (accessed on 5 May 2021).
- R Core Team. R: A Language and Environment for Statistical Computing; R Foundation for Statistical Computing: Vienna, Austria, 2012; ISBN 3-900051-07-0. [Google Scholar]
- Messmer, M.; Gómez-Navarro, J.J.; Raible, C.C. Climatology of Vb cyclones, physical mechanisms and their impact on extreme precipitation over Central Europe. Earth Syst. Dyn. 2015, 6, 541–553. [Google Scholar] [CrossRef] [Green Version]
- Bladé, I.; Liebmann, B.; Fortuny, D.; Oldenbourg, G.J. Observed and simulated impacts of the summer NAO in Europe: Implications for projected drying in the Mediterranean region. Clim. Dyn. 2012, 39, 709–727. [Google Scholar] [CrossRef]
- Frei, C.; Davis, H.C.; Gurtz, J. Climate dynamics and extreme precipitation and flood events in Central Europe. Integr. Assess. 2000, 1, 281–300. [Google Scholar] [CrossRef]


| Indices Group | Abbreviation | Description | Illustrated on Maps/Graphs |
|---|---|---|---|
| Maxima | Rx1hr | Simple maxima of 1-h sum | annual mean and the maximum (maps) |
| Maxima | Rx3hr | Simple maxima of 3-h sum | annual mean and the maximum (maps) |
| Maxima | Rx6hr | Simple maxima of 6-h sum | annual mean and the maximum (maps) |
| Frequency/Threshold | R3hr20 mm | Count of 3-h periods greater than a 20 mm threshold | annual count (graphs) |
| Duration | MxLWS | Maximum length of wet spell. (i.e., consecutive wet hours). Wet hours are defined as ≥0.1 mm) | annual (graphs) |
| Diurnal Cycle | MoWH | Timing of wettest hour of each wet day. Calculated on a month-wise basis as the mode of the timing (hour of day) of the wettest hour on each wet day, where wet days are defined as ≥1 mm | monthly (graphs) |
| General | SPII1hr | Mean precipitation in wet hours | seasonal mean and change (maps) |
Publisher’s Note: MDPI stays neutral with regard to jurisdictional claims in published maps and institutional affiliations. |
© 2021 by the authors. Licensee MDPI, Basel, Switzerland. This article is an open access article distributed under the terms and conditions of the Creative Commons Attribution (CC BY) license (https://creativecommons.org/licenses/by/4.0/).
Share and Cite
Lakatos, M.; Szentes, O.; Cindrić Kalin, K.; Nimac, I.; Kozjek, K.; Cheval, S.; Dumitrescu, A.; Irașoc, A.; Stepanek, P.; Farda, A.; et al. Analysis of Sub-Daily Precipitation for the PannEx Region. Atmosphere 2021, 12, 838. https://doi.org/10.3390/atmos12070838
Lakatos M, Szentes O, Cindrić Kalin K, Nimac I, Kozjek K, Cheval S, Dumitrescu A, Irașoc A, Stepanek P, Farda A, et al. Analysis of Sub-Daily Precipitation for the PannEx Region. Atmosphere. 2021; 12(7):838. https://doi.org/10.3390/atmos12070838
Chicago/Turabian StyleLakatos, Monika, Olivér Szentes, Ksenija Cindrić Kalin, Irena Nimac, Katja Kozjek, Sorin Cheval, Alexandru Dumitrescu, Adrian Irașoc, Petr Stepanek, Aleš Farda, and et al. 2021. "Analysis of Sub-Daily Precipitation for the PannEx Region" Atmosphere 12, no. 7: 838. https://doi.org/10.3390/atmos12070838
APA StyleLakatos, M., Szentes, O., Cindrić Kalin, K., Nimac, I., Kozjek, K., Cheval, S., Dumitrescu, A., Irașoc, A., Stepanek, P., Farda, A., Kajaba, P., Mikulová, K., Mihic, D., Petrovic, P., Chimani, B., & Pritchard, D. (2021). Analysis of Sub-Daily Precipitation for the PannEx Region. Atmosphere, 12(7), 838. https://doi.org/10.3390/atmos12070838